 Open Access Article
Photoactivation of triosmium dodecacarbonyl at 400 nm probed with time-resolved X-ray liquidography†
Hosung
Ki
ab,
Tae Wu
Kim
 c,
Jiwon
Moon
d,
Jungmin
Kim
ab,
Yunbeom
Lee
ab,
Jun
Heo
ab,
Kyung Hwan
Kim
e,
Qingyu
Kong
f,
Dmitry
Khakhulin
g,
Gemma
Newby
h,
Joonghan
Kim
 d,
Jeongho
Kim
 i,
Michael
Wulff
h and
Hyotcherl
Ihee
 *ab
*ab
aCenter for Advanced Reaction Dynamics, Institute for Basic Science (IBS), Daejeon 34141, Republic of Korea. E-mail: hyotcherl.ihee@kaist.ac.kr
bDepartment of Chemistry and KI for the BioCentury, Korea Advanced Institute of Science and Technology (KAIST), Daejeon 34141, Republic of Korea
cDepartment of Chemistry, Mokpo National University, Muan-gun, Jeollanam-do 58554, Republic of Korea
dDepartment of Chemistry, The Catholic University of Korea, Bucheon 14662, Republic of Korea
eDepartment of Chemistry, Pohang University of Science and Technology (POSTECH), Pohang 37673, Republic of Korea
fSynchrotron Soleil, L’Orme des Merisiers, Saint-Aubin, BP 48, 91192 Gif-sur-Yvette Cedex, France
gEuropean XFEL, Holzkoppel 4, 22869 Schenefeld, Germany
hEuropean Synchrotron Radiation Facility, BP 220, 38043 Grenoble Cedex, France
iDepartment of Chemistry, Inha University, Incheon 22212, Republic of Korea
First published on 8th June 2022
Abstract
The photoactivation mechanism of Os3(CO)12 at 400 nm is examined with time-resolved X-ray liquidography. The data reveal two pathways: the vibrational relaxation following an internal conversion to the electronic ground state and the ligand dissociation to form Os3(CO)11 with a ligand vacancy at the axial position.
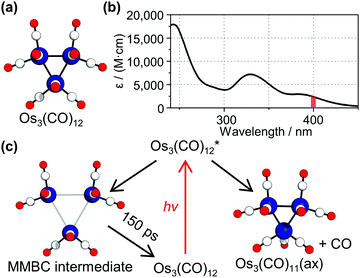
Triosmium dodecacarbonyl, Os3(CO)12, has been an archetypal model in metal carbonyl cluster chemistry. This molecule, shown in Fig. 1a, has attracted considerable attention for its chemical property: it is thermally stable owing to strong chemical bonds but becomes highly reactive when exposed to light.1–5 Employing the photochemical property, Os3(CO)12 has been utilized as an efficient photocatalyst for some reactions such as hydrosilylation or hydrogenation.6,7 To understand how and why Os3(CO)12 becomes reactive upon photoexcitation, photoreaction of Os3(CO)12 has been intensively investigated using spectroscopic tools.2,8–12 Especially, to understand the origin of the photochemical behavior of Os3(CO)12, efforts have been made to identify the reaction intermediates of Os3(CO)12. For example, a time-resolved infrared spectroscopy (TRIR) study of the complex revealed that a ligand elimination reaction occurs to produce Os3(CO)11 species by both 400 and 267 nm light, which excites the first- and the third-lowest electronic transition of the complex.12
According to the assignment of the TRIR study, two major species are involved in the photoreaction pathways of Os3(CO)12 at 400 nm, which corresponds to the lowest electronic transition of the complex (Fig. 1b).12 A notable point is that a short-lived intermediate with a lifetime of 150 ps was observed. The authors assigned the short-lived intermediate to a metal–metal bond cleavage intermediate (MMBC intermediate), which has two or three elongated Os–Os distances (about 4.4 Å, compared with the Os–Os distance in the parent Os3(CO)12 of about 2.8 Å).12,13 Here, we revisited the previous assignment of the photoreaction intermediates via a complementary tool, time-resolved X-ray liquidography (TRXL), which is also known as time-resolved X-ray solution scattering. TRXL has proven to be an excellent tool for identifying the molecular structure of transient species in solution.14–27 In the case of Os3(CO)12, the TRXL signal is sensitive to the metal–metal distances in the transient species, which are key structural parameters of the metal complex, in contrast to TRIR, which is sensitive to the chemical environment of the CO ligands. Accordingly, if the proposed MMBC intermediate is formed, such a change in the Os–Os distance should be evidently manifested in the measured TRXL signal.
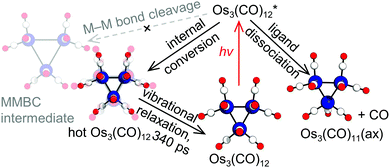
By applying TRXL, we identify two major pathways following the photoexcitation of Os3(CO)12: (1) photoinduced ligand dissociation that yields an axial-vacant photoproduct, and (2) vibrational relaxation that follows an internal conversion of photoexcited Os3(CO)12 to its electronic ground state. We note that the reaction mechanism suggested by the TRIR study12,13 is not supported by our TRXL data. Specifically, the TRXL data does not show any signature of the short-lived transient MMBC intermediate with elongated Os–Os distances.
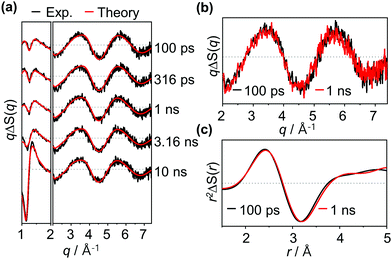
Experimental difference scattering curves measured with excitation at 400 nm are shown in Fig. 2a. The difference scattering curves have distinct oscillatory features, which indicate transient structural changes of the osmium cluster upon photoexcitation. These oscillatory features are visible even at the earliest time delay of the measurement, indicating that the primary photoreaction occurs much faster than the time resolution (100 ps) of our measurement. Here, it should be noted that only a minute change was observed in our TRXL data in the time range of 100 ps to 10 ns. Representatively, as shown in Fig. 2b, when the difference scattering curves at 100 ps and 1 ns time delays are compared, it can be confirmed that the two curves are almost identical. The minute change in the TRXL signal indicates that only a subtle change in the molecular structure occurs during this time range. To confirm this, we converted the data into difference radial distribution functions (RDFs) in real space by performing Fourier sine transformation. The comparison of the RDFs at 100 ps and 1 ns time delays again confirms that only a subtle structural change, rather than a significant change in Os–Os distances, occurs in this sub-nanosecond time region (Fig. 2c).
To extract quantitative, detailed information regarding the photoactivation pathways of Os3(CO)12, we applied singular value decomposition (SVD) analysis to the measured data. The resulting left- and right-singular vectors (lSVs and rSVs) are shown in Fig. S2 (ESI†) together with their singular values and autocorrelation values. Here, to focus on the kinetics related to the structural change of solute rather than the hydrodynamic response of solvent, only the high q region (q > 3.0 Å−1) where the contribution of the solvent response is negligible (Fig. S3, ESI†) is subjected to the SVD analysis. The result of the SVD analysis shows that there are two major signal components, indicating that two different species are involved in the reaction pathways. To extract their kinetics, the first two major rSVs were globally fitted as a sum of an exponential decay function sharing a common time constant and a constant. As a result, we obtained a single time constant of 340 ± 40 ps.
We examined whether these observations using TRXL are consistent with the kinetic model proposed in the TRIR study.12,13 In the proposed kinetic model, two different species including a short-lived intermediate and a long-lived intermediate are involved in the reaction pathway (see Fig. 1c). The long-lived intermediate, which is assigned as Os3(CO)11 species with a ligand vacancy at the axial position, Os3(CO)11(ax), exists at longer (about 1 ns) time delays.12,13 The short-lived intermediate, which is assigned as the MMBC intermediate, decays to the parent species, Os3(CO)12, with a lifetime of 150 ps.12,13 In terms of the number of species involved in the reaction (two species for both TRIR and TRXL) and the time constant (150 and 340 ps for TRIR and TRXL, respectively), the kinetic model proposed in the TRIR study is consistent with our observations.
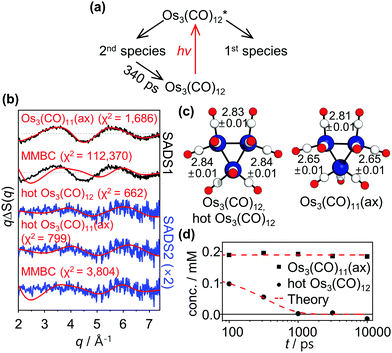
One of the distinct advantages of TRXL over other time-resolved techniques is that time-resolved X-ray scattering signals contain direct structural information of transient reaction intermediates. Especially, for metal complexes with multiple metal centers such as Os3(CO)12, TRXL can be used to precisely measure the metal–metal distances, which are key structural parameters of the metal complex.26,27 To fully utilize the advantage of TRXL, we extracted species-associated difference scattering curves (SADSs) from the measured TRXL data based on the kinetic model shown in Fig. 3a which follows those proposed in the TRIR study (Fig. 1c) except for the time constant. We determined the identity of the species by analyzing the SADSs and then performed further structural refinement to obtain the detailed structural parameters of the parent species, Os3(CO)12, and the reaction intermediates. The details of the structural analysis are described in ESI.† The best fits of the experimental difference scattering curves, ΔS(q, t)'s, obtained by linear combination fitting (LCF) are displayed in Fig. 2a. The best-fit curves were obtained by fitting ΔS(q, t) at each time delay as a linear combination of four components, two theoretical SADSs calculated from the refined structures and the two components from the hydrodynamic responses ((∂S/∂T)ρ, and (∂S/∂ρ)T)28,29 of bulk solvent. The comparison of the best-fit theoretical SADSs to the experimental SADSs is displayed in Fig. 3b. The structural parameters of the intermediates obtained from the structural refinement are shown in Fig. 3c and are compared with the theoretical structures optimized by DFT calculations in Table S1 in ESI.† The time-dependent concentrations of the two intermediates obtained from LCF are displayed in Fig. 3d. The details of LCF are described in the section “Structural refinement” in ESI.†
 | ||
| Fig. 3 (a) Kinetic model used for the principal-component analysis (PCA) of qΔS(q, t)'s. The kinetic model follows those proposed in the TRIR study (shown in Fig. 1c) except for the time constant. (b) Species-associated difference scattering curves (SADSs) obtained from the PCA. The experimental SADSs (black) are plotted together with their theoretical fits (red). The theoretical difference scattering curves corresponding to Os3(CO)11(ax) and vibrationally hot Os3(CO)12 (hot Os3(CO)12) give satisfactory fits to the 1st and 2nd SADSs (SADS1 and SADS2), respectively. The theoretical difference scattering curve corresponding to MMBC intermediate does not fit either of the two SADSs. Note that SADS2 is scaled up by a factor of 2 for better visualization of weak oscillatory features of the SADS. (c) Molecular structures of the two assigned intermediates, hot Os3(CO)12 and Os3(CO)11(ax), determined in this study. The Os–Os distances (in angstrom) of the intermediates retrieved from the structural refinement are shown together with the molecular structures. (d) Time-dependent changes in the concentrations of assigned intermediates. | ||
According to the structural analysis of the first SADS (1st SADS or SADS1), the long-lived intermediate (1st species in Fig. 3a) turned out to be Os3(CO)11(ax). As Fig. 3b shows, the theoretical SADS1 calculated for the reaction, Os3(CO)12 → Os3(CO)11(ax) + CO matches the experimental SADS1. The key structural feature of the Os3(CO)11(ax) is the symmetric shortening of two Os–Os bonds around an Os atom with the axial vacancy (see Fig. 3c). Since the Os atom that loses an axial CO ligand becomes electron-deficient, it would withdraw electrons from its neighboring Os atoms to relieve the electron deficiency, leading to the contraction of the two Os–Os bonds around it. Compared with the Os–Os bonds (2.84 Å length) in the parent Os3(CO)12, two Os–Os bonds in Os3(CO)11(ax) are shorter by 0.19 Å, whereas the other Os–Os bond stays nearly intact. The formation of the long-lived intermediate with an axial vacancy is in agreement with the results of the TRIR spectroscopic study12,13 and the IR spectroscopic study30 of photoinduced ligand dissociation of Os3(CO)12. The recovery of Os3(CO)11(ax) to Os3(CO)12 is not visible within the time range (t ≤ 10 ns) investigated in this work, as Fig. 3d shows, indicating that it takes much longer than 10 ns.
For the short-lived intermediate, however, the intermediate identified in this work has discrepancies with those reported in the TRIR study.12,13 Here we note again that only a subtle structural change occurs in the sub-nanosecond time region as the comparisons in Fig. 2b and c show. This observation is in stark contrast to the expectation based on the assignments from the TRIR study that an MMBC intermediate with a lifetime of 150 ps is formed. As mentioned in our motivation for this TRXL study, if the proposed MMBC intermediate is formed, such a substantial change in the Os–Os distance (from about 2.8 to 4.4 Å) would be manifested in the TRXL signal as a considerable change in its shape. To the contrary, such a change is not observed in our TRXL data, indicating that an intermediate with long metal–metal distances (4.4 Å) is not formed in detectable quantities. Considering the high sensitivity of TRXL to the changes in bond lengths between heavy atoms, we propose that the changes in the reported TRIR spectra should not be attributed to the formation of the MMBC intermediate with the elongated Os–Os bonds.
From the observed lifetime of hundreds of picoseconds and the subtle structural change, we considered vibrational cooling to be the most plausible candidate for the observed sub-nanosecond process. A time-resolved mid-IR(MIR)-pump-MIR-probe experiment reported that the vibrational relaxation of Os3(CO)12 shows a decay time constant in the range of a few hundred picoseconds in addition to two faster time constants.11 Considering this, we considered the vibrational cooling of two different species, Os3(CO)12 and Os3(CO)11(ax), for the candidates of the process observed in the sub-nanosecond time scale. We calculated the theoretical SADSs for the vibrational relaxation process of Os3(CO)12 and Os3(CO)11(ax) and compared them to the experimental SADS for the short-lived intermediate (2nd SADS or SADS2) (Fig. 3b). The comparison shows that the vibrational cooling of Os3(CO)12 best fits the experimental SADS2. Thus, we assign the short-lived intermediate to the vibrationally excited Os3(CO)12, which must have been formed via internal conversion from the photoexcited state to the ground state (Fig. 4). According to our kinetic analysis, the vibrationally excited Os3(CO)12 shows an exponential decay of 340 ps time constant, giving the rate of vibrational cooling.
In conclusion, the photoreaction pathways of Os3(CO)12 excited at 400 nm were identified via TRXL. The reaction pathways determined with TRXL showed a considerable discrepancy with those proposed based on TRIR.12,13 Specifically, the TRXL signal, which is highly sensitive to the Os–Os distances, directly shows that the previous assignment of the short-lived intermediate to the MMBC intermediate from the TRIR study is not supported. We emphasize here that the TRXL signal is capable of distinguishing vibrationally excited parent molecules and the transiently formed MMBC intermediate, while such discrimination has been difficult when relying solely on the TRIR signal. Considering this, our work demonstrates that TRXL provides decisive structural information complementary to TRIR when examining the photoreaction pathways of organometallic complexes, especially those containing multiple metal atoms.26 Considering that the generation of the short-lived MMBC intermediate suggested from the TRIR studies has been proposed as a common pathway in the photoreaction of several metal carbonyl dimers and clusters,13 our work shows that these assignments of the MMBC intermediate might need to be revalidated using experimental means that are directly sensitive to the molecular structure,31,32 such as TRXL.
This work was supported by the Institute for Basic Science (IBS-R033). We acknowledge the European Synchrotron Radiation Facility for the provision of synchrotron radiation facilities. The authors appreciate Junbeom Jo and Sungjun Park for their assistance in performing the TRXL experiment. We thank Doo-Sik Ahn for the insightful discussion.
Conflicts of interest
There are no conflicts to declare.Notes and references
- C. W. Bradford and R. S. Nyholm, ChemComm, 1967, 384–385 RSC.
- D. R. Tyler, M. Altobelli and H. B. Gray, J. Am. Chem. Soc., 1980, 102, 3022–3024 CrossRef CAS.
- M. R. Burke, J. Takats, F. W. Grevels and J. G. A. Reuvers, J. Am. Chem. Soc., 1983, 105, 4092–4093 CrossRef CAS.
- M. R. Burke and J. Takats, J. Organomet. Chem., 1986, 302, C25–C29 CrossRef CAS.
- M. R. Burke, Ph.D. Thesis, University of Alberta, 1987.
- R. G. Austin, R. S. Paonessa, P. J. Giordano and M. S. Wrighton, in Inorganic and Organometallic Photochemistry, American Chemical Society, Washington, 1978, pp. 189–214 DOI:10.1021/ba-1978-0168.ch012.
- R. L. Yates, J. Catal., 1982, 78, 111–115 CrossRef CAS.
- P. C. Ford, J. Organomet. Chem., 1990, 383, 339–356 CrossRef CAS.
- N. E. Leadbeater, J. Lewis, P. R. Raithby and G. P. Ward, Eur. J. Inorg. Chem., 1998, 1479–1483 CrossRef CAS.
- N. E. Leadbeater, J. Organomet. Chem., 1999, 573, 211–216 CrossRef CAS.
- S. X. Yan, M. T. Seidel, Z. Y. Zhang, W. K. Leong and H. S. Tan, J. Chem. Phys., 2011, 135, 024501 CrossRef PubMed.
- J. P. Lomont, A. J. Shearer, S. C. Nguyen and C. B. Harris, Organometallics, 2013, 32, 2178–2186 CrossRef CAS.
- J. P. Lomont and C. B. Harris, Inorg. Chim. Acta, 2015, 424, 38–50 CrossRef CAS.
- H. Ihee, Acc. Chem. Res., 2009, 42, 356–366 CrossRef CAS PubMed.
- T. K. Kim, J. H. Lee, M. Wulff, Q. Kong and H. Ihee, Chem. Phys. Chem., 2009, 10, 2915 CrossRef CAS.
- K. Haldrup, T. Harlang, M. Christensen, A. Dohn, T. B. van Driel, K. S. Kjaer, N. Harrit, J. Vibenholt, L. Guerin, M. Wulff and M. M. Nielsen, Inorg. Chem., 2011, 50, 9329–9336 CrossRef CAS PubMed.
- K. H. Kim, J. G. Kim, S. Nozawa, T. Sato, K. Y. Oang, T. W. Kim, H. Ki, J. Jo, S. Park, C. Song, T. Sato, K. Ogawa, T. Togashi, K. Tono, M. Yabashi, T. Ishikawa, J. Kim, R. Ryoo, J. Kim, H. Ihee and S. Adachi, Nature, 2015, 518, 385–389 CrossRef CAS PubMed.
- D. Leshchev, T. C. B. Harlang, L. A. Fredin, D. Khakhulin, Y. Liu, E. Biasin, M. G. Laursen, G. E. Newby, K. Haldrup, M. M. Nielsen, K. Wärnmark, V. Sundström, P. Persson, K. S. Kjær and M. Wulff, Chem. Sci., 2018, 9, 405–414 RSC.
- D. Leshchev, D. Khakhulin, G. Newby, H. Ki, H. Ihee and M. Wulff, J. Chem. Phys., 2019, 151, 054310 CrossRef.
- J. G. Kim, S. Nozawa, H. Kim, E. H. Choi, T. Sato, T. W. Kim, K. H. Kim, H. Ki, J. Kim, M. Choi, Y. Lee, J. Heo, K. Y. Oang, K. Ichiyanagi, R. Fukaya, J. H. Lee, J. Park, I. Eom, S. H. Chun, S. Kim, M. Kim, T. Katayama, T. Togashi, S. Owada, M. Yabashi, S. J. Lee, S. Lee, C. W. Ahn, D.-S. Ahn, J. Moon, S. Choi, J. Kim, T. Joo, J. Kim, S. Adachi and H. Ihee, Nature, 2020, 582, 520–524 CrossRef CAS PubMed.
- E. Biasin, Z. W. Fox, A. Andersen, K. Ledbetter, K. S. Kjær, R. Alonso-Mori, J. M. Carlstad, M. Chollet, J. D. Gaynor, J. M. Glownia, K. Hong, T. Kroll, J. H. Lee, C. Liekhus-Schmaltz, M. Reinhard, D. Sokaras, Y. Zhang, G. Doumy, A. M. March, S. H. Southworth, S. Mukamel, K. J. Gaffney, R. W. Schoenlein, N. Govind, A. A. Cordones and M. Khalil, Nat. Chem., 2021, 13, 343–349 CrossRef CAS PubMed.
- E. H. Choi, J. G. Kim, J. Kim, H. Ki, Y. Lee, S. Lee, K. Yoon, J. Kim, J. Kim and H. Ihee, Nat. Commun., 2021, 12, 4732 CrossRef CAS PubMed.
- Y. Lee, J. G. Kim, S. J. Lee, S. Muniyappan, T. W. Kim, H. Ki, H. Kim, J. Jo, S. R. Yun, H. Lee, K. W. Lee, S. O. Kim, M. Cammarata and H. Ihee, Nat. Commun., 2021, 12, 3677 CrossRef CAS PubMed.
- K. Haldrup, G. Levi, E. Biasin, P. Vester, M. G. Laursen, F. Beyer, K. S. Kjær, T. Brandt van Driel, T. Harlang, A. O. Dohn, R. J. Hartsock, S. Nelson, J. M. Glownia, H. T. Lemke, M. Christensen, K. J. Gaffney, N. E. Henriksen, K. B. Møller and M. M. Nielsen, Phys. Rev. Lett., 2019, 122, 063001 CrossRef CAS PubMed.
- H. Ki, S. Choi, J. Kim, E. H. Choi, S. Lee, Y. Lee, K. Yoon, C. W. Ahn, D. S. Ahn, J. H. Lee, J. Park, I. Eom, M. Kim, S. H. Chun, J. Kim, H. Ihee and J. Kim, J. Am. Chem. Soc., 2021, 143, 14261–14273 CrossRef CAS PubMed.
- Q. Kong, J. H. Lee, A. Plech, M. Wulff, H. Ihee and M. H. J. Koch, Angew. Chem., Int. Ed., 2008, 47, 5550–5553 CrossRef CAS PubMed.
- Q. Kong, J. H. Lee, K. H. Kim, J. Kim, M. Wulff, H. Ihee and M. H. J. Koch, J. Am. Chem. Soc., 2010, 132, 2600–2607 CrossRef CAS PubMed.
- K. S. Kjær, T. B. van Driel, J. Kehres, K. Haldrup, D. Khakhulin, K. Bechgaard, M. Cammarata, M. Wulff, T. J. Sørensen and M. M. Nielsen, Phys. Chem. Chem. Phys., 2013, 15, 15003–15016 RSC.
- M. Cammarata, M. Lorenc, T. K. Kim, J. H. Lee, Q. Y. Kong, E. Pontecorvo, M. Lo Russo, G. Schiro, A. Cupane, M. Wulff and H. Ihee, J. Chem. Phys., 2006, 124, 124504 CrossRef CAS PubMed.
- J. G. Bentsen and M. S. Wrighton, J. Am. Chem. Soc., 1987, 109, 4518–4530 CrossRef CAS.
- J. Yang, X. L. Zhu, T. J. A. Wolf, Z. Li, J. P. F. Nunes, R. Coffee, J. P. Cryan, M. Guhr, K. Hegazy, T. F. Heinz, K. Jobe, R. K. Li, X. Z. Shen, T. Veccione, S. Weathersby, K. J. Wilkin, C. Yoneda, Q. Zheng, T. J. Martinez, M. Centurion and X. J. Wang, Science, 2018, 361, 64–67 CrossRef CAS PubMed.
- M. Centurion, T. J. A. Wolf and J. Yang, Annu. Rev. Phys. Chem., 2022, 73, 21–42 CrossRef PubMed.
Footnote |
| † Electronic supplementary information (ESI) available: Supplementary Methods, Table, Figures, and References. See DOI: https://doi.org/10.1039/d2cc02438a |
| This journal is © The Royal Society of Chemistry 2022 |


