
 Open Access Article
 This Open Access Article is licensed under a Creative Commons Attribution-Non Commercial 3.0 Unported Licence
Semiconducting silicon–phosphorus frameworks for caging exotic polycations†
Philip
Yox
ab,
Andrew P.
Porter
a,
Rick W.
Dorn
ab,
Victoria
Kyveryga
a,
Aaron J.
Rossini
 ab and
Kirill
Kovnir
*ab
ab and
Kirill
Kovnir
*ab
aDepartment of Chemistry, Iowa State University, Ames, IA 50011, USA. E-mail: kovnir@iastate.edu
bAmes Laboratory, U.S. Department of Energy, Ames, IA 50011, USA
First published on 3rd June 2022
Abstract
A series of novel semiconductors AAe6Si12P20X (A = Na, K, Rb, Cs; Ae = Sr, Ba; X = Cl, Br, I) is reported. Their crystal structures feature a tetrahedral Si–P framework with large zeolite-like pores hosting two types of cations, monoatomic A+ and unprecedented octahedral X@Ae611+. Mixing of the A and Ba cations was detected by single crystal X-ray diffraction and confirmed by multinuclear solid state NMR. The reported compounds are highly stable semiconductors with a bandgap range from 1.4 to 2.0 eV.
Semiconductors are of vital importance in modern society. Due to their many applications, the synthesis of novel semiconducting phases with specific properties is a commendable goal. However, rational design is challenging, and each application specifies additional requirements for the material. For example, photovoltaics require the band gap of the semiconductor to be between 1 and 2 eV to maximize absorption of the visible spectra.1,2 Photocatalysts additionally require proper alignment of the valence and conduction bands based on the redox potential of the targeted reaction.3 For hard radiation detection, semiconductors must have a suitable band gap (1.5 to 2.4 eV) as well as a high crystal density.4 For nonlinear optical materials, the compound must have a noncentrosymmetric structure, suitable band gap, and high laser damage threshold.5,6 A common requirement for almost all applications is stability in a number of conditions (ambient conditions, pressure, humidity, radiation, temperature, etc.). In terms of semiconductors based on earth-abundant silicon and phosphorus, binary SiP and SiP2 exhibited high carrier mobilities and high stability.7 Orthorhombic SiP (Cmc21) has a layered crystal structure with a band gap of around 1.7 eV.8 Bulk and monolayer SiP hold promise for photodetection as well as nonlinear optics.9,10 SiP2 has been predicted to be a stable 2D material.11 Ternary Si–P semiconductors, such as Ba2Si3P6, MgSiP2, ZnSiP2, CdSiP2, IrSi3P3, RuSi4P4, and BaSi7P10, exhibit a diverse variety of the silicon–phosphorus bonding motifs.12–17 The compositional space of phosphides is less explored than the oxide and chalcogenide phase spaces, thus making it an underexplored frontier for finding new semiconductors.
This work originated from pursuing development of the flux synthesis for Si- and P-containing materials. The requirements that must be considered for flux growth are extensive.18 The combination of Si and P presents additional challenges when considering the typical approaches used for the constituents individually. While flux growth of silicides can be performed using Al, Ga, and In fluxes,19 the potential formation of AlP, GaP, and InP is undesirable. Sn is a great choice of flux for P containing materials, but Si has a low solubility in Sn, making Sn an undesirable choice. A less traditional flux choice is the salt flux,20 which has been employed in silicates, germanates, and P-containing thiophosphates.21 Salt fluxes have been shown to promote the formation of highly complex crystal structures with multiple elements (quaternary and beyond).22 As a result of using salt flux, new salt inclusion semiconductors, AAe6Si12P20X (A = Na, K, Rb, Cs; Ae = Sr, Ba; X = Cl, Br, I) were synthesized.
Initially, a reaction at 950 °C intended for crystal growth of BaCuSi2P323 with excess P and excess CsBr/CsI mixture resulted in the formation of CsBa6Si12P20Br1–xIx. Large cuboidal single crystals with a deep red color were selected from the walls of the ampoule for single crystal X-ray diffraction (SXRD) (Fig. S1, ESI†). After the initial discovery, syntheses targeting the formation of AAe6Si12P20X were carried out in similar conditions. These compounds can be made directly from the combination of the AX salt, Ae metal, Si, and P in the stoichiometric ratios (Fig. S2, ESI†). Alternatively, crystals suitable for SXRD can be grown with the addition of excess salt (Table S1, ESI†). The phase pure material CsBa6Si12P20Cl is air-stable at room temperature on the order of weeks, water-stable, and stable up to 500 °C in air for at least 2 hours. CsBa6Si12P20X does not melt below 1100 °C as evidenced by differential scanning calorimetry (Fig. S8, ESI†). So far, the crystal structures of 11 isostructural compounds have been determined (Table S3, ESI†). AAe6Si12P20X compounds adopt a novel crystal structure type and exhibit exotic polycations [Ae6X]11+. Octahedral polycations such as Cs6F have been observed in [Cs6F][Cs3AgF][Ge14O32] as well as cesium halide uranyl silicates.24,25 However, the formal polycationic charge of Cs6F is +5, which is less than half of what is expected for Ba6Cl (+11). To our knowledge, there are no reports of a salt inclusion compound containing such a cationic fragment. Out of 11 synthesized isostructural compounds AAe6Si12P20X, we will focus on CsBa6Si12P20Cl which crystallizes in the space group Fm![[3 with combining macron]](https://www.rsc.org/images/entities/char_0033_0304.gif) m (No. 225) with a Wyckoff sequence of igfeba, which is a new structure type. The large charge of the [Ae6X]11+ polycation attests to the ability of silicon–phosphorus frameworks to accommodate charge. Silicon phosphides have been shown to accommodate charges from cations by adapting the bonding within the Si–P fragments. For instance, Si and P can form isolated SiP4 tetrahedra (as in Li14SiP6),26 corner-sharing tetrahedra (as in SiP2),27 and edge-sharing tetrahedra (as in Ba4Si3P8).28 In addition, Si–Si bonds can form to increase the magnitude of negative charge of the overall fragment or to balance the charge.23 Conversely, P–P bonds can be formed to reduce the negative charge of the fragment. P is typically known for its trigonal pyramidal geometry, but P is versatile and is capable of being undercoordinated. Undercoordinated P atoms represent a way of increasing the magnitude of negative charge. In CsBa6Si12P20Cl (Fig. 1A), due to the large charge of the [Ba6Cl] polycation, the Si–P framework contains corner sharing as well as edge sharing SiP4 tetrahedra with undercoordinated (2-coordinate) P atoms occupying the 48i site. The Si–P framework has a repeating fragment of six directionally oriented corner-sharing SiP4 tetrahedra (Fig. 1C and D). This fragment is connected to an identical fragment facing the opposite direction through edge-sharing tetrahedra. All Si atoms in the structure are four-coordinate, however, the connectivity of the Si–P fragments leaves large voids in the crystal structure. The first void is filled by Cs. Cs is coordinated by 12 phosphorus atoms that form a cuboctahedron (Fig. 1E) with a volume of 132.6 Å3. This is comparable to the volume of pentagonal dodecahedron cages in type I clathrates, Cs8Cd18As28 (144.5 Å3) and Cs8Ga27Sb19 (149.9 Å3).29,30 The second void is extremely large with a volume of 575 Å3 and is filled with the Cl@Ba6 octahedron (Fig. 1F). The distance between Cl and Ba is 3.40 Å. Each trigonal face of the Cl@Ba6 octahedron is capped with a P atom, which forms a cube around the octahedron (Fig. 1G). Furthermore, a truncated octahedron with 24 P atoms at each vertex encapsulates the Cl@Ba6@P8 unit (Fig. 1H). The 8 P atoms forming the cube intersect the center of the hexagonal faces of the truncated octahedron. This giant truncated octahedra share square faces with the cuboctahedra and thus not completely isolated by the silicon phosphorus framework. The truncated octahedron and cuboctahedron pack together in a rock-salt sublattice (Fig. 1B). The distance between the two P atoms in the square face of the cuboctahedron that connects with the truncated octahedron is 5.48 Å. The large channels between Cs and Ba are comparative to small channel zeolites. Conventional zeolite channels range between 4.2 and 7.4 Å.31 Another interesting structural feature is that the cation-filled voids are connected in all directions, i.e. the channels are three dimensional.
m (No. 225) with a Wyckoff sequence of igfeba, which is a new structure type. The large charge of the [Ae6X]11+ polycation attests to the ability of silicon–phosphorus frameworks to accommodate charge. Silicon phosphides have been shown to accommodate charges from cations by adapting the bonding within the Si–P fragments. For instance, Si and P can form isolated SiP4 tetrahedra (as in Li14SiP6),26 corner-sharing tetrahedra (as in SiP2),27 and edge-sharing tetrahedra (as in Ba4Si3P8).28 In addition, Si–Si bonds can form to increase the magnitude of negative charge of the overall fragment or to balance the charge.23 Conversely, P–P bonds can be formed to reduce the negative charge of the fragment. P is typically known for its trigonal pyramidal geometry, but P is versatile and is capable of being undercoordinated. Undercoordinated P atoms represent a way of increasing the magnitude of negative charge. In CsBa6Si12P20Cl (Fig. 1A), due to the large charge of the [Ba6Cl] polycation, the Si–P framework contains corner sharing as well as edge sharing SiP4 tetrahedra with undercoordinated (2-coordinate) P atoms occupying the 48i site. The Si–P framework has a repeating fragment of six directionally oriented corner-sharing SiP4 tetrahedra (Fig. 1C and D). This fragment is connected to an identical fragment facing the opposite direction through edge-sharing tetrahedra. All Si atoms in the structure are four-coordinate, however, the connectivity of the Si–P fragments leaves large voids in the crystal structure. The first void is filled by Cs. Cs is coordinated by 12 phosphorus atoms that form a cuboctahedron (Fig. 1E) with a volume of 132.6 Å3. This is comparable to the volume of pentagonal dodecahedron cages in type I clathrates, Cs8Cd18As28 (144.5 Å3) and Cs8Ga27Sb19 (149.9 Å3).29,30 The second void is extremely large with a volume of 575 Å3 and is filled with the Cl@Ba6 octahedron (Fig. 1F). The distance between Cl and Ba is 3.40 Å. Each trigonal face of the Cl@Ba6 octahedron is capped with a P atom, which forms a cube around the octahedron (Fig. 1G). Furthermore, a truncated octahedron with 24 P atoms at each vertex encapsulates the Cl@Ba6@P8 unit (Fig. 1H). The 8 P atoms forming the cube intersect the center of the hexagonal faces of the truncated octahedron. This giant truncated octahedra share square faces with the cuboctahedra and thus not completely isolated by the silicon phosphorus framework. The truncated octahedron and cuboctahedron pack together in a rock-salt sublattice (Fig. 1B). The distance between the two P atoms in the square face of the cuboctahedron that connects with the truncated octahedron is 5.48 Å. The large channels between Cs and Ba are comparative to small channel zeolites. Conventional zeolite channels range between 4.2 and 7.4 Å.31 Another interesting structural feature is that the cation-filled voids are connected in all directions, i.e. the channels are three dimensional.
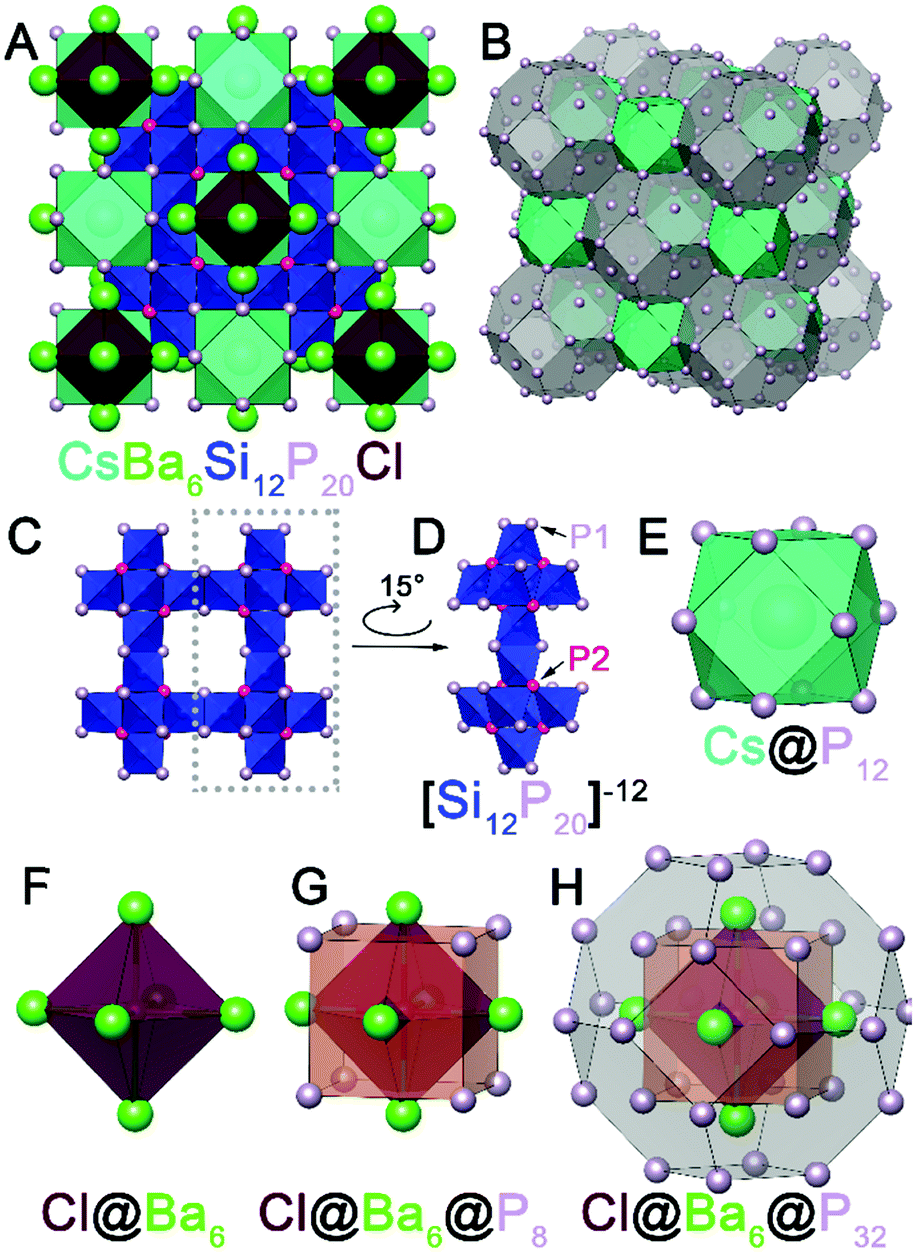 | ||
| Fig. 1 (A) Unit cell view of CsBa6Si12P20Cl along [100]. (B) Rock-salt packing of truncated octahedra and cuboctahedra. (C) Si–P framework viewed along [100]. (D) Si–P repeating fragment featuring two groups of 6 directionally oriented corner-sharing SiP4 tetrahedra. (E) Cs@P12 cuboctahedron. (F) Cl@Ba6 octahedron. (G) Cl@Ba6 octahedron encapsulated in a P8 cube. (H) Cl@Ba6@P8 unit inside of a truncated octahedron formed by 24 P atoms. | ||
While the atomic assignments from SXRD were made by considering the connectivity of the structure as well as the composition, it should be noted that X-ray diffraction is not sensitive enough to indisputably distinguish Cs from Ba. In CsBa6Si12P20Cl, the best refinement was obtained when Cs solely occupies the 4b site and Ba solely occupies the 24e site. Attempts at refining a mixture of Cs/Ba at either site resulted in unstable refinements due to similarities of Cs and Ba scattering factors. However, when Cs is replaced with Rb, K, or Na with different enough scattering factors the site occupancies of the 4b and 24e sites clearly indicate that the alkali and Ba cations are mixing in both sites. There is a clear trend of the smaller alkali metal avoiding the 4b site in the center of the cuboctahedra and instead shifting to the 24e site, forming shorter A–P distances (Fig. S3 and Table S4, ESI†). The smaller alkaline-earth metal, Sr, does not mix with Rb or Cs, which are both larger than Sr, and has yet to be synthesized with Na or K. The iodine containing analogs (CsBa6Si12P20I, RbBa6Si12P20I) have additional complexity as the iodine position is partially vacant. To account for the charge imbalance, the Ba is replaced by Rb/Cs making the actual composition close to Rb1.1Ba5.9Si12P20I0.9. To validate atomic assignments of Si and P, as well as understand the cation mixing, we employed magic angle spinning (MAS) solid-state nuclear magnetic resonance (NMR) spectroscopy.
Direct excitation 31P solid-state NMR spectra reveal two main groups of NMR signals centered at ca. –56 and –175 ppm (Fig. 2A). The high frequency 31P NMR signals (−56 ppm) exhibit larger chemical shift anisotropy (CSA; span (Ω) ~ 115 ppm) than the low frequency signals (−175 ppm; Ω ∼ 62 ppm, Table S7, ESI†). The magnitude of the CSA is dependent on the local symmetry at the nucleus; symmetric environments give rise to small CSA. Therefore, the 31P NMR signals at −56 ppm and −175 ppm correspond to the 2- and 3-coordinate P sites, respectively. The ratio of the 2 and 3-coordinate 31P NMR signals is ca. 3![[thin space (1/6-em)]](https://www.rsc.org/images/entities/char_2009.gif) :2, consistent with the structure determined by SXRD (Table S7, ESI†). We note that each group of 31P NMR signals exhibits multiple peaks (shoulders), which likely arises from structural (substitutional) disorder. Interestingly, a direct excitation 29Si NMR spectrum reveals two relatively broad 29Si NMR signals at −11 ppm and −16 ppm with relative populations of ca. 60 and 40%, respectively (Fig. 2B and Table S8, ESI†). In addition, direct excitation 133Cs NMR spectra also reveal two sites centered at ca. 206 ppm (ca. 60%) and 212 ppm (ca. 40%) (Fig. 2C and Table S9, ESI†). Only one unique Si and Cs site is expected from the SXRD structure.
:2, consistent with the structure determined by SXRD (Table S7, ESI†). We note that each group of 31P NMR signals exhibits multiple peaks (shoulders), which likely arises from structural (substitutional) disorder. Interestingly, a direct excitation 29Si NMR spectrum reveals two relatively broad 29Si NMR signals at −11 ppm and −16 ppm with relative populations of ca. 60 and 40%, respectively (Fig. 2B and Table S8, ESI†). In addition, direct excitation 133Cs NMR spectra also reveal two sites centered at ca. 206 ppm (ca. 60%) and 212 ppm (ca. 40%) (Fig. 2C and Table S9, ESI†). Only one unique Si and Cs site is expected from the SXRD structure.
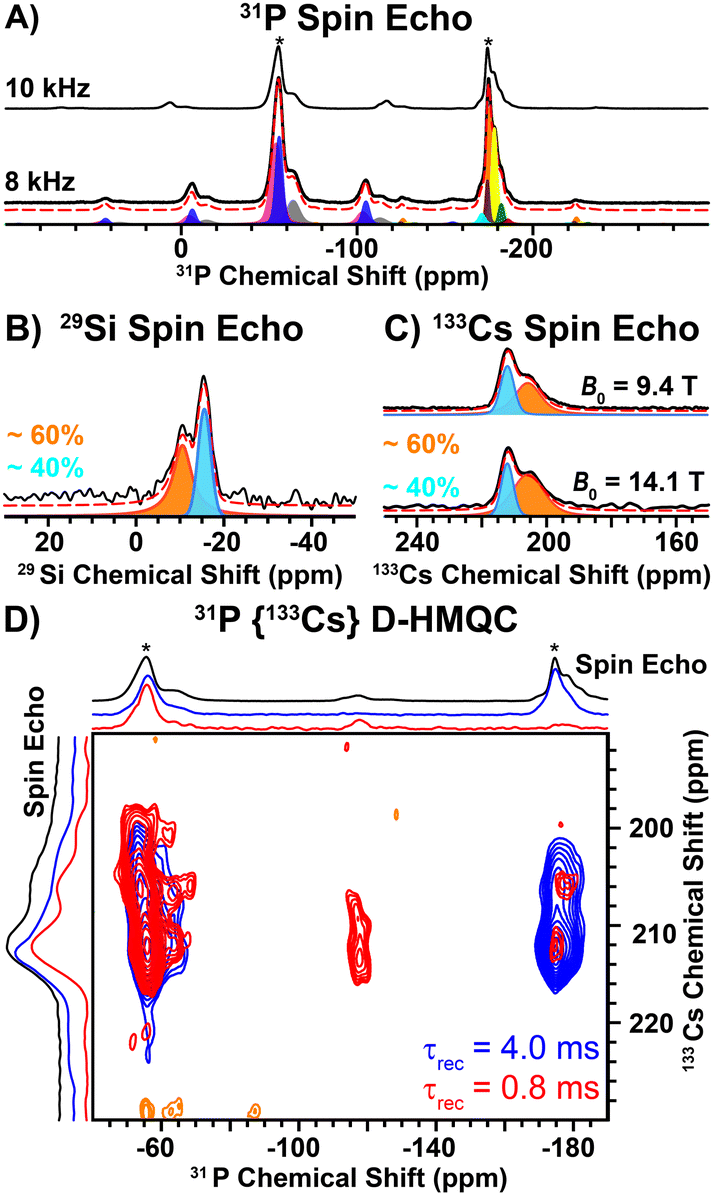 | ||
| Fig. 2 (A) 1D 31P spin echo NMR spectra recorded with a (lower) 8 kHz or (upper) 10 kHz MAS frequency. Asterisks denote isotropic NMR signals. (B) 1D 29Si spin echo NMR spectrum. (C) 1D 133Cs spin echo NMR spectra recorded at B0 = (upper) 9.4 T or (lower) 14.1 T. Experimental (black solid line) and analytically simulated (red dashed line) spectra are shown. (D) 2D 31P {133Cs} D-HMQC NMR spectra recorded with either (red) 0.8 ms or (blue) 4 ms of heteronuclear dipolar recoupling applied to the 31P spins. | ||
To further probe the two unique 133Cs NMR signals, we recorded 2D 31P{133Cs} D-HMQC NMR spectra. The 31P{133Cs} D-HMQC NMR spectrum recorded with a short duration of heteronuclear dipolar recoupling (0.8 ms) reveals that the 2-coordinate 31P NMR signals (ca. −56 ppm) correlate to both 133Cs sites (Fig. 2D, red). The short duration of dipolar recoupling primarily probes 31P–133Cs spin pairs in close spatial proximity. Closer examination of the 2-coordinate 31P NMR signal suggests two unique 2-coordinate sites, where the lower or higher frequency 31P NMR signals correlate with the higher or lower frequency 133Cs NMR signals, respectively (Fig. S5, ESI†). In addition, weak 31P–133Cs correlations are observed for the 3-coordinate 31P NMR signals, where the center of the 31P NMR signal is shifted to a lower frequency than that observed in the 31P spin echo NMR spectrum (Fig. 2D, red). It is not surprising that the most intense 3-coordinate 31P NMR signal (−174 ppm) shows weak correlations in the 2D HMQC spectrum as these P atoms are quite distant from Cs (6.44 Å). However, the lower frequency 31P shoulder (−177 ppm) has increased intensity in the HMQC spectrum and significantly lower intensity in the 31P spin echo NMR spectrum as compared to the −174 ppm 31P NMR signal. Furthermore, the lower frequency 31P NMR signal (−177 ppm) primarily correlates with the lower frequency 133Cs NMR signal, suggesting it is in closer spatial proximity to Cs (Fig. 2D). At long durations of heteronuclear dipolar recoupling (4 ms), all 31P NMR signals reveal correlations to both 133Cs NMR signals (Fig. 2D, blue). The observation of two unique 29Si and 133Cs sites, in addition to the 31P{133Cs} D-HMQC correlations discussed above, suggests site mixing between Cs and Ba. The 133Cs NMR signal at ca. 206 ppm is assigned to Cs replacing a Ba site based on the correlations observed with the lower frequency 3-coordinate 31P NMR signal (−177 ppm) in the 2D 31P{133Cs} D-HMQC spectrum. We note that the 133Cs NMR signal at ca. 206 ppm is broader than the 133Cs NMR signal at ca. 212 ppm, consistent with a more asymmetric environment. A 35Cl spin echo NMR spectrum reveals a sharp NMR signal assigned to Cl coordinated by 6 Ba atoms (Fig. S4, ESI†). In addition, there is a broadened 35Cl NMR signal, consistent with a more asymmetric environment when Cl is coordinated by both Ba and Cs (Fig. S4, ESI†).
Since there are no Si–Si or P–P bonds, the electron balance in the produced compounds can be rationalized either as (Cs+)(Ba2+)6(Si4+)12(P3−)20(Cl1−) when Si–P bonding is treated as ionic or (Cs+)(Ba2+)6(Si0)12(P0)8(P1−)12(Cl1−) when Si–P bonding is covalent. Band structure calculations underestimated the band gap of materials by 0.4–0.5 eV against experimental values from UV-vis diffuse reflectance spectroscopy (Fig. 3A). For CsBa6Si12P20Cl, the band structure shows a direct band gap of about 1.45 eV at the Γ-point, which correlates with the direct experimental gap shown in the Tauc plot to be 1.92 eV (Fig. S9, ESI†). The valence band maximum (VBM) is mostly populated with P states with contributions from Ba, while the conduction band minimum (CBM) has nearly equal contributions from Si, P, and Ba. Electron localization function (ELF) analysis (Fig. 3C) found covalent bonds for Si–P interactions and additional electron lone pairs located on P atoms. Cs and Cl appear ionic as demonstrated by the spherical shaped ELF density. The ELF distribution around Ba is not entirely spherical, which indicates weak directed interactions between the Ba and P atoms as in Ba3S4I2.32 Because of the lack of states near the VBM and CBM for the A and X, the band gaps are not affected by the substitution of these elements. However, replacing Ba with Sr results in a shrinking of the gap and a transformation from a direct to an indirect bandgap (Fig. S9 and S10, ESI†).
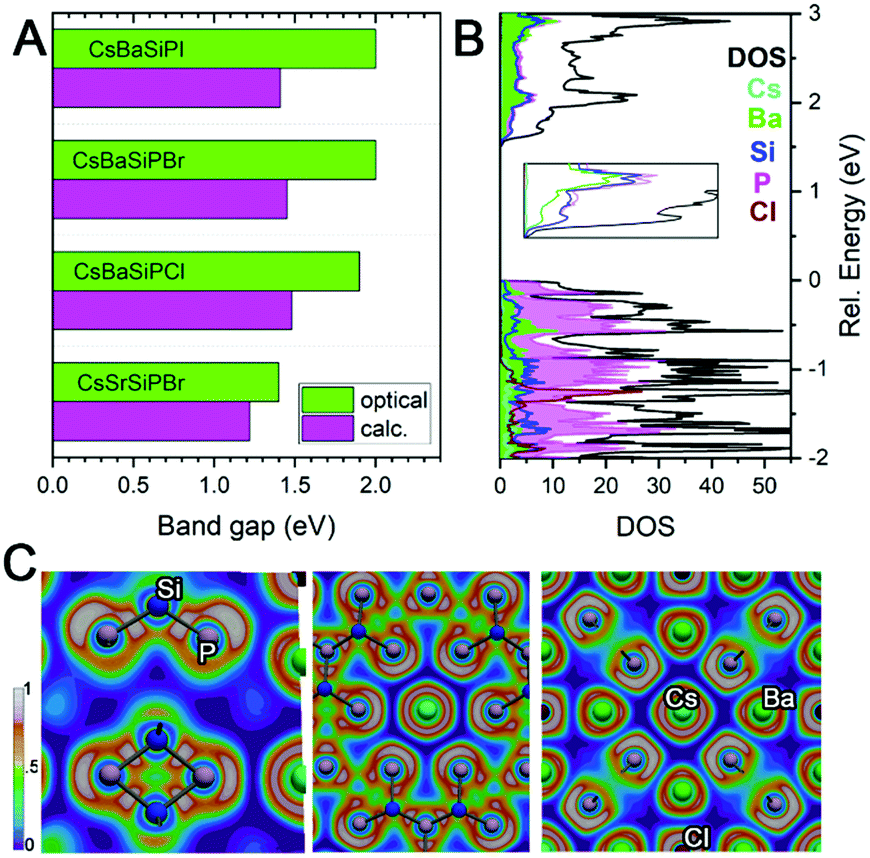 | ||
| Fig. 3 (A) Comparison of calculated and experimental band gaps. (B) Density of states with inset showing the CBM. (C) ELF visualizations. | ||
In conclusion, we have synthesized a novel family of semiconductors that appear to be versatile in composition. Their bandgaps range from 1.4 to 2.0 eV which is within the range for photovoltaic, photocatalytic, and radiation detection materials. The large cage-like structure contains unique cluster cations. The Si–P framework which forms the cages has large pores (diameter > 5 Å), similar to zeolite materials. High chemical and thermal stabilities of the reported compounds demonstrate the promise of Si–P frameworks for functional materials in optical and ion transport applications.
This research was supported by the U.S. Department of Energy, Office of Basic Energy Sciences, Division of Materials Science and Engineering, grant DE-SC0022288. Solid-state NMR spectroscopy experiments (A. P. P., R. W. D., and A. J. R.) were supported by the U.S. Department of Energy (DOE), Office of Science, Basic Energy Sciences, Materials Science and Engineering Division. Ames Laboratory is operated for the U.S. DOE by Iowa State University under Contract DE-AC02-07CH11358. A. J. R. acknowledges additional support from the Alfred P. Sloan Foundation through a Sloan research fellowship. V. K. was supported by the U.S. Department of Energy Office of Science, Science Undergraduate Laboratory Internships (SULI).
All authors contributed to this work. The authors are thankful to Prof. J. Vela (ISU) for access to the UV-vis spectrometer.
Conflicts of interest
There are no conflicts to declare.References
- P. K. Nayak, G. Garcia-Belmonte, A. Kahn, J. Bisquert and D. Cahen, Energy Environ. Sci., 2012, 5, 6022–6039 RSC.
- D. H. Fabini, M. Koerner and R. Seshadri, Chem. Mater., 2019, 31, 1561–1574 CrossRef CAS.
- M.-Y. Qi, M. Conte, M. Anpo, Z.-R. Tang and Y.-J. Xu, Chem. Rev., 2021, 121, 13051–13085 CrossRef CAS PubMed.
- S. L. Nguyen, C. D. Malliakas, J. A. Peters, Z. Liu, J. Im, L.-D. Zhao, M. Sebastian, H. Jin, H. Li, S. Johnsen, B. W. Wessels, A. J. Freeman and M. G. Kanatzidis, Chem. Mater., 2013, 25, 2868–2877 CrossRef CAS.
- D. F. Eaton, Science, 1991, 253, 281–287 CrossRef CAS PubMed.
- K. M. Ok, E. O. Chi and P. S. Halasyamani, Chem. Soc. Rev., 2006, 35, 710–717 RSC.
- B. Huang, H. L. Zhuang, M. Yoon, B. G. Sumpter and S.-H. Wei, Phys. Rev. B: Condens. Matter Mater. Phys., 2015, 91, 121401 CrossRef.
- C. Li, S. Wang, X. Zhang, N. Jia, T. Yu, M. Zhu, D. Liu and X. Tao, CrystEngComm, 2017, 19, 6986–6991 RSC.
- C. Li, S. Wang, C. Li, T. Yu, N. Jia, J. Qiao, M. Zhu, D. Liu and X. Tao, J. Mater. Chem. C, 2018, 6, 7219–7225 RSC.
- H. Sar, J. Gao and X. Yang, Sci. Rep., 2021, 11, 6372 CrossRef CAS PubMed.
- F. Shojaei, B. Mortazavi, X. Zhuang and M. Azizi, Mater. Today Energy, 2020, 16, 100377 CrossRef.
- J. Mark, J. Wang, K. Wu, J. G. Lo, S. Lee and K. Kovnir, J. Am. Chem. Soc., 2019, 141, 11976–11983 CrossRef CAS PubMed.
- J. Chen, Q. Wu, H. Tian, X. Jiang, F. Xu, X. Zhao, Z. Lin, M. Luo and N. Ye, Adv. Sci., 2022, 2105787 CrossRef CAS PubMed.
- J. E. Jaffe and A. Zunger, Phys. Rev. B: Condens. Matter Mater. Phys., 1984, 30, 741–756 CrossRef CAS.
- K. T. Zawilski, P. G. Schunemann, T. C. Pollak, D. E. Zelmon, N. C. Fernelius and F. K. Hopkins, J. Cryst. Growth, 2010, 312, 1127–1132 CrossRef CAS.
- S. Lee, S. L. Carnahan, G. Akopov, P. Yox, L.-L. Wang, A. J. Rossini, K. Wu and K. Kovnir, Adv. Funct. Mater., 2021, 31, 2010293 CrossRef CAS.
- A. Haffner, V. Weippert and D. Johrendt, Z. Anorg. Allg. Chem., 2021, 647, 326–330 CrossRef CAS.
- J. Wang, P. Yox and K. Kovnir, Front. Chem., 2020, 8, 186 CrossRef CAS PubMed.
- M. G. Kanatzidis, R. Pöttgen and W. Jeitschko, Angew. Chem., Int. Ed., 2005, 44, 6996–7023 CrossRef CAS PubMed.
- V. V. Klepov, C. A. Juillerat, K. A. Pace, G. Morrison and H.-C. zur Loye, Front. Chem., 2020, 8, 518 CrossRef CAS PubMed.
- M. G. Kanatzidis, Curr. Opin. Solid State Mater. Sci., 1997, 2, 139–149 CrossRef CAS.
- D. E. Bugaris and H.-C. zur Loye, Angew. Chem., Int. Ed., 2012, 51, 3780–3811 CrossRef CAS PubMed.
- P. Yox, S. J. Lee, L. Wang, D. Jing and K. Kovnir, Inorg. Chem., 2021, 60, 5627–5634 CrossRef CAS PubMed.
- N. R. Spagnuolo, G. Morrison and H.-C. zur Loye, Solid State Sci., 2019, 97, 105973 CrossRef CAS.
- G. Morrison, M. D. Smith and H.-C. zur Loye, J. Am. Chem. Soc., 2016, 138, 7121–7129 CrossRef CAS PubMed.
- S. Strangmüller, H. Eickhoff, D. Müller, W. Klein, G. Raudaschl-Sieber, H. Kirchhain, C. Sedlmeier, V. Baran, A. Senyshyn, V. L. Deringer, L. van Wüllen, H. A. Gasteiger and T. F. Fässler, J. Am. Chem. Soc., 2019, 141, 14200–14209 CrossRef PubMed.
- T. Wadsten, Acta Chem. Scand., 1967, 21, 593–594 CrossRef CAS.
- J. Mark, J.-A. Dolyniuk, N. Tran and K. Kovnir, Z. Anorg. Allg. Chem., 2019, 645, 242–247 CrossRef CAS.
- H. He, A. Zevalkink, Z. M. Gibbs, G. J. Snyder and S. Bobev, Chem. Mater., 2012, 24, 3596–3603 CrossRef CAS.
- B. Owens-Baird, J. Wang, S. G. Wang, Y. S. Chen, S. Lee, D. Donadio and K. Kovnir, J. Am. Chem. Soc., 2020, 142, 2031–2041 CrossRef CAS PubMed.
- G. A. Ozin, A. Kuperman and A. Stein, Angew. Chem., Int. Ed. Engl., 1989, 28, 359–376 CrossRef.
- J. Wang, K. Lee and K. Kovnir, Inorg. Chem. Front., 2016, 3, 306–312 RSC.
Footnote |
| † Electronic supplementary information (ESI) available. CCDC 2168162–2168172. For ESI and crystallographic data in CIF or other electronic format see DOI: https://doi.org/10.1039/d2cc02304k |
| This journal is © The Royal Society of Chemistry 2022 |