 Open Access Article
Detection of cell membrane proteins using ion-sensitive field effect transistors combined with chemical signal amplification†
Miyuki
Tabata
 ,
Chattarika
Khamhanglit
,
Sayo
Kotaki
and
Yuji
Miyahara
*
,
Chattarika
Khamhanglit
,
Sayo
Kotaki
and
Yuji
Miyahara
*
Tokyo Medical and Dental University, 2-3-10 Kanda-Surugadai, Chiyoda, Tokyo 101-0062, Japan. E-mail: miyahara.bsr@tmd.ac.jp
First published on 10th June 2022
Abstract
The capture and detection of cells expressing a breast-cancer related membrane protein, namely a BT474 cell line expressing HER2, is demonstrated using ion-sensitive field effect transistors (ISFETs). BT474 cells were exposed to anti-HER2 antibodies and urease-conjugated secondary antibodies to induce chemical signal amplification by adding urea.
The number of cancer patients estimated by the International Agency for Research on Cancer (IARC) was 14.1 million in 2012, increasing to 18.1 million in 2018. This increase is a global issue, and improving the cancer screening rate may aid in early detection. Liquid biopsy is a promising method for early-stage cancer diagnosis or prognosis because it is a minimally invasive technique using bodily fluids. There are several biomarkers in a liquid biopsy for cancer detection such as cell-free DNA (cfDNA),1,2 circulating tumor DNA (ctDNA),3 circulating tumor cells (CTCs),4–6 and cancer extracellular vesicles (EVs).7–9 In particular, CTCs and EVs are expected as biomarkers in liquid biopsies because they can provide information based on the analysis of proteins and sugar chains expressed on the membrane and the nucleic acids contained therein. Flow cytometry, such as fluorescence-activated cell sorting (FACS), is mainly used to detect CTCs10 and EVs.11 Moreover, the CELLSEARCH® system, which employs an immune-magnetic technology and fluorescence detection for precise and reproducible analysis, is the latest technology clinically validated for CTC detection by the U. S. Food and Drug Administration. Although these fluorescence detections realize robust detection,12,13 the system requires complicated optical systems and experts for operating and processing. Biosensors that detect living cells and cell functions without fluorescent labelling are also being actively researched14–16 because the systems are suitable for point-of-care testing or portable use. However, there is room for the development of a compact, simple, cost effective, and easy-to-use diagnosis instrument.
Electrochemical sensors have been extensively researched as biosensors for detecting various bio-related molecules such as DNA,17,18 ions,19 sugar chains,20 proteins,21 and cells.22 An ion-sensitive field effect transistor (ISFET) is an electrochemical sensor that can measure the pH of an analyte. ISFETs are the first miniaturized silicon-based pH sensors and some are commercially available.23 An ISFET can be used as a transducer that detects the enzyme reaction using a pH shift because some of the enzyme reactions proceed with a change in pH. The enzymatic reaction theoretically proceeds until the substrate is consumed such that the ISFET output signal is chemically amplified until the enzyme reaction is complete. Thus, chemical signal amplification on such an enzymatic reaction is an advantage in the detection of small amounts of targets. A high density ISFET array was also used to develop a proton ELISA24 in which glucose oxidase was used as a label for the secondary antibody to produce protons by adding glucose. Antigen was successfully detected by chemical amplification of the enzymatic reaction with this system. Such electrochemical pH detection devices offer advantages in high-throughput reading and highly parallel analysis because of compatibility with the microfabrication technique.25
In this study, we performed cell membrane protein detection with ISFETs combined with chemical signal amplification based on the urea–urease enzyme reaction. A breast cancer cell line was used as a model of CTCs, and human epidermal growth factor receptor (HER2), which is expressed more on the membrane of breast cancer cells than healthy cells,26,27 was used as a model membrane protein. Anti-HER2 antibody was bound to HER2 on the cell membrane and secondary antibody labeled with urease enzyme was introduced for binding to the anti-HER2 antibody. The HER2 expression on the cell membrane was detected by introducing urea to the ISFET sensing area for enzymatic reaction with urease to induce a local pH increase. Because the amount of urease is proportional to HER2 expression on a breast cancer cell, the HER2 expression level is expected to be quantitatively detected by measuring the enzymatic reaction rate.
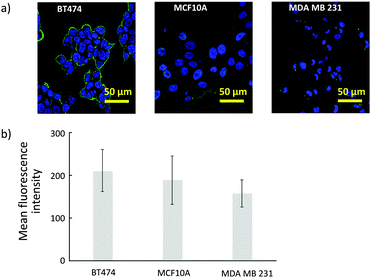
HER2 is a membrane protein associated with the growth of cancer cells, and overexpression of HER2 relates to malignancy and a poor prognosis in breast cancer. To confirm the HER2 expression level, three types of human breast cancer cell lines, MDA-MB231, MCF10A, and BT474 were used. HER2 was labeled with FITC-conjugated antibody, and the fluorescence was observed with confocal microscopy. As shown in Fig. 1(a), the florescence intensity of the BT474 cells was greater than those of MM231 cells and MCF10A cells. To compare the HER2 expression among the three cell lines, the average fluorescence intensities are shown in Fig. 1(b). The calculated average intensity values using 50 random cells in BT474, MCF10A, and MM231 were 208.9, 179.2, and 154.0, respectively. Among the observed cell types, strong fluorescence was confirmed in BT474. The HER2 expression is high in BT474, and is lower in MM231 and MCF10A. Higher expression of HER2 on BT474 cells, which are a Luminal B molecular subtype that generally grow fast, was consistent with previous results.28 BT474 was further used as a model cell in subsequent evaluations.
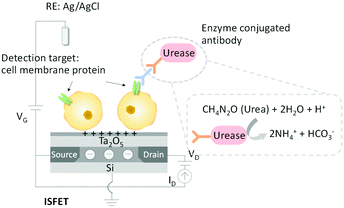
The proposed membrane protein detection scheme is shown in Fig. 2. When urease-conjugated antibody is bound to HER2 and urea as a substrate is added, ammonia is generated by an enzymatic reaction and the pH of the system increases. Specifically, the pH increases depending on the expression level of the membrane protein.
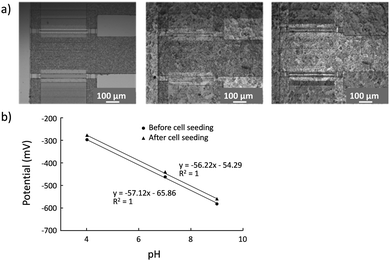
To detect HER2 using the ISFET (Fig. S1 and S2, ESI†), it is necessary to capture cells on the active area of the ISFET without decreasing the pH sensitivity. The capture of BT474 cells on the ISFET gate was observed with an optical microscope, while the sensitivity of the device after the cell capturing process was checked by a pH calibration experiment (Fig. 3). The surface of the Ta2O5 gate was modified with positively charged polymer (poly-L-lysine) for efficient capture of the cells. The images of the cells on the ISFET gate are shown in Fig. 3(a). The film thickness of the polymer coating layer is generally less than 100 nm,29 and no clear change was observed by microscopic observation. After seeding, the cells covered the sensor surface to near confluency. Even after the pH calibration experiment, cells were sufficiently maintained on the gate in a confluent manner. Ideally, the potential responses of the ISFET follow the Nernst equation shown in eqn (1),
E = E0 + (2.303RT/zF)log![[thin space (1/6-em)]](https://www.rsc.org/images/entities/char_2009.gif) a a | (1) |
To detect HER2 on the BT474 cell membrane via urea–urease reaction using ISFET, the enzymatic activity of urease conjugated with secondary anti-rabbit antibody (anti-rabbit IgG conjugated urease) was investigated (Fig. S3, ESI†). The enzyme-catalyzed hydrolysis of urea yields ammonia and carbon dioxide. Specifically, the enzymatic reaction produces ammonium ions based on eqn (2).
 | (2) |
The potential change based on production of the ammonium ions, i.e., a proton consumption process30 or generation process of hydroxide ions as end-metabolic products,31 moved in the positive direction according to the increasing pH in a sample solution. Thus, the net pH change at the ISFET gate surface allows for monitoring of the enzymatic reaction rate with ISFETs that depend on the number of immobilized enzymes under constant substrate concentration conditions. Here, the number of immobilized enzymes correlates with the number of cell membrane proteins; therefore, the pH change reflects the number of cell membrane proteins.
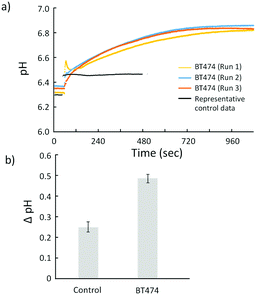
To detect HER2 using ISFETs, all of the processes, including the surface coating with poly-L-lysine, cell capturing on the sensor surface, labeling HER2 with anti-HER2 antibody, binding of the secondary antibody labelled urease, and monitoring the urea–urease reaction response with ISFET, were conducted (Fig. 2). The pH changes of the cell-based FETs were monitored at the introduction of urea with and without an antigen. Non-specific adsorption of each antibody was suppressed with a blocking solution. Fig. 4(a) shows the time course of the cell-based FETs in response to the urea solution. In the control (without BT474 cells), the output signal of the ISFET slightly changed to basic and immediately reached a steady state. The pH change resulting from the addition of urea was 0.23, which is consistent with the result of the solution phase without labeled urease, as shown in Fig. S3 (ESI†), because this pH shift was caused by the difference in pH between the solutions, not the enzyme reaction. Alternatively, the pH of the cell-based FETs in the time course gradually shifted in the basic direction as a response to urea. The gradual pH changes reached the steady state approximately 10 minutes after the introduction of urea. This pH change was generated by the enzymatic reaction of urease that was bound to HER2 expressed on the surface of the cell membrane. The total pH change was 0.49 in the cell-based FET, and the average maximum reaction velocity (Vmax) calculated from the time derivative was 0.018 pH/sec. The average pH change of the cell-based FETs was significantly different from that of the bare ISFET, as shown in Fig. 4(b). Because the amount of urease bound to the cell surface reflects the expression level of HER2, the obtained pH change corresponds to the expression level of HER2 on the cell surface. The results of cell-based FETs indicated that the protons consumed by the enzymatic reaction on the cell membrane diffused to the active area of the ISFET gate. Ion Torrent, a semiconductor-type next-generation DNA sequencer, also uses this proton diffusion to measure the DNA extension reaction on the surface of beads with a diameter of 2–3 μm trapped on ISFETs.32 The size of the BT474 cancer cells is approximately 10–15 μm, as shown in Fig. 1. Although the diffusion length of the proton was longer in the cell-based FETs than that of the DNA sequencing ISFET, the pH response induced by the enzymatic reaction was confirmed in this study. This result indicated that the proposed strategy could be applied to detect the surface markers of circulating tumor cells (CTCs) and extracellular vesicles (EVs), such as exosomes or micro vesicles, which are novel biomarkers in liquid biopsy, because the EV is approximately 100 times smaller than the cell. Therefore, the designed strategy model for HER2 detection ensures that the diffusion lengths are not inhibiting the detection of biomarkers on the cancer EVs, which is the future plan for establishing a medical instrument in terms of early-stage cancer diagnosis or prognosis monitoring. Although further investigations are necessary to demonstrate quantitative detection of HER2 expression using cells with low HER2 expression, the detection principle of cell membrane proteins using ISFETs combined with chemical signal amplification was demonstrated.
The strategy for detecting HER2 via a chemical enzyme reaction using an ISFET was successfully demonstrated using the BT474 breast cancer cell line. Urease-modified antibody was bound to HER2, which is a breast cancer-specific membrane protein, and urea was added as a substrate. The pH of the system increased with the enzymatic reaction. The results of the cell-based FETs showed that the pH change was induced by urease conjugated with antibody bound to the cancer cell membrane protein HER2. The pH change depending on the expression level of HER2 was confirmed by the cell-based FETs. Since ISFETs do not require fluorescent labelling and complicated optics, a compact detection system with simple and easy measurements can be realized based on the cell-based FETs. This detection mechanism can be applied to CTC and EV detection, and the sensor may be a useful device for interpreting biological significance that has not yet been clarified, such as elucidation of its biological development mechanism.
This work was supported in part by the Cooperative Research Project of Research Center for Biomedical Engineering (MEXT), Japan Science and Technology Agency (JST) COI Grant Number JPMJCE1305 and JST PRESTO Grant Number JPMJPR21B8.
Conflicts of interest
The authors declare no conflicts of interest.References
- A. Kustanovich, R. Schwartz, T. Peretz and A. Grinshpun, Cancer Biol. Ther., 2019, 20, 1057–1067 CrossRef CAS PubMed.
- S. Cristiano, A. Leal, J. Phallen, J. Fiksel, V. Adleff, D. C. Bruhm, S. Jensen, J. E. Medina, C. Hruban, J. R. White, D. N. Palsgrove, N. Niknafs, V. Anagnostou, P. Forde, J. Naidoo, K. Marrone, J. Brahmer, B. D. Woodward, H. Husain, K. L. van Rooijen, M. W. Ørntoft, A. H. Madsen, C. J.-H. van de Velde, M. Verheij, A. Cats, C. J.-A. Punt, G. R. Vink, N. C.-T. van Grieken, M. Koopman, R. J.-A. Fijneman, J. S. Johansen, H. J. Nielsen, G. A. Meijer, C. L. Andersen, R. B. Scharpf and V. E. Velculescu, Nature, 2019, 570, 385–389 CrossRef CAS PubMed.
- S. J. Dawson, D. W.-Y. Tsui, M. Murtaza, H. Biggs, O. M. Rueda, S. F. Chin, M. J. Dunning, D. Gale, T. Forshew, B. Mahler-Araujo, S. Rajan, S. Humphray, J. Becq, D. Halsall, M. Wallis, D. Bentley, C. Caldas and N. Rosenfeld, N. Engl. J. Med., 2013, 368, 1199–1209 CrossRef CAS PubMed.
- L. Keller and K. Pantel, Nat. Rev. Cancer, 2019, 19, 553–567 CrossRef CAS PubMed.
- M. Marcuello, V. Vymetalkova, R. P.-L. Neves, S. Duran-Sanchon, H. M. Vedeld, E. Tham, G. van Dalum, G. Flugen, V. Garcia-Barberan, R. J. Fijneman, A. Castells, P. Vodicka, G. E. Lind, N. H. Stoecklein, E. Heitzer and M. Gironella, Mol. Aspects Med., 2019, 69, 107–122 CrossRef CAS PubMed.
- M. Russano, A. Napolitano, G. Ribelli, M. Iuliani, S. Simonetti, F. Citarella, F. Pantano, E. Dell’Aquila, C. Anesi, N. Silvestris, A. Argentiero, A. Solimando, B. Vincenzi, G. Tonini and D. Santini, J. Exp. Clin. Cancer Res., 2020, 39(95) CAS.
- K. O’Brien, K. Breyne, S. Ughetto, L. C. Laurent and X. O. Breakefield, Nat. Rev. Mol. Cell Biol., 2020, 21, 585–606 CrossRef PubMed.
- Y. Yoshioka, T. Nakatsura and T. Ochiya, Cancer Sci., 2021, 112, 370 CrossRef PubMed.
- T. Hu, J. Wolfram and S. Srivastava, Trends Cancer, 2021, 7, 122–133 CrossRef CAS PubMed.
- M. B. Lustberg, P. Balasubramanian, B. Miller, A. Garcia-Villa, C. Deighan, Y. Q. Wu, S. Carothers, M. Berger, B. Ramaswamy, E. R. Macrae, R. Wesolowski, R. M. Layman, E. Mrozek, X. L. Pan, T. A. Summers, C. L. Shapiro and J. J. Chalmers, Breast Cancer Res., 2014, 16 Search PubMed.
- E. van der Pol, F. A.-W. Coumans, A. E. Grootemaat, C. Gardiner, I. L. Sargent, P. Harrison, A. Sturk, T. G. van Leeuwen and R. Nieuwland, J. Thromb. Haemostasis, 2014, 12, 1182–1192 CrossRef CAS PubMed.
- W. J. Allard, J. Matera, M. C. Miller, M. Repollet, M. C. Connelly, C. Rao, A. G.-J. Tibbe, J. W. Uhr and L. Terstappen, Clin. Cancer Res., 2004, 10, 6897–6904 CrossRef PubMed.
- S. Riethdorf, H. Fritsche, V. Muller, T. Rau, C. Schindibeck, B. Rack, W. Janni, C. Coith, K. Beck, F. Janicke, S. Jackson, T. Gornet, M. Cristofanilli and K. Pantel, Clin. Cancer Res., 2007, 13, 920–928 CrossRef CAS PubMed.
- F. Zhang, S. Wang, L. Yin, Y. Yang, Y. Guan, W. Wang, H. Xu and N. Tao, Anal. Chem., 2015, 87, 9960–9965 CrossRef CAS PubMed.
- H. Yang, M. Honda, A. Saito, T. Kajisa, Y. Yanase and T. Sakata, Anal. Chem., 2017, 89, 12918–12923 CrossRef CAS PubMed.
- H. Satake and T. Sakata, Anal. Chem., 2019, 91, 16017–16022 CrossRef CAS PubMed.
- T. Sakata and Y. Miyahara, Biosens. Bioelectron., 2007, 22, 1311–1316 CrossRef CAS PubMed.
- B. Yao, Y. C. Liu, M. Y. Tabata, H. T. Zhu and Y. J. Miyahara, Chem. Commun., 2014, 50, 9704–9706 RSC.
- D. F. Schaffhauser, M. Patti, T. Goda, Y. Miyahara, I. C. Forster and P. S. Dittrich, PLoS One, 2012, 7 Search PubMed.
- A. Matsumoto, N. Sato, K. Kataoka and Y. Miyahara, J. Am. Chem. Soc., 2009, 131(34), 12022–12023 CrossRef CAS PubMed.
- T. Goda, M. Toya, A. Matsumoto and Y. Miyahara, ACS Appl. Mater. Interfaces, 2015, 7, 27440–27448 CrossRef CAS PubMed.
- T. Sakata and Y. Miyahara, Anal. Chem., 2008, 80, 1493–1496 CrossRef CAS PubMed.
- P. Bergveld, IEEE Trans. Biomed. Eng., 1970, 17, 70–71 CAS.
- D. S. Juang, C. H. Lin, Y. R. Huo, C. Y. Tang, C. R. Cheng, H. S. Wu, S. F. Huang, A. Kalnitsky and C. C. Lin, Biosens. Bioelectron., 2018, 117, 175–182 CrossRef CAS PubMed.
- H. J. Jang, J. Ahn, M. G. Kim, Y. B. Shin, M. Jeun, W. J. Cho and K. H. Lee, Biosens. Bioelectron., 2015, 64, 318–323 CrossRef CAS PubMed.
- M. Yan, M. Schwaederle, D. Arguello, S. Z. Millis, Z. Gatalica and R. Kurzrock, Cancer Metastasis Rev., 2015, 34, 157–164 CrossRef CAS PubMed.
- S. Pernas and S. M. Tolaney, Ther. Adv. Med. Oncol., 2019, 11, 1–16 Search PubMed.
- K. Subik, J. F. Lee, L. Baxter, T. Strzepek, D. Costello, P. Crowley, L. Xing, M. C. Hung, T. Bonfiglio, D. G. Hicks and P. Tang, Breast Cancer, 2010, 4, 35–41 Search PubMed.
- M. Brittinger and P. Fromherz, Appl. Phys. A: Mater. Sci. Process., 2005, 81, 439–447 CrossRef CAS.
- I. G. Mourzina, T. Yoshinobu, Y. E. Ermolenko, Y. G. Vlasov, M. J. Schoning and H. Iwasaki, Microchim. Acta, 2004, 144, 41–50 CrossRef CAS.
- D. G. Pijanowska and W. Torbicz, Sens. Actuators, B, 1997, 44, 370–376 CrossRef CAS.
- C. Toumazou, L. M. Shepherd, S. C. Reed, G. I. Chen, A. Patel, D. M. Garner, C. J.-A. Wang, C. P. Ou, K. Amin-Desai, P. Athanasiou, H. Bai, I. M.-Q. Brizido, B. Caldwell, D. Coomber-Alford, P. Georgiou, K. S. Jordan, J. C. Joyce, M. La Mura, D. Morley, S. Sathyavruthan, S. Temelso, R. E. Thomas and L. L. Zhang, Nat. Methods, 2013, 10, 641–646 CrossRef CAS PubMed.
Footnote |
| † Electronic supplementary information (ESI) available. See DOI: https://doi.org/10.1039/d2cc02159e |
| This journal is © The Royal Society of Chemistry 2022 |


