 Open Access Article
Dual fluorescent labeling of GLP-1R in live cells via enzymatic tagging and bioorthogonal chemistry†
Tracey M.
Lewandowski
,
Peng
An‡
 ,
Carlo P.
Ramil§
 ,
Ming
Fang
 and
Qing
Lin
 *
*
Department of Chemistry, State University of New York at Buffalo, Buffalo, New York 14260-3000, USA. E-mail: qinglin@buffalo.edu
First published on 17th May 2022
Abstract
To study GPCR conformational dynamics in live cells, here we report an integrated approach combining enzymatic SNAP-tagging with bioorthogonal chemistry for dual fluorescent labeling of GLP-1R. The resulting GLP-1R conformational biosensors permit a FRET-based analysis of the receptor subdomain movement in response to ligand stimulation in live cells.
Introduction
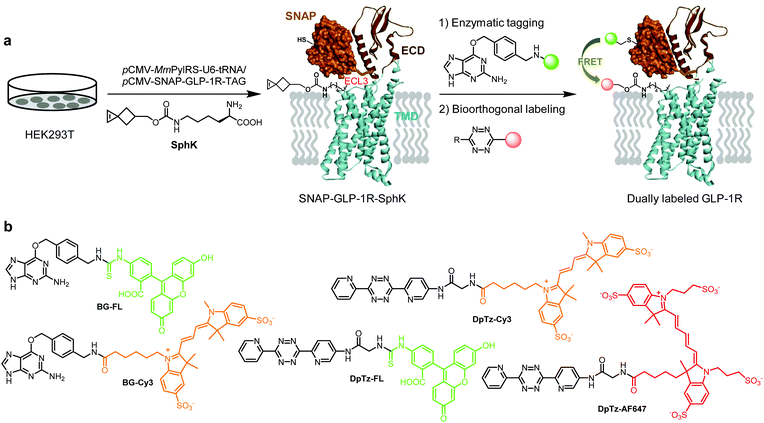
Despite the rapid progress in the structural elucidation of class B G protein-coupled receptors (GPCRs) using the cryo-EM technique, our understanding of GPCR conformational changes in response to ligand stimulation in the native cellular environment remains limited.1 Since conformational dynamics underlies crucial GPCR functions such as basal activity, maximum activity, and ligand signaling bias, our improved understanding will be of paramount importance to the design of the next-generation therapeutics with reduced side effects. Therefore, there is an urgent need to design GPCR biosensors that report receptor conformational transitions in real-time in live cells. To this end, a successful strategy exploits the fusion of two fluorescent proteins (FPs), usually CFP and YFP, to enable Förster resonance energy transfer (FRET)-based single-cell analysis.1–5 Due to its restriction to the N- or C-terminus of a protein, FP fusion is unsuitable for detecting GPCR subdomain movements during activation. One strategy to overcome this problem involved the insertion of a peptide tag called fluorescein arsenical hairpin (FlAsH) into the conformational mobile loop region.6 Another combined an enzymatic SNAP-tag with bioorthogonal site-specific labeling of a membrane-localized bacterial protein.7 More recently, a strategy involving dual genetic encoding of two unnatural amino acids followed by a pair of mutually exclusive bioorthogonal reactions was reported to insert FRET pairs to a yeast protein site-specifically.8 However, none of these strategies have been employed to construct biosensors to monitor class B GPCR dynamics.To study the conformational dynamics of class B GPCRs in live cells, we have recently reported a bioorthogonal chemistry strategy9–11 for site-specific fluorescent labeling of GCGR and GLP-1R—two members of class B GPCR family that regulate blood glucose.10 Our strategy builds upon the significant advances in designing strained alkenes/alkynes12 that can be site-specifically incorporated into proteins via genetic code expansion and serve as robust reaction partners for superfast tetrazole13,14 or tetrazine-based9 bioorthogonal reactions. Compared with site-specific incorporation of fluorescent amino acids into proteins in mammalian cells,15,16 bioorthogonal fluorescent labeling minimizes structural perturbation. In addition, it permits the selection of suitable fluorophores with desirable photophysical properties later, which is extremely valuable for FRET-based experiments. In the present work, we report the successful dual fluorescent labeling of GLP-1R in live cells by combining bioorthogonal labeling with the enzymatic SNAP-tag (Fig. 1). The resulting dually labeled GLP-1R biosensors allow us to perform single-cell FRET experiments and determine the energy transfer efficiencies in response to two GLP-1R peptide agonist stimulation.
Results and discussion
Incorporation of unnatural amino acids into SNAP-GLP-1R
To identify suitable sites for fluorophore placement, we compared the cryo-EM structures of GLP-1R in the inactive and active states.17,18 We noted that extracellular loop 3 (ECL3) undergoes an outward movement upon ligand binding and activation (ESI,† Fig. S1), suggesting this region could serve as a potential site for unnatural amino acid (UAA) mutagenesis. On the other hand, our previous studies have shown that the N-terminus of GLP-1R can be modified without affecting receptor activity.9 Importantly, the distances between residues located at ECL3 and those at the N-terminus show substantial changes after receptor activation (Fig. S1c and d, ESI†), indicating that these two sites are suitable for dual fluorophore labeling and subsequent FRET analysis. Thus, we co-transformed HEK293T cells with two plasmids: one encoding GLP-1R containing a SNAP-tag at the N-terminus and an amber codon at one of four ECL3 sites (H374, R376, G377, and T378); the other encoding an orthogonal PylRS/tRNA pair for charging BocK or SphK (Fig. 1a). We also expressed an extracellular domain (ECD) mutant with an amber codon placed at D59 as a control. We assessed the expressions of BocK-encoded SNAP-GLP-1R mutants by treating the transfected cells with BG-FL for 30 min followed by confocal microscopy. Compared to the wild-type (WT), three ECL3 mutants (R376, G377, and T378) showed lower expressions, while the D59 mutant showed similar expression (Fig. 2a and Fig. S2, ESI†). We then performed a cAMP accumulation assay9 to probe how UAA mutation affects receptor activity. Compared to the WT, the D59 and R376 mutants gave 5–8-fold higher EC50 values accompanied by lower Emax, whereas the T378 mutant showed a 1000-fold increase in EC50 but only 4-fold lower Emax (Fig. 2b and Fig. S3, ESI†) for the native GLP-1 ligand. Surprisingly, the G377 mutant was completely inactive, suggesting that this loop mutation may have caused significant perturbation to the GLP-1R structure.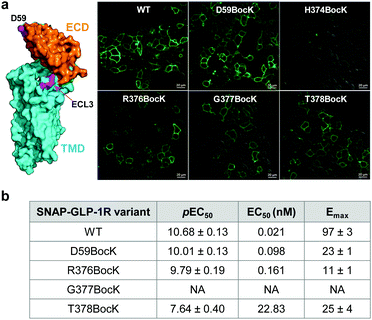 | ||
| Fig. 2 (a) Confocal micrographs of HEK293T cells expressing SNAP-GLP-1R mutants encoding BocK at various solvent-exposed positions as marked on the inactive GLP-1R structure (PDB code: 6LN2). Cells were treated with 5 μM BG-FL for 30 min before image acquisition. Scale bar = 20 μm. (b) Receptor activity of the SNAP-GLP-1R variants as assessed by the intracellular cAMP accumulation assay. pEC50 value represents negative logarithm of the concentration of GLP-1 that produces half of the maximal response. Emax is presented as % of the maximum WT response. NA, not active. See Fig. S3 (ESI†) for the response curves. | ||
Bioorthogonal labeling of SNAP-GLP-1R
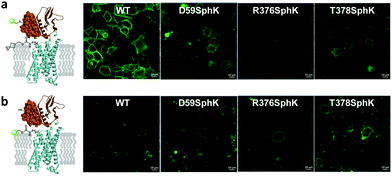
To examine whether SphK can be incorporated site-specifically into the permissive ECL3 sites similar to BocK, we monitored the expression of SNAP-GLP-1R mutants encoding SphK at D59, R376, and T378 positions by confocal microscopy after treating HEK293T cells with BG-FL. Compared to the WT, all mutants showed lower expressions on the cell membrane as visualized in the FL channel (Fig. 3a and Fig. S4, ESI†). To probe whether the incorporated SphK is accessible to bioorthogonal reaction, we treated the SphK-encoded cells with DpTz-FL and monitored the reaction by confocal microscopy. To our delight, we found that two ECL3 mutants (R376SphK and T378SphK) gave efficient labeling while the WT control did not, indicating a high level of specificity for the tetrazine-mediated bioorthogonal labeling (Fig. 3b and Fig. S4, ESI†). Notably, bioorthogonal labeling efficiency appears comparable to enzymatic SNAP-tagging for the SphK-encoded mutants (compare Fig. 3b to 3a), indicating that the lower fluorescence intensities for the mutants relative to the WT are likely a result of the intrinsically low amber codon suppression efficiency.Dual fluorescent labeling of SNAP-GLP-1R
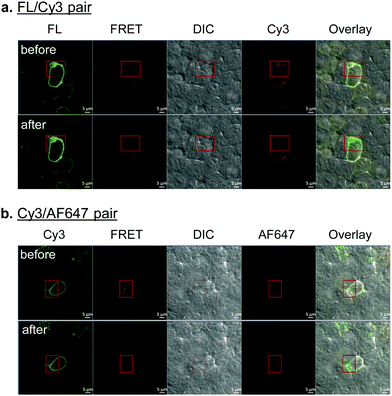
With the constructs fully validated, we turned our attention to dual fluorescent labeling of the SphK-encoded GLP-1R mutants. For efficient FRET, a suitable FRET donor/acceptor pair need to be identified. To this end, we evaluated two sets of matching labeling reagents, BG-FL/DpTz-Cy3 and BG-Cy3/DpTz-AF647, in a sequential enzymatic tagging/bioorthogonal labeling scheme (Fig. 1). We first tested dual-labeling with the SNAP-GLP-1R-T378SphK mutant because it gave a higher enzymatic tagging and bioorthogonal labeling efficiency (Fig. 3). Sequential treatment of HEK293T cells expressing SNAP-GLP-1R-T378SphK with fluorescent BG and DpTz reagents led to successful dual-labeling, as evidenced by the fluorescence signals in the FRET channel as well as the perfect overlay in confocal micrographs (top rows, Fig. 4a and b). To determine FRET efficiency, we used an acceptor photobleaching method,19 in which half of a cell was photobleached to knock out the acceptor. The FRET efficiency was 23 ± 2% for the FL/Cy3 pair and 14 ± 6% for the Cy3/AF647 pair. These results were consistent with the loss of fluorescence signals in the Cy3 channel and enhanced green fluorescence signal in the overlaid micrographic images for the photobleached region (bottom rows; Fig. 4a and b). The higher FRET efficiency observed for the FL/Cy3 pair can be attributed to a more significant overlap between the emission band of FL and the absorption band of Cy3 (Fig. S5, ESI†). Therefore, in our subsequent studies, we decided to use the FL/Cy3 dually fluorescent-labeled GLP-1R as a conformational biosensor.FRET measurements in response to ligand stimulation
Inspection of the activated GLP-1R structure revealed that the ECL3 loop moves outward from the ligand-binding site compared to the inactive structure; simultaneously, the N-terminus of GLP-1R appears to move closer to the ligand-binding pocket, leading to a potentially shorter distance between the ECL3 and the N-terminus (Fig. S1, ESI†). To probe if we can detect this conformational change with a dually labeled GLP-1R biosensor, we compared the FRET efficiency before and after stimulation with a peptide agonist. We hypothesize that GLP-1R will exist predominantly in the ligand-bound active state at high ligand concentrations, resulting in a shorter interdomain separation and thus a greater FRET efficiency (Fig. 5a). We subjected the SNAP-GLP-1R-T378Sph biosensor to stimulation by one of two peptide agonists, GLP-1 and OXM-7. We selected OXM-7 because it activates GLP-1R and GCGR with equal but modest potency.20 To our surprise, the FRET efficiencies remained unchanged after ligand stimulation (Fig. 5b). Similar results were obtained with the SNAP-GLP-1R-R376Sph biosensor, even though the absolute FRET efficiency values varied depending on the peptide ligand (Fig. 5b), which is likely due to a variation in acceptor labeling density in different samples. Three factors can explain the lack of detectable FRET efficiency change. First, we used the SNAP-tag to introduce the FRET donor at the N-terminus of GLP-1R. The SNAP domain (∼19.4 kDa) movement may not sync with the ECD movement (discordant movement), tempering any time-sensitive FRET signal change. Second, after the extended peptide agonist treatment (10 min), the activated GLP-1R biosensors may have undergone endocytosis, depleting the fraction of the activated receptors at the cell membrane where FRET measurement was performed. Indeed, we detected the punctuated fluorescent biosensors in the cytosol upon ligand stimulation in the confocal micrographs (Fig. S6b, S8b and S9b, ESI†). Third, the dually labeled receptors may possess substantially reduced receptor activity, which decreases the fraction of the activated receptors in the conformational ensemble. The confocal micrographs clearly showed variations of receptor internalization depending on the specific biosensor and the peptide ligand. For example, the dually labeled SNAP-GLP-1R-T378SphK biosensor showed robust ligand-induced internalization after GLP-1 treatment (Fig. S6b, ESI†) but minimum internalization after OXM-7 treatment (Fig. S7b, ESI†).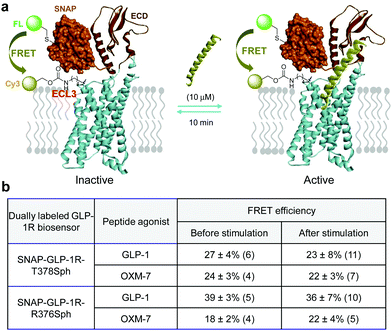 | ||
| Fig. 5 (a) Scheme for inter-domain movement upon ligand stimulation to activate the with the dually fluorescent labelled GLP-1R monitored by FRET. (b) Measured FRET efficiencies before and after ligand stimulation. The numbers in parenthesis represent the individual cells used in acceptor photobleaching to determine FRET efficiency as reported in mean ± standard deviation. Representative confocal micrographs used for determining FRET efficiencies are shown in the ESI,† Fig. S6–S9. | ||
Conclusions
In summary, we have demonstrated successful dual fluorescent labeling of GLP-1R in live cells through an enzymatic SNAP-tag and bioorthogonal labeling. Specifically, we identified two sites within the conformationally mobile ECL3 region that tolerate unnatural amino acid mutagenesis with a modest reduction of receptor activity. The SphK incorporation at the ECL3 permitted the site-specific installation of a FRET acceptor, which, together with the placement of a FRET donor through SNAP-tag, afforded the GLP-1R biosensors in live cells. Using the acceptor photobleaching method, we compared the efficiencies of FL/Cy3 and Cy3/AF647 FRET pairs and found the FL/Cy3 pair to give higher efficiency. However, two FL/Cy3-labelled SNAP-GLP-1R biosensors did not produce the expected FRET changes upon ligand stimulation, suggesting that additional factors need to be considered in the design of FRET-based GPCR biosensors. To this end, future work will focus on increasing synchronization between the fluorophore and the domain of interest, e.g., by optimizing the linker length and rigidity between the SNAP-tag and the receptor N-terminus to obtain favorable orientation factor and distance, performing perfusion-based real-time measurements, and identifying incorporation/modification sites with minimum perturbation to receptor function. Alternatively, an environmentally sensitive fluorophore can be placed at the ECL3 to sense the local polarity change during the receptor activation. Work along those lines is currently underway and will be reported in due course.Conflicts of interest
There are no conflicts to declare.Acknowledgements
We gratefully acknowledge the National Institutes of Health (R35 GM130307) for financial support. We thank Alan Siegel at SUNY Buffalo North Campus Imaging Facility for assistance with confocal microscopy.Notes and references
- M. Kauk and C. Hoffmann, Trends Pharmacol. Sci., 2018, 39, 123–135 CrossRef CAS PubMed.
- T. Clister, S. Mehta and J. Zhang, J. Biol. Chem., 2015, 290, 6681–6688 CrossRef CAS PubMed.
- J. D. Violin, X. R. Ren and R. J. Lefkowitz, J. Biol. Chem., 2006, 281, 20577–20588 CrossRef CAS PubMed.
- V. L. Wehbi, H. P. Stevenson, T. N. Feinstein, G. Calero, G. Romero and J. P. Vilardaga, Proc. Natl. Acad. Sci. U. S. A., 2013, 110, 1530–1535 CrossRef CAS PubMed.
- J.-P. Vilardaga, M. Bünemann, C. Krasel, M. Castro and M. J. Lohse, Nat. Biotechnol., 2003, 21, 807 CrossRef CAS PubMed.
- C. Hoffmann, G. Gaietta, M. Bünemann, S. R. Adams, S. Oberdorff-Maass, B. Behr, J.-P. Vilardaga, R. Y. Tsien, M. H. Ellisman and M. J. Lohse, Nat. Methods, 2005, 2, 171–176 CrossRef CAS PubMed.
- L. Xue, E. Prifti and K. Johnsson, J. Am. Chem. Soc., 2016, 138, 5258–5261 CrossRef CAS PubMed.
- R. M. Bednar, S. Jana, S. Kuppa, R. Franklin, J. Beckman, E. Antony, R. B. Cooley and R. A. Mehl, ACS Chem. Biol., 2021, 16, 2612–2622 CrossRef CAS PubMed.
- C. P. Ramil, M. Dong, P. An, T. M. Lewandowski, Z. Yu, L. J. Miller and Q. Lin, J. Am. Chem. Soc., 2017, 139, 13376–13386 CrossRef CAS PubMed.
- S. K. Gangam and Q. Lin, Methods Enzymol., 2020, 641, 95–111 CAS.
- Y. Tian, M. Fang and Q. Lin, Bioorg. Med. Chem., 2021, 43, 116256 CrossRef CAS PubMed.
- Z. Yu and Q. Lin, J. Am. Chem. Soc., 2014, 136, 4153–4156 CrossRef CAS PubMed.
- P. An, T. M. Lewandowski, T. G. Erbay, P. Liu and Q. Lin, J. Am. Chem. Soc., 2018, 140, 4860–4868 CrossRef CAS PubMed.
- G. S. Kumar, S. Racioppi, E. Zurek and Q. Lin, J. Am. Chem. Soc., 2022, 144, 57–62 CrossRef CAS PubMed.
- A. Chatterjee, J. Guo, H. S. Lee and P. G. Schultz, J. Am. Chem. Soc., 2013, 135, 12540–12543 CrossRef CAS PubMed.
- J. Luo, R. Uprety, Y. Naro, C. Chou, D. P. Nguyen, J. W. Chin and A. Deiters, J. Am. Chem. Soc., 2014, 136, 15551–15558 CrossRef CAS PubMed.
- F. Wu, L. Yang, K. Hang, M. Laursen, L. Wu, G. W. Han, Q. Ren, N. K. Roed, G. Lin, M. A. Hanson, H. Jiang, M. W. Wang, S. Reedtz-Runge, G. Song and R. C. Stevens, Nat. Commun., 2020, 11, 1272 CrossRef CAS PubMed.
- Y. Zhang, B. Sun, D. Feng, H. Hu, M. Chu, Q. Qu, J. T. Tarrasch, S. Li, T. S. Kobilka, B. K. Kobilka and G. Skiniotis, Nature, 2017, 546, 248–253 CrossRef CAS PubMed.
- J. Roszik, G. Tóth, J. Szöllősi and G. Vereb, in Target Identification and Validation in Drug Discovery: Methods and Protocols, ed. J. Moll and R. Colombo, Humana Press;Totowa, NJ, 2013, vol. 986, pp. 165–178 Search PubMed.
- A. Muppidi, H. Zou, P. Y. Yang, E. Chao, L. Sherwood, V. Nunez, A. K. Woods, P. G. Schultz, Q. Lin and W. Shen, ACS Chem. Biol., 2016, 11, 324–328 CrossRef CAS PubMed.
Footnotes |
| † Electronic supplementary information (ESI) available. See DOI: https://doi.org/10.1039/d2cb00107a |
| ‡ Present address: School of Chemical Science and Technology, Yunnan University, Kunmimg, Yunnan, 650500, P. R. China. |
| § Present address: Merck Research Laboratories, 320 Bent St., Cambridge, MA 02141, USA. |
| This journal is © The Royal Society of Chemistry 2022 |

