 Open Access Article
The effect of Gd-DOTA locations within PLGA-b-PEG micelle encapsulated IR-1061 on bimodal over-1000 nm near-infrared fluorescence and magnetic resonance imaging†
Thi Kim Dung
Doan
 *ab,
Masakazu
Umezawa
 c,
Kyohei
Okubo
 c,
Masao
Kamimura
 c,
Masayuki
Yamaguchi
b,
Hirofumi
Fujii
b and
Kohei
Soga
ac
aResearch Institute for Biomedical Science, Tokyo University of Science, 2669 Yamazaki, Noda, Chiba 278-0022, Japan. E-mail: doan@rs.tus.ac.jp
bDivision of Functional Imaging, Exploratory Oncology Research & Clinical Trial Center, National Cancer Center, 6-5-1 Kashiwanoha, Kashiwa 277-8577, Japan
cDepartment of Material Science and Technology, Tokyo University of Science, 6-3-1 Niijuku, Katsushika-ku, Tokyo 125-8585, Japan
First published on 3rd September 2022
Abstract
Multimodal imaging is attractive in biomedical research because it can provide multidimensional information about objects that individual techniques cannot accomplish. In particular, combining over one-thousand-nanometer near-infrared (OTN-NIR) fluorescence and magnetic resonance (MR) imaging is promising for detecting lesions with high sensitivity and structural information. Herein, we describe the development of a bimodal OTN-NIR/MRI probe from gadolinium-tetraazacyclododecanetetraacetic acid (Gd-DOTA) conjugated poly(lactic-co-glycolic acid)-block-poly(ethylene glycol) copolymer (PLGA-b-PEG) micelle encapsulated IR-1061 at two different locations. One configuration contains Gd-DOTA at the end of the PEG of the hydrophilic shell and the other contains Gd-DOTA at the border of PLGA/PEG. The two structures show remarkable differences in fluorescence and R1 relaxation rates in biological environments; the structure with Gd-DOTA at the border of PLGA/PEG exhibits stable fluorescence and T1 signal distribution in live mice. The introduction ratio of Gd-DOTA to PEG is significant for controlling the properties of both structures; a higher Gd-DOTA ratio is preferable for the contrast enhancement effect. We found that Gd-DOTA ratios higher than 10% degraded the fluorescence intensity when Gd-DOTA was bound to the end of PEG. In contrast, the introduction of 70% Gd-DOTA at the border of PLGA/PEG did not exhibit a degraded signal, and the structural stability was enhanced with higher ratios of Gd-DOTA. In conclusion, we confirmed that the location of Gd-DOTA is a crucial factor in designing high-performance probes. The overall properties improve when Gd-DOTA is set on the border of PLGA/PEG. These improvements in the properties by controlling the probe structures are promising for future biomedical applications.
Introduction
Multimodal imaging has been extensively investigated to develop an accurate diagnostic technique that can detect lesions in the early state or act as guided imaging during surgery.1–8 The combination of magnetic resonance imaging (MRI) and fluorescence imaging (FI) is one of the most widespread platforms that has drawn the attention of researchers.1,3,5,7,9–12 MRI is a non-ionization technique that renders high structural and spatial information with unlimited tissue penetration. However, acquisition by MRI is time-consuming and poses a challenge for on-site imaging-guided applications. In contrast, FI is a rapid and sensitive technique that can dynamically detect variations in a range of seconds. The concerns of shadow images produced by FI, which originate from tissue absorption and scattering, can be alleviated by exploiting near-infrared (NIR) light with wavelengths longer than 1000 nm (OTN).13,14 This combination is achieved by developing bimodal imaging probes.2,3,14Multiple structures have been employed for bimodal OTN-NIR/MRI probes. One of the most prevalent compounds is rare-earth-doped ceramic nanoparticles (RED-CNPs).14,15 The other classes include hybrid structures (i.e., manganese nanoparticles combined with organic dyes and quantum dots with Gd(III) chelates). Organic structures using self-assembly of block copolymers encapsulated fluorescence dye and MRI contrast agents (Gd or Mn ions) have also been investigated.4,5,7,12 However, these structures are relatively large in diameter, particularly >100 nm, which can ignite a response from the reticuloendothelial system (RES) and reduce the circulation lifetime.
Recently, we reported a bimodal OTN-NIR/MRI probe composed of Gd-DOTA conjugated to poly(lactic-co-glycolic acid)-block-poly(ethylene glycol) copolymer (PLGA-b-PEG) micelle encapsulated OTN-NIR dye (IR-1061).2 This structure had a small diameter of ca. 20 nm and exhibited excellent circulation in the first stage. However, this structure became unstable when Gd-DOTA was introduced in a ratio higher than 10%. The structural instability might be caused by Gd-DOTA locations at the end of PEG. Moreover, Gd-DOTA intrinsic characteristics might also affect the structural cohesion and stability in the biological environment.
To clarify the impact of Gd-DOTA spatial distribution on the micelle stability and the durability of OTN-NIR/MRI probes, we designed two structures with the Gd-DOTA distributed at different radial positions. The structures were composed of IR-1061 dye encapsulated in the core of PLGA-b-PEG micelles, and the Gd-DOTA chelate was conjugated either at the end of PEG or at the border of PLGA/PEG. The effect of the ratios and the radial positions of Gd-DOTA on the bimodal properties and stability in the biological environments of imaging probes was investigated. The probes were applied to in vivo imaging using OTN-NIR and MRI. The effects on liver function are also investigated via the level of enzymes excreted in the plasma.
Materials and methods
Reagents
PLGA-b-PEG (Mn = 2000–2000), a carboxyl acid capped PLGA-b-PEG at the ω-end of the PEG chain, PLGA-b-PEG-COOH (Mn = 2000–2000), a carboxyl acid capped PLGA (PLGA-COOH) (Mn = 2000) and a PEG possessing a methoxy group at the α end and an amine group at the ω end (mPEG-NH2) were purchased from Nanosoft Polymers, Winton-Salem, NC, USA. 4-[2-[2-Chloro-3-[(2,6-diphenyl-4H-thiopyran-4-ylidene) ethyl-idene]-1-cyclohexen-1-yl]ethenyl]-2,6-diphenylthiopyrylium tetrafluoroborate (IR-1061), 1-(3-dimethylaminopropyl)-3-ethylcarbo-diimide hydrochloride (EDC), N-hydroxy-succinimide (NHS), 2-(N-morpholino)ethanesulfonic acid (MES), 2-(N-morpholino) ethanesulfonic acid sodium salt (MES sodium salt), bovine serum albumin, deuterated chloroform (CDCl3), deuterated dimethyl sulfoxide-d6 (DMSO-d6) and Sephadex® LH-20 were purchased from Sigma-Aldrich (St Louis, MO, USA). Dichloromethane (DCM), acetonitrile (ACN), diethyl ether, dimethyl sulfoxide (DMSO), hydrochloric acid (HCl), nitric acid (HNO3), and normal mouse serum were purchased from FUJIFILM Wako Pure Chemical Corporation (Osaka, Japan). Normal saline was purchased from Otsuka Pharmaceutical Factory, Inc. (Tokushima, Japan). Gadolinium(III) 1,4,7,10-tetraazacyclodo-decane-1,4,7-tris (acetic acid)-10-(4-aminobutyl)acetamide (Gd-DOTA butylamine) and 1,4,7,10-tetraazacyclododecane-1,4,7-tris(acetic acid)-10-(4-aminobutyl) acetamide (aminobutyl-DOTA) were purchased from Macrocyclics, Inc., Plano (TX, USA). Phosphate buffered saline (PBS) was obtained from Thermo Scientific, Inc. (Waltham, MA, USA). All the reagents were used without further purification.Conjugation of polymers
Micelle preparation
To enhance the stability of the micelles compared with those prepared in the former report, we increased the inter-micellar interaction (core-packing) by increasing the aggregated number of polymers three-fold. | (1) |
Micelle characterization
![[thin space (1/6-em)]](https://www.rsc.org/images/entities/char_2009.gif) :
:![[thin space (1/6-em)]](https://www.rsc.org/images/entities/char_2009.gif) 1 mixture of HCl and HNO3—and shaken overnight prior to measurement.
1 mixture of HCl and HNO3—and shaken overnight prior to measurement.
In vivo imaging
All animal experiments were performed under the approval of our Institutional Animal Care and Use Committee.In vivo OTN-NIR and MR imaging were separately performed. Seven-week-old BALB/c female mice were purchased from Japan SLC, Inc. (Shizuoka, Japan) and used for MRI. For the OTN-NIR imaging, 7-week-old BALB/c female nude mice were procured from Japan SLC, Inc. (Shizuoka, Japan). The mice were fed iVid # 2 (Oriental Yeast Co., Ltd, OYC, Tokyo, Japan) for seven days before in vivo imaging.
The mice were anesthetized with 1–1.5% isoflurane via a nose mask. All mice were intravenously injected with the micelle at 100 μg g−1 body weight (equivalent to 1 mg mL−1 blood volume) via the tail vein.
The OTN-NIR images were acquired at 0, 5, 10, 30, 60, and 90 min post-injection. All MR images were acquired using a 9.4 tesla scanner (BioSpec 94/20 USR; Bruker BioSpin, Ettlingen, Germany). The T1-weighted images were acquired using the Intragate fast low-angle shot (IG-FLASH) pulse sequence before injection and at 90 min post-injection. The scan parameters were as follows: TR = 120 ms, TE = 3.2 ms, FA = 40°, NEX = 1, and the matrix size = 128 × 128. Six coronal slices of the abdomen were acquired with a 1.0 mm thickness and a 1.25 mm gap.
Image analysis
The OTN images were analyzed using the open-source software ImageJ ver. 1.8 (National Institutional Health, Bethesda, MD, USA; available from https://imagej.nih.gov/ij/). The signal intensities were extracted from the regions of interest (ROIs) in the liver, spleen, and blood vessels of the hindlimb, and the temporal variations were evaluated. For image analysis, the average intensity (It) was calculated from the ROI values subtracted from the background (BG) of the intensity threshold (e.g., 30% of black pixels) and plotted as the relative intensity (IR) for each corresponding organ. Subsequently, the plots of the relative intensity for each organ from the OTN-NIR images are as follows.| IR = (It − BG) × (t) | (2) |
The MR images were exported to the Digital Imaging and Communications in Medicine (DICOM) format and imported to ImageJ using the Bio-Formats Importer plugin. Subsequently, the MRI data were analyzed using ImageJ. The ROI values were obtained for the liver, spleen, vena cava, bladder, kidneys, and rectus abdominis muscle. For MR image analysis, the signal intensities of different regions were normalized using the signal intensities of the rectus abdominis muscle. The mean values of the summation ROIs were used to interpret the normalized signal intensities of the corresponding organs. The contrast enhancement effect was simultaneously determined by comparing the signal intensities from the organs.
Plasma biochemical assays
Blood was collected 48 h post-injection before centrifuging at 5000g for 15 min at 4 °C. The collected plasma was used for the biochemical assays. The activities of transaminase (ALT), aspartate aminotransferase (AST), alkaline phosphatase (ALP), and lactate dehydrogenase (LDH) were assayed using the commercial test kits (Wako Pure Chemical Industries, Ltd, Osaka, Japan) following the manufacturer's protocol. The enzyme level reference also used values provided by the supplier.Results
Conjugation, micelle preparation, and characterization of PLP-D and PL-D-P
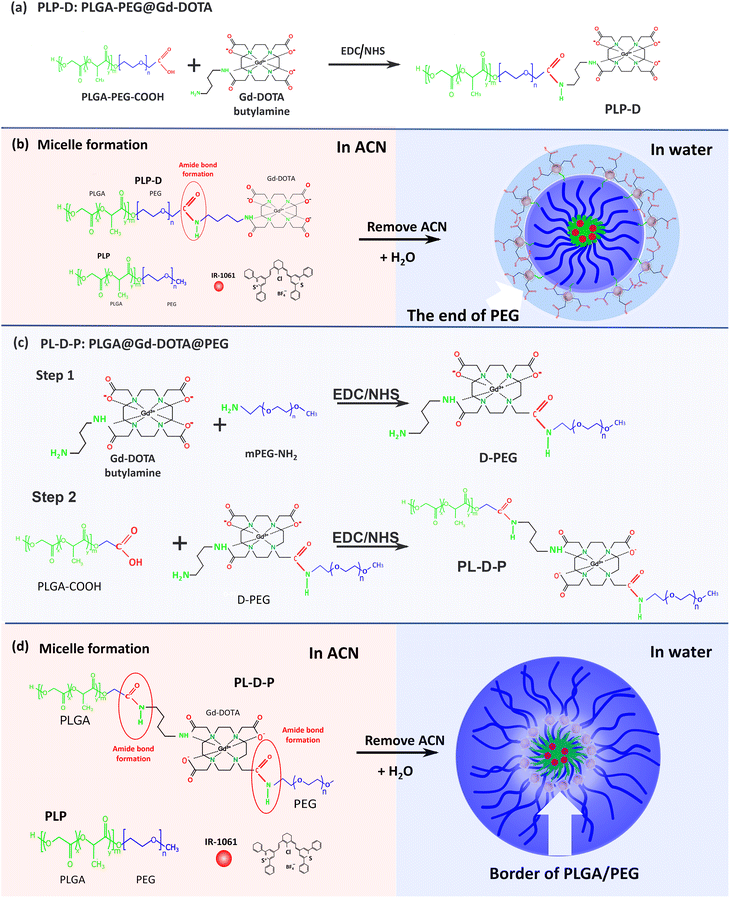
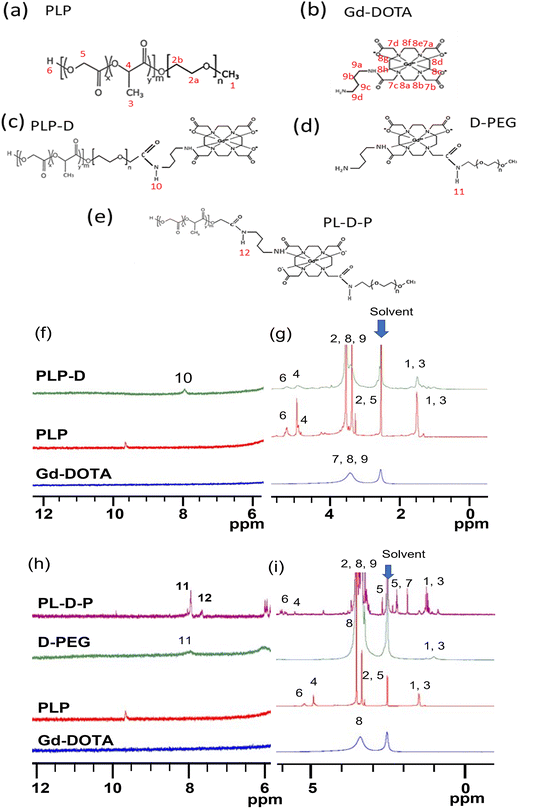
Two types of polymer structures (namely PLP-D and PL-D-P) were synthesized via an amidation reaction using EDC-NHS coupling, and they were used to develop bimodal imaging probes (Fig. 1). PLP-D was synthesized following a procedure previously reported using PLGA-b-PEG-COOH conjugated to an aminated derivative Gd-DOTA. PL-D-P was synthesized in two stages. First, PEG-DOTA was synthesized by amide bond formation between the –COOH groups of DOTA and the –NH2 group of PEG. Second, the amine branch of Gd-DOTA was covalently bound to activate the –COOH of PLGA. Both structures were mixed with PLGA-b-PEG in varying ratios to form micelles.Fig. 2(a–e) depict the structures developed in this work and Fig. 2(f–i) display the corresponding 1H NMR spectra in DMSO6. In Fig. 2(f and g), the spectrum obtained for the PLP-D polymer exhibits distinct peak groups at δ 0.8–1.2 ppm for the –OCH(CH3)CO– of polylactide (PLA), δ 3.1–3.6 ppm for PEG, δ 2.8–3.36 ppm for –CH2 of DOTA, δ 4.2–5.0 ppm for –CH–CH3 and –(CH2O) –H of polyglycolide (PGA), and δ 4.9–5.8 ppm for –CH of PLA, δ 7.8 ppm for –CO–NH (amide) in Fig. 2(f). The Gd-DOTA butylamine exhibits a dominant peak at 3.4 ppm representing the CH2 of the cyclen rings; the broad peak is attributed to the field inhomogeneities induced by the presence of Gd(III). The spectra of D-PEG, PL-D-P, and PLP polymers are shown in Fig. 2(h and i). D-PEG shows distinct peak groups at δ 1.1 ppm for CH3(methoxy PEG), δ 2.8–4.1 ppm for the CH2 cyclen and CH2–COOH of DOTA, and δ 7.8 ppm for the amide bond CO–NH between Gd-DOTA and PEG. Distinctive peaks of PL-D-P include δ 0.8–1.8 ppm for CH3 (methoxy PEG) and CH(CH3)CO (PLA), δ 1.8–2.6 ppm for –CH2COO− (DOTA), δ 3.2–3.8 ppm for CH2 of the cyclen ring of DOTA and n PEG, and δ 4.5–5.5 ppm for CH–CH3 of PGA, δ 7.8 ppm and δ 8.0 ppm for the amide bonds CO–NH between PEG-DOTA and DOTA-PLGA. Those peaks are in accordance with the previous reports of PEG conjugating to Gd-DOTA, PEG, and PLGA compositions, DOTA conjugation compounds, and amide bond formation among the structures.2,17–20 All these peaks confirmed the presence of Gd-DOTA in the PLGA-b-PEG polymer. The synthesis yield and conjugation efficiency are provided in the ESI (S.1).†
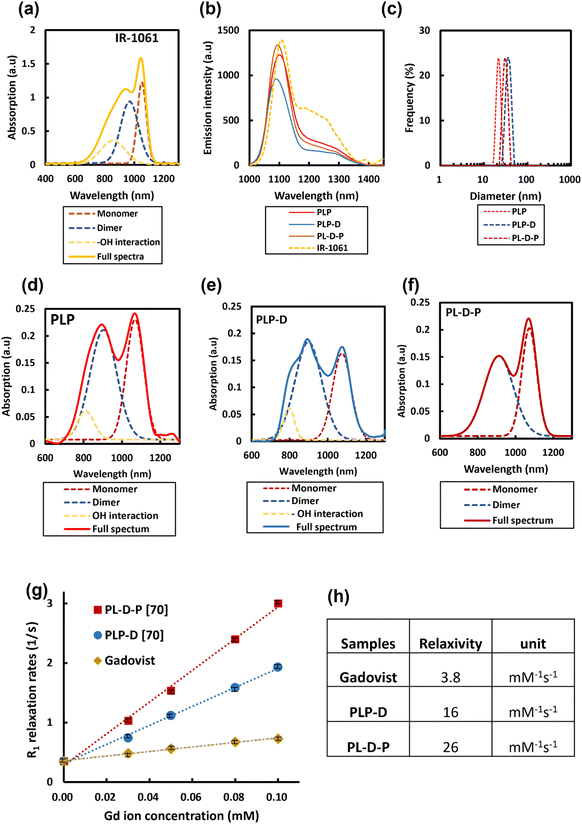
A DOTA molecule possesses quadruple carboxyl groups (–COOH) on its structure.2,17,21 The spatial distribution at a high density of Gd-DOTA molecules can induce the transformation within the structures, thus altering the probe properties in biological environments. The synthesized polymers were mixed with PLGA-b-PEG with varying ratios to form micelles. Micelles having Gd-DOTA at the end of PEGs were named PLP-D and at the border of PLGA/PEG are known as PL-D-P. The fluorescence of IR-1061 depends strongly on the contributing factors such as monomers or dimer formation, as well as the interaction with water (–OH interaction). Free IR-1061 absorbs light with two main peaks at 1060 nm, attributed to the monomers. The absorption peak at 950 nm is attributed to the dimer formation when the dye is aggregated. The peak expands to the left if the dye interacts with the –OH group of water, as shown in Fig. 3(a). The emission of free IR-1061 in ACN and the normalized emission spectra of PLP and the two structures, PLP-D [70] and PL-D-P [70], are shown in Fig. 3(b). All spectra have a distinct emission peak around 1100 nm. According to the DLS results presented in Fig. 3(c), the hydrodynamic diameters of PLP, PLP-D [70], and PL-D-P [70] are 21 nm, 37.5 nm, and 29.8 nm, respectively.
The absorptions of PLP, PLP-D, and PL-D-P micelles share the same distinctions as IR-1061, including two main peaks at 890 and 1060 nm, as shown in Fig. 3(d–f). The monomers are dominant in the absorption spectra of PLP and PL-D-P but it significantly reduces that of PLP-D due to a strong interaction with water, resulting in a broad blue-shift in the 890 nm peak. The absorption spectra were deconvoluted into minor contributors to gain insight into the dye behaviors.
The relaxivities, r1, estimated from the slope of the relaxation rate plot (R1 = 1/T1) as a function of the Gd3+ concentration ranges from 0.0–0.1 mmol L−1 are illustrated in Fig. 3(g and h). The probe relaxivities are 16 mM−1 s−1 for PLP-D [70] and 26 mM−1 s−1 for PL-D-P [70]. The relaxivity of a clinical MRI contrast agent Gadovist® is 3.8 mM−1 s−1.
OTN-NIR fluorescence in the biological environment
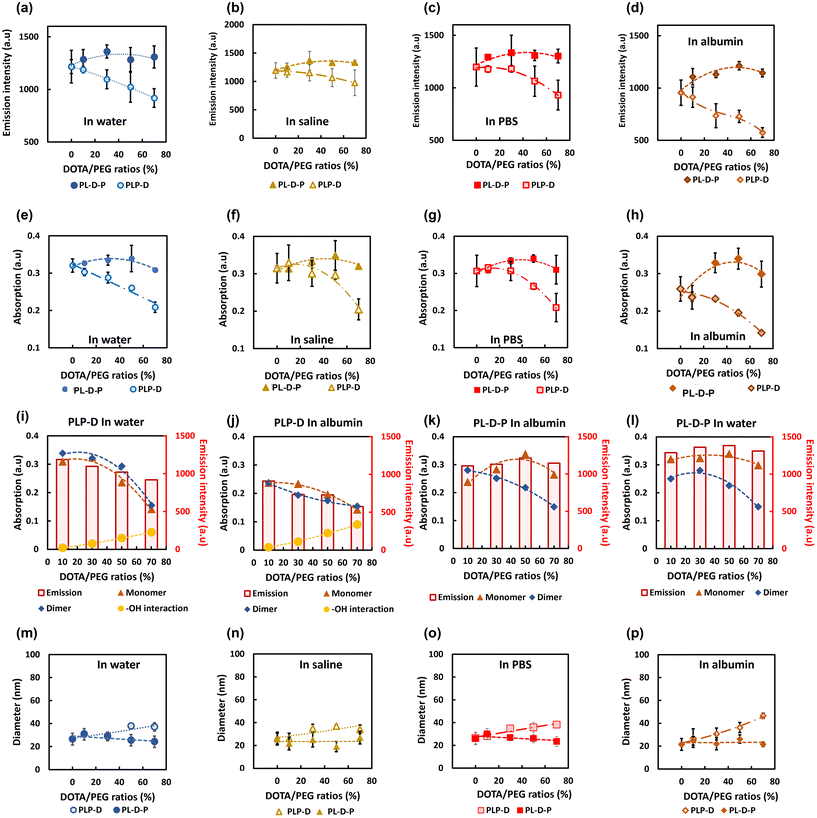
The stability of the samples was evaluated using the simple model introduced in our former report.16 Briefly, the samples were dissolved in four biological media containing multiplex ions and proteins such as water, saline, PBS, and albumin solution to evaluate the effect of Gd-DOTA on the fluorescence properties (Fig. 4). The samples were incubated in each environment for 60 min and then sonicated for 5 minutes before subjecting to the gel filtration column LH-20 to separate the micelle from the environments. The fluorescence intensity (a–d) and the absorption of the monomer (e–h) of the PLP-D and PL-D-P micelles in four media are measured. The percentages of the polymer chains carrying Gd-DOTA substituted PLGA-b-PEG chains used in this study were 0, 10, 30, 50, and 70 [%]. The absorption peaks were deconvoluted into monomer, dimer, and –OH interactions. The influence of each component on the emission intensity is shown in Fig. 4(i–l). Both structures release stable signals in water, saline, and PBS, regardless of the varying Gd-DOTA [%] ratios. The emission intensities of the PLP-Ds strongly depend on the Gd-DOTA ratios; the higher the ratios, the lower the emission intensity. The emission loss due to the introduction of Gd-DOTA is approximately 3% with Gd-DOTA [10] and drops to 25% with Gd-DOTA [70] compared with that of the micelles without Gd-DOTA. Conversely, the emission intensities of PL-D-P are less dependent on the introduction ratios and only a minor difference is observed. The effect of Gd-DOTA locations is more apparent in the coexistence of albumin when the micelles without Gd-DOTA exhibit an emission loss of 22%, PLP-D [10] loss of 25% fluorescence, and PLP-D [70] loss of 53% of fluorescence. In contrast, when Gd-DOTA is located at the border of PLGA/PEG, the emission remained equivalent to the intensity in water at high ratios from PL-D-P [50] onwards.The integrated absorption spectra show the correspondence between the monomer, dimer, and water interaction with the emission intensity of the samples. Furthermore, the absorption in the four media is consistent with the emission. The lower Gd-DOTA ratios of PLP-D maintain their stable absorption, and the higher ratios incline to reduce the absorption. In contrast, the Gd-DOTA ratios show no significant effect on the absorption intensity in the PL-D-P samples. The comparison only uses the absorption peak of the monomers after deconvolution because the monomer peak is the main contributor to the emission.
The DLS is shown in Fig. 4(m–p), wherein the size distribution of all the samples is stable in water, saline, and PBS; however, only the samples with PLP-D [10] are stable in albumin. Meanwhile, all PL-D-P ratios are stable in all four environments.
R1 relaxation rates in biological environments
The relaxivities of the micelles are attributed to the number of the polymer chains bound to the Gd(III) ions; consequently, the relaxation per micelle is inextricably attached to the stability of the structure. To better understand the impact of the Gd-DOTA ratio and location, we investigated the relaxation rates in water after incubating in PBS and mouse serum. Typically, relaxivity is used to mean the R1 per specific concentration of the Gd ion. However, the meaning is different in this study; the term is used to describe R1 performance/micelle. The relaxation rates increase linearly with Gd-DOTA ratios in the case of PLP-D. However, the R1 values rapidly increase as a power function as the ratios are higher than 30% in the case of PL-D-P. Both structures are stable in water regardless of the ratio. The reduction in relaxation rates is attributed to the leakage of the polymer chains bound to Gd-DOTA during the interaction with mouse serum. The structures were incubated in mouse serum at varying intervals up to 90 min and filtered to eliminate the polymer chains adhered to the plasma proteins.The R1 relaxation rates depending on the Gd-DOTA ratios are shown in Fig. 5(a and b), and the reduction of the relaxation rates in mouse serum is shown in Fig. 5(c). The relaxation rates of PLP-D and PL-D-P are stable in water and PBS regardless of the ratios. In mouse serum, after 60 min of incubation, the relaxation rate of PLP-D [70] reduced by 34% and that of PL-D-P [70] reduced by approximately 3.4%. Up to 90 min, the reduction is 36% for PLP-D [70] and 10% for PL-D-P [70], respectively.
Role of Gd(III) ions on micellar stability
To better understand the mechanism of PLGA/PEG rigidification due to the presence of Gd-DOTA, we prepared an alternative structure containing DOTA at the border of PLGA/PEG, excluding Gd(III) ions (PL-N-P). The results reveal that PL-N-P induces a higher dye load in the core, resulting in a stronger emission and absorption; however, the fluorescence loss in the albumin solution is higher than PL-D-P. The comparison of the optical properties of two structures in water and albumin is shown in ESI (S.2).†In vivo OTN-NIR imaging
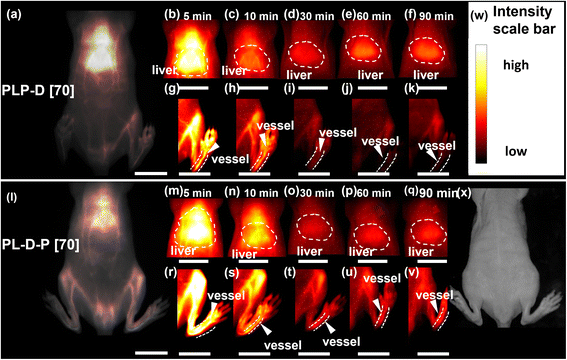
To investigate the effect of the spatial distribution of Gd-DOTA on the probe circulation and accumulation in vivo, we prepared two probes with a ratio of 70%, namely PLP-D [70] and PL-D-P [70]. The OTN-NIR and MRI experiments were independently performed to evaluate the different behaviors of the probes.The OTN-NIR images of mice using PLP-D [70] and PL-D-P [70] are displayed in Fig. 6(a–k) and (l–v), respectively. Fig. 6(a) and (l) represent the OTN-NIR images of mice injected with PLP-D [70] and PL-D-P [70], respectively. The signals in the liver and blood vessels were recorded at 5, 10, 30, 60, and 90 min using PLP-D [70] (b–k) and PL-D-P [970] (m–v). The mice intensity scale bar and bright field image are shown in (w) and (x). The fluorescence from both structures is very bright to depict the blood vessels and localize the liver in the first 10 min. Later, the fluorescence signal decreases in the liver and blood vessels, and until 30 min, the PLP-D [70] fluorescence signal increases in the liver and decreases in the blood vessels for up to 90 min. In contrast, PL-D-P [70] exhibits a stable fluorescence in the blood vessels and liver until the end of the experiments.
In vivo MR imaging
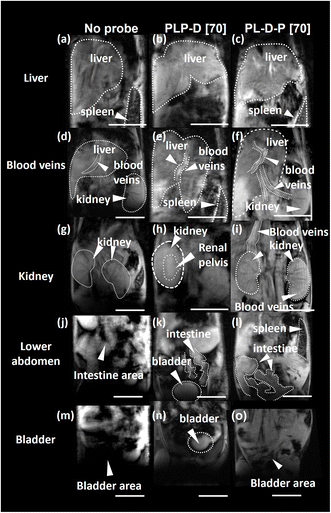
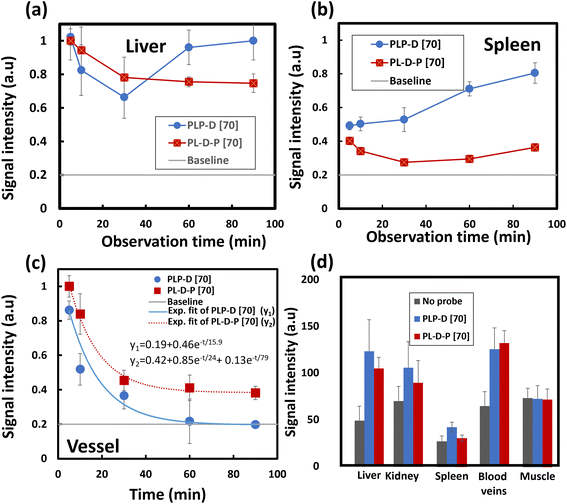
Fig. 7 shows the representative pre-contrast MR images of mice for comparison (Fig. 7a, d, g, j, and m) and at 90 min post-injection of either PLP-D [70] (Fig. 7b, e, h, k, and n) or PL-D-P [70] (Fig. 7c, f, i, l, and o). Five different slice levels are shown to observe the signal intensity of the liver, spleen, kidney, intestine, and blood vessels. The ROIs from the liver, spleen, kidney, and blood vessels are shown as dotted lines. The signal intensity in the rectus abdominis muscle was used as the internal standard when comparing the signal intensities of these organs. The MR images of the mice receiving either bimodal probe exhibit a strong enhancement effect so that the different organs such as livers, kidneys, spleens, intestine, and blood vessels can be clearly discerned. Notably, in the case of PLP-D, the liver, renal pelvis, and bladder exhibit high signal intensities. In contrast, the mice injected with PL-D-P [70] exhibit bright signals in the liver, blood vessels, intestine, and spleen. In the kidneys, the signal can be seen only in the posterior area, composed of interlobular arteries and veins inside the kidneys. In particular, no signal was observed in the pelvis, implying that the structure does not penetrate through the glomerular capillary walls and excrete into the urine but returns to the circulation system. Ultimately, no signal was observed in the bladder.The variation in the ROI values due to time in the OTN-NIR images of the liver, spleen, and blood vessels of the mice injected with PLP-D [70] and (b) PL-D-P [70] is presented in Fig. 8(a–c), respectively. The signals for the liver of both structures exhibit a maximum intensity at 5 min post-injection and reduce rapidly during the first 30 min post-injection (a); the signal from PLP-D [70] increases again in the liver. The signal of PL-D-P [70] remains stable until the end of the observation. The same trend is observed for the spleen with a signal increase in the spleens of the mice injected with PLP-D [70] and the signals being stable in the spleens of mice injected with PL-D-P [70]. In the blood vessels, fluorescence reduction is described by a single exponential decay (PLP-D [70]) and double exponential decay (PL-D-P [70]), respectively. The reduction of fluorescence intensity is partly involved in metabolizing the structure in the blood vessel or excretion from the liver or spleen. Other parts evade the harmful effects of the plasma proteins and continue to circulate inside the bodies. The MRI signal intensity from the ROI values of the different organs is shown in Fig. 8(d); the results showed that the signal from PLP-D [70] is high in the livers, spleens, and kidneys; in contrast, the signal from PL-D-P [70] is high in the blood vessels and slightly reduced in the spleen.
Liver function tests
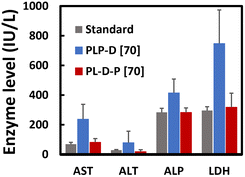
We analyzed the elevated level of enzyme being released into the blood to evaluate the possible damage to hepatocytes caused by the imaging probes. The results showed that PLP-D [70] induces a significant release of AST, ALT, ALP, and LDH, exceeding the average values to maintain healthy liver functions (Fig. 9). The enzyme levels in the mice injected with PL-D-P [70] remain comparable with the standard range except for a slight increase in the AST level.Discussion
A Gd-DOTA molecule contains a macrocycle cyclen ring with four nitrogen atoms coordinated to a Gd(III) ion and binds to four acetic acid groups. Four oxygen atoms on the acetic acid arms coordinate to the Gd(III) chiral center.22,23 After conjugation to the end of PEG, the other oxygen donor atoms remained as the donors in the structures, except for those participating in the amide bond formation.22 Inside micelles, the hydrophobic chains are dense and the Gd-DOTA molecules attached to the polymer chains are arranged into a layer with a close-packed distribution. The infinitesimal distance between Gd-DOTA may cause an increase in the Coulomb interaction between the Gd(III) ion center and the oxygen donor of the adjacent DOTA, consequently forming cross-coordination networks among the Gd-DOTA molecules. When the Gd-DOTA molecules are distributed at different locations in the micelles, these cross-coordination arrangements affect their properties in different ways.Effect of Gd-DOTA spatial distribution on the probe characteristics
The diameter of nanostructures is one of the primary factors for evading RES identification, avoiding fast renal clearance, and elongating the circulation.24–27 The diameters of the bimodal imaging probes are approximately 30 nm (PLP and PL-D-P) and 40 nm (PLP-D). These values are within the threshold to be neglected by RES recognition or renal filtration.24,26,28IR-1061 exhibits emission at 1100 nm in ACN and inside the PLGA core.29 The dye distribution and the surrounding environment are represented in the absorption spectrum by a major band at 1064 nm, which is generally related to the monomer distribution inside the core. In addition, the absorption shoulder around 850–900 nm is caused by the dimer formation, and the blue shift toward 800 nm indicates an –OH interaction between the dye and the water molecules at the interface.16,29,30 A noticeable blue shift around 800 nm in the absorption spectrum of the micelle with Gd-DOTA is located at the end of PEG causing derivatization from the highly polarized and hydrophilic structure of DOTAs, those tend to attract water molecules toward its body. Consequently, absorption by the monomer decreases, resulting in the reduction of fluorescence emission compared with the other structures. In contrast, when Gd-DOTA is located at the border of PLGA/PEG, the absorption spectrum reveals no effect of the –OH interaction. The electrostatic repulsion between carboxylate ions (–COO−) is repressed by the aggregates of heavy PLGA-chains on the inner side and PEG chains on the outer side. The cross-coordination can form a shield-like layer at the border of PLGA/PEG that prevents water or external molecules from intervening and damaging the fluorescence properties.
In this work, the relaxometry was performed at 3T, and the relaxivity of PLP-D[70] was 16 mM−1 s−1 and PL-D-P [70] was 26 mM−1 s−1.31–33 The relaxivities of the micelle structures display higher values than those of small molecules such as Gadovist® (3.8 mM−1 s−1). The enhancement of r1 relaxivities is attributable primarily to the repression of the global rotational motions when the Gd(III) chelates are conjugated to high molecular relaxivity reagents such as polymers in micellar structures.6,20,31,34–37 This enhancement is related to the number of acetate groups of DOTA substituted by polymer chains enhancing the structure stability and kinetically inert manner compared to that of Gd chelates resulting in the elongated rotation time τr.
Effect of Gd-DOTA spatial distribution on probe stability in biological environments
PLGA-b-PEG has a solubility parameter compatible with IR-1061; therefore, PLGA-b-PEG encapsulated IR-1061 micelle showed a stable circulation and the ability to evade the RES capture.30 The stability of the two structures was evaluated in water, saline, PBS, and albumin solution. The OTN-NIR properties are stable in water, saline, and PBS in both structures. In albumin, the interaction between the structure with water and protein molecules becomes more apparent, as seen in the absorption of the micelle components. The increasing water interaction due to the introduction ratios of Gd-DOTA at the end of PEG results in fluorescence reduction. Conversely, when Gd-DOTA distributes at the border of PLGA/PEG, the interaction with water is eliminated and the fluorescence is preserved.Generally, the relaxivities depend strongly on the Gd(III) ion concentrations; the relaxation rates are acquired using free chelates or multinuclear Gd(III) macromolecules that have a large distance between Gd(III) ions. Therefore, the enhancement of relaxation rates depending on Gd ion concentration is displayed as a linear function. In this work, we demonstrated the dependence of relaxation rates on the locations of Gd(III) chelates inside the micellar structures; the relaxivities are contributed by additional factors such as polymer chain density, length, water accessibility, or distribution of Gd(III) ions; more specifically, the distance between Gd(III) ions. When an enormous number of Gd-DOTA are arranged in a closed-packed plane at the border of PLGA/PEG, the distance between Gd(III) ions becomes extremely small due to the pressure of aggregate polymer chains. The behavior of a paramagnetic center Gd(III) ion is enhanced by the adjacent ions. Moreover, water accessibility is easier because the Gd-DOTA is conjugated at the root of the hydrophilic PEG chains. This phenomenon explains why at ratios lower than 30% of Gd-DOTA, the relaxation rate enhancement is linearly proportional, but from 50 to 70%, the enhancement occurs as a power function. This result concurs with the previous report of internalized Gd(III) chelates on the surface of nanoparticles.6 The same effect was not observed with Gd-DOTA at the end of PEG because of the large distance between Gd-DOTA.
On the other hand, the stability of the structure is improved with higher Gd-DOTA ratios because the Coulomb interaction is formed between a strong positive Gd(III) charge of one molecule and multiple negative charges from oxygen donors of the other DOTA distributed at an infinitesimal distance surrounding. The cross-coordination rigidifies the border of PLGA/PEG and makes them more stable under the dynamic mobility of plasma proteins. This effect becomes more apparent when Gd(III) centers are absent from the structures. The loss of fluorescence is more considerable as shown in the ESI (S.2).†
Effect of Gd-DOTA spatial distribution on the probe cohesive during circulation and their RES evasion
The OTN-NIR images of the mice injected with both structures show a well-circulating early stage attributed to the small-diameter structure. After 10 min, the probes were delivered into the smaller vessels throughout the body, leading to a decreased signal intensity in the large blood vessels and the livers.The difference in signal loss between the two structures is attributed to the different pharmacokinetic manners. The probe with Gd-DOTA at the end of PEG exhibits a faster decay in the blood caused by the adsorption between polymer chains bound to Gd-DOTA under interaction with plasma proteins. The structure forms large aggregates, as shown in the DLS results, which were captured in the liver. In contrast, Gd-DOTA at the border of PLGA/PEG decays with a double exponential function and exhibits a stable fluorescence signal in the blood vessels and the liver. The recession of Gd-DOTA toward the core preserves the PEG shell integrin and helps the structure to evade RES recognition. The presence of Gd-DOTA with a high density rigidifies the core against the effect of the external environment, thus reducing the fluorescence loss inside the body.
Usually, the filtration membrane in the kidneys and pelvis allows only structures smaller than 10 nm to leak into the urine and bladder.38–41 When Gd-DOTA is located at the end of PEG, the structure is either degraded and some polymer chains with Gd-DOTA were extracted out of the micelles and cleared out of the bloodstream or interacted with plasma proteins inducing large aggregates and rapidly accumulating in the liver. MRI showed strong contrast enhancement signals in both the liver and bladder, which can be attributable to the degradability of the structure. However, as the Gd-DOTA receded to the border of PLGA/PEG, no signal was observed in the kidneys or bladder, but a remarkable contrast was depicted in the vena cava or other blood veins. These data indicate that the structures had increased systemic circulation time and stability.
The liver function test exhibits the temporal damage the probe can cause to the liver.42,43 The high accumulation of the PEG end binding Gd-DOTA in the liver increases the hepatic enzymes. Four target enzyme levels show values remarkably higher than the normal range.44–48 The injuries are alleviated when Gd-DOTA recedes to the border of PLGA/PEG. The structure is covered by a biocompatible PEG shell that can avoid damage to the internal organs during circulation. Further preclinical assessment experiments must be carefully conducted to assess the long-term effect of the probe on the internal organs.
Conclusions
In this paper, the nanostructure design of polymer micelles based on PLGA-b-PEG is introduced with an OTN-NIR fluorescent dye and Gd-DOTA as a bimodal, OTN-NIR fluorescence, and MRI imaging probe. The focus of this study was to compare the two locations of Gd-DOTA, that is, either on the border of PLGA/PEG (series B) or the end of the PEG chain (series E).We found that the series B samples exhibited much higher stability than the series E samples with regard to the stability of fluorescence intensity and MR signal distribution in live mice.
For controlling the properties of the probe, the introduction number ratio of Gd-DOTA to PEG is found to be important for both series of samples. Generally, for expecting a high performance of Gd-DOTA, in contrast, it is better to make the ratio higher. For the series E samples, however, an increase in the ratio of more than 10% seriously degraded the fluorescence intensity and stability. On the other hand, in the cases of series B, a ratio of 70% did not degrade these properties. An interesting finding was that the stability was improved by increasing the ratio. Furthermore, T1 obvious relaxivity per micelle was enhanced by increasing the ratio.
It was proven that the location of Gd-DOTA in the nanostructure is important for designing high-performance probes. The overall properties were improved by setting the Gd-DOTA on the border of the PLGA and PEG. The improved nanostructure probes are expected to be used for bio and medical applications in the future.
Author contributions
K. S. and T. K. D. D. devised the experimental concept. K. S. and H. F. directed the project and developed the procedures. T. K. D. D., M. U., K. O., M. K., and M. Y. performed the experiments and analyzed the data. T. K. D. D., M. U., and K. O. wrote the manuscript. All the authors contributed to the discussion of the project.Conflicts of interest
The National Cancer Center has a collaboration contract with Canon Medical Systems Corporation. This company provided a research fund and a 3 T whole body MRI scanner under this research contract.Acknowledgements
This study was financially supported by the Japan Society for the Promotion of Science (JSPS) (Grant numbers: 19H01179 and 21K15577), the Japan Science and Technology Agency (JST) (COINS; Grant number: JPMJCE1305), the National Cancer Center through the Research and Development Fund (Grant number: 31-A-11) and the Superhuman Medical Care Project. Mr Hitoshi Kanazawa and Ms Sachiko Isono gave useful advice on the experiment using the MRI scanner. We thank Dr Syuuhei Komatsu from the Tokyo University of Science for the NMR measurements and Mr Mizuki Akatsuka from the National Cancer Center for acquiring the MRI of phantoms.References
- T. K. D. Doan, in Transparency in Biology: Making the Invisible Visible, ed. K. Soga, M. Umezawa and K. Okubo, Springer Singapore, Singapore, 2021, pp. 223–263, DOI:10.1007/978-981-15-9627-8_11.
- T. K. D. Doan, M. Umezawa, K. Ohnuki, K. Nigoghossian, K. Okubo, M. Kamimura, M. Yamaguchi, H. Fujii and K. Soga, Biomater. Sci., 2022, 10, 1217–1230 RSC.
- V. S. Harrison, C. E. Carney, K. W. MacRenaris, E. A. Waters and T. J. Meade, J. Am. Chem. Soc., 2015, 137, 9108–9116 CrossRef CAS PubMed.
- X. Hu, Y. Tang, Y. Hu, F. Lu, X. Lu, Y. Wang, J. Li, Y. Li, Y. Ji, W. Wang, D. Ye, Q. Fan and W. Huang, Theranostics, 2019, 9, 4168–4181 CrossRef CAS PubMed.
- J. J. Ma, M. X. Yu, Z. Zhang, W. G. Cai, Z. L. Zhang, H. L. Zhu, Q. Y. Cheng, Z. Q. Tian and D. W. Pang, Nanoscale, 2018, 10, 10699–10704 RSC.
- V. S. Marangoni, O. Neumann, L. Henderson, C. C. Kaffes, H. Zhang, R. Zhang, S. Bishnoi, C. Ayala-Orozco, V. Zucolotto, J. A. Bankson, P. Nordlander and N. J. Halas, Proc. Natl. Acad. Sci. U. S. A., 2017, 114, 6960–6965 CrossRef CAS PubMed.
- J. Shi, X. Sun, S. Zheng, J. Li, X. Fu and H. Zhang, Biomaterials, 2018, 152, 15–23 CrossRef CAS PubMed.
- T. K. D. Doan, M. Umezawa, K. Nigoghossian, G. Yeroslavsky, K. Okubo, M. Kamimura, M. Yamaguchi, H. Fujii and K. Soga, J. Photopolym. Sci. Technol., 2020, 33, 117–122 CrossRef.
- N. Chen, C. Shao, S. Li, Z. Wang, Y. Qu, W. Gu, C. Yu and L. Ye, J. Colloid Interface Sci., 2015, 457, 27–34 CrossRef CAS PubMed.
- P. Wang, Y. Fan, L. Lu, L. Liu, L. Fan, M. Zhao, Y. Xie, C. Xu and F. Zhang, Nat. Commun., 2018, 9, 2898–2908 CrossRef PubMed.
- R. Yan, Y. Hu, F. Liu, S. Wei, D. Fang, A. J. Shuhendler, H. Liu, H.-Y. Chen and D. Ye, J. Am. Chem. Soc., 2019, 141, 10331–10341 CrossRef CAS PubMed.
- H. Zhou, H. Yang, L. Tang, Y. Wang, Y. Li, N. Liu, X. Zeng, Y. Yan, J. Wu, S. Chen, L. Xiao, Y. Yu, Z. Deng, H. Deng, X. Hong and Y. Xiao, J. Mater. Chem. C, 2019, 7, 9448–9454 RSC.
- K. Soga, in Transparency in Biology: Making the Invisible Visible, ed. K. Soga, M. Umezawa and K. Okubo, Springer Singapore, Singapore, 2021, pp. 3–32, DOI:10.1007/978-981-15-9627-8_1.
- T. K. D. Doan, S. Fukushima, T. Furukawa, H. Niioka, T. Sannomiya, K. Kobayashi, H. Yukawa, Y. Baba, M. Hashimoto and J. Miyake, Nanomaterials, 2016, 6, 163–180 CrossRef PubMed.
- K. Okubo, R. Takeda, S. Murayama, M. Umezawa, M. Kamimura, K. Osada, I. Aoki and K. Soga, Sci. Technol. Adv. Mater., 2021, 22, 160–172 CrossRef CAS PubMed.
- T. K. D. Doan, M. Umezawa, H. Kobayashi, A. Oshima, K. Ikeda, K. Okubo, M. Kamimura and K. Soga, Chem. Lett., 2022, 51, 208–211 CrossRef.
- A. Fontes, S. Karimi, L. Helm, P. M. Ferreira and J. P. André, Eur. J. Inorg. Chem., 2015, 2015, 4798–4809 CrossRef CAS.
- M. Marimuthu, D. Bennet and S. Kim, Polym. J., 2013, 45, 202–209 CrossRef CAS.
- T. Liu, X. Li, Y. Qian, X. Hu and S. Liu, Biomaterials, 2012, 33, 2521–2531 CrossRef CAS.
- F. Kielar, L. Tei, E. Terreno and M. Botta, J. Am. Chem. Soc., 2010, 132, 7836–7837 CrossRef CAS PubMed.
- C. Kojima, B. Turkbey, M. Ogawa, M. Bernardo, C. A. Regino, L. H. Bryant Jr., P. L. Choyke, K. Kono and H. Kobayashi, Nanomedicine, 2011, 7, 1001–1008 CrossRef CAS PubMed.
- J. P. André, É. Tóth, H. Fischer, A. Seelig, H. R. Mäcke and A. E. Merbach, Chem. – Eur. J., 1999, 5, 2977–2983 CrossRef.
- D. Meyer, M. Schaefer and B. Bonnemain, Invest. Radiol., 1988, 23, S232–S235 CrossRef CAS PubMed.
- I. Alberg, S. Kramer, M. Schinnerer, Q. Hu, C. Seidl, C. Leps, N. Drude, D. Mockel, C. Rijcken, T. Lammers, M. Diken, M. Maskos, S. Morsbach, K. Landfester, S. Tenzer, M. Barz and R. Zentel, Small, 2020, 16, e1907574 CrossRef PubMed.
- W. Xiao and H. Gao, Int. J. Pharm., 2018, 552, 328–339 CrossRef CAS PubMed.
- X. Liu, N. Huang, H. Li, Q. Jin and J. Ji, Langmuir, 2013, 29, 9138–9148 CrossRef CAS PubMed.
- L. Shang, K. Nienhaus and G. U. Nienhaus, J. Nanobiotechnol., 2014, 12, 5 CrossRef PubMed.
- S. D. Li and L. Huang, Biochim. Biophys. Acta, 2009, 1788, 2259–2266 CrossRef CAS.
- M. Umezawa, M. Haruki, M. Yoshida, M. Kamimura and K. Soga, Anal. Sci., 2021, 37, 485–490 CrossRef CAS PubMed.
- Y. Ueya, M. Umezawa, Y. Kobayashi, H. Kobayashi, K. Ichihashi, T. Matsuda, E. Takamoto, M. Kamimura and K. Soga, ACS Nanosci. Au, 2021, 1, 61–68 CrossRef CAS.
- L. Leone, L. Guarnieri, J. Martinelli, M. Sisti, A. Penoni, M. Botta and L. Tei, Chem. – Eur. J., 2021, 27, 11811–11817 CrossRef CAS PubMed.
- T. J. Clough, L. Jiang, K. L. Wong and N. J. Long, Nat. Commun., 2019, 10, 1420 CrossRef PubMed.
- M. Grogna, R. Cloots, A. Luxen, C. Jérôme, J.-F. Desreux and C. Detrembleur, J. Mater. Chem., 2011, 21, 12917–12926 RSC.
- S. Dumas, V. Jacques, W. C. Sun, J. S. Troughton, J. T. Welch, J. M. Chasse, H. Schmitt-Willich and P. Caravan, Invest. Radiol., 2010, 45, 600–612 CrossRef CAS PubMed.
- L. Leone, G. Ferrauto, M. Cossi, M. Botta and L. Tei, Front. Chem., 2018, 6, 158 CrossRef PubMed.
- J. B. Livramento, L. Helm, A. Sour, C. O'Neil, A. E. Merbach and E. Toth, Dalton Trans., 2008, 2008, 1195–1202 RSC.
- C. Robic, M. Port, O. Rousseaux, S. Louguet, N. Fretellier, S. Catoen, C. Factor, S. Le Greneur, C. Medina, P. Bourrinet, I. Raynal, J. M. Idee and C. Corot, Invest. Radiol., 2019, 54, 475–484 CrossRef CAS PubMed.
- C. H. J. Choi, J. E. Zuckerman, P. Webster and M. E. Davis, Proc. Natl. Acad. Sci. U. S. A., 2011, 108, 6656–6661 CrossRef CAS PubMed.
- H. S. Choi, W. Liu, P. Misra, E. Tanaka, J. P. Zimmer, B. I. Ipe, M. G. Bawendi and J. V. Frangioni, Nat. Biotechnol., 2007, 25, 1165–1170 CrossRef CAS.
- M. Longmire, P. L. Choyke and H. Kobayashi, Nanomedicine, 2008, 3, 703–717 CrossRef CAS.
- M. Werle and A. Bernkop-Schnurch, Amino Acids, 2006, 30, 351–367 CrossRef CAS PubMed.
- B. K. Gaiser, S. Hirn, A. Kermanizadeh, N. Kanase, K. Fytianos, A. Wenk, N. Haberl, A. Brunelli, W. G. Kreyling and V. Stone, Toxicol. Sci., 2012, 131, 537–547 CrossRef.
- A. Kermanizadeh, L. G. Powell and V. Stone, J. Toxicol. Environ. Health, Part B, 2020, 23, 137–176 CAS.
- D. P. Fernandes, M. M. L. Pimentel, F. A. D. Santos, E. A. Praxedes, P. D. Brito, M. A. Lima, I. Lelis, M. F. Macedo and M. B. Bezerra, An. Acad. Bras. Cienc., 2018, 90, 3941–3948 CrossRef CAS PubMed.
- S. D. Harrison Jr., J. A. Burdeshaw, R. G. Crosby, A. M. Cusic and E. P. Denine, Cancer Res., 1978, 38, 2636–2639 CAS.
- C. Mazzaccara, G. Labruna, G. Cito, M. Scarfo, M. De Felice, L. Pastore and L. Sacchetti, PLoS One, 2008, 3, e3772 CrossRef PubMed.
- G. Silva-Santana, J. C. Bax, D. C. S. Fernandes, D. T. L. Bacellar, C. Hooper, A. Dias, C. B. Silva, A. M. de Souza, S. Ramos, R. A. Santos, T. R. Pinto, M. A. Ramao and A. L. Mattos-Guaraldi, Anim. Models Exp. Med., 2020, 3, 304–315 CrossRef.
- Japan, SLC Inc., Laboratory animals, BALB/cCrSlc, https://www.jslc.co.jp/pdf/mouse/003_BALBc2013.pdf.
Footnote |
| † Electronic supplementary information (ESI) available. See DOI: https://doi.org/10.1039/d2bm01213h |
| This journal is © The Royal Society of Chemistry 2022 |

