mRNA-carrying lipid nanoparticles that induce lysosomal rupture activate NLRP3 inflammasome and reduce mRNA transfection efficiency

James Forster III a, Dipika Nandi ab and Ashish Kulkarni *abc
aDepartment of Chemical Engineering, University of Massachusetts, Amherst, Massachusetts 01003, USA. E-mail: akulkarni@engin.umass.edu
bDepartment of Veterinary and Animal Sciences, University of Massachusetts, Amherst, Massachusetts 01003, USA
cCenter for Bioactive Delivery, Institute for Applied Life Sciences, University of Massachusetts, Amherst, Massachusetts 01003, USA

Received 3rd June 2022 , Accepted 27th July 2022

First published on 9th August 2022


Abstract

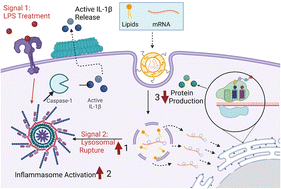
In the last several years, countless developments have been made to engineer more efficient and potent mRNA lipid nanoparticle vaccines, culminating in the rapid development of effective mRNA vaccines against COVID-19. However, despite these advancements and materials approaches, there is still a lack of understanding of the resultant immunogenicity of mRNA lipid nanoparticles. Therefore, a more mechanistic, design-driven approach needs to be taken to determine which biophysical characteristics, especially related to changes in lipid compositions, drive nanoparticle immunogenicity. Here, we synthesized a panel of six mRNA lipid nanoparticle formulations, varying the concentrations of different lipid components and systematically studied their effect on NLRP3 inflammasome activation; a key intracellular protein complex that controls various inflammatory responses. Initial experiments aimed to determine differences in nanoparticle activation of NLRP3 inflammasomes by IL-1β ELISA, which unveiled that nanoparticles with high concentrations of ionizable lipid DLin-MC3-DMA in tandem with high cationic lipid DPTAP and low cholesterol concentration induced the greatest activation of the NLRP3 inflammasome. These results were further corroborated by the measurement of ASC specks indicative of NLRP3 complex assembly, as well as cleaved gasdermin-D and caspase-1 expression indicating complex activation. We also uncovered these activation profiles to be mechanistically correlated primarily with lysosomal rupturing caused by the delayed membrane disruption capabilities of ionizable lipids until the lysosomal stage, as well as by mitochondrial reactive oxygen species (ROS) production and calcium influx for some of the particles. Therefore, we report that the specific, combined effects of each lipid type, most notably ionizable, cationic lipids, and cholesterol, is a crucial mRNA lipid nanoparticle characteristic that varies the endo/lysosomal rupture capabilities of the formulation and activate NLRP3 inflammasomes in a lysosomal rupture dependent manner. These results provide a more concrete understanding of mRNA lipid Nanoparticle-Associated Molecular Patterns for the activation of molecular-level immune responses and provide new lipid composition design considerations for future mRNA-delivery approaches.

Introduction

The adaptation of lipid nanoparticles as mRNA nanocarriers has become one of the most profound advancements in developing new vaccines. The efficient encapsulation, release, and transfection of mRNA allows for more potent, sustained antigen production, as has been seen in the expanded protection exhibited by the COVID-19 vaccines.1 In general, mRNA lipid nanoparticles are formulated with five main lipid components. The first and most crucial are ionizable lipids, bioactive molecules with tertiary amine heads that ionize at the low pH of early endosomes, allowing endosomal membrane fusion and mRNA release.2,3 Phospholipids and cholesterol are used to aid in nanoparticle formation, usually in high molar ratios, to allow for stable, rapid supramolecular assembly.2–5 Cholesterol has also been suggested to induce nanoparticle fusion with the endosome and mRNA escape.6–8 In some approaches, permanently cationic lipids are also utilized, further aiding in endosomal fusing, and have also been shown to induce tissue-specific biodistribution in vivo.3,9 Finally, shielding lipids, usually modified with PEG chains, allow for greater circulation and shielding from non-specific protein interactions but are usually included in a lower molar ratio.3,10–14 In recent years, many advancements have been made to each of these components and their relative concentrations, allowing more efficient endosomal escape, which has proven to be an important hurdle in developing potent, effective mRNA delivery systems.2,4,5 For example, a study by Patel et al. discerned that formulating lipid nanoparticles with naturally occurring cholesterol analogues, such as β-sitosterol, increased mRNA transfection percent 6000-fold.5 Additionally, Liu et al. developed cone-shaped ionizable phospholipids to increase endosomal escape while concurrently controlling the biomimetics and organ biodistribution of the nanoparticle.4 In addition, mRNA lipid nanoparticle research continues to engineer new formulations with diverse biophysical characteristics in this manner, improving endosomal escape and tailoring the delivery systems for disease and tissue-specific applications.

It is concurrently being elucidated that along with endosomal escape, nanoparticle biophysical characteristics also play an essential role in the resultant activation of cellular stress and damage signals that induce immunogenicity via inflammasomes. One of the most widely studied inflammasomes, the NLRP3 inflammasome, is a multimeric protein complex that forms as a response to various stress and damage signals in innate immune cells.15–19 NLRP3 inflammasomes are activated in a dual-signal process. In signal 1, lipopolysaccharide (LPS), which is found in the cell walls of Gram-negative bacteria, is sensed by cell signaling complexes such as toll-like receptor 4 on the surface of macrophages, resulting in the downstream activation of NF-κB transcription factor, inducing the production of inactive proteins involved in the NLRP3 inflammasome complex, including NOD-, LRR- and pyrin domain-containing protein 3 (NLRP3) (Fig. 1A–C). In signal 2, cellular stress indicators such as mitochondrial reactive oxygen species production (ROS), calcium influx, and lysosomal rupture induce signaling pathways resulting in conformational changes to the inactive proteins, resulting in the complexation of the inflammasome (Fig. 1D and E). The complex then converts pro-caspase-1 into its active form, which cleaves pro-IL-1β and activates GSDMD to allow IL-1β release in an immunogenic cell death process known as pyroptosis (Fig. 1F–H).15–19 It has been discovered that nanoparticles can activate signal 2 and induce NLRP3 inflammasome activation, wherein Nanoparticle-Associated Molecular Patterns (NAMPs) such as size, material, charge, and hydrophobicity determine the strength of activation.15,20–24 Previous literature has elucidated that individual mRNA lipid nanoparticle components are able to activate inflammasomes.25–27 It has also been suggested that ionizable lipids used in the COVID-19 nanoparticles promote rapid neutrophil infiltration and inflammation.11,28–30 Furthermore, cholesterol has been elucidated as a potent inducer of lipid fusion, mediating nanoparticle-endosome bilayer interactions for endosomal disruption, a phenomenon which has recently been suggested to correlate with lysosomal rupture levels and NLRP3 inflammasome activation.31 Therefore, it is surprising that despite the numerous new delivery systems and lipid formulations, few approaches have categorized the inflammatory nature of mRNA lipid nanoparticles. An approach has yet to be taken to determine the molecular-level mechanisms of mRNA nanoparticle-mediated inflammation and immunogenicity, or how each lipid's unique properties and roles contribute to the overall nanoparticle formulation and affect these pathways.


image file: d2bm00883a-f1.tif
Fig. 1 Schematic showing the potential activation of the NLRP3 inflammasome pathway by mRNA loaded lipid nanoparticles. The two principal hypothesized pathways for the internalization and delivery of the multiple mRNA LNP formulations in this study are depicted. In Path 1, the nanoparticle activates the NLRP3 inflammasome in the following manner: (A) Signal 1 is activated when toll-like receptor 4 senses lipopolysaccharide, resulting in (B) downstream activation of NF-κB transcription factor and (C) the expression of inactive inflammasome proteins NLRP3 and Pro-IL-1β (Pro-Caspase-1, ASC, and Inactive pore-forming protein GSDMD are already transcribed before NF-κB activation). (D) After Signal 1 priming, six different lipid nanoparticle formulations are internalized, which depending on formulation, mRNA release, and various biophysical characteristics, can rupture the lysosomal membrane (E) resulting in the activation of Signal 2 and complexation of the inflammasome. This complex activates active Caspase-1 (F), which cleaves Pro-IL-1β and pore-forming protein GSDMD into their active forms (G), resulting in cytokine release and immunogenic cell death in a process known as pyroptosis (H). In Path 2, however, the nanoparticle evades both the activation of the NLRP3 inflammasome and the degradation of mRNA by (I) ionizable lipid components of the LNP formulations inducing endosomal membrane rupture pre-lysosome, leading to the release of intact mRNA to the cytoplasm for translation. In this study, we use GFP mRNA expression to quantify transfection (J).

Here, we engineered and characterized a panel of six mRNA lipid nanoparticle formulations (LNPs), systematically modulating the concentrations of the five key lipid components. We performed a comprehensive screening of these LNPs to determine the lipid formulation-dependent activation of NLRP3 inflammasomes in LPS-primed immortalized bone marrow-derived macrophages (iBMDMs), as corroborated by multiple assays exhibiting IL-1β release, ASC speck assembly, and the cleaving of caspase-1 as well as GSDMD. Furthermore, we discerned the specific mechanisms of activation for the LNPs, observing lysosomal rupture, mitochondrial reactive oxygen species (ROS) production, calcium influx, and GFP mRNA transfection efficiencies of LNPs to gain insight into the cellular trafficking pathways and associated inflammasome activating capabilities of the nanoparticles (Fig. 1I and J). In our results, we discovered a strong dependence on LNP composition/formulation on inflammasome activation. Overall, these results provide evidence that engineering and varying key lipid concentrations in mRNA lipid nanoparticles induce differing degrees of NLRP3 inflammasome activation, correlated with the delay of endosomal escape, and subsequent mRNA transfection capabilities, resulting in lysosomal rupture. We also found some particles to activate the mitochondrial ROS and calcium influx pathways. There are multiple implications to this study, such as elucidating possible immunogenicity of mRNA lipid nanoparticles, like the COVID-19 vaccines, and introducing lipid composition as a multi-variable design consideration for balancing endosomal escape and inflammasome activation for disease-specific expression and the development of self-adjuvant mRNA delivery systems.

Results

Synthesis and characterization of LNP formulations for mRNA delivery and NLRP3 inflammasome screening

To determine the effect of mRNA-LNP formulation on the activation of NLRP3 inflammasomes, we developed six different LNPs, systematically varying the molar compositions of the five key components: ionizable lipid, cationic lipid, phospholipid, PEGylated lipid, and cholesterol (Fig. 2A). For the ionizable lipid, we have used the “gold standard” 4-(dimethylamino)-butanoic acid, (10Z,13Z)-1-(9Z,12Z)-9,12-octadecadien-1-yl-10,13-nonadecadien-1-yl ester (DLin-MC3-DMA), a highly active ionizable lipid used extensively in previous studies as well as in mRNA vaccine clinical trials.10–14 For cationic lipid, we have used 1,2-dipalmitoyl-3-trimethylammonium-propane chloride (DPTAP), a biomimetic, saturated analogue of DOTAP, a lipid that has been widely used in nucleic acid delivery systems and has previously been shown to activate inflammasomes.25 1,2-Dipalmitoyl-sn-glycero-3-phosphocholine (DPPC) and 1,2-distearoyl-sn-glycero-3-phosphoethanolamine-N-[amino(polyethylene glycol)-2000] (DSPE-PEG (2000)-Amine) were used as the phospholipid and shielding lipid components. The six formulations were developed by starting at the clinically relevant ratio of lipid components used in many previous works (LNP5, with 50% ionizable lipid, 10% phospholipid, 38.5% cholesterol, and 1.5% PEGylated lipid) and replacing DLin-MC3-DMA with DPTAP or DPPC as the most abundant lipid (LNP2 and LNP3 respectively) or systematically increasing predominantly DPTAP and DPPC while decreasing the other components (LNP1, LNP4, LNP6) (Fig. 2B). Dynamic Light Scattering analysis determined that the LNPs exhibited relatively similar sizes (∼150–300 nm), especially for LNP1, LNP2, LNP5, and LNP6 (between 150 and 279 nm) (Fig. 2C and E). Zeta potential measurements were largely expected based on the relative molar concentrations of cationic lipid DPTAP, with LNP2 and LNP6 being the most cationic (Fig. 2D). Interestingly, LNP1, which contains 23% DPTAP exhibited lower zeta potential than LNP5, containing no cationic lipid. This could be attributed to a slightly larger amount of negatively charged DSPE-PEG (2000)-Amine. LNPs stability in PBS (over 7 days) and human serum (over 24 hours) were also evaluated as measured by changes in size and zeta potential over time (Fig. 2F–H). Notable is the instability and relatively larger nanoparticle sizes of the formulations containing large amounts of DPPC, mainly LNP3 and LNP4, in PBS, and the high instability of LNP2 in human serum, likely due to the positive charge and increased binding of negatively charged corona proteins.32
image file: d2bm00883a-f2.tif
Fig. 2 Synthesis and characterization of a panel of six mRNA lipid nanoparticle (LNP) formulations used to screen for NLRP3 inflammasome activation and determine lipid component NAMPs. (A) Schematic of the ethanol dilution method used to synthesize the LNPs, consisting of ionizable lipid DLin-MC3-DMA, phospholipid DPPC, shielding lipid DSPE-PEG (2000)-Amine, cationic lipid DPTAP, and cholesterol. (B) Chart labelling the molar concentrations of different lipid components in each of the six nanoparticle formulations. (C) LNP sizes were determined by dynamic light scattering, using the Intensity Z-average size. Data shown is ±S.E.M. (n = 3). (D) LNP zeta potential in deionized water. (E) Intensity percent plots show the similar size distribution for the LNPs as measured using Dynamic Light Scattering Instrument. (F) LNP stability in PBS over 6 days. LNPs were largely stable over this time, with exception of LNP3 and LNP4, consisting of high molar concentrations of phospholipid DPPC. Changes in average size (G) and Zeta Potential (H) of LNPs over time in human serum were tested over 24 hours.

LNP formulations show varied levels of inflammasome activation quantified by IL-1β release in LPS primed iBMDMs

To determine the effects of LNP formulations on the activation of NLRP3 inflammasomes, we used LPS-primed iBMDMs as an in vitro model (Fig. 3A). These cells were treated with 100 ng mL−1 LPS for 4 hours to activate signal 1, followed by 24-hour incubation with each LNP at doses of 100 and 200 μM of the most abundant lipid in the formulation. These doses were chosen to be representative of in vitro doses of ionizable lipid administered for a 5 μg mL−1 dose of mRNA at the standard 1[thin space (1/6-em)]:[thin space (1/6-em)]16 weight ratio of mRNA to total lipids.12,14,33 Since the principal lipid in each formulation makes up ∼50 mol% of the total lipids, the total lipid concentration is roughly double that of the stated dose (but slightly less for LNP3). As a positive control, primed iBMDMs were treated with 10 μM nigericin, well-known as a potent activator of signal 2 of NLRP3 inflammasomes.15,34 After 24 hours, the supernatants were collected and tested for IL-1β release by enzyme-linked immune-absorbance assay (ELISA) (Fig. 3B). Recent literature has cited the inflammasome activating capabilities of DOTAP and tertiary amine-headed ionizable/cationic lipids.25–27,34,35 Therefore, we hypothesized that LNP formulations with the highest surface charge and/or highest concentration of ionizable/cationic lipids would yield the greatest extent of NLRP3 inflammasome activation. However, we found the highest activating particles to be LNP6, LNP1, and to a lesser degree, LNP4 (Fig. 3B). At a higher LNP dose of 200 μM, the difference in activation was more pronounced, with LNP6 showing increased activation over LNP1 and LNP4 (Fig. 3B). Since LNP1 and LNP6 activated the greatest, the combination of ionizable and cationic lipids seemed to be the driving force behind inflammasome activation. Interestingly, we also observed activation by LNP4, which contains no cationic lipid and only 10% more DPPC and 10% less cholesterol than LNP5, which was one of the least activating groups. Surprisingly, there was a relative lack of inflammasome activation from LNP2, the most cationic nanoparticle with the highest percentage of DPTAP. These results, along with the relatively similar sizes of the LNPs (especially of ones that behaved in opposite manners in regards to activation, i.e., LNP1 (195 nm) and LNP6 (200 nm), which activated, vs. LNP2 (205 nm) and LNP5 (112 nm), which didn't activate, led us to conclude that the differences in IL-1β release, and therefore NLRP3 inflammasome activation, are not predominantly LNPs size, surface charge, or only cationic/ionizable lipid-based, but primarily due to the combined effect of the lipids and their molar compositions. To confirm this finding and to further differentiate the nanoparticle lipid concentration driving forces to NLRP3 inflammasome activation, we were prompted to conduct a more comprehensive, protein-specific study into the activation of NLRP3 inflammasomes and what mechanisms the LNPs trigger to activate them.
image file: d2bm00883a-f3.tif
Fig. 3 LNP formulations show varying amounts of IL-1β release and NLRP3 inflammasome activation. (A) Schematic shows the steps in the NLRP3 inflammasome assay that was used to evaluate the effect of different LNPs on IL-1β release. (B) IL-1β release in the supernatant of LPS primed iBMDMs incubated with different LNPs for 24 hours (100 μM and 200 μM most abundant lipid) quantified by ELISA. Data shown is ±S.E.M (n = 3). Statistical analysis was performed with one-way ANOVA followed by Tukey post-test. ns – not significant, *p < 0.05, **p < 0.01, ****p < 0.0001. (C) We confirmed the involvement of the NLRP3 inflammasome in IL-1β release by incubating LNPs with NLRP3 and Caspase-1 Knockout iBMDMs, as well as iBMDMs unprimed with LPS, showing minimal activation. Data shown is ±S.E.M (n = 3). Statistical analysis was performed with one-way ANOVA followed by Tukey post-test. ns – not significant, **p < 0.01, ****p < 0.0001.

LNP formulation is directly correlated with NLRP3 inflammasome activation

Beginning our study, we wanted to confirm that differences in IL-1β release were directly a result of NLRP3 assembly and the subsequent activation of caspase-1. To confirm this, we treated iBMDMs that were knocked out for either NLRP3 or caspase-1 with LPS for 4 hours and then LNPs at 100 μM of the most abundant lipid for 24 hours as done previously. We also incubated LNPs in LPS unprimed iBMDMs to test if priming is necessary for LNP induced NLRP3 activation (Fig. 3C). As expected, IL-1β expression after LNP treatment was significantly reduced in NLRP3 and caspase-1 knockout cells as well as in unprimed iBMDMs. Once primed with LPS, the iBMDMs showed similar activation profiles as previously shown (Fig. 3B and C). These results point that IL-1β release after LNP treatment requires LPS priming and the subsequent signaling via NLRP3 assembly and caspase-1 activation.

Now that we have confirmed the involvement of NLRP3 and caspase-1, we next visualized the effect of LNP formulation on the complexation of NLRP3 inflammasome proteins. For this, we utilized iBMDMs engineered to express CFP fluorescently tagged ASC. ASC is an adapter protein central to the complexation of NLRP3 inflammasomes, wherein the activation of signal 1 and signal 2 cause conformational changes to inflammasome proteins, resulting in large fibrous protein aggregates of ASC (“ASC Specks”) that amplify the binding of pro-caspase-1 and bridge NLRP3 into the entire inflammasome complex.34 These specks have been well documented and categorized in previous literature as signs of inflammasome activation.15–17,34 To visualize this phenomenon, the cells were primed with LPS for 4 hours, followed by 13-hour incubation with 100 μM of LNPs. After 13 hours, the cells were stained with NucBlue and propidium iodide (PI) and imaged using a CREST v2 confocal light microscope. When inactive, ASC is spread throughout the cytosolic region of cells, represented in imaging as large hazes of CFP fluorescence. This is best exemplified in the LPS, LNP2, LNP3, and even to a large extent in the nigericin wells, exhibiting non-specific CFP signals indicative of inactive inflammasome recruitment (Fig. 4A). However, after the activation of both signals required for inflammasomes, all the ASC within a cell is recruited to the inflammasome complex, resulting in a single, intensely fluorescent but very small (1–5 μm) “speck” in each cell. This is best exemplified in the LNP1, LNP4, LNP6, and nigericin wells, showing the highest amount of ASC specks, which were then sorted and counted by size and normalized by NucBlue events to determine the percentage of cells with active NLRP3 inflammasomes (Fig. 4B). These results corroborate our previous data by clearly exhibiting a drastic increase in activation from LNP1 and LNP6 especially, each showing ∼30% ASC speck expression, which is a ∼2.5-fold increase over the LPS control, and ∼3, 12, and 2-fold increase over the non-activating particles LNP2, LNP3, and LNP5 respectively. Also highly expressing, although less so than the others, is LNP4, activating ∼20% of the cells. Overall, however, the presence of large amounts of ASC specks in the highest activating formulations, comparable to even nigericin, confirmed and further resolved the differences in inflammasome activation between the six LNP formulations, providing more precise insight into correlating, and from there, explaining how lipid formulation NAMPs are critical in NLRP3 inflammasome activation.


image file: d2bm00883a-f4.tif
Fig. 4 Differing degrees of LNPs-induced inflammasome activation confirmed by inflammasome protein complexation and presence of N-terminal GSDMD and Active Caspase-1. (A) Representative fluorescence microscopy imaging of LPS-primed and LNP treated ASC-CFP expressing iBMDMs stained with NucBlue and PI. Blue fluorescence correlates with stained nuclei by NucBlue, whereas red fluorescence signifies dead cells. Cyan fluorescence correlates with the expression of ASC, where small dots in the sample indicate the formation of ASC specks in the inflammasome complex. Scale bar – 100 μm. (B) Quantification of ASC specks after 13-hour LNPs incubation normalized by the total number of live cells counted by the NucBlue signal. Data shown is ±S.E.M (n = 3). Statistical analysis was performed with one-way ANOVA followed by Tukey post-test. ns – not significant, *p < 0.05. (C) Representative Western blots of NLRP3, Pro-Caspase-1, ASC, and β-Actin in lysate. (D) Representative western blot images run on lysate collected from LPS-primed and LNPs treated iBMDMs, showcasing the expression of inactive GSDMD (top), N-Terminal GSDMD (middle), and β-Actin control (bottom). (E) Quantification of N-terminal (active) GSDMD protein expression for lysate, relative to the expression in iBMDMs only treated with LPS and normalized by the expression of inactive GSDMD. Data shown is ±S.D. (n = 3). Statistical analysis was performed with one-way ANOVA followed by Tukey post-test. ns – not significant, *p < 0.05, **p < 0.01. (F) Representative western blot images run on supernatant collected from LPS-primed and LNPs treated iBMDMs, showing expression of Pro-Caspase-1 released after pyroptosis (top), as well as Active-Caspase-1 confirming inflammasome activation (bottom). (G) Quantification of Active Caspase-1 protein expression in supernatant, relative to the expression of LPS and normalized by the expression of Pro-Caspase-1. Data shown is ±S. E. M. (n = 3). Statistical analysis was performed with one-way ANOVA followed by Tukey post-test. ns – not significant, *p < 0.05, **p < 0.01.

From these studies, it is evident that LNP lipid compositions act as a deciding factor for signal 2 activation and NLRP3 oligomerization. To further confirm these correlations, we wanted to determine the effect of LNP formulation on the expression levels of specific NLRP3 inflammasome proteins, including their active and inactive forms. To do this, we treated iBMDMs with LPS for 4 hours and then LNPs at 100 μM for 24 hours, then collected and concentrated the cell supernatant, and prepared lysate by treating the cells with RIPA buffer and protease inhibitor to conduct western blotting. For lysate proteins, we determined the expression of NLRP3 (110 kDa), pro-caspase-1 (45 kDa), ASC (22 kDa), GSDMD (53 kDa), and N-terminal GSDMD (31 kDa), which is the cleaved, active form of GSDMD that causes pores to form in the cell membrane, ultimately leading to pyroptosis. We also observed the expression of pro and active caspase-1 released in the supernatant due to LNP treatment and subsequent complement activation and pyroptosis. As shown in Fig. 4C and D, the lysate expression of the inflammasome proteins NLRP3, pro-caspase-1, ASC and GSDMD are consistent across all treatment groups. However, when analyzing the expression of mature N-terminal GSDMD, we observed a significant difference in expression from the LNP treatment groups. Representative images in Fig. 4D show an upregulation of N-terminal GSDMD chemiluminescence in LNP1, LNP4 and LNP6. When quantifying these differences in expression, it was confirmed that LNP1, LNP4, and LNP6 showed significant increases in active GSDMD expression relative to LPS and normalized by inactive GSDMD, with LNP6, 1, and 4 exhibiting ∼8.5, 7, and 3.5-fold more expression than LPS respectively (compared to just 2.84, 2.87, and 2.38 for LNP2, LNP3, and LNP5) (Fig. 4E). This trend continued when observing the expression of active caspase-1 released in the supernatant, with LNP1 and LNP6 exhibiting the highest chemiluminescence amongst the LNP treatment groups (Fig. 4F). After quantification, it was discovered that LNP6, 1, and 4 exhibited 2.5, 1.5, and 1.3-fold increases of active/pro-caspase-1 ratio relative to LPS control (Fig. 4G). Overall, these results further confirm our LNP-specific inflammasome activation profiles, this time by displaying formulation-driven activation of specific inflammasome protein caspase-1, crucial for IL-1β cleavage, and GSDMD, important for pore-formation ultimately leading to pyroptosis.

Lysosomal rupture is a primary mechanism in LNP-induced activation of the NLRP3 inflammasome

We have demonstrated that LNPs formulated for mRNA delivery activate the NLRP3 inflammasome in a manner dependent on the concentration of multiple lipid components, most importantly ionizable lipid, cationic lipid, and cholesterol. Next, we wanted to elucidate the specific mechanism of how LNP1, LNP4, and LNP6 activate NLRP3 inflammasome to a greater extent over the other LNPs. We investigated how each formulation causes lysosomal rupture, an important signal 2 mechanism that induces inflammasome assembly via cathepsin B maturation in response to a wide variety of NAMPs.15,31,36 To test this, we synthesized each LNP formulation to encapsulate 3 mol% of 1,1′-dioctadecyl-3,3,3′,3′-tetramethylindodicarbocyanine, 4-chlorobenzenesulfonate, or DiD dye, a far-red lipophilic dye used to track the internalization of the lipid nanoparticles via imaging. In addition, we incubated 100 μM of these LNPs in unprimed iBMDMs for 4 hours. We then treated the cells with NucBlue and Lysotracker Red DND-99 before imaging using a CREST v2 confocal fluorescence microscope. Since Lysotracker fluoresces as a response to low pH environments inside cells, the reduction of Lysotracker fluorescence intensity, normalized by DiD internalization signal, would indicate greater lysosomal rupture, an expected result for the highest activating treatment groups LNP6, LNP1, and to a lesser degree LNP4. As anticipated, LNP6, the highest activating nanoparticle from previous assays, showed a drastically lower visible Lysotracker signal than LNP2, LNP3, and LNP5 (10, 94, and 8-fold less after quantification, respectively) (Fig. 5A and B). LNP1 also showed strong reductions in Lysotracker signal but 4-fold less than LNP6. Furthermore, we were able to visualize the relative increases in mature cathepsin-B expression in LNP1 and LNP6 from the representative western blot in ESI Fig. S3. We, therefore, report a strong correlation between inflammasome activation in LNP1 and LNP6 and lysosomal rupture, quantified by the reduction in Lysotracker signal compared to the least activating nanoparticles, suggesting lysosomal rupture to be a key factor in the differentiation of NLRP3 inflammasome activation by our panel of nanoparticles.
image file: d2bm00883a-f5.tif
Fig. 5 LNPs internalization causes lysosomal rupture which correlates to inflammasome activation. (A) Representative fluorescence microscopy imaging of iBMDMs treated with DiD-encapsulating LNPs for 4-hours and stained with NucBlue and Lysotracker Red DND-99. Blue fluorescence correlates with stained nuclei by NucBlue, red fluorescence signifies internalized DiD-LNPs, and orange fluorescence signifies lysosomes. Scale bar – 100 μm. (B) Quantification of lysosomal fluorescence intensity normalized by internalized DiD particles quantified by Cy5 fluorescence. Data shown is ± S.E.M (n = 3). Statistical analysis was performed with one-way ANOVA followed by Tukey post-test. ns – not significant, *p < 0.05. LNPs internalization was determined by incubating DiD-loaded LNPs in CFSE-stained iBMDMs at 4 °C (C) and 37 °C (D) and analyzing the number of CFSE-positive events expressing APC signal using flow cytometry. (E) Percentage of CFSE and DiD positive cells indicating internalization of DiD-loaded LNPs. Data shown is ±S.E.M (n = 3).

To better quantify the internalization of each LNP formulation, we incubated Carboxyfluorescein N-succinimidyl ester (CFSE) stained iBMDMs at both 4 °C (Fig. 5C and E) and 37 °C (Fig. 5D and E) with 100 μM of LNPs (on most abundant lipid basis) encapsulating 3 mol% DiD and evaluating the fluorescence intensity using flow cytometry. Interestingly, we observed different internalization patterns for each LNP and at each temperature. First, we determined a strong correlation between cationic lipid DPTAP concentration and internalization. Even at 4 °C, LNP1, LNP2, and LNP6, containing 23, 54, and 20% DPTAP respectively, showed high levels of internalization over the other particles. The greater reduction in LNP5 internalization at 4 °C, despite having a similar positive charge to LNP2 and LNP6 (Fig. 2D), indicated that this difference in internalization was due to the physiochemical properties of DPTAP rather than just a positive zeta potential. LNP3 and LNP4, containing the highest amounts of DPPC (68.8% and 20% respectively), showed the most significant inhibition in internalization at 4 °C. Furthermore, even at 37 °C, these formulations showed approximately 10-fold reductions in internalization compared to the rest of the LNPs. Therefore, the larger amounts of phospholipid DPPC did not induce greater lipid fusion or internalization, leading to the conclusion that, at least in lipid nanoparticles formulated for mRNA delivery, DPPC shows reduced internalization rates compared to ionizable and cationic lipids (Fig. 5A and B). Furthermore, in determining the internalization profiles of each LNP and confirming the largely similar internalization rates of LNP1, 2, 5, and 6, and 10-fold reduced internalizations of LNP3 and 4, we can conclude that the internalization of LNPs does not significantly affect the inflammasome activation we have seen thus far. This is because, although LNP1, 2, 5, and 6 internalize similarly, only LNP1, 4, and 6 activate inflammasomes to a considerable extent.

Mitochondrial reactive oxygen species production and calcium influx are also LNP formulation dependent mechanisms of NLRP3 activation

After the determination of lysosomal rupture to be a primary mechanism of inflammasome activation for LNP1 and LNP6, we were prompted to determine if any other mechanisms for the signal 2 activation of NLRP3 inflammasomes were triggered by LNP1, 6, and especially LNP4, which induced no significant lysosomal rupture as shown in Fig. 4A and B. To test these pathways, we incubated 100 μM LNPs in LPS-primed iBMDMs for 2 hours, followed by staining with MitoSOX and Fluo-4AM to test for mitochondrial ROS production and calcium influx by flow cytometry and fluorescent live-cell imaging respectively. Interestingly, we discovered that, despite not activating the lysosomal rupture pathway as confirmed in Fig. 5A and B, LNP4 was shown to be a strong inducer of mitochondrial ROS production as well as calcium influx. This is best exemplified by the statistically significant increase in fluorescent imaging Fluo-4AM expression over LNP1, a primarily lysosomal rupturing formulation (Fig. 6A and B), as well as flow cytometry MitoSOX expression as shown in the representative histogram in Fig. 6C as well as the quantification in Fig. 6D. These quantified metrics reveal a 17-fold increase in Fluo-4AM calcium influx from LNP4 as compared to LNP1, and a 2-fold increase in MitoSOX mitochondrial ROS production from LNP1, normalized by LPS expression. Overall, these results reveal that the lipid formulation specific activation of NLRP3 inflammasomes is sensitive to not only the lysosomal rupture pathway, but also mitochondrial ROS and calcium influx, which provides a strong basis of nanoparticles that induce diverse cellular trafficking and stimuli to activate inflammasomes, leading to our final study of mRNA transfection capabilities of the particles.
image file: d2bm00883a-f6.tif
Fig. 6 LNP4 primary method of activation is through mitochondrial ROS and calcium influx pathway. (A) Representative fluorescence microscopy images of LPS-primed and LNPs treated iBMDMs stained with NucBlue and Fluo-4AM. Blue fluorescence correlates with stained nuclei by NucBlue and green fluorescence indicates calcium ions. (B) Quantification of imaging data for Fluo-4AM intracellular calcium ion staining. Data shown is ±S.E.M (n = 3). Statistical analysis was performed with one-way ANOVA followed by Tukey post-test. ns – not significant, *p < 0.05. (C) Representative flow cytometry histogram showing MitoSOX fluorescent shifts in LPS-primed iBMDMs after 100 μM nanoparticle treatment for 2 hours. (D) Median fluorescence intensity as determined by flow cytometry. Data shown is ±S.E.M (n = 3). Statistical analysis was performed with one-way ANOVA followed by Tukey post-test. ns – not significant, *p < 0.05.

mRNA transfection efficiency is negatively correlated with lysosomal rupture-induced NLRP3 inflammasome activation

To this point, we have confidently determined an interesting correlation between lipid content and composition on NLRP3 inflammasome activation, with LNP6 (50% DLin-MC3-DMA, 10% DPPC, 20% DPTAP, 18.5% Chol, 1.5% PEG) activating the greatest amount, followed by LNP1 (45% DLin-MC3-DMA, 10% DPPC, 23% DPTAP, 20% Chol, 2% PEG) and LNP4 (50% DLin-MC3-DMA, 20% DPPC, 28.5% Chol, 1.5% PEG) confirmed by multiple protein-specific assays. Next, we wanted to determine if there is a correlation between inflammasome activation and mRNA endosomal escape-driven transfection efficiency. We chose three LNP formulations with a differing clinical application (formulations used in previous clinical literature) and differing degrees of inflammasome activation; LNP4 (moderate inflammasome activation by mitochondrial ROS, calcium influx, but low internalization), LNP5 (clinical ratio of lipids for optimized mRNA encapsulation and transfection, but low inflammasome activation), and LNP6 (highest inflammasome activating formulation due to lysosomal rupture). To test each LNP's ability to promote the endosomal escape of mRNA and subsequent transfection, we encapsulated 5 μg mL−1 doses of GFP mRNA within each LNP. We incubated them in both unprimed iBMDMs, and HEK293T cells as a maximum expression control, as macrophages are known to be very difficult to transfect (Fig. 7A).14,37,38 We transfected 5 μg mL−1 GFP mRNA using Lipofectamine Messenger MAX transfection reagent as a secondary positive control. We also confirmed the encapsulation efficiency of each formulation using Quant-it RiboGreen RNA Assay, normalizing the expression of each data set to the mRNA dose encapsulated (Fig. 7B). After 24 hours of treatment, the cells were then processed using flow cytometry to determine shifts in GFP fluorescence in both the iBMDMs (representative flow cytometry plot in Fig. 7F) and HEK293Ts (representative flow cytometry plot in Fig. 7G). As expected, the transfection efficiencies in iBMDMs were much lower than in HEK293Ts (Fig. 7C). Interestingly, we found a decrease in normalized GFP median fluorescence intensity (MFI) as well as transfection efficiency in LNP6 and LNP4, the inflammasome activating particles, compared to the lower activating LNP5 in iBMDMs, the principal cell line for all the previous experiments (Fig. 7C and D). Although LNP4 induces inflammasome, but does not induce significant lysosomal rupture, it internalizes 10-fold less after 2 hours than LNP5 and LNP6 confirmed in the previous flow cytometry results, which could explain its reduced transfection capabilities. Interestingly, however, this is not a possible explanation for the consistent difference in GFP mRNA transfection between LNP5 and LNP6, as both formulations have previously been shown to internalize to similar degrees. This leads to suggest that the discrepancies in LNP5 and LNP6 are due to the inflammasome pathway and may lead to further insight into how LNPs induce inflammasome activation. For example, we have also previously shown LNP6 to cause intense lysosomal rupturing, with an 8-fold reduction in lysosomal fluorescence compared to LNP5 as indicated in Fig. 5B. This validates our previous observations and provides further mechanistic insight for inflammasome activation by LNPs. That is to say that, since LNP6 induces greater lysosomal rupture while maintaining the same ratio of membrane disrupting ionizable lipids as LNP5, it is probable that the combined formulation of each lipid in LNP6 delays the efficient ionization and endosomal membrane disruption of the nanoparticle until the endosome fuses with the lysosome. This would mean that, along with the ionizable lipids activating and inducing lysosomal membrane disruption resulting in cathepsin-B maturation and NLRP3 inflammasome activation, mRNA would be released in the enzymatic and acidic environment of the lysosome, causing degradation and heavy reductions in viable mRNA for translation. Therefore, the delaying of GFP mRNA release until the lysosomal stage by LNP6 would therefore both decrease mRNA transfection efficiency, as we have measured, and induce inflammasome activation, which we have confirmed in all previous assays. These results provide further evidence that lysosomal disruption, especially for LNP6, is driven by lipid nanoparticle formulation, and the time-dependent ionization and mRNA release by lipid nanoparticles may be a future design consideration to tailor the expression of mRNA as well as adjuvancy induced by inflammasome activation.
image file: d2bm00883a-f7.tif
Fig. 7 Assessment of the correlation between LNP-induced inflammasome activation and mRNA transfection efficiency. (A) Schematic of the experimental design, encapsulating GFP mRNA with LNPs 4–6, and Lipofectamine MessengerMAX reagent and incubating in iBMDMs and HEK293T cells for 24 hours to determine GFP fluorescence by flow cytometry. (B) Encapsulation efficiency of GFP mRNA in different LNPs as determined by Quant-it RiboGreen Assay. Data shown is ±S.E.M (n = 2). (C) Quantification of median fluorescence intensity of translated GFP mRNA by LNP4, LNP5 and LNP6 in iBMDMs, normalized by average encapsulation efficiency of each particle formulation. Data shown is ±S.E.M (n = 2). Transfection efficiency in (D) iBMDMs and (E) HEKs normalized by encapsulation efficiency of mRNA. Statistical analysis was performed with one-way ANOVA followed by Tukey post-test. *p < 0.05, **p < 0.01. Histograms showing the shifting expression of GFP in (F) iBMDMs and (G) HEK293Ts are also shown.

Discussion

In this study, we aimed to bridge the knowledge gap of mRNA lipid nanoparticle immunogenicity by synthesizing and characterizing a panel of six different LNP formulations, altering the five key lipid components essential for mRNA encapsulation, stability, and endosomal escape. We tested these formulations using several cell-based assays, including IL-1β release, ASC speck formation, inflammasome protein expression by western blot, lysosomal rupture, and mRNA transfection and endosomal escape properties. After conducting these assays, we discovered consistent activation of NLRP3 inflammasomes by LNP6 (50% ionizable lipid, 20% cationic lipid, 10% phospholipid, 18.5% cholesterol, 1.5% PEGylated lipid), LNP1 (45% ionizable lipid, 23% cationic lipid, 10% phospholipid, 20% cholesterol, 2% PEGylated lipid), and LNP4 (50% ionizable lipid, 20% phospholipid, 28.5% cholesterol, 1.5% PEGylated lipid), in the order of greatest extent. We furthermore provided lysosomal rupture, the closely linked delaying of endosomal escape and poor mRNA transfection capability, as well as the independently observed mitochondrial ROS and calcium influx pathways as key mechanisms involved in how these nanoparticle lipid compositions resulted in different activation profiles.

These results provided evidence of a reduced effect of mRNA LNP size, charge, internalization, or solely ionizable lipid or cationic lipid on the activation of inflammasomes like has been previously hypothesized here and in other literature.31,39 For example, the lack of activation by the positively charged LNP2, containing the highest amount of cationic lipid, and the activation by the neutrally charged LNP4 eliminated the possibility of activation being a solely charge-based phenomenon. The highly activating LNP6 and LNP1 also exhibited similar internalization rates as LNP2 and 5, eliminating internalization as the major inducing factor of differing activation. However, a factor that may be crucial is particle serum stability. Since there is a substantial nanoparticle size increase of LNP2 in human serum compared to the other particles, it is possible that the presence of more serum proteins results in earlier endosomal rupture. Furthermore, both LNP4 and LNP5 contain the same amount of ionizable lipid, but only LNP4 activates to an extended degree, while LNP5 produces more potent mRNA transfection and endosomal escape. These observations, along with the biophysical characterization data, demonstrate that inflammasome activation is not entirely a result of size, charge, or cationic/ionizable lipid concentration but is heavily reliant on the combined effects of each lipid and at each concentration in the formulation. These effects dictate the conformation of the nanoparticle and its ability to promote either endosomal or lysosomal rupture caused by delaying the endosomal escape capabilities of the highly active ionizable lipids into the lysosomal stage. This was best exemplified by the high inflammasome activation but low mRNA transfecting LNP4 and LNP6, which contain very high amounts of membrane-destabilizing DLin-MC3-DMA. Although LNP4 did not induce significant lysosomal rupture, and its reduced transfection efficiency is correlated with low internalization, it is conceivable that some of the lipid components in LNP6 delay endosomal disruption until the late endosome/early lysosome stage, wherein mRNA is degraded, and the ionizable lipid disrupts the lysosomal membrane too late, causing the inflammasome activation observed in previous assays. This observation aligns with a study conducted by Baljon et al.,31 which correlated low siRNA knockdown and polymer ionizability with high inflammasome activation and vice versa. Furthermore, a recent computational study by Bruininks et al.40 studied the effect of cationic lipid saturation on the ability of lipoplexes to induce endosomal disruption and release dsDNA to the cytosol. They discovered that, compared to the unsaturated lipid DOTAP, which induced potent dsDNA release, the saturated DPTAP induced unusual folding properties to the lipoplex, causing the collapsed fusing of hexagonal lipid structures in the core of the lipoplex, thus completely terminating the lipoplex's endosomal escape capabilities. This mechanism is likely at play in LNP6 and LNP1, where, despite having high concentrations of ionizable lipid, the saturated DPTAP induces core conformational changes that delay ionization and disruption to the lysosomal stage.

Interestingly, none of the LNPs containing high cholesterol from 30–38.5% (LNP2, LNP3, and LNP5), the maximum amounts tested, activated inflammasomes to a considerable extent. Furthermore, just a 10% decrease in cholesterol content from LNP5 to LNP4 induced much greater activation, hinting at the sensitivity of cholesterol concentration on activation. It is likely that cholesterol hinders inflammasome activation, as many previous sources report a positive correlation between cholesterol concentration and transfection efficiency and, therefore, endosomal escape.6,7,41 For example, a study by Pozzi et al. discovered dramatic increases in transfection efficiency with increasing cholesterol concentration and determined that macropinocytosis is upregulated with increasing cholesterol concentration, inducing earlier escape and lysosomal evasion.7 Another study by Chen et al. discovered that lipid fusion endosomal escape is a cholesterol concentration-driven process, where the cholesterol promotes and stabilizes local bilayer negative curves (bending) of fused lipid membranes.8 As per our developed hypothesis, increasing cholesterol concentration and, therefore, endosomal escape would reduce the ability of nanoparticles to exhibit lysosomal rupture to induce inflammasome activation.

Conclusions

In summary, we provide a molecular-level analysis into the innate immunological responses to mRNA lipid nanoparticles in the form of NLRP3 inflammasome activation, one of the most important cellular inflammatory pathways, which results in the upregulation of IL-1β cytokine, a key signaling molecule involved in several innate inflammatory responses. Furthermore, we also identify mRNA lipid nanoparticle composition as a novel contributor to Nanoparticle-Associated Molecular Patterns (NAMPs) that activate signal 2 of NLRP3 inflammasomes. With the determination of ionizable lipid, cationic lipid, and cholesterol as playing critical roles in this activation, which was determined to be predominantly because of the delay of endosomal rupture/fusing until the lysosomal stage, it is evident that this novel NAMP is a multi-component phenomenon. Furthermore, our results suggest lipid composition and formulation as leverage between early mRNA release and reduced immunogenicity, and more mRNA degradation. Finding an efficient balance between the two, as to induce potent enough translation while activating inflammasome, may provide a new avenue for mRNA vaccine self-adjuvanticity.

Experimental

Materials/reagents

All reagents were purchased from commercial suppliers. For lipid components, 4-(dimethylamino)-butanoic acid, (10Z,13Z)-1-(9Z,12Z)-9,12-octadecadien-1-yl-10,13-nonadecadien-1-yl ester (DLin-MC3-DMA) was purchased from MedChemExpress, and cholesterol was procured from Fisher Scientific. All the other lipids, such as 1,2-dipalmitoyl-sn-glycero-3-phosphocholine (DPPC), 1,2-dipalmitoyl-3-trimethylammonium-propane (DPTAP), and 1,2-distearoyl-sn-glycero-3-phosphoethanolamine-N-[amino(polyethylene glycol)-2000] (DSPE-PEG (2000)-Amine) were purchased from Avanti Polar Lipids. For encapsulated species, DiIC18(5); 1,1′-dioctadecyl-3,3,3′,3′- tetramethylindodicarbocyanine, 4-chlorobenzenesulfonate (DiD) far-red lipophilic dye was purchased from Biotium, and DasherGFP mRNA was purchased from Aldevron. Amicon Ultra-0.5 3k microcentrifuge filters were purchased from Millipore Sigma. Lipofectamine MessengerMAX, Quant-it Ribogreen RNA Assay kit, and Uncoated Mouse IL-1β ELISA kits were purchased from ThermoFisher. Ultrapure lipopolysaccharide (LPS) and nigericin were purchased from Invivogen and Sigma Aldrich, respectively. For western blot antibodies, anti-mouse NLRP3 antibody (Cryo-1), anti-rabbit ASC antibody (AL177), and anti-mouse Caspase-1 (p20) antibody (Casper-1) were purchased from Adipogen Life Sciences. Anti-rabbit N-terminal GSDMD antibody was purchased from Abcam, anti-mouse β-Actin antibody was purchased from Biolegend, and anti-cathepsin-B antibody was procured from Invitrogen. For secondary antibodies, anti-mouse and anti-rabbit IgG conjugated to HRP was purchased from Cell Signaling Technologies. Reagents for lysate sample prep; RIPA lysis buffer, halt protease and phosphatase inhibitor cocktail ETDA free (100×) and Alpha Aesar Laemmli SDS 4× sample reducing buffer were purchased from ThermoFisher. TGX Strain-Free FastCast Acrylamide Kit, 10% and Clarity One ECL Substrate were purchased from Biorad. All chemicals used to make western blot buffers were procured from Sigma Aldrich, including TRIZMA base, sodium dodecyl sulfate, glycine, sodium chloride, Tween 20, bovine serum albumin (BSA), methanol, and 2-mercaptoethanol. For cell culture, Dulbecco's modified Eagle's media (DMEM), fetal bovine serum (FBS), and Penicillin–Streptomycin antibiotic cocktail were procured from Gibco Life Technologies. Cell staining compounds including propidium iodide, CellTrace CFSE, NucBlue LiveReadyProbesReagent, Lysotracker Red DND-99, MitoSOX Red, and Fluo-4AM were purchased from ThermoFisher.

Methods

Synthesis of mRNA lipid nanoparticles (LNPs) for NLRP3 inflammasome screening and transfection. All six LNP formulations were synthesized via the ethanol dilution method. In this method, stock solutions of DLin-MC3-DMA, DPTAP, DPPC, DSPE-PEG (2000)-Amine and cholesterol were made in molecular biology grade ethanol. For each LNP, the lipid stock solutions were mixed to achieve the desired molar ratio of lipids for the formulation. To form LNPs, these ethanol-lipid mixtures were added dropwise into 5 mM sodium citrate at a 3[thin space (1/6-em)]:[thin space (1/6-em)]1 v/v ratio of sodium citrate to the ethanol-lipid mixture, and then rapidly pipette mixed and left to sit at room temperature for 15 minutes. For screening experiments, the LNPs were diluted to a final volume of 0.5 mL in 1× PBS and purified via centrifuge filtration in Amicon Ultra 0.5 3 kD centrifugal filters at 14[thin space (1/6-em)]000g and 4 °C for 45 minutes. The concentrate was then diluted in 1× PBS to the same volume as before initial dilution and centrifugation. For imaging and internalization flow cytometry, LNPs encapsulating DiD dye were made in the same manner as previously described, but 3 mol% DiD dye was dissolved in ethanol along with the ethanol-lipid mixture. If forming LNPs for mRNA transfection in vitro, a similar procedure was followed, but the ethanol-lipid mixture was hydrated in 10 mM sodium acetate, pH 4.5 containing GFP mRNA in a 1[thin space (1/6-em)]:[thin space (1/6-em)]16 weight ratio of mRNA to total lipids. No purification or dilution was necessary for transfection experiments.
LNP size characterization. LNP size was determined by Dynamic Light Scattering (DLS) using a Malvern Nanozetasizer ZS90. For this, 10 μL of LNP solution was diluted in 990 μL of 1× PBS. The DLS samples were then vortexed and pipetted into disposable cuvettes for readings. Unless otherwise stated, intensity Z-average size was used to determine average particle sizes, and the intensity stats table was used to plot the sizes.
LNP zeta potential. For all zeta potential measurements, 10 μL of LNP was diluted in 990 μL of milliQ and aliquoted into disposable zeta cuvettes using 1 mL syringes for readings using the Nanozetasizer.
Serum stability of LNP. For serum stability, 20 μL of human serum was mixed with 180 μL of LNP and constantly mixed on a rotary mixer at room temperature. At the time points 0 h, 1 h, 2 h, 4 h, 8 h, and 24 h, 10 μL of LNP in serum was diluted in 990 μL of Milli-Q water, vortexed, and pipetted into disposable cuvettes for DLS readings as previously described. Intensity Z-averages were used to determine serum stability particle size.
Cell culture. Unless otherwise stated, all in vitro experiments were conducted with immortalized bone marrow-derived macrophages (iBMDMs) engineered to express ASC tagged with a CFP fluorescing residue. These cells were a gift from Dr Kate Fitzgerald from the University of Massachusetts Chan Medical School. Also procured from Dr Fitzgerald were NLRP3 and Caspase-1 Knockout iBMDM cell lines. HEK293T cells were used as a highly expressing cell line for mRNA transfection experiments to compare as a positive control against hard to transfect iBMDMs. These cells were a gift from Dr Dominique Alfandari from the Veterinary and Animal Sciences Department at the University of Massachusetts, Amherst. All cells were cultured in DMEM media supplemented with 10% v/v FBS and 1% v/v antibiotic cocktail consisting of penicillin (50 μg mL−1) and streptomycin (50 μg mL−1). Each cell line was passaged every three days. For passing, the cells were split by detachment with 0.25% trypsin-EDTA in 1× PBS and seeded in a T-75 at a 1/6 seeding ratio.
IL-1β ELISA assay. For IL-1β ELISA inflammasome activation screening, iBMDMs were seeded to achieve a density of 160[thin space (1/6-em)]000 cells per well in a 96 well plate. Once this density was reached, the cells were primed with 100 ng mL−1 LPS for 4 hours to induce signal 1 of inflammasome activation. After 4 hours, the cells were treated with LNPs or 10 μM nigericin as a positive control (24 hours for particles, 1 hour for nigericin), activating signal 2 of the inflammasome. Two concentrations of LNP were tested for IL-1β activation: 100 and 200 μM of the most abundant lipid in the formulation. For example, for LNP1, LNP4, LNP5, and LNP6, LNPs were added to achieve a concentration of 100 or 200 μM DLin-MC3-DMA, and likewise for LNP2 and LNP3 but with DPTAP and DPPC, respectively. These concentrations were chosen to be representative of the average in vitro dose of ionizable lipid administered for a 5 μg mL−1 dose of mRNA. After 24 hours, the cell supernatant was collected and assessed for IL-1β release using the Invitrogen Mouse IL-1β ELISA kit following the manufacturer's protocols.
Internalization flow cytometry. For internalization flow cytometry, iBMDMs were stained using 2 μM CFSE according to the manufacturer's protocol and then plated to a density of 1[thin space (1/6-em)]000[thin space (1/6-em)]000 cells per well in a 12 well plate. At the desired density, the cells were incubated with DiD-encapsulating LNPs at a dose of 100 μM principal lipid for 2 hours. Following incubation, the cells were washed and scraped in 1× PBS, centrifuged at 2000 rpm for 5 minutes, and resuspended in 100 μL PBS to run using an ACEA Novocyte Flow Cytometer. Internalization was determined by counting the number of double-positive cells, analyzed using NovoExpress software.
Light microscopy for ASC speck imaging. iBMDMs were seeded to achieve a density of 800[thin space (1/6-em)]000 cells in an entire 8-well chambered coverslip. At the desired cell density, cells were treated with 100 ng mL−1 LPS for 4 hours, followed by 100 μM LNP dosage, as previously described, for 13 hours. Nigericin was added to the positive control wells 2 hours prior to imaging. After LNP incubation, the cells were stained with NucBlue (2 drops per mL) and propidium iodide (2 μg mL−1), incubated at 37 °C for 15 minutes and imaged at 20× magnification on a CREST v2 TIRF Spinning Disc Confocal Microscope.
Light microscopy for internalization and lysosomal rupture. As previously, iBMDMs were seeded to a density of 800[thin space (1/6-em)]000 cells in an entire 8-well chambered coverslip. At the desired density, cells were treated with 100 μM DiD-encapsulating LNPs for 4 hours. Following particle incubation, the cells were stained with NucBlue (2 drops per mL) and Lysotracker Red DND-99 (0.1 μM) for 30 minutes, followed by the addition of fresh media with only NucBlue and imaging at 20× magnification on a CREST v2 TIRF Spinning Disc Confocal Microscope.
Light microscopy for calcium influx. As followed for previous microscopy experiments, iBMDMs were seeded to a density of 800[thin space (1/6-em)]000 cells in an entire 8-well chambered coverslip. At the desired density, cells were treated with 100 ng mL−1 LPS for 4 hours to induce signal 1, followed by 100 μM select inflammasome activating nanoparticles for 2 hours. Following particle incubation, the cells were stained for intracellular calcium with 2.5 μM Fluo-4AM dye in CPBS (1× PBS with CaCl2 and MgCl2), and then NucBlue (2 drops per mL) in fresh media for 10 minutes. The slides were the imaged at 20× magnification on a CREST v2 TIRF Spinning Disc Confocal Microscope.
Flow cytometry for mitochondrial ROS production. To quantify the increase in mitochondrial ROS production in response to the signal 2 activation of the nanoparticle treatment groups, iBMDMs were plated to a density of 1[thin space (1/6-em)]000[thin space (1/6-em)]000 cells per well in a 12 well plate. At this desired density, the cells were primed with 100 ng mL−1 LPS followed by 100 μM nanoparticle or 10 μM nigericin as a positive control for 2 hours. Following incubation, the cells were stained with 1 μM MitoSOX Red in HBSS for 20 minutes. After staining, the cells were washed twice and then scraped in 1× PBS/HBSS, centrifuged at 2000 rpm for 5 minutes, and resuspended in 100 μL FACS staining buffer to run on an ACEA Novocyte Flow Cytometer. The events were gated following the first peak in fluorescence in the negative control sample (LPS) and increases in fluorescence were measured in Median Fluorescence Intensity (MFI).
Immunoblotting analysis. For western blot sample prep, iBMDMs were seeded in 60 mm Petri dishes to achieve a density of 3.2 million cells at the time of treatment. At this density, cells were primed with 100 ng mL−1 LPS for 4 hours and then treated with LNP in basal DMEM for 24 hours at 100 μM principal lipid dose, as previously described. After 24 hours, the supernatant was collected and supplemented with 0.1 mM PMSF for storage at −80 °C. Next, the cells were washed and scraped in 1× PBS and centrifuged at 2000 rpm for 5 minutes. Cell samples were then resuspended in 200 μL RIPA lysis buffer containing protease inhibitor and kept on ice while vortexing every 5 minutes for 30 minutes. The resultant lysate was then briefly sonicated, centrifuged at 10[thin space (1/6-em)]000 rpm for 15 minutes at 4 °C to remove cell debris, and stored at −80 °C. Prior to use, protein lysate and supernatant concentrations were determined using BCA estimation. Equal amounts of protein from each sample were then separated using sodium dodecyl sulfate polyacrylamide gel electrophoresis (SDS-PAGE) and transferred to a poly(vinylidene fluoride) (PVDF) membrane. Following blocking for 2 hours with 5% skim milk in TBST, the membranes were incubated with primary antibody diluted 1[thin space (1/6-em)]:[thin space (1/6-em)]1000 in TBST with 1% BSA overnight at 4 °C. Blots run using lysate protein samples were tested for NLRP3, Caspase-1, ASC, inactive and active GSDMD, and β-Actin. Supernatant samples were tested for inactive and active Caspase-1. After overnight incubation, the membranes were washed with TBST and incubated with HRP-conjugated secondary antibody (1[thin space (1/6-em)]:[thin space (1/6-em)]2000) in TBST with 1% BSA for 1 hour at room temperature. After final washing, the blots were developed by incubating in Biorad ECL Clarity substrate for 5 minutes, and the immunofluorescent bands were imaged using a Biorad ChemiDoc Imaging System. The blots were then analyzed using Biorad Image Lab and quantified using ImageJ software.
MTS cytotoxicity assay. To determine non-specific cell viability percentage to correlate with the pyroptosis observed in the previous assays, we conducted an MTS assay (one step MTT assay). For this, we seeded cells to be confluent at a density of 160[thin space (1/6-em)]000 cells per well in a 96 well plate. After achieving the desired density, the cells were treated with 4 h LPS at 100 ng mL−1 followed by 100 μM nanoparticle treatments for 24 hours. After 24 hours, media was replaced with fresh colorless basel DMEM, and treated with 20 μL PMS and MTS at a 1[thin space (1/6-em)]:[thin space (1/6-em)]20 ratio and left to incubate for 45 minutes. Cell viability was determined with LPS and nanoparticle untreated samples as a baseline.
Evaluation of mRNA encapsulation. GFP mRNA encapsulation was determined using the Thermo Fisher Quant-it RiboGreen RNA Assay. For this, two LNP samples were diluted 100-fold in 1× TE buffer, with one sample being treated with 2% Triton-X 100 surfactant to lyse the LNPs. The fluorescence signals of the non-lysed LNPs, indicating unencapsulated mRNA, as well as the lysed particles, indicating total mRNA concentration, were used to adequately calculate the average encapsulation efficiencies of each particle.
mRNA transfection using flow cytometry. To determine the transfection efficiency of GFP mRNA-encapsulating LNPs, iBMDMs and HEK293Ts were plated to achieve a density of 1[thin space (1/6-em)]000[thin space (1/6-em)]000 cells per well at the time of LNP treatment in separate 12-well plates. LNPs formulated with 5 μg mL−1 doses of mRNA were added to cells at the desired density. Lipofectamine MessengerMAX was used as a positive control to transfect the cells according to the manufacturer's protocol. After 24 hours, the cells were scraped in 1× PBS, spun at 2000 rpm for 5 minutes, and resuspended in 100 μL 1× PBS to run using an ACEA Novocyte Flow Cytometer. Transfection efficiency as well as median fluorescence intensity were both determined by gating events in NovoExpress software. These values were subsequently normalized by the average encapsulation efficiency of each LNP determined by RiboGreen, to account for differences in mRNA doses administered due to differing encapsulation efficiencies of the LNP formulations.
Statistical analysis. Unless otherwise stated, statistics were computed using ordinary one-way ANOVA analysis (GraphPad Prism 8). All the results were expressed as mean ± S.E.M (Standard Error of the Mean), and P < 0.05 was considered to be significant.

Live subjects statement

All institutional and national guidelines were followed for all the experiments and approved by the UMass Institutional Animal Care and Use Committee (IACUC). All experiments were performed in accordance with Guide for the Care and Use of Laboratory Animals and approved by the ethics committee at the University of Massachusetts Amherst.

Conflicts of interest

The authors declare no competing interests.

Acknowledgements

We would like to acknowledge the support and assistance provided by the Biophysical Characterization Core Facility and Light Microscopy Core Facility at the University of Massachusetts, Amherst. We would also like to thank Dr Kate Fitzgerald from the University of Massachusetts Chan Medical School and Dr Dominique Alfandari from the University of Massachusetts, Amherst, for donating the cell lines. Also, we would like to acknowledge the extensive help provided by McLean Taggart, Simran Singh, and Maharshi Debnath in nanoparticle synthesis, DLS analysis, and flow cytometry. Finally, the schematic figures were created with Biorender.com. This work was financially supported by the American Cancer Society Research Scholar Grant (RSG-19-009-01-CDD) and National Science Foundation CAREER Award (2142917) to A. K.

References

  1. N. Sharif, K. J. Alzahrani, S. N. Ahmed and S. K. Dey, Front. Immunol., 2021, 12, 714170 CrossRef CAS PubMed.
  2. K. A. Hajj, J. R. Melamed, N. Chaudhary, N. G. Lamson, R. L. Ball, S. S. Yerneni and K. A. Whitehead, Nano Lett., 2020, 20, 5167–5175 CrossRef CAS PubMed.
  3. J. C. Kaczmarek, P. S. Kowalski and D. G. Anderson, Genome Med., 2017, 9, 60 CrossRef PubMed.
  4. S. Liu, Q. Cheng, T. Wei, X. Yu, L. T. Johnson, L. Farbiak and D. J. Siegwart, Nat. Mater., 2021, 20, 701–710 CrossRef CAS PubMed.
  5. S. Patel, N. Ashwanikumar, E. Robinson, Y. Xia, C. Mihai, J. P. Griffith 3rd, S. Hou, A. A. Esposito, T. Ketova, K. Welsher, J. L. Joyal, O. Almarsson and G. Sahay, Nat. Commun., 2020, 11, 983 CrossRef CAS PubMed.
  6. R. U. Islam, J. Hean, W. A. van Otterlo, C. B. de Koning and P. Arbuthnot, Bioorg. Med. Chem. Lett., 2009, 19, 100–103 CrossRef CAS PubMed.
  7. D. Pozzi, C. Marchini, F. Cardarelli, H. Amenitsch, C. Garulli, A. Bifone and G. Caracciolo, Biochim. Biophys. Acta, 2012, 1818, 2335–2343 CrossRef CAS PubMed.
  8. Z. Chen and R. P. Rand, Biophys. J., 1997, 73, 267–276 CrossRef CAS PubMed.
  9. Q. Cheng, T. Wei, L. Farbiak, L. T. Johnson, S. A. Dilliard and D. J. Siegwart, Nat. Nanotechnol., 2020, 15, 313–320 CrossRef CAS PubMed.
  10. K. J. Hassett, K. E. Benenato, E. Jacquinet, A. Lee, A. Woods, O. Yuzhakov, S. Himansu, J. Deterling, B. M. Geilich, T. Ketova, C. Mihai, A. Lynn, I. McFadyen, M. J. Moore, J. J. Senn, M. G. Stanton, O. Almarsson, G. Ciaramella and L. A. Brito, Mol. Ther. – Nucleic Acids, 2019, 15, 1–11 CrossRef CAS PubMed.
  11. K. Bahl, J. J. Senn, O. Yuzhakov, A. Bulychev, L. A. Brito, K. J. Hassett, M. E. Laska, M. Smith, O. Almarsson, J. Thompson, A. M. Ribeiro, M. Watson, T. Zaks and G. Ciaramella, Mol. Ther., 2017, 25, 1316–1327 CrossRef CAS PubMed.
  12. P. R. Cullis and M. J. Hope, Mol. Ther., 2017, 25, 1467–1475 CrossRef CAS PubMed.
  13. M. Jayaraman, S. M. Ansell, B. L. Mui, Y. K. Tam, J. Chen, X. Du, D. Butler, L. Eltepu, S. Matsuda, J. K. Narayanannair, K. G. Rajeev, I. M. Hafez, A. Akinc, M. A. Maier, M. A. Tracy, P. R. Cullis, T. D. Madden, M. Manoharan and M. J. Hope, Angew. Chem., Int. Ed., 2012, 51, 8529–8533 CrossRef CAS PubMed.
  14. N. Veiga, M. Goldsmith, Y. Granot, D. Rosenblum, N. Dammes, R. Kedmi, S. Ramishetti and D. Peer, Nat. Commun., 2018, 9, 4493 CrossRef PubMed.
  15. D. Nandi, M. Shivrayan, J. Gao, J. Krishna, R. Das, B. Liu, S. Thayumanavan and A. Kulkarni, ACS Appl. Mater. Interfaces, 2021, 13, 45300–45314 CrossRef CAS PubMed.
  16. A. Stutz, G. L. Horvath, B. G. Monks and E. Latz, Methods Mol. Biol., 2013, 1040, 91–101 CrossRef CAS PubMed.
  17. D. Nandi, N. S. S. Farid, H. A. R. Karuppiah and A. Kulkarni, J. Mol. Biol., 2022, 434, 167251 CrossRef CAS PubMed.
  18. X. Ma, Y. Li, W. Shen, A. O. Oladejo, J. Yang, W. Jiang, B. H. Imam, X. Wu, X. Ding, Y. Yang, S. Wang and Z. Yan, Front. Immunol., 2021, 12, 676088 CrossRef CAS PubMed.
  19. P. Broz and V. M. Dixit, Nat. Rev. Immunol., 2016, 16, 407–420 CrossRef CAS PubMed.
  20. B. Sun, X. Wang, Z. Ji, R. Li and T. Xia, Small, 2013, 9, 1595–1607 CrossRef CAS PubMed.
  21. A. S. Yazdi, G. Guarda, N. Riteau, S. K. Drexler, A. Tardivel, I. Couillin and J. Tschopp, Proc. Natl. Acad. Sci. U. S. A., 2010, 107, 19449–19454 CrossRef CAS PubMed.
  22. D. M. Gomez, S. Urcuqui-Inchima and J. C. Hernandez, Innate Immun., 2017, 23, 697–708 CrossRef CAS PubMed.
  23. E. Frohlich, Int. J. Nanomed., 2012, 7, 5577–5591 CrossRef PubMed.
  24. T. M. Sager, M. Wolfarth, S. S. Leonard, A. M. Morris, D. W. Porter, V. Castranova and A. Holian, Inhalation Toxicol., 2016, 28, 686–697 CrossRef CAS PubMed.
  25. Z. Zhong, Y. Zhai, S. Liang, Y. Mori, R. Han, F. S. Sutterwala and L. Qiao, Nat. Commun., 2013, 4, 1611 CrossRef PubMed.
  26. M. Pizzuto, P. Bigey, A. M. Lachages, C. Hoffmann, J. M. Ruysschaert, V. Escriou and C. Lonez, J. Controlled Release, 2018, 287, 67–77 CrossRef CAS PubMed.
  27. C. Lonez, M. Bessodes, D. Scherman, M. Vandenbranden, V. Escriou and J. M. Ruysschaert, Nanomedicine, 2014, 10, 775–782 CrossRef CAS PubMed.
  28. S. Ndeupen, Z. Qin, S. Jacobsen, A. Bouteau, H. Estanbouli and B. Z. Igyarto, iScience, 2021, 24, 103479 CrossRef CAS PubMed.
  29. L. A. Jackson, E. J. Anderson, N. G. Rouphael, P. C. Roberts, M. Makhene, R. N. Coler, M. P. McCullough, J. D. Chappell, M. R. Denison, L. J. Stevens, A. J. Pruijssers, A. McDermott, B. Flach, N. A. Doria-Rose, K. S. Corbett, K. M. Morabito, S. O’Dell, S. D. Schmidt, P. A. Swanson 2nd, M. Padilla, J. R. Mascola, K. M. Neuzil, H. Bennett, W. Sun, E. Peters, M. Makowski, J. Albert, K. Cross, W. Buchanan, R. Pikaart-Tautges, J. E. Ledgerwood, B. S. Graham and J. H. Beigel, N. Engl. J. Med., 2020, 383, 1920–1931 CrossRef CAS PubMed.
  30. U. Sahin, A. Muik, E. Derhovanessian, I. Vogler, L. M. Kranz, M. Vormehr, A. Baum, K. Pascal, J. Quandt, D. Maurus, S. Brachtendorf, V. Lorks, J. Sikorski, R. Hilker, D. Becker, A. K. Eller, J. Grutzner, C. Boesler, C. Rosenbaum, M. C. Kuhnle, U. Luxemburger, A. Kemmer-Bruck, D. Langer, M. Bexon, S. Bolte, K. Kariko, T. Palanche, B. Fischer, A. Schultz, P. Y. Shi, C. Fontes-Garfias, J. L. Perez, K. A. Swanson, J. Loschko, I. L. Scully, M. Cutler, W. Kalina, C. A. Kyratsous, D. Cooper, P. R. Dormitzer, K. U. Jansen and O. Tureci, Nature, 2020, 586, 594–599 CrossRef CAS PubMed.
  31. J. J. Baljon, A. Dandy, L. Wang-Bishop, M. Wehbe, M. E. Jacobson and J. T. Wilson, Biomater. Sci., 2019, 7, 1888–1897 RSC.
  32. S. M. Pustulka, K. Ling, S. L. Pish and J. A. Champion, ACS Appl. Mater. Interfaces, 2020, 12, 48284–48295 CrossRef CAS PubMed.
  33. M. Herrera, J. Kim, Y. Eygeris, A. Jozic and G. Sahay, Biomater. Sci., 2021, 9, 4289–4300 RSC.
  34. V. Compan, F. Martin-Sanchez, A. Baroja-Mazo, G. Lopez-Castejon, A. I. Gomez, A. Verkhratsky, D. Brough and P. Pelegrin, J. Immunol., 2015, 194, 1261–1273 CrossRef CAS PubMed.
  35. O. Lunov, T. Syrovets, C. Loos, G. U. Nienhaus, V. Mailander, K. Landfester, M. Rouis and T. Simmet, ACS Nano, 2011, 5, 9648–9657 CrossRef CAS PubMed.
  36. C. Li, J. Zhou, Y. Wu, Y. Dong, L. Du, T. Yang, Y. Wang, S. Guo, M. Zhang, A. Hussain, H. Xiao, Y. Weng, Y. Huang, X. Wang, Z. Liang, H. Cao, Y. Zhao, X. J. Liang, A. Dong and Y. Huang, Nano Lett., 2021, 21, 3680–3689 CrossRef CAS PubMed.
  37. H. Moradian, T. Roch, A. Lendlein and M. Gossen, Sci. Rep., 2020, 10, 4181 CrossRef CAS PubMed.
  38. M. Herb, A. Farid, A. Gluschko, M. Kronke and M. Schramm, J. Visualized Exp., 2019, 153, e60143 Search PubMed.
  39. M. V. Baranov, M. Kumar, S. Sacanna, S. Thutupalli and G. van den Bogaart, Front. Immunol., 2020, 11, 607945 CrossRef CAS PubMed.
  40. B. M. Bruininks, P. C. Souza, H. Ingolfsson and S. J. Marrink, eLife, 2020, 9, e52012 CrossRef CAS PubMed.
  41. Q. D. Huang, W. J. Ou, H. Chen, Z. H. Feng, J. Y. Wang, J. Zhang, W. Zhu and X. Q. Yu, Eur. J. Pharm. Biopharm., 2011, 78, 326–335 CrossRef CAS PubMed.

Footnote

Electronic supplementary information (ESI) available. See DOI: https://doi.org/10.1039/d2bm00883a

This journal is © The Royal Society of Chemistry 2022