
Destructive fibrotic teamwork: how both microenvironment stiffness and profibrotic interleukin 13 impair alveolar macrophage phenotype and function†
Kartik
Bomb
 a,
Lina
Pradhan
a,
Qi
Zhang
a,
Bader M.
Jarai
a,
Arnab
Bhattacharjee
b,
David L.
Burris
b,
April M.
Kloxin
*ac and
Catherine A.
Fromen
*a
a,
Lina
Pradhan
a,
Qi
Zhang
a,
Bader M.
Jarai
a,
Arnab
Bhattacharjee
b,
David L.
Burris
b,
April M.
Kloxin
*ac and
Catherine A.
Fromen
*a
aChemical and Biomolecular Engineering, University of Delaware, Newark, DE, USA. E-mail: cfromen@udel.edu; akloxin@udel.edu
bMechanical Engineering, University of Delaware, Newark, DE, USA
cMaterial Science and Engineering, University of Delaware, Newark, DE, USA
First published on 18th August 2022
Abstract
The pulmonary fibrotic microenvironment is characterized by increased stiffness of lung tissue and enhanced secretion of profibrotic soluble cues contributing to a feedback loop that leads to dysregulated wound healing and lung failure. Pinpointing the individual and tandem effects of profibrotic stimuli in impairing immune cell response remains difficult and is needed for improved therapeutic strategies. We utilized a statistical design of experiment (DOE) to investigate how microenvironment stiffness and interleukin 13 (IL13), a profibrotic soluble factor linked with disease severity, contribute to the impaired macrophage response commonly observed in pulmonary fibrosis. We used engineered bioinspired hydrogels of different stiffness, ranging from healthy to fibrotic lung tissue, and cultured murine alveolar macrophages (MH-S cells) with or without IL13 to quantify cell response and analyze independent and synergistic effects. We found that, while both stiffness and IL13 independently influence macrophage morphology, phenotype, phagocytosis and efferocytosis, these factors work synergistically to exacerbate impaired macrophage phenotype and efferocytosis. These unique findings provide insights into how macrophages in fibrotic conditions are not as effective in clearing debris, contributing to fibrosis initiation/progression, and more broadly inform how underlying drivers of fibrosis modulate immune cell response to facilitate therapeutic strategies.
Introduction
Pulmonary fibrosis is a form of interstitial lung disease (ILD) characterized by dysregulated wound healing, resulting in lung scarring and irreversible damage to the lung architecture.1,2 Several risk factors have been linked to the increased precedence of the disease, including radiation and chemotherapeutics,3 viral infections,4 environmental and occupational exposure to hazardous materials,5 and genetic factors.6 Amongst different ILDs, idiopathic pulmonary fibrosis (IPF) is the most archetypal and severe disease of unknown etiology with an incidence rate of 3–18 cases per 100![[thin space (1/6-em)]](https://www.rsc.org/images/entities/char_2009.gif) 000 people in the US and Europe and a median survival rate of 2–3 years.7 The current understanding of IPF best classifies the disease as a result of aberrant wound healing.8 However, the initiation and early stage mechanism of this dysregulated wound healing remain poorly understood, preventing the development of effective therapeutics. The fibrogenesis is hypothesized to be initiated by repeated micro-injuries to the alveolar epithelium, resulting in a maladaptive wound healing response orchestrated by activated fibroblasts.9 These activated fibroblasts are involved in matrix remodeling following epithelium injury by secreting and depositing key extracellular matrix (ECM) proteins.10 Excess production of these ECM proteins is a hallmark of IPF progression resulting in tissue stiffening, decreased vital lung capacity, and eventual lung failure.11 Contributing to the aberrant wound healing,12 activated macrophages are also hypothesized to play a central role in the profibrotic feedback loop by secreting profibrotic cues that reinforce fibroblast activation.13 Insights into the compelling microenvironment factors that drive impaired macrophage polarization and function in this complex process are needed to identify therapeutic approaches that can reverse their destructive contributions to IPF as one approach to decelerating the profibrotic loop.
000 people in the US and Europe and a median survival rate of 2–3 years.7 The current understanding of IPF best classifies the disease as a result of aberrant wound healing.8 However, the initiation and early stage mechanism of this dysregulated wound healing remain poorly understood, preventing the development of effective therapeutics. The fibrogenesis is hypothesized to be initiated by repeated micro-injuries to the alveolar epithelium, resulting in a maladaptive wound healing response orchestrated by activated fibroblasts.9 These activated fibroblasts are involved in matrix remodeling following epithelium injury by secreting and depositing key extracellular matrix (ECM) proteins.10 Excess production of these ECM proteins is a hallmark of IPF progression resulting in tissue stiffening, decreased vital lung capacity, and eventual lung failure.11 Contributing to the aberrant wound healing,12 activated macrophages are also hypothesized to play a central role in the profibrotic feedback loop by secreting profibrotic cues that reinforce fibroblast activation.13 Insights into the compelling microenvironment factors that drive impaired macrophage polarization and function in this complex process are needed to identify therapeutic approaches that can reverse their destructive contributions to IPF as one approach to decelerating the profibrotic loop.
Macrophages are professional phagocytes that can activate to phenotypes historically characterized as either classically-activated, pro-inflammatory (M1) or alternatively-activated, anti-inflammatory (M2) based on microenvironment cues.14–16 Improper balances of these activated phenotypes can lead to macrophages becoming key players in various pulmonary diseases.17,18 In IPF, the current hypothesis of macrophage involvement begins with M1 macrophages contributing to the initial stages of injury to maximize cytotoxic activity and neutralize infection, followed by a phenotypical shift towards M2 prevalence to resolve inflammation and mediate wound healing responses (e.g., fibroblast activation and proliferation, supporting further ECM remodeling).19,20 In support of this, cellular population analyses both in clinical settings and in animal models (predominantly murine models) have repeatedly shown increased presence and persistence of more M2-like macrophages in the later stages of fibrosis that further exacerbates the profibrotic feedback loop and fibrosis progression.13,21 Indeed, studies of IPF patients have revealed an increased presence of M2 macrophages in the bronchoalveolar lavage (BAL) and serum.22,23 Excess M2 polarization supports secretion of pro-fibrotic mediators such as transforming growth factor β (TGF-β) that increases fibroblast recruitment and activation through paracrine signaling.24 Similar observations have been made in murine fibrotic models (i.e., bleomycin-induced fibrosis) in which increased M2 macrophage presence contributes to the profibrotic loop by secretion of soluble factors (e.g., TGF-β, C–C motif chemokine ligand 2 [CCL2], and platelet-derived growth factor [PDGF])25 and are influenced by other known fibrotic cues (e.g., interleukins [IL] 13 and 10)26,27 that ultimately impair macrophage response and phenotype. Limited observations also have suggested that macrophages display an impaired phagocytic profile in late-stage fibrotic disease that likely exacerbates impaired remodeling.28,29
Given the complex interplay of profibrotic signals, identifying a single point of fibrotic initiation or main contributor to macrophage persistence within the profibrotic loop remains difficult. To investigate the underlying drivers of fibrosis, reductive models of IPF mimicking changes in the fibrotic microenvironment have been pursued.30,31 Some of these changes in the fibrotic microenvironment include increased stiffness of lung tissue due to the excess deposition of the ECM32 (Young's modulus (E) ∼ 1.5–3 kPa for healthy lung tissue to E ∼ 20–25 kPa for fibrotic tissue), increased presence of profibrotic soluble factors (such as IL13),33 and the enhanced secretion and presence of select ECM components.34 Our group35,36 and others37,38 have highlighted the role of ECM components in fibrosis towards promoting fibroblast activation and proliferation on mechanically relevant hydrogel culture systems. Similarly other studies have investigated changes in macrophage function, including phenotypical changes,39,40 morphology,41,42 and phagocytosis39,41,43 by varying substrate stiffness in the presence of different polarizing factors. While these factors individually have been shown to modulate macrophage phenotype, there is still a limited understanding of how these variables work together or independently to drive impaired phenotypes and ultimately accelerate disease progression. Identification of parallel or synergistic drivers of IPF will not only inform hypotheses of early-stage disease underpinnings, but also generate focused approaches for identifying therapeutic intervention priorities.
In this work, we sought to investigate if substrate stiffness and profibrotic IL13, two key parameters of fibrosis progression, act synergistically or independently in altering macrophage phenotype and function. For this, we utilized a mechanically relevant 2D hydrogel culture platform with defined mechanical (stiffness) cues inspired by the stiffness of healthy and fibrotic lung tissue and biochemical cues (IL13) inspired by the increased secretion of IL13 in the fibrotic microenvironment33 and for its role in activating other immune cells25,44 to investigate the response of murine alveolar macrophage cells (MH-S cells). We hypothesized that both IL13 and matrix stiffness work synergistically to alter the phenotype and impair the function of alveolar macrophages. To assess this, we applied a statistical design of experiments (DOE) approach with two-factor factorial design, examining at “low” and “high” profibrotic stimuli conditions, and quantified both individual and combinatorial effects of these microenvironmental cues on macrophage responses, including the morphological, phenotypical, and phagocytic profile of alveolar macrophages under different culture conditions (Fig. 1). We chose two levels for stiffness, low (E ∼ 2–3 kPa) and high (E ∼ 20–22 kPa) that were inspired by the stiffness of healthy lung tissue and fibrotic lung tissue, and two levels of IL13, low (0 ng mL−1 IL13) and high (20 ng mL−1), based on literature precedence.39,41 This DOE approach contributes to the understanding of microenvironment cues for altered macrophage function in fibrosis including impaired phagocytosis and highlights the importance of investigating the effect of pro-fibrotic factors both individually and in tandem for unravelling complex immune cell responses to identify better therapeutic targets.
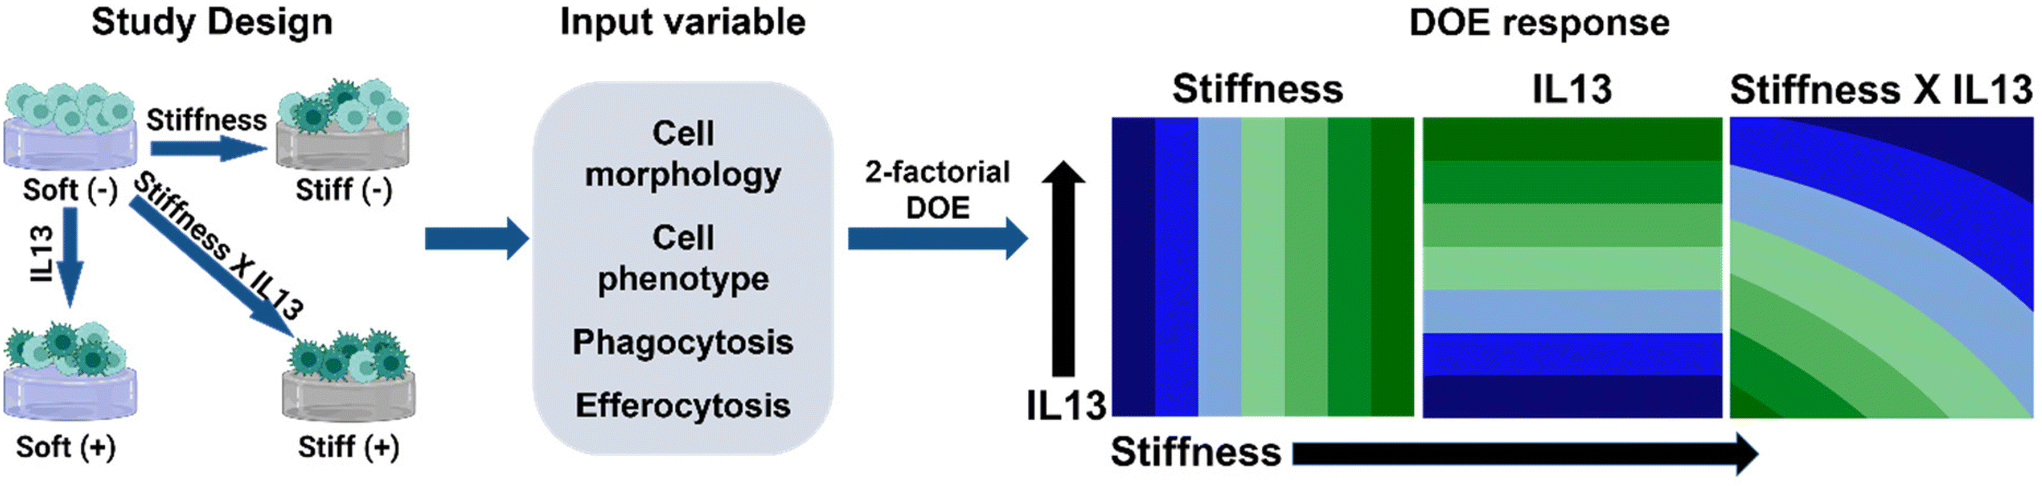 | ||
| Fig. 1 Approach Overview. The goal of this study was to test the individual and synergistic effects of hydrogel stiffness and profibrotic soluble factor (IL13) on macrophage response, from phenotype to particle clearance, that are thought to be critical in the role of macrophages in pulmonary fibrosis initiation and progression, yet remain difficult to examine. To study this effect, alveolar macrophages (MH-S cells) were cultured on Soft and Stiff hydrogels with and without IL13 and the response of interest was investigated. A 2-factorial design of experiment approach was then applied to the response (input variables: cell morphology, cell phenotype, phagocytosis, and efferocytosis) to determine the independent or synergistic effects of stiffness and IL13 on modulating macrophage phenotype and functions. Model DOE results are shown depicting individual and synergistic trends. | ||
Experimental section
PEG-norbornene functionalization and characterization
Functionalization of 4-arm amine terminated PEG (PEG-4-NH2; ∼10 kDa) (JenKem Technology USA Inc.) with norbornene was performed using a previously established protocol.45 Briefly, PEG-4-NH2 (5 g, 1 eq.) was added to an argon-purged 100 mL round bottom flask (RBF) and dissolved in anhydrous N,N-dimethylformamide (DMF, ThermoFisher) at room temperature. In another argon-purged 250 mL RBF, 5-norbornene-2-carboxylic acid (Nb-COOH) (0.54 mL, 8.8 eq., Sigma Aldrich), hexafluorophosphate azabenzotriazole tetramethyl uronium (HATU) (1.52 g, 8 eq., Sigma Aldrich), and 4-methylmorpholine (4-MMP) (0.99 mL, 18 eq., TCI chemicals) were dissolved in 20 mL anhydrous DMF at room temperature. After the reagents were dissolved completely in the DMF, the PEG solution was added dropwise using a syringe to the other RBF containing dissolved norbornene solution and stirred overnight. The functionalized PEG was purified by precipitation in ice-cold diethyl ether two times (250 mL) and the solid product was collected by vacuum filtration using a Buchner funnel with filter paper number 5. The solid polymer product was dried in the vacuum oven overnight at room temperature and further purified by dialysis (MWCO 1 kDa, Spectrum Laboratories) against deionized water (DI water) for 2 days. The purified product was frozen and lyophilized and the functionality (purity) of the norbornene functionalized PEG (PEG-4-Nb) was quantified (functionality of ∼85% norbornene per 4-arm PEG) using 1H NMR (AV600 NMR spectrometer) in DMSO-d6 (Fig. S1†). The yield was ∼70%. PEG-4-Nb was dissolved in phosphate buffered saline (PBS) and stored at −80 °C until further use.LAP synthesis
The photoinitiator, lithium phenyl-2,4,6-trimethylbenzoylphosphinate (LAP), was synthesized using a previously published protocol.46 Briefly, in an argon-purged RBF, 2,4,6-trimethylbenzoyl (3.2 g, Sigma Aldrich) and dimethyl phenylphosphinate (3 g, Sigma Aldrich) were added and stirred overnight at room temperature. The following day, Lithium Bromide (6.1 g, Sigma Aldrich) was dissolved in 2-Butanone (100 mL, Sigma Aldrich) and added dropwise to the reaction mixture using a syringe. The reaction mixture was heated (50 °C, 10 minutes) in an oil bath and formation of a solid precipitate was observed. The reaction mixture was cooled to room temperature for 4 hours and filtered to recover the solid final product. The product was dried under vacuum and the product purity was confirmed using 1H NMR in DMSO-d6 (Fig. S2†). The purified product was stored at −80 °C until further use.Peptide synthesis and characterization
All peptides were synthesized by solid phase peptide synthesis using standard Fmoc chemistry and contained cysteine amino acids to facilitate covalent crosslinking between the pendant thiol (SH) of the peptides and the norbornene (Nb) end group of the PEG-4-Nb monomer. The difunctional linker peptide (GCGKVPMSMRGGKGCG) and monofunctional pendant peptides (CGGPHSRNG10RGDSP [PHSRN] (integrin binding peptide) and CGGHRPSNG10RGSDP [HRPSN] (scrambled peptide)) were synthesized on a microwave-assisted automated peptide synthesizer (Liberty Blue; CEM, Matthews, NC) using triple coupling of Fmoc-protected amino acids (Chempep). The peptides were cleaved from the resin using 95% (v/v) trifluoroacetic acid (Acros organics), 2.5% (v/v) triisopropylsilane (Acros Organics) 2.5% (v/v) DI water, and 5% (w/v) Dithiothreitol (Research Products International) for 4 hours while stirring at room temperature. Cleaved peptides were precipitated in cold diethyl ether for 5 times (9× excess volume) and dried overnight. Crude peptides were dissolved in 95% DI water and 5% Acetonitrile (ThermoFisher) and purified using reverse-phase high performance liquid chromatography (HPLC; XBridge BEH C18 OBD 5 μm column; Waters, Milford, MA) with a linear water-acetonitrile gradient (95:5 to 55:45 H2O:ACN over 40 minutes). The purified peptides were lyophilized, and the molecular weight was confirmed by mass spectrometry (Fig. S3–S5†). The lyophilized peptides were reconstituted in the sterile PBS and the thiol concentration of each peptide solution was determined using Ellman's assay. The peptides were aliquoted and stored at −80 °C until further use.
Hydrogel polymerization
Hydrogels were prepared using thiol–ene click chemistry based on modified versions of established protocols.45 Precursor monomer solutions at different monomer and linker peptide concentrations were polymerized to make hydrogels with different moduli (‘stiffness’): (a) Soft hydrogels were prepared using 11 mM PEG-4-Nb, 9 mM linker peptide, and (b) Stiff hydrogels were prepared using 23 mM PEG-4-Nb, 21 mM linker peptide. For all the conditions, 2 mM pendant peptide (PHSRN or HRPSN) and 2.2 mM LAP were used. A 1:1 stoichiometric ratio between thiol and norbornene was maintained for all the studies. Hydrogels were polymerized upon irradiation for 5 minutes using long wavelength UV light (10 mW cm−2, 365 nm) with an Omnicure Series 2000 light source (Excilitas, Waltham, MA) with light guide and a collimating lens. For modulus measurements, 30 μL precursor solution was polymerized in a 1 mL syringe (with the tip cut off) and the hydrogels were equilibrium swollen in PBS overnight. For the cell culture experiments, hydrogels were formed on glass coverslips (12 mm) under sterile conditions using cylindrical gasket mold (11 mm diameter, 0.5 mm height). Precursor solution (60 μL) was placed in each mold and this monomer solution was polymerized for 5 minutes. A single hydrogel was made at a time and then placed in non-tissue culture treated 24-well plate. The hydrogels were washed once with sterile PBS and incubated with 500 μL of sterile PBS overnight.
Surface modulus measurement using microindentation
Microindentation was used to determine the surface moduli of the hydrogels and identify the monomer concentrations that achieved the desired stiffness, where final hydrogel compositions were noted above.32 Microindentation experiments were performed with a custom made tribometer using 1.5 mm diameter alumina spherical indenter probe to measure contact modulus of the hydrogel surface.47 The microtribometer had a nanopositioning stage (PI Q-545.240) with a range of 26 mm and a resolution of 6 nm and was used to control indentation depth. A custom load cell consisting of a calibrated cantilevered beam (1165 N m−1) and a capacitance sensor (Lion Precision CPL290, C3S) was used to measure beam deflection. The thickness of each hydrogel was measured before placing the sample on the indentation platform and different normal forces (0.25–5 mN) were applied to achieve a maximum indentation depth of ∼15% (relative to hydrogel thickness). The contact force was calculated by multiplying the beam deflection by the spring constant of the cantilever beam. The difference between the stage displacement and the beam deflection provided the indentation depth of the Alumina probe into the sample. Contact moduli then were obtained by fitting the contact force, indenter radius, and indentation depth in the Hertz model.47 Six indentation measurements were performed per sample to account for the spatial variation.For in situ modulus measurements, monomer solution was polymerized on an AR-G2 rheometer (TA Instruments, New Castle, DE) with UV-Vis light accessory, 8 mm geometry, and Omnicue Series 2000 light source (Excilitas, Waltham, MA) with liquid filled light guide (10 mW cm−2 at 365 nm, 5 minutes). During polymerization, storage modulus was measured over time at a strain of 2.5% and a frequency of 1 rad s−1 to achieve measurements within the linear viscoelastic regime. Final Young's modulus (E) was calculated from the measured final storage modulus (G′) using the rubber elasticity theory, adjusting for theoretical equilibrium swelling.45
Mammalian cell culture and maintenance
An immortalized murine alveolar macrophage cell line (MH-S) was purchased from the American Type Culture Collection (ATCC). MH-S cells were cultured at 37 °C with 5% CO2 under sterile conditions in the complete media containing RPMI 1640 Medium (Corning) supplemented with 10% (v/v) heat-inactivated fetal bovine serum (FBS; Gibco) and 1% (v/v) penicillin/streptomycin (PS, Corning). Cells were expanded on T-75 tissue culture flasks and spent media was replaced with fresh media every 2–3 days. Upon 80% confluency, cells were detached from T-75 using Trypsin/EDTA (3 minutes, Corning) and either used in the experiments as needed or subcultured following the vendor instructions. All the experiments in this study were performed between passage 2 and passage 10.Cell seeding and culture on hydrogels (2D hydrogel culture)
The 24-well plate containing equilibrium swollen hydrogels of different stiffness was removed from the incubator; PBS was removed and hydrogels were washed once with fresh RPMI media before adding fresh media. Hydrogels were equilibrated in the media for 2 hours. The required number of detached MH-S cells (using trypsin/EDTA) from T-75 flasks were resuspended in RPMI media (500 μL per well) and seeded dropwise on top of the hydrogels uniformly at a seeding density of 100000 cells cm−2. Cell-hydrogel constructs were incubated at 37 °C with 5% CO2 to allow the cells to adhere on the hydrogels. After 24 hours, hydrogels were transferred to a fresh non-tissue culture treated 24-well plate to remove any unattached cells and 500 μL of fresh media was added to each well. Cells were incubated for an additional 24 hours at 37 °C with 5% CO2 before using the cells for experiments. 48 hours post seeding, cells were either polarized with IL13 cytokine (20 ng mL−1) or media was replenished for non-IL13 treated conditions for 24 hours. After polarization for 24 hours, cells were either prepared for further experiments or the samples were processed for analysis. For each experiment, cells were subcultured from the same thawed vial to ensure uniform culture history for all the conditions. Metabolic activity of cells for cells cultured on hydrogels over time was assessed using an alamarBlue assay (ThermoFisher) according to the manufacturer's instructions. Briefly, alamarBlue reagent was diluted 1:10 in complete media, and the cells cultured on hydrogels were incubated in the diluted alamarBlue solution for 4 hours after which the fluorescence was measured on the plate reader (Ex. 560, Em. 590).
Cell attachment and cell spread
To quantify the effect of stiffness and presence of IL13 cytokine on cell attachment and cell spread area, MH-S cells were seeded on hydrogels and the cell hydrogel constructs were imaged on BioTek Cytation 5 Multimode Imager (Agilent Technologies, Santa Clara, CA). To determine the attached cell count on each hydrogel sample, multiple images were captured using the 4X objective, allowing examination of a broad, representative hydrogel area. To assess cell spreading, multiple images per sample were captured using the 20× objective. Image analysis for both cell attachment and cell spreading was performed using Fiji-ImageJ (National Institutes of Health, Bethesda, MD). Briefly, the images were converted into binary format and individual cells in a cell cluster were identified using the watershed option and analyzed using the analyze particle option in the software. For cell attachment studies, at least 5 replicates were used for each culture condition and minimum of 4 images from each replicate were captured. For cell spread quantification, 3 replicates were used for each condition and between 7 and 10 images were captured from each replicate.Phagocytosis and efferocytosis assays
Internalization of lipid microparticles by MH-S cells seeded on hydrogels was performed to assess the effect of stiffness and IL13 on particle uptake. Sterile and endotoxin free fluorescent lipid microparticles (3 μm diameter) were purchased from Echelon Biosciences (Salt Lake City, Utah) and used without further modification. Cells were seeded and polarized using IL13 as described above. To determine efferocytosis by cells, phosphatidylserine (PS) coated microparticles were used; phagocytosis by cells was quantified using phosphatidylcholine (PC) coated microparticles. Briefly, both PS and PC sterile microparticles were sonicated for 10 minutes followed by vortexing for 1 minute to achieve a uniform particle suspension. The required volume of particle suspension was mixed with fresh RPMI media (200 μL) to achieve a final concentration of ∼5 particles per cell (∼15 μg mL−1). Cell-hydrogel constructs were washed once with fresh media and 300 μL of fresh media per well was added. Particle suspensions were added on top of the hydrogels dropwise and cells were placed at 37 °C in 5% CO2 for 6 hours to allow for particle internalization. Post incubation, cells were washed twice with sterile PBS to remove non-internalized particles. Samples were imaged on LSM 800 Confocal Microscope (Zeiss) followed by preparing the samples for flow cytometry to assess the %microparticle+ cell population for different hydrogel conditions. At least 3 hydrogel samples per condition were used for the internalization assay.Flow cytometry analysis for macrophage phenotype and internalization
Changes in macrophage phenotype for cells seeded on different hydrogel conditions were determined using flow cytometry. Cells were washed twice with cold PBS and the cells were detached from hydrogels by incubating with TrypLE Express (300 μL; 3 minutes; Gibco) at 37 °C in 5% CO2. Cells were checked under the microscope to ensure complete cell detachment and 300 μL of FACS buffer (2% (v/v) FBS in PBS) was added to quench the TrypLE Express. The cell suspension was transferred to 1.5 mL Eppendorf tubes, centrifuged (500g, 5 minutes, 4 °C), and washed twice with ice-cold PBS. Cells were blocked with anti-CD16/32 (BioLegend, San Diego, CA) for 15 minutes on ice to minimize non-specific binding followed by staining for surface markers for 30 minutes using the following antibodies: anti-CD86-AlexaFluor700 and anti-CD80-Pacific Blue (from BioLegend). Cells were washed twice with ice-cold PBS and then fixed using 4% paraformaldehyde (PFA) in PBS (Alfa Aesar) for 15 minutes. Cells were then permeabilized using Intracellular Staining Permeabilization Wash Buffer (Biolegend) and intracellular staining was done on ice for 30 minutes with anti-CD206-PE-Cy7 (BioLegend). Flow cytometry analysis was performed using ACEA NovoCyte Flow Cytometer (Agilent Technologies, Santa Clara, CA). All samples were gated to identify single cell population (Fig. S6†) and mean fluorescence intensity (MFI) was quantified to measure changes in marker expression. MFI for all the samples was normalized to Soft condition without IL13 (Soft (–)). At least 3 hydrogel samples per condition were used for the flow cytometry analysis.Similarly, to analyze the extent of phagocytosis and efferocytosis by cells, fluorescent lipid particles were added to the cells as described earlier (phagocytosis and efferocytosis assay) and the internalization was quantified using flow cytometry. Briefly, cells were detached (TrypLE Express), washed twice with FACS buffer, and quenched with 0.4% Trypan Blue dye before running on the flow cytometer to account only for internalized particles. The data was collected on the FITC channel to measure particle uptake and MFI. For all the conditions, MFI was normalized to the Soft condition without IL13 (Soft (–)). At least 3 hydrogel samples per condition were used for the flow cytometry analysis.
Cytokine analysis using Enzyme Linked ImmunoSorbent Assay (ELISA)
The phenotype of macrophages cultured on hydrogels was further quantified by measuring the release of cytokines using ELISA. Media in which cells were being cultured under different conditions was collected and centrifuged to remove any debris and then frozen at −80 °C. These conditioned media samples were shipped to the University of Maryland Cytokine Core to analyze the concentration of the following cytokines within them: C–C Motif Chemokine Ligand 2 (CCL2), Transforming growth factor beta (TGF-β), Tumor necrosis factor alpha (TNF-α), and Interleukin 1 beta (IL-1β). Media from at least 3 hydrogel samples per condition was used for the ELISA assay. Absolute concentrations for each cytokine were determined using a standard curve.RNA isolation and gene expression analysis using RT-qPCR
To examine the effect of stiffness on macrophage phenotype at the gene level, cells were seeded and polarized on hydrogels as described earlier. Cells then were washed once with warm PBS and detached from hydrogels by incubating with TrypLE Express (300 μL; 3 minutes) at 37 °C in 5% CO2. Cells were checked under the microscope to ensure complete cell detachment and diluted with 300 μL of FACS buffer. Cells were washed once with warm PBS followed by preparing the samples for RNA isolation. For each replicate, samples from two hydrogels were pooled. RNA from the cells was isolated using a RNeasy plus mini kit (Qiagen) following the manufacturer's protocol. The purity and content of the isolated RNA was determined using UV-Vis spectrophotometer (Nanodrop; Thermo Scientific, Waltham, MA); the A260/A280 value was verified to be equal to or above 1.8 for each sample. After RNA isolation, cDNA was synthesized using a QuantiTect Reverse Transcription Kit (Qiagen) following the manufacturer's protocol. Reverse transcription quantitative real-time PCR (RT-qPCR) was run using a SYBR-Green master mix according to the manufacturer's instructions. Primers for the genes of interest (CD206 and IL-1β) were selected from the literature48 and are listed in Table S1.† The ΔΔCt method was used to quantify gene expression, with GAPDH as housekeeping gene.49 Gene expression of cells on Stiff hydrogels was normalized to the Soft hydrogel condition. RT-qPCR was run on CFX96 detection system (Bio-rad, Hercules, CA). 3 replicates per condition were used for the gene expression analysis.Immunofluorescent staining of cells on 2D hydrogels
After polarization for 24 hours in conditions of interest, cells were prepared for immunostaining. Cells on the hydrogel substrate were washed twice with PBS (5 minutes) and fixed using 4% PFA for 15 minutes at room temperature. Fixed cells cultured on hydrogels were washed twice with PBS and then incubated in 0.25% v/v Triton-X (ThermoFisher Scientific) for 15 minutes at room temperature while rocking for permeabilization. Samples were further washed twice with 0.1% v/v Triton X-100 in 1 wt% Bovine Serum Albumin (BSA; ThermoFisher Scientific) for 5 minutes while rocking and then incubated with 0.2% v/v Triton X-100 in 3 wt% BSA for 1 hour at room temperature while rocking for blocking and permeabilization. Permeabilized samples were incubated with primary antibody in 0.2% v/v Triton-X/3 wt% BSA (rabbit Anti-Mannose Receptor (CD206), 1:100, Abcam, Waltham, MA) overnight at 4 °C. Samples were washed thrice with 0.1% v/v Triton X-100/1 wt% BSA for 15 minutes at room temperature while rocking. The secondary antibody (goat anti-rabbit AlexaFluor 488, 1:100, Invitrogen) and actin red (10% v/v; F-actin stain) were added in 0.2% v/v Triton-X/3 wt% BSA solution and incubated at room temperature with samples for 3 hours while rocking. Samples were washed thrice with 0.1% v/v Triton X-100/1 wt% BSA for 15 minutes and incubated with Hoechst stain (0.4% v/v, Invitrogen) in PBS for 45 minutes at room temperature. Samples were washed twice with PBS and stored in PBS at 4 °C protected from light until imaging. Hydrogel samples were placed on a glass slide and imaged using a LSM 800 confocal microscope.
Statistical analysis
A two-factorial DOE approach was used to assess macrophage phenotype and function in response to hydrogel stiffness and IL13 and determine the independent (linear) and synergistic (non-linear) effects of factors on macrophage response. In this study, the independent input variables were matrix modulus (“Low” – 3 kPa (‘Soft’ hydrogel condition) and “High” – 22 kPa (‘Stiff’ hydrogel condition)) and IL13 concentration (“Low” – 0 ng mL−1 and “High” – 20 ng mL−1). For the output response variables, macrophage morphology, phenotype (flow cytometry and cytokine secretion), phagocytosis, and efferocytosis were quantitatively analyzed to determine the effect of profibrotic stimuli on macrophage response. Statistical design and analysis were conducted using Minitab 20 (Minitab Inc., State College, PA), where evaluation of the individual vs. synergistic terms was performed using two-way analysis of variance (ANOVA). All results are reported as mean ± standard error of the mean. For all studies, specific numbers of replicates are noted in the individual experimental sections where n ≥ 3 was used in all cases. At least 3 replicates (seeded gels in individual wells) were included per experiment, and each experiment was repeated at least twice, where each data point represents the average for/within a sample replicate for these studies. GraphPad Prism 9 (GraphPad Software Inc.) was used to perform additional statistical analyses: specifically, statistical comparisons for cell area and data from flow cytometry, ELISA, phagocytosis, and efferocytosis experiments were performed using one-way ANOVA with post-hoc Tukey's Honest Significant Difference (HSD).Results
Synthesis and characterization of bioinspired hydrogel matrix for macrophage culture
We utilized step-growth thiol-norbornene click chemistry to fabricate hydrogels with tunable mechanical properties inspired by the stiffness of healthy (E ∼ 1.5–3 kPa) and fibrotic (E ∼ 20–25 kPa) lung tissue.32 Specifically, to prepare the hydrogels, norbornene-functionalized 4-arm PEG (PEG-4-Nb, Mn.10000 g mol−1) was reacted with a dithiol linker peptide (GCGKVPMSMRGGKGCG) and a monothiol pendant peptide (2 mM), where different monomer concentrations were used to prepare hydrogels of relevant elastic modulus while maintaining stoichiometry of 1:1 Nb:SH. The thiol-norbornene reaction was photoinitiated with lithium phenyl-2,4,6-trimethylbenzoylphosphinate (LAP) and cytocompatible doses of long wavelength UV light (10 mW cm−2 at 365 nm for 5 min) (Fig. 2A). The monothiol integrin binding pendant peptide CGGPHSRNG10RGDSP was used, inspired by fibronectin rich pulmonary ECM, to promote cell attachment on the hydrogel matrix.50
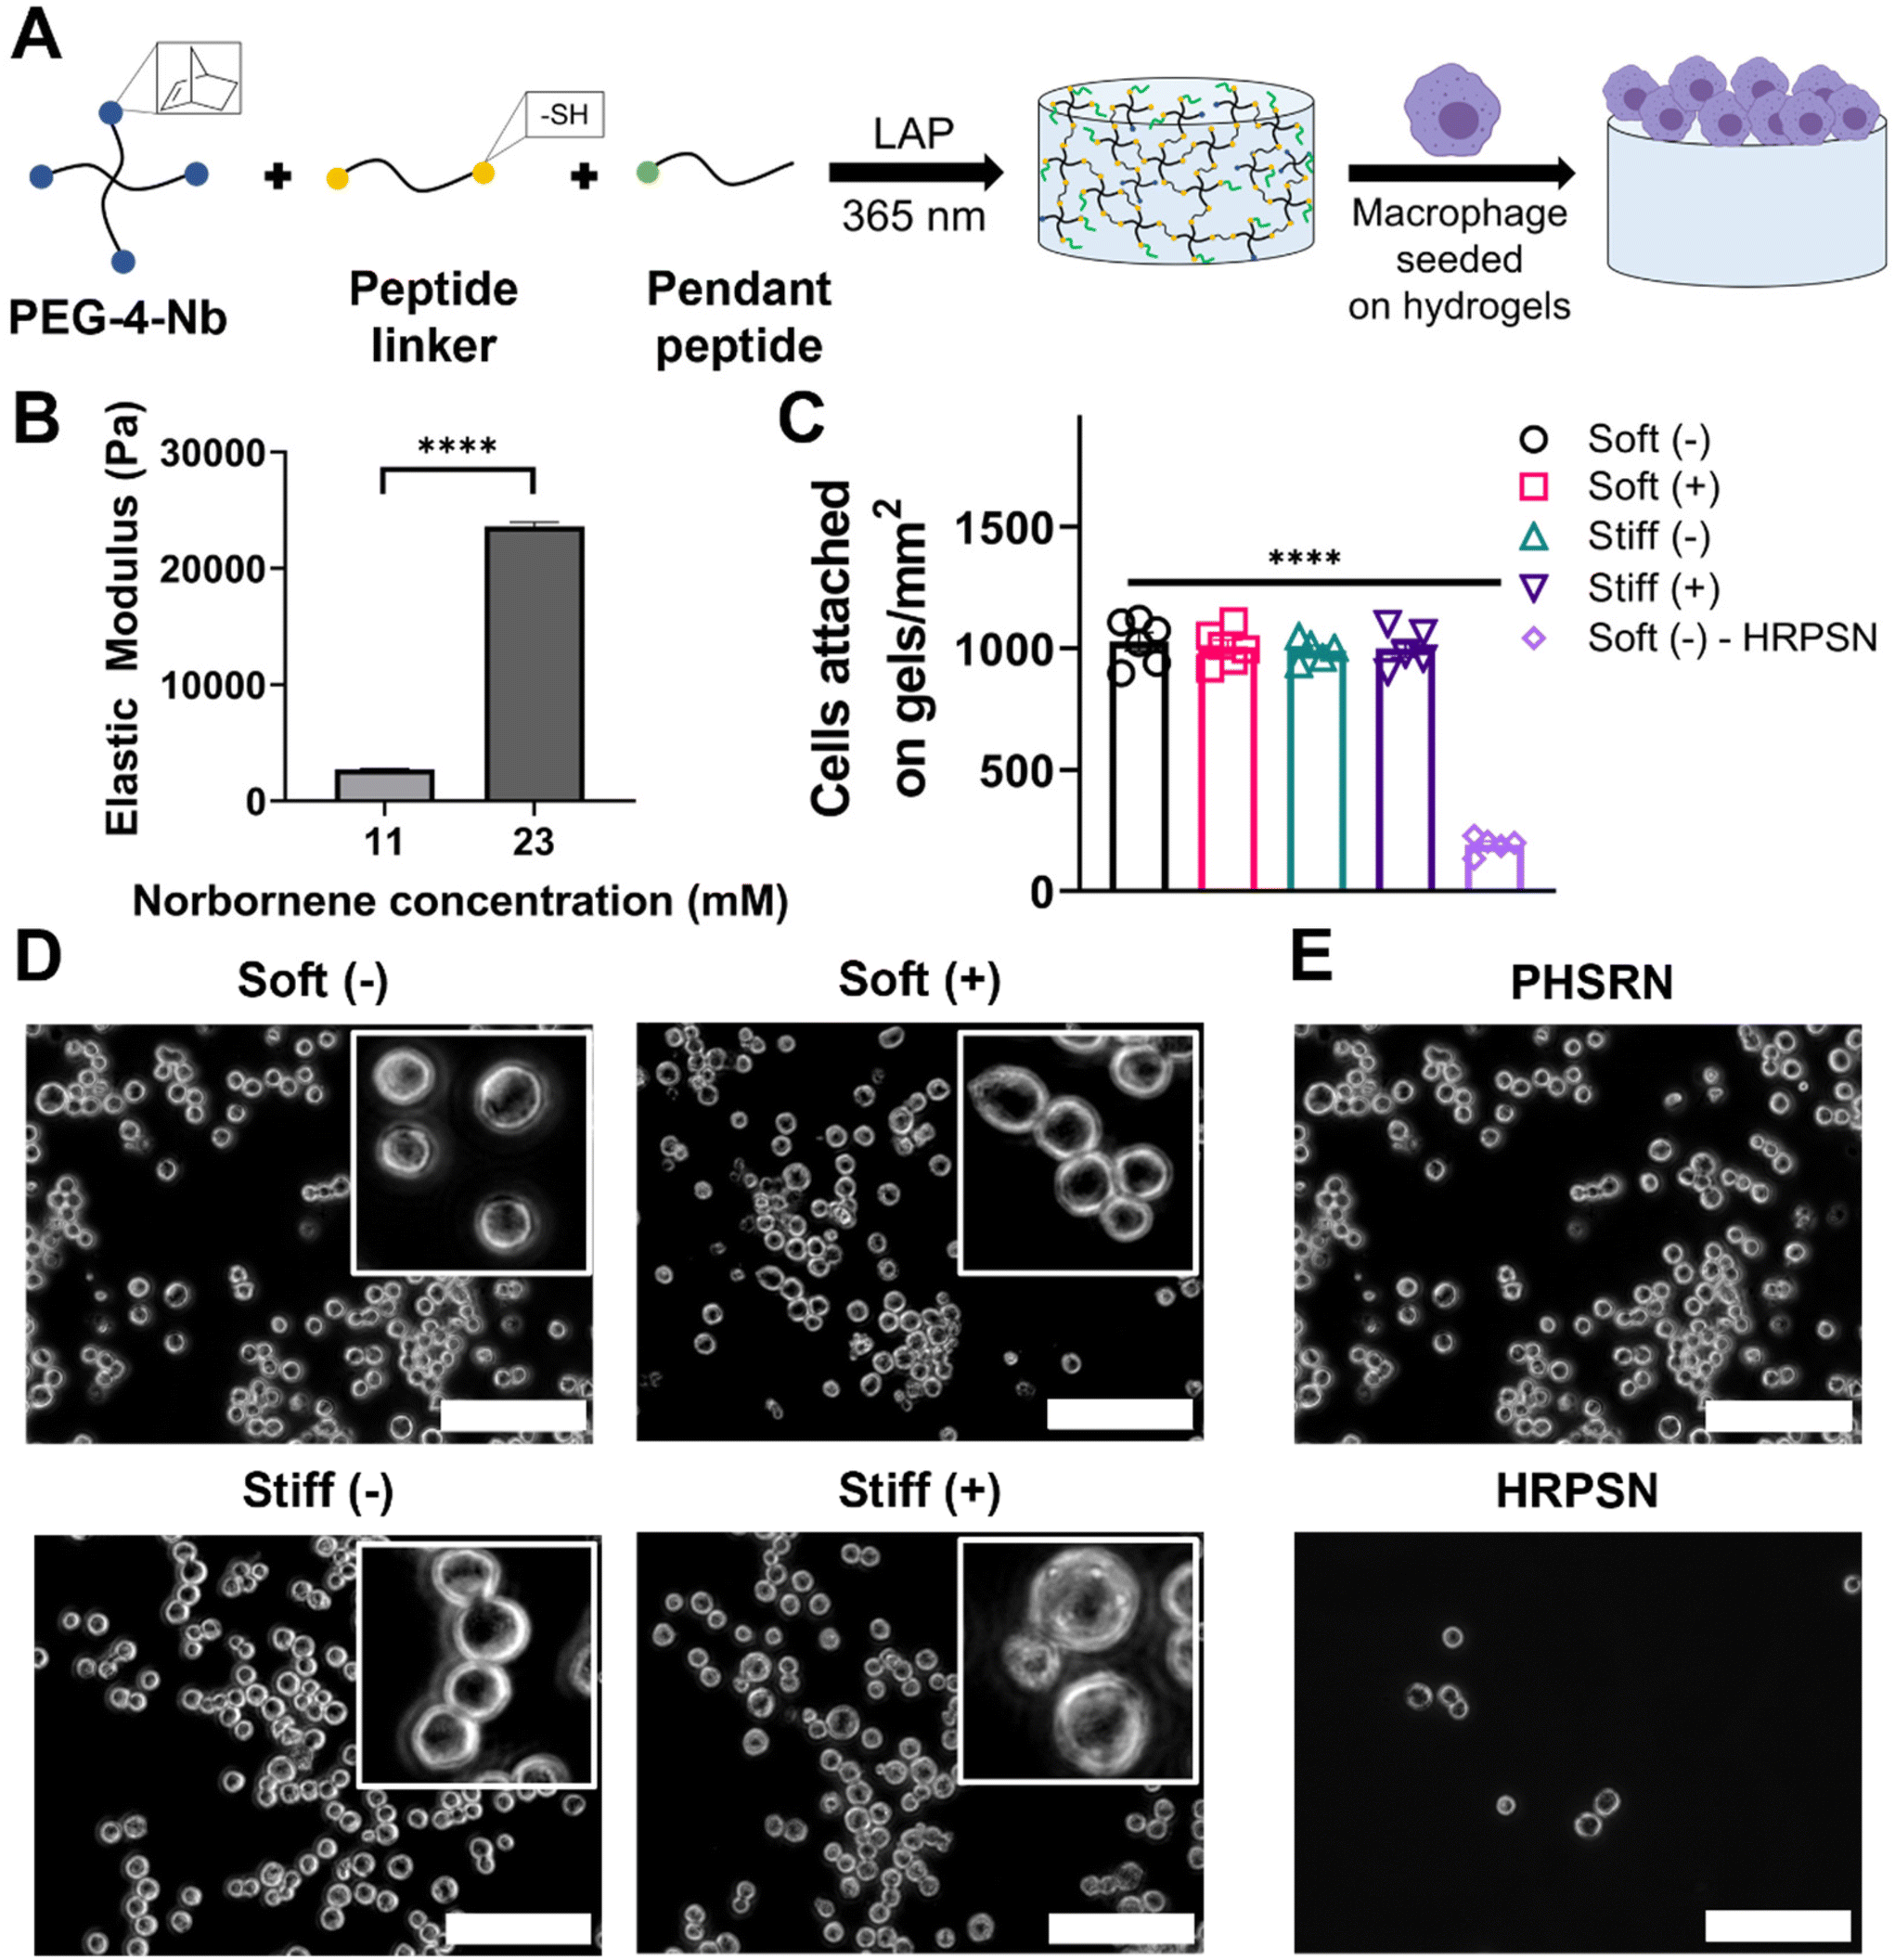 | ||
| Fig. 2 Establishment of lung-inspired hydrogel culture system. (A) Hydrogels were formed using thiol-norbornene click chemistry by reacting PEG-4-Nb with a dithiol functionalized linker peptide to control stiffness and a monothiol functionalized pendant peptide to aid in cell attachment. The reaction was triggered by light (365 nm at 10 mW cm−2 for 5 min) in the presence of photoinitiator (LAP). (B) Hydrogels with different stiffness were prepared by varying monomer concentration and the surface moduli of the hydrogels were measured using a microindentation technique (n = 3). (C) MH-S cell attachment was quantified under different culture conditions and was found to be independent of stiffness and IL13 and was facilitated by the presentation of integrin binding pendant peptide ( n ≥ 5). (D) Representative images showing attachment of MH-S cells on Soft and Stiff hydrogels with and without IL13. Inset images show an increase in the cell area in the presence of IL13 and increased stiffness at equivalent magnification. (E) Representative images showing scrambled pendant peptide (HRPSN) resulted in limited cell attachment. (****) signifies p < 0.0001 Statistical significance for modulus measurement was determined using Student's t-test and statistical significance for cell attachment was determined using one-way ANOVA. Scale bar = 100 μm. “n” refers to the number of replicates (seeded gels in individual wells) used in each study. | ||
The contact moduli of these synthetic bioinspired hydrogels were examined using microindentation. The contact modulus is measured using microindentation to assay the modulus of the surface on which the cells were cultured. As expected, an increased concentration of PEG-4-Nb resulted in hydrogels with an increased elastic modulus (Fig. 2B). An elastic modulus of E ∼ 2.7 ± 0.3 kPa was achieved in the 11 mM Nb functional group condition, a similar stiffness to that of the healthy lung tissue.32 Similarly, an elastic modulus of E ∼ 23.6 ± 1.5 kPa was achieved in the 23 mM Nb functional group condition, a similar stiffness to that of fibrotic lung tissue.32In situ rheometry was also performed and elastic moduli similar to the contact moduli for 11 mM (E ∼ 2.4 ± 0.4 kPa) and 23 mM (E ∼ 22.1 ± 1.9 kPa) Nb functional group conditions were observed (Fig. S9†). For the studies in this work, we defined the 11 mM and 23 mM Nb functional group conditions as ‘Soft’ and ‘Stiff’ hydrogel conditions, respectively.
Quantification of cell density on hydrogels
We first sought to quantify the effect of hydrogel stiffness and a profibrotic soluble cue (IL13) on cell seeding to ensure that uniform cell density was observed on all the conditions. MH-S cells were seeded on Soft and Stiff hydrogels at 100000 cells cm−2, allowed to adhere for 24 hours, followed by media change to remove unattached cells, and incubated for another 24 hours, after which the media was replaced with fresh media with or without IL13. Cells were then incubated for 24 hours, allowing for a response to matrix and soluble cues, before determining the final cell number. Both increased stiffness and presence of IL13 resulted in non-significant differences in cell attachment on hydrogels (Fig. 2C and D), indicating a consistent number of cells across all conditions. Soft hydrogels without IL13 (Soft (–)) had a final density of 1030 ± 92 cells mm−2, and Soft hydrogels with IL13 (Soft (+)) had a final density of 1010 ± 69 cells mm−2. Similarly Stiff hydrogels without IL13 (Stiff (–)) and with IL13 (Stiff (+)) had a final seeding density of 990 ± 44 cells mm−2 and 999 ± 81 cells mm−2 respectively. Furthermore, we assessed the metabolic activity of MH-S cells seeded on hydrogels and cultured with or without IL13 over time using an alamarBlue assay. We observed increases in the metabolic activity of cells cultured on the hydrogels over time for all the conditions and non-significant differences between different conditions at each time point (Fig. S8†). We further confirmed that cell attachment on hydrogels was associated with the integrin binding peptide (PHSRN) by using a scrambled version of integrin binding peptide (HRPSN) and quantifying cell attachment (Fig. 2C). Significantly lower and limited cell attachment (p < 0.0001, Fig. 2E) was observed on hydrogels with scrambled sequence (HRPSN, 190 ± 69 cells mm−2), compared to the integrin binding peptide (PHSRN), supporting that presentation of the integrin binding peptide facilitates cell attachment on the hydrogels.
Assessment of cell spread in response to stiffness and soluble cues
After establishing the relevant culture conditions, we next sought to investigate the effect of both stiffness and IL13 on macrophage morphology and cell area. For the four culture conditions investigated, a rounded morphology of the MH-S cells was observed, which is common to alveolar macrophages cultured on substrates within a physiological relevant stiffness range.51 Both increases to stiffness and addition of IL13 resulted in increased cell spreading and area (Fig. 3A). Cell area for the Soft (–) condition was 153.57 ± 4.92 μm2 which increased to 166.99 ± 9.84 μm2 (Soft (+)) and 189.75 ± 5.56 μm2 (Stiff (–), p < 0.001) with both increased stiffness and addition of IL13 individually. Interestingly, the combination of both stiffness and IL13 (Stiff (+)) resulted in the highest cell area of 214.94 ± 5.55 μm2 (p < 0.0001) when compared to stiffness and IL13 individually. This trend of increased cell area with stiffness and IL13 was visualized using a contour plot, where the curvature of contours indicated the potential of some combinatorial effect of both profibrotic stimuli in increasing the cell area (Fig. 3B). To examine if this combinatorial effect was synergistic in nature, we utilized a 2-factorial DOE approach and performed two-way ANOVA analysis to determine the statistical significance for both individual and synergistic terms. The DOE analysis showed that, while both stiffness (p < 0.0001) and IL13 (p = 0.001) individually were significant in increasing the cell spread, a synergistic effect of both the factors (p = 0.26) was absent in increasing the cell area (Fig. 3C and Table S3†). This statistical analysis therefore suggests that the two profibrotic biochemical and biomechanical cues can both work in parallel to increase cell spread, and may even work additively to increase the area, but are not collaborating together to produce a combinatorial, enhanced effect. This result further indicates the importance of performing the DOE analysis rather than relying on intuition to unravel these complex interactions.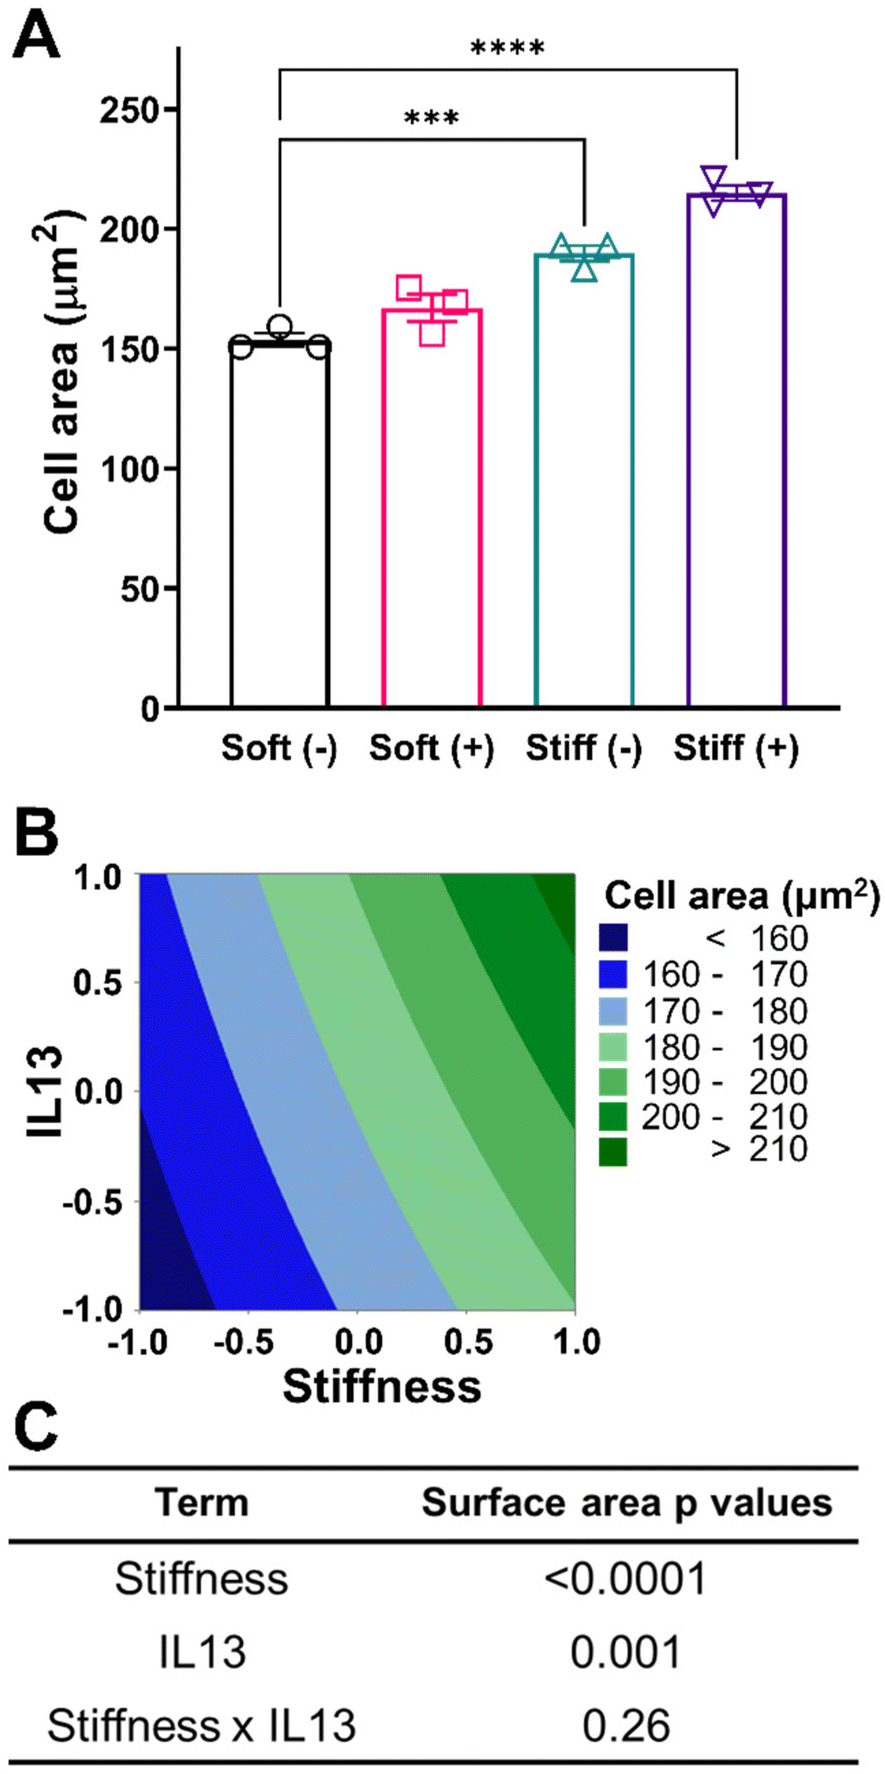 | ||
| Fig. 3 Effect of fibrotic cues on cell morphology and associated DOE analysis. A 2-factorial statistical approach was applied to study the effect of stiffness and IL13 on cell area. (A) Quantification of cell area under different culture conditions showed both stiffness and IL13 increased cell area (n = 3). (***) signifies p < 0.001, (****) signifies p < 0.0001. Statistical significance was determined using one-way ANOVA (B) Contour plot to visualize the trend for increased cell area with stiffness and IL13. (C) A two-way ANOVA to determine which factors had significant effect (p < 0.05) on increasing cell area showed both stiffness and IL13 were significant independently. “n” refers to the number of replicates used in each study. | ||
Characterization of macrophage phenotype in response to profibrotic stimuli
Next, we investigated the effect of both profibrotic stimuli on the polarization of MH-S cells. MH-S cells were cultured on Soft and Stiff hydrogels and polarized with or without IL13 (20 ng mL−1) for 24 hours, after which the polarization profile of cells was determined by quantifying relative changes in the pro-inflammatory (M1) and anti-inflammatory (M2) marker expressions. Relative expression of intracellular CD206, which is an anti-inflammatory (M2) marker, was first qualitatively determined using immunostaining. Compared to Soft (–), both Soft (+) and Stiff (–) showed an increase in CD206 expression (green fluorescence), which was further increased in the Stiff (+) condition, suggesting both stiffness and IL13 promoted an increased M2 phenotype of macrophages (Fig. 4A). This observation was further confirmed by flow cytometric analysis of cells and quantifying relative changes in normalized expression (MFI) for M2 (CD206) and M1 (CD86, CD80) markers (Fig. 4B). For CD206, Soft (–) had a normalized MFI of 1.00 ± 0.05, which increased significantly for both Soft (+) (2.21 ± 0.24, p < 0.0001) and Stiff (–) (1.41 ± 0.14, p < 0.05). Like immunostaining data, a further increase in CD206 normalized expression (2.43 ± 0.25) was observed in Stiff (+) condition. The M2 anti-inflammatory phenotype of MH-S cells was further confirmed by decreased expression of M1 polarization markers: CD86 and CD80 (Fig. 4B). For CD86, Soft (–) had a normalized MFI of 1.00 ± 0.02, which decreased significantly for both Soft (+) (0.66 ± 0.03, p < 0.0001) and Stiff (–) (0.77 ± 0.02, p < 0.0001). For Stiff (+), a further decrease in CD86 normalized expression (0.61 ± 0.01, p < 0.0001) was observed. Similarly, for CD80, Soft (–) had a normalized MFI of 1.00 ± 0.04, which did not decrease significantly for Soft (+) condition (0.97 ± 0.07). However, the decrease in normalized CD80 expression was significant for both Stiff (–) (0.66 ± 0.02, p < 0.001) and Stiff (+) (0.79 ± 0.05, p < 0.01) conditions.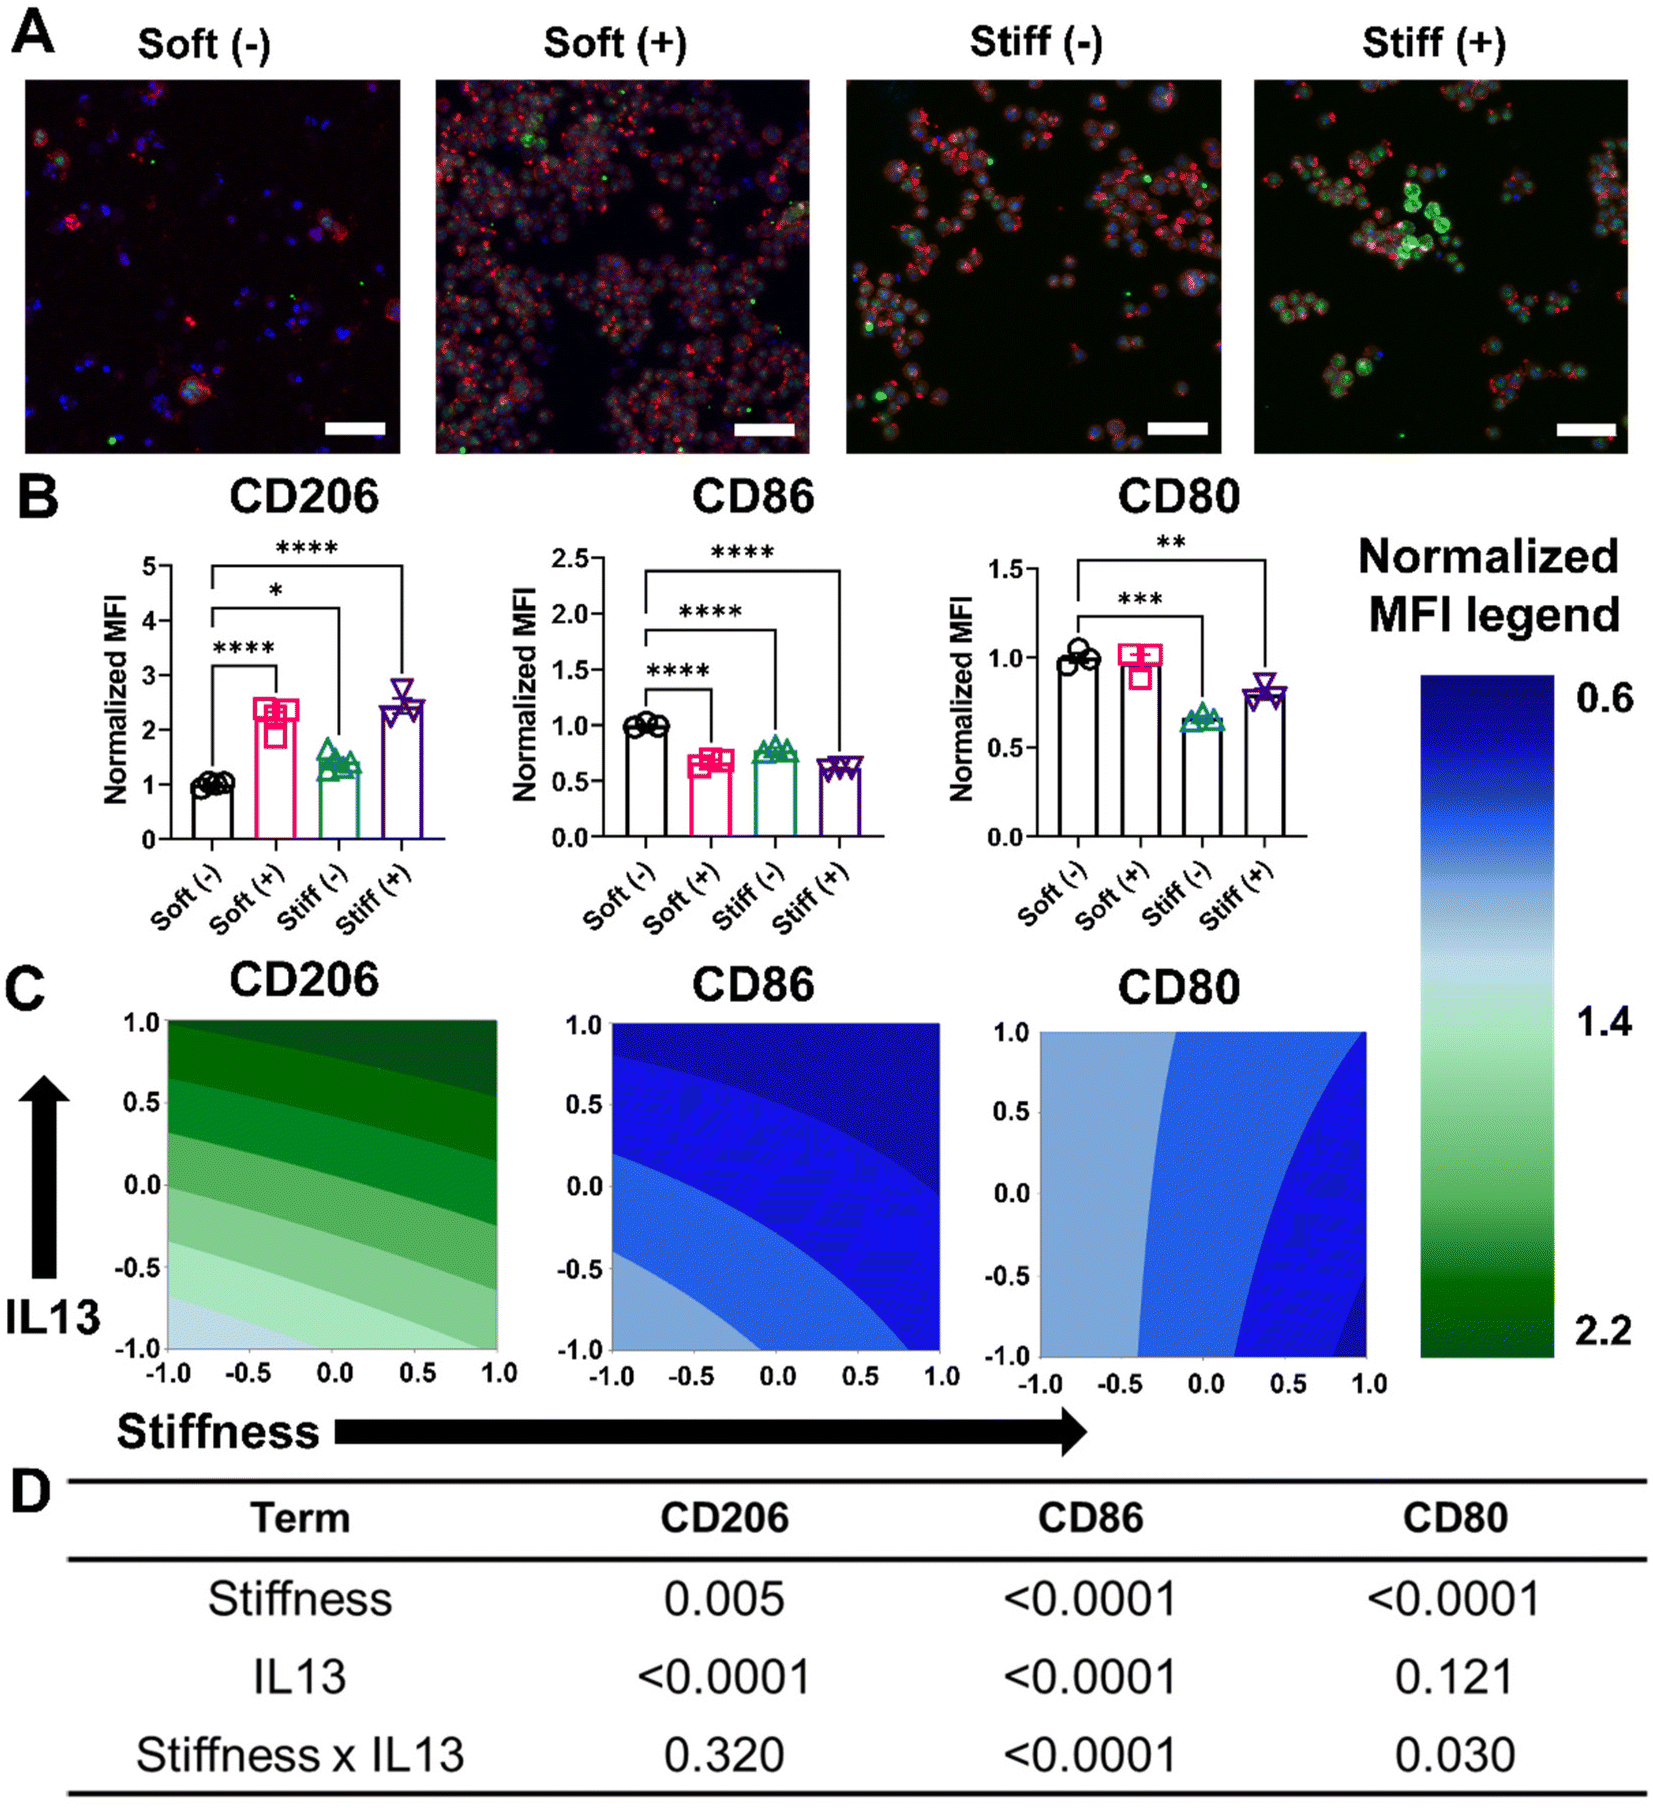 | ||
| Fig. 4 Effect of fibrotic cues on changes in phenotypical marker expression and associated DOE analysis. A 2-factorial statistical approach was applied to study the effect of stiffness and IL13 on macrophage phenotype by quantifying changes in markers assessed with flow cytometry. Mean fluorescence intensity (MFI) was normalized to Soft (–). CD206 was used as a M2 marker while CD86 and CD80 were used as M1 markers. (A) Representative image of MH-S cells with nuclei (blue), F-actin (red), and CD206 (green) qualitatively showed an increase in CD206 expression with increased stiffness and IL13. (B) Flow cytometry analysis of CD206, CD28, and CD80 marker expression showed upregulation of M2 markers and downregulation of M1 marker expression (n ≥ 3). (*) signifies p < 0.05, (**) signifies p < 0.01, (***) signifies p < 0.001, (****) signifies p < 0.0001. Statistical significance was determined using one-way ANOVA. (C) Contour plot to visualize the trend for different marker expression with stiffness and IL13 as assessed with flow cytometry. (D) A two-way ANOVA to determine which factors had a significant effect (p < 0.05) on increasing the expression of M2 phenotype markers: stiffness was significant independently for CD206, CD80 and CD80; IL13 was significant for CD206 and CD86; and both stiffness and IL13 were synergistically significant for CD86 and CD80. “n” refers to the number of replicates used in each study. | ||
This trend of increased CD206 expression and decreased CD86 and CD80 expression in the presence of Stiff hydrogels and IL13 first was visualized using contour plots (Fig. 4C), and then the DOE approach was used to investigate the individual and synergistic effects of stiffness and IL13 on macrophage marker expression (Fig. 4D and Tables S4–S6†). Two-way ANOVA results showed that for CD206, both stiffness (p = 0.005) and IL13 (p < 0.0001) were individually significant; further, while the Stiff (+) displayed the highest CD206 expression, there was no synergistic effect of both the factors (p = 0.320) in promoting CD206 expression under these conditions. For CD86, both stiffness (p < 0.0001) and IL13 (p < 0.0001) were again individually significant, but, interestingly, here the factors also displayed a synergistic effect (p < 0.0001) in downregulating CD86 expression. In contrast, for CD80, stiffness was significant (p < 0.0001) individually; IL13 was not (p = 0.121); and the combination of both stiffness and IL13 showed synergistic effects (p = 0.030) in decreasing CD80 expression. The DOE model for normalized CD80 and CD86 marker expression was also validated using cells cultured on an intermediate stiffness hydrogel (E ∼ 10–12 kPa) without the presence of IL13, and a close agreement between predicted and actual values for both CD80 (predicted: 0.80; actual: 0.84 ± 0.07) and CD86 (predicted: 0.89; actual: 0.88 ± 0.03) was observed (Table S15†). From these three phenotypic markers, our results provide evidence of several synergistic effects following both profibrotic stimuli that contribute to a M2 anti-inflammatory phenotype of alveolar macrophages.
We performed further phenotypical analysis of MH-S cells by quantifying the soluble factors (TGF- β, CCL2, TNF-α, and IL-1β) secreted by cells in the different culture conditions using an ELISA assay (Fig. 5A and Table S2†). Cells in the Soft (–) condition had a normalized expression of TGF-β (1.00 ± 0.12), which increased significantly for Soft (+) (1.48 ± 0.11, p < 0.001). Non-significant changes were observed in normalized TGF-β expression for Stiff (–) (0.97 ± 0.11), whereas Stiff (+) had significantly higher normalized TGF-β expression (1.35 ± 0.13, p < 0.01). Similarly, for CCL2, Soft (–) had a normalized CCL2 expression of 1.0 ± 0.03, which significantly increased for Soft (+) (1.28 ± 0.01, p < 0.01). However, both Stiff (–) (1.01 ± 0.12) and Stiff (+) (1.15 ± 0.07) had a non-significant increase in normalized CCL2 expression. For both M1 associated cytokines (TNF-α, and IL-1β), a non-significant decrease in the normalized cytokine expression was observed. Soft (–) had a normalized TNF-α expression of 1.00 ± 0.15, which was reduced for Soft (+) (0.84 ± 0.14), Stiff (–) (0.86 ± 0.22), and Stiff (+) (0.65 ± 0.14) conditions. Similarly, for IL-1β, Soft (–) had a normalized expression of 1.00 ± 0.42, which was reduced for Soft (+) (0.86 ± 0.18), Stiff (–) (0.77 ± 0.38), and Stiff (+) (0.45 ± 0.28) conditions. Contour plots for normalized cytokine expression showed some curvature for all the cytokines (Fig. 5B). However, the DOE analysis showed only IL13 had a statistically significant impact (p < 0.0001) in increasing the normalized expression of TGF-β and CCL2, while no other terms (stiffness individually and stiffness and IL13 synergistically) were significant in driving the secretion of various soluble factors (Fig. 5C and Tables S7–S10†).
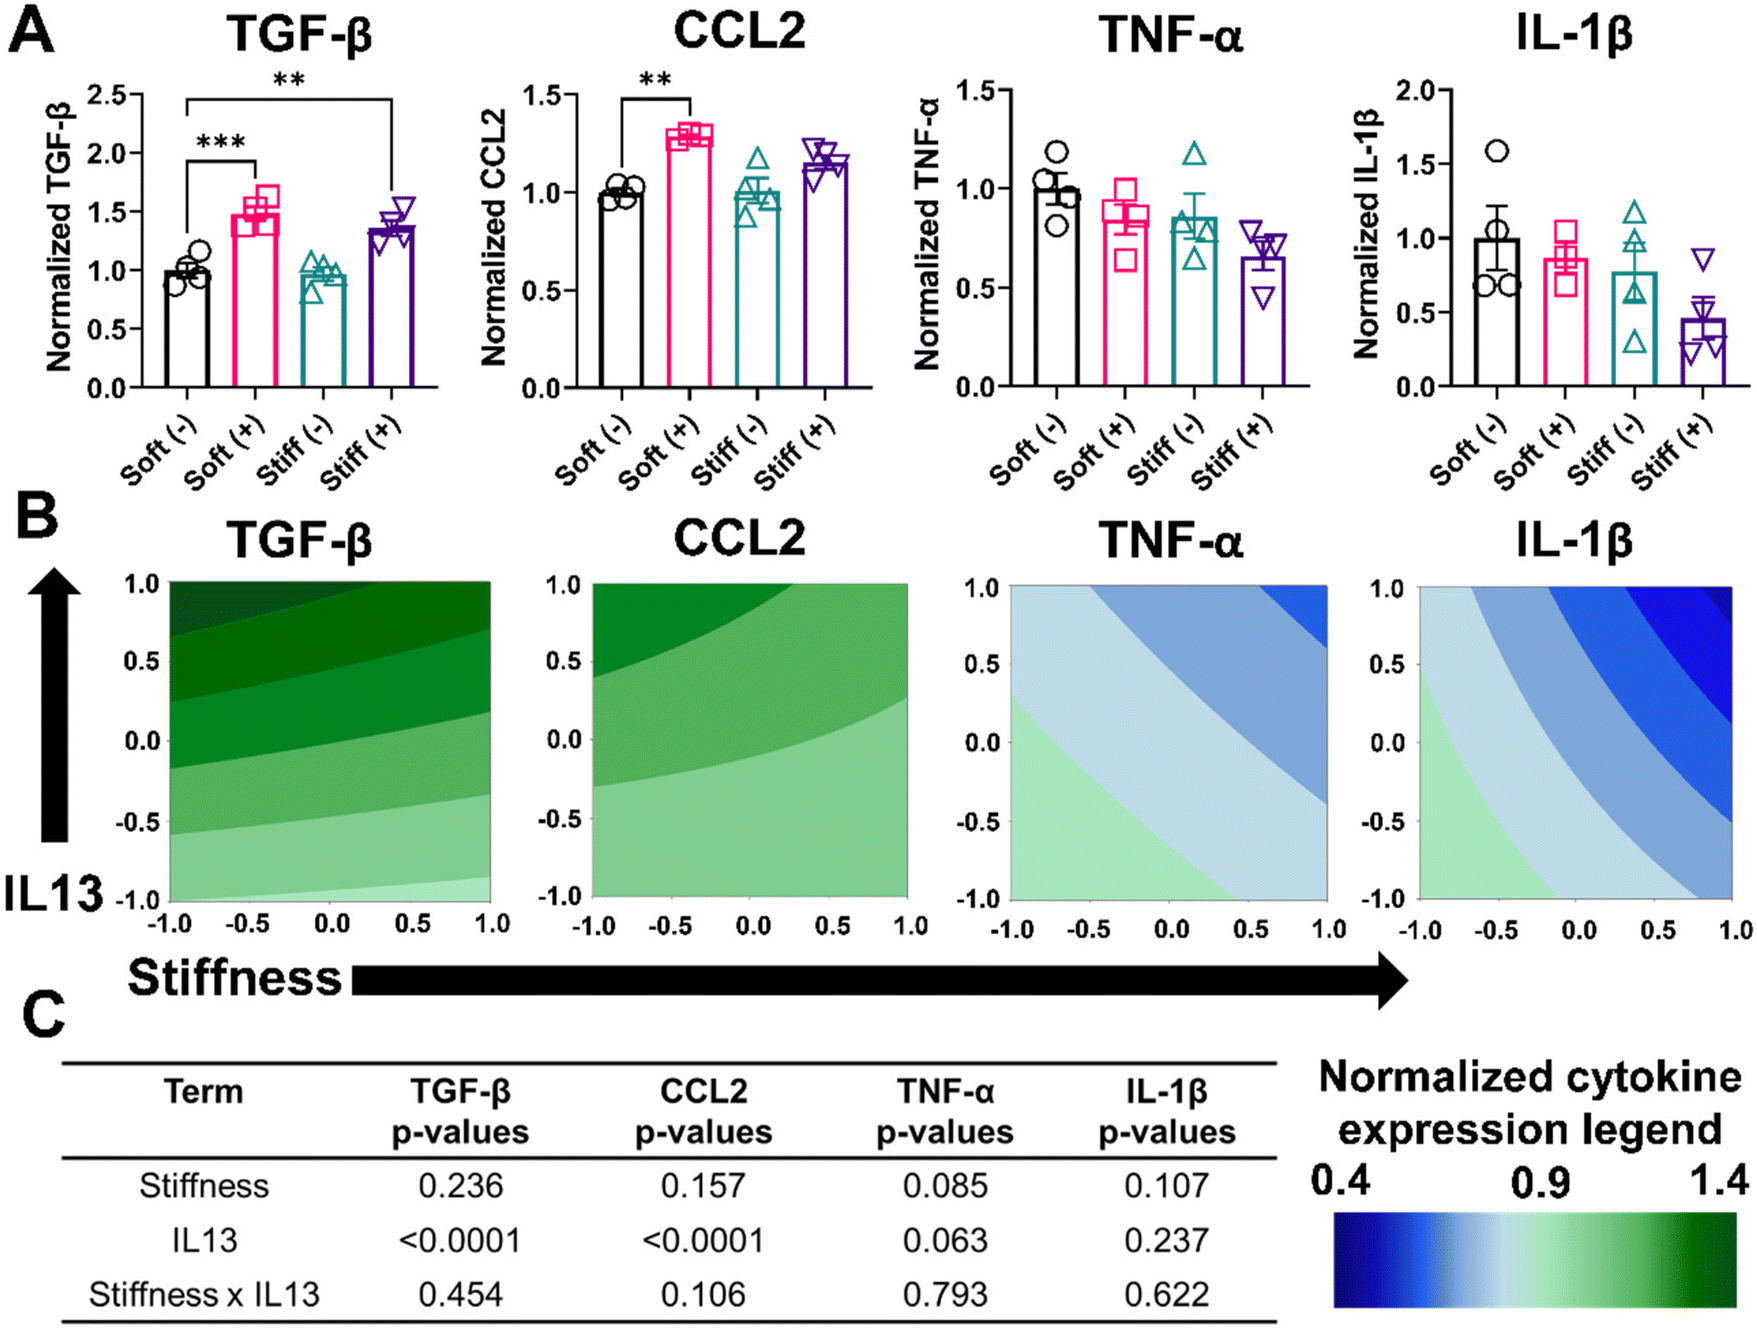 | ||
| Fig. 5 Effect of fibrotic cues on secretion of soluble factors and associated DOE analysis. A 2-factorial statistical approach was applied to study the effect of stiffness and IL13 on macrophage phenotype by quantifying changes in soluble factors secreted by macrophages using an ELISA assay. Each cytokine secretion was normalized to the Soft (–) condition. TGF-β and CCL2 are M2 phenotype associated cytokines, while TNF-α and IL-1β are M1 phenotype associated cytokines. (A) Normalized soluble factor secretion for TGF-β and CCL2 showed IL13 dependent upregulation. Non-significant downregulation was observed for both TNF-α and IL-1β (n ≥ 3). (**) signifies p < 0.01, (***) signifies p < 0.001. Statistical significance was determined using one-way ANOVA. (B) Contour plot to visualize the trend for different cytokines with stiffness and IL13. (C) A two-way ANOVA to determine which factors had significant effects (p < 0.05) on upregulating an M2 phenotype showed IL13 was significant for TGF-β and CCL2. “n” refers to the number of replicates used in each study. | ||
We hypothesized that the limited effect of stiffness observed on the secretion of various cytokines, as measured by ELISA, could be due to differences in the time scale of secretion of different cytokines and their relative stability or consumption. Therefore, we decided to look at the effect of stiffness on the expression of certain macrophage markers at the gene level using RT-qPCR. We quantified the normalized gene expression CD206 and IL-1β relative to the housekeeping gene GAPDH (Fig. S7†). Consistent with observations from the flow cytometry analysis, cells in the Stiff (–) condition showed a significant increase (p < 0.05) in CD206 gene expression relative to Soft (–). Interestingly, for IL-1β, Stiff (–) showed a significant decrease (p < 0.05) in IL-1β gene expression relative to Soft (–), which was absent on the protein-level. Overall, our analysis of phenotypical profiles of macrophages on cell surface level, secreted protein level, and gene-level indicate that both stiffness and IL13 are important individually and synergistically in driving MH-S macrophages to a M2 phenotype.
Reduced phagocytosis and efferocytosis observed in response to profibrotic stimuli
Lastly, we looked at two internalization functions of macrophages, phagocytosis and efferocytosis, processes that are critically important in clearing foreign pathogens and apoptotic debris, respectively.52 Phagocytosis is the major process for the uptake and removal of microbial matter and foreign debris during which the foreign agents are taken up into the phagosome.53 Efferocytosis is a special form of phagocytosis during which apoptotic cell debris is recognized by the exposed phosphatidylserine on the surface of apoptotic cells and removed by macrophages before these cells release toxic substances into the local microenvironment.52 The outcome of these processes varies significantly based on the engaged surface receptors during the recognition step; phagocytosis of foreign material can lead to a range of inflammatory signals within the macrophage, while efferocytosis often imparts an anti-inflammatory signaling cascade. Changes in the internalization capabilities of macrophages can hinder effective macrophage function in ways that might further exacerbate disease progression. We first investigated the effect of stiffness and IL13 on the phagocytosis function of macrophages by using fluorescent lipid microparticles coated with phosphatidylcholine (PC) as phagocytic mimics and allowed MH-S cells to internalize the particles for 6 hours. Qualitatively, compared to Soft (–), all other conditions (Soft (+), Stiff (–) and Stiff (+)) showed a decrease in the uptake of PC microparticles (Fig. 6A). This observation was confirmed by flow cytometry analysis quantifying the percentage of cells (%) that internalized the particles, as shown by the different counts in the fluorescence intensity from Soft (–) (highest) to Stiff (+) (lowest), supporting reduced particle uptake (Fig. 6B). Indeed, Soft (–) showed the highest %PC positive cells (48.49 ± 0.88%). The uptake was reduced for the Soft (+) condition (44.50 ± 2.48%). Furthermore, a significant decrease in %PC positive cells was observed for Stiff (–) (42.66 ± 2.18%, p < 0.01) and Stiff (+) (39.68 ± 2.34%, p < 0.001) (Fig. 6C). Similar observations were made in the normalized MFI expression, where Soft (–) had the highest normalized MFI (1.00 ± 0.06) followed by Soft (+) (0.88 ± 0.07), Stiff (–) (0.83 ± 0.03, p < 0.01), and Stiff (+) (0.71 ± 0.03, p < 0.001) (Fig. 6D). To determine if stiffness and IL13 reduced phagocytic capability of MH-S cells independently or synergistically, we used a DOE approach with both %PC positive cells and normalized MFI as outputs (Fig. 6E, Tables S11 and S12†). For both of these outputs, stiffness (p = 0.001 for %PC positive and p < 0.0001 for normalized MFI) and IL13 (p = 0.009 for %PC positive and p = 0.002 for normalized MFI) were significant independently; however, no synergistic effects between the two factors were observed (p = 0.652 for %PC positive and p = 0.952 for normalized MFI).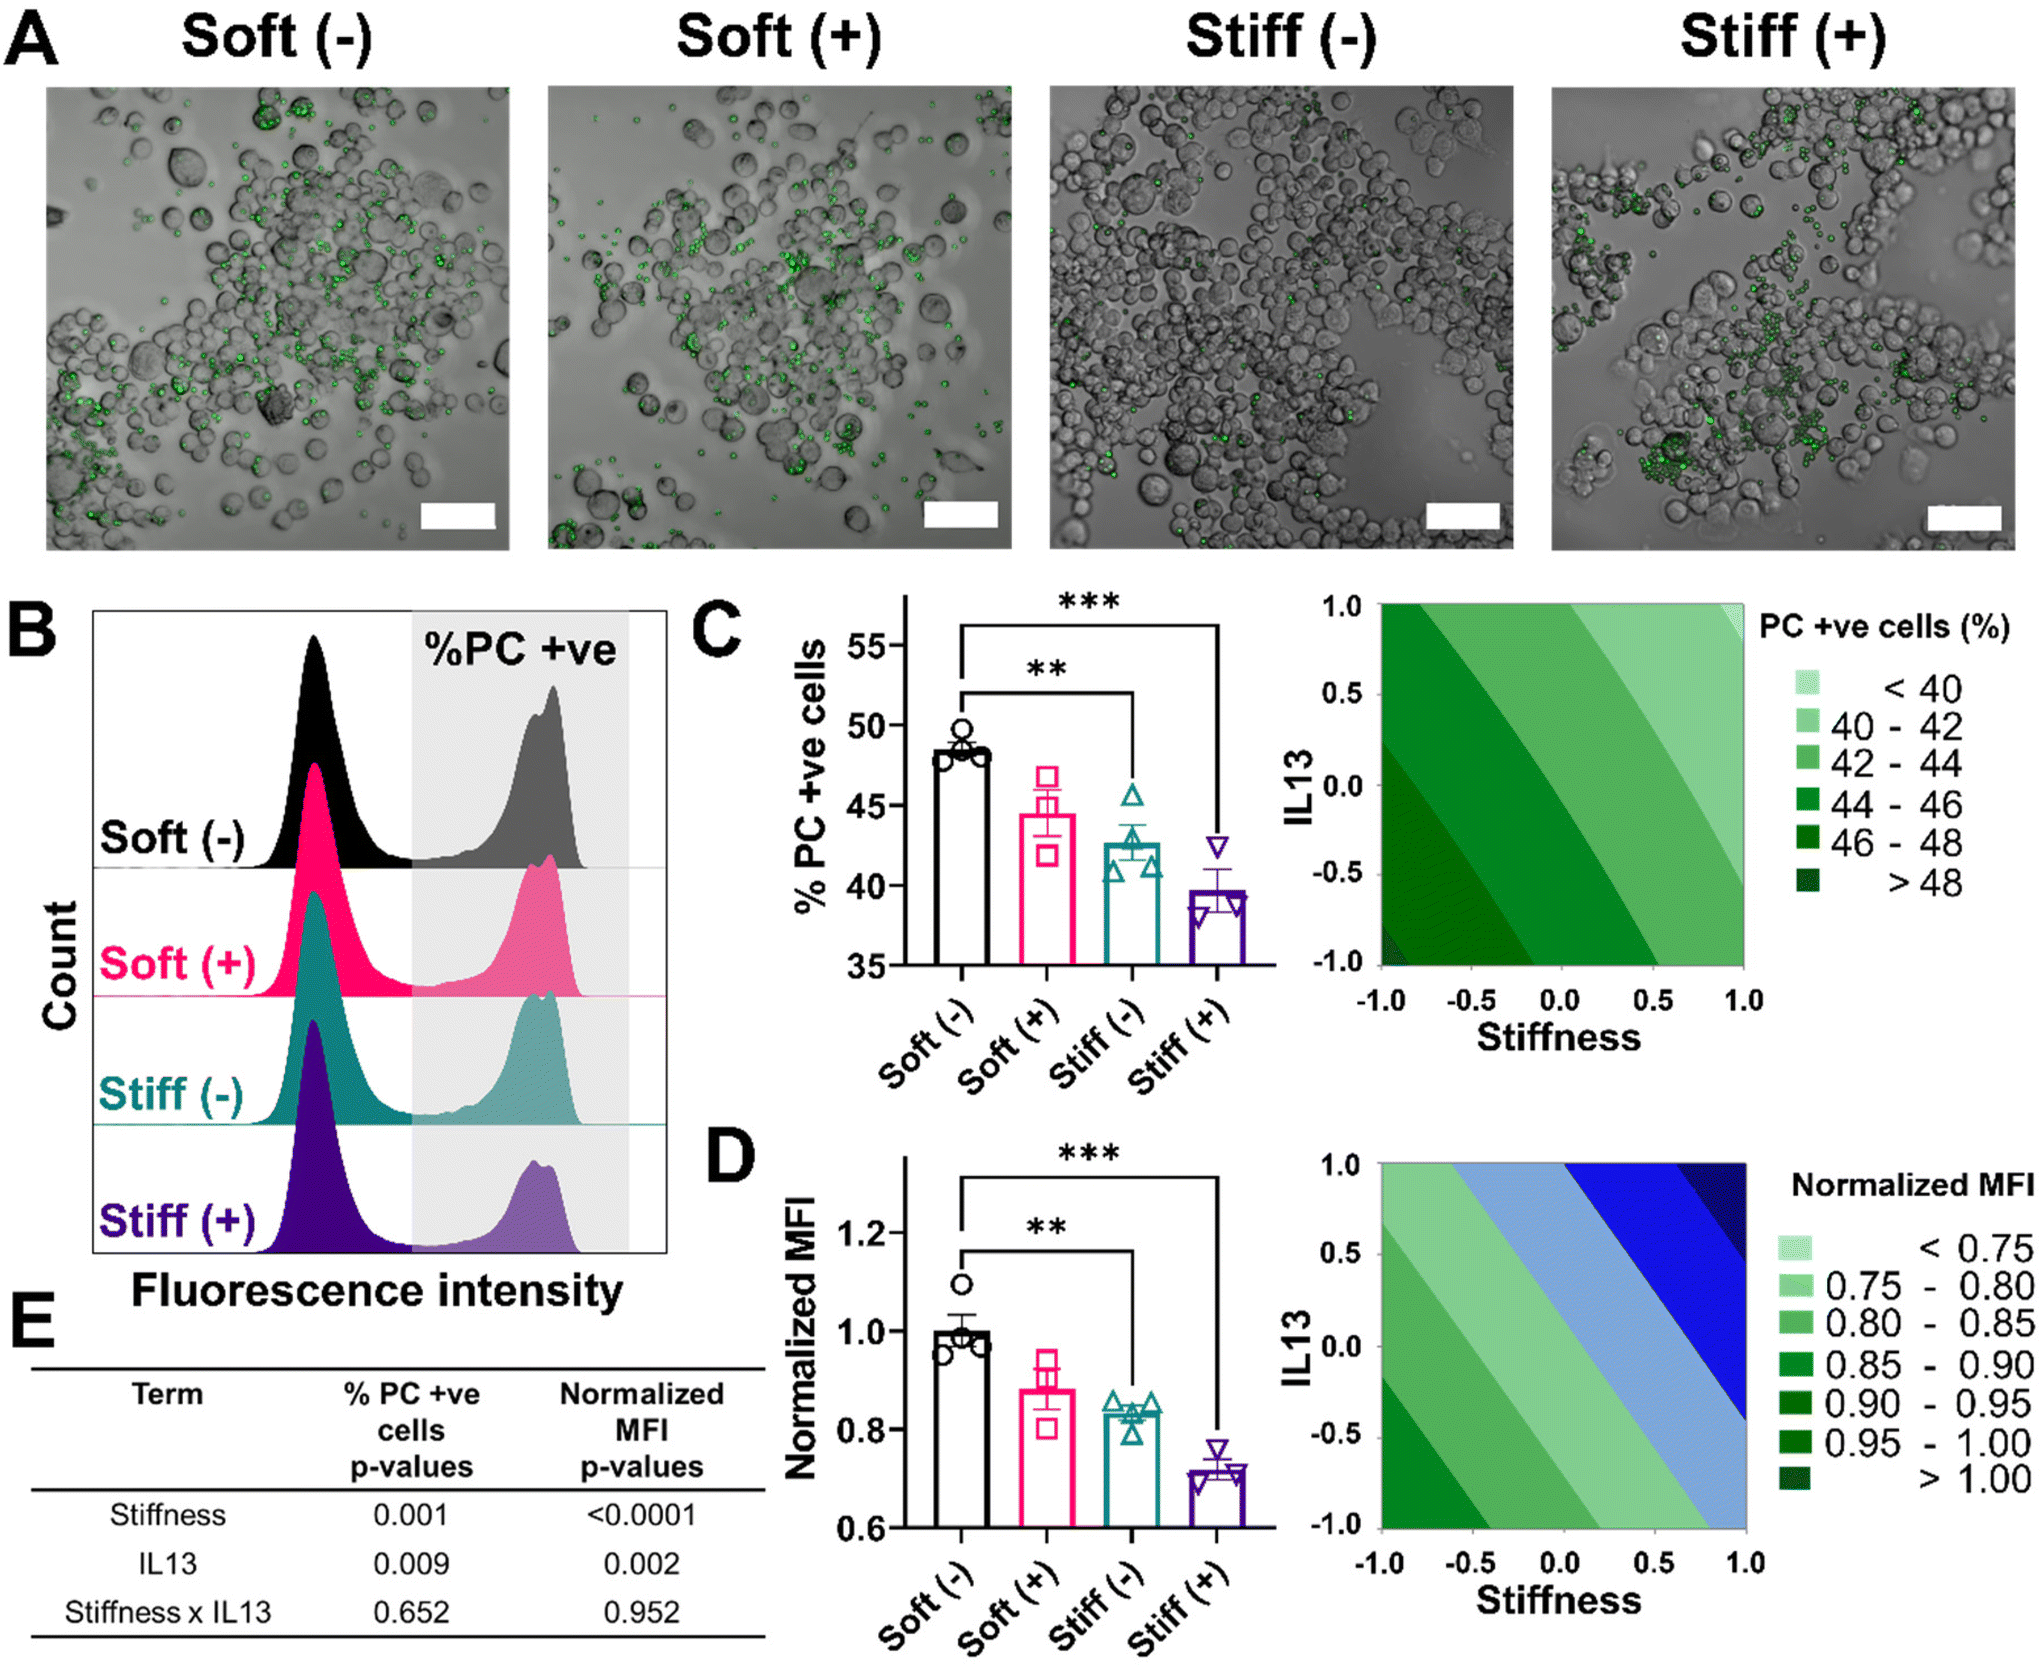 | ||
| Fig. 6 Effect of fibrotic cues on phagocytosis and associated DOE analysis. A 2-factorial statistical approach was applied to study the effect of stiffness and IL13 on phagocytosis of phosphatidylcholine (PC) coated fluorescent microparticles. PC coated beads were used as phagocytic mimics. (A) Representative image of MH-S cells with internalized PC microparticle (green) showed a decrease in the uptake of particles with increased stiffness and IL13. (B) Representative histograms of population of MH-S cells that internalized PC microparticles. Decreased fluorescence intensity of the second peak with higher stiffness and IL13 corresponds to a decreased uptake of particles by cells. (C) A decrease in the population of MH-S cells (%) that internalized PC microparticles was observed with increased stiffness and IL13. (D) A decrease in the normalized Mean fluorescence intensity (MFI) (normalized to Soft (–)) was observed with increased stiffness and IL13, indicating reduced uptake. (**) signifies p < 0.01, (***) signifies p < 0.001. Statistical significance was determined using one-way ANOVA. (E) A two-way ANOVA to determine which factors had significant effects (p < 0.05) showed both stiffness and IL13 were significant in reducing uptake (% PC positive cells and normalized MFI) independently; no synergistic effect was observed. Scale bar = 50 μm “n” refers to the number of replicates used in each study. | ||
We also investigated how stiffness and IL13 impacted efferocytosis by macrophages, which is clearance of apoptotic debris and critical in maintaining regulated wound healing paradigm.54 To mimic efferocytic targets, we utilized phosphatidylserine (PS) coated fluorescent lipid microparticles. These particles were chosen due to the increased presence of PS on the surface of apoptotic cells, which is recognized by macrophages and then followed by internalization.53,55 Similar to phagocytosis studies, PS coated microparticles were incubated with cells for 6 hours followed by qualitative and quantitative analysis. Qualitatively, we observed cells in the Soft (–) condition showing the highest uptake of PS microparticles followed by Soft (+), Stiff (–), and Stiff (+). Interestingly, visual observations showed each cell on average had a higher number of internalized PS particles compared to PC particles (Fig. 7A). This observation was confirmed by flow cytometry analysis of positive cells (%) that internalized the PS particles, where multiple distribution peaks indicated macrophages had a more heterogenous uptake profile of efferocytic mimics compared to phagocytic mimics (Fig. 7B). For our analysis, we were interested in uptake regardless of the population heterogeneity and therefore gated the population based on cells without any particles (using an untreated control). Quantitative analysis showed the highest %PS positive cells for Soft (-) (62.92 ± 3.07%) followed by Soft (+) (57.02 ± 1.42%), Stiff (–) (52.89 ± 2.96%, p < 0.01), and Stiff (+) (51.93 ± 2.08%, p < 0.01) (Fig. 7C). Normalized MFI was similarly highest for Soft (–) (1.00 ± 0.08) and reduced with the increased stiffness and IL13 to 0.80 ± 0.02 (Soft (+)), 0.68 ± 0.03 (Stiff (–)), and 0.65 ± 0.01 (Stiff (+)) (Fig. 7D). Again, DOE two-way ANOVA analysis on both %PS positive cells and normalized MFI was done to identify the individual and synergistic effects of stiffness and IL13 (Fig. 7E, Tables S13 and S14†). Statistical analysis showed that, while for %PS positive cells, stiffness (p = 0.001) and IL13 (p = 0.043) are significant independently without any synergy (p = 0.122), normalized MFI showed stiffness (p < 0.0001) and IL13 (p < 0.003) are significant both independently and synergistically (p = 0.012). These observations indicate synergistic effects at the single cell level, where the total amount of PS particles internalized (reflected in the MFI) was synergistically influenced by the mechanical and biochemical cues. Our results indicate impaired functional responses by MH-S in their phagocytic and efferocytosis capabilities in the presence of pro-fibrotic stimuli (both independently and synergistically), which may play a crucial role in further exacerbating the pro-fibrotic feedback loop.
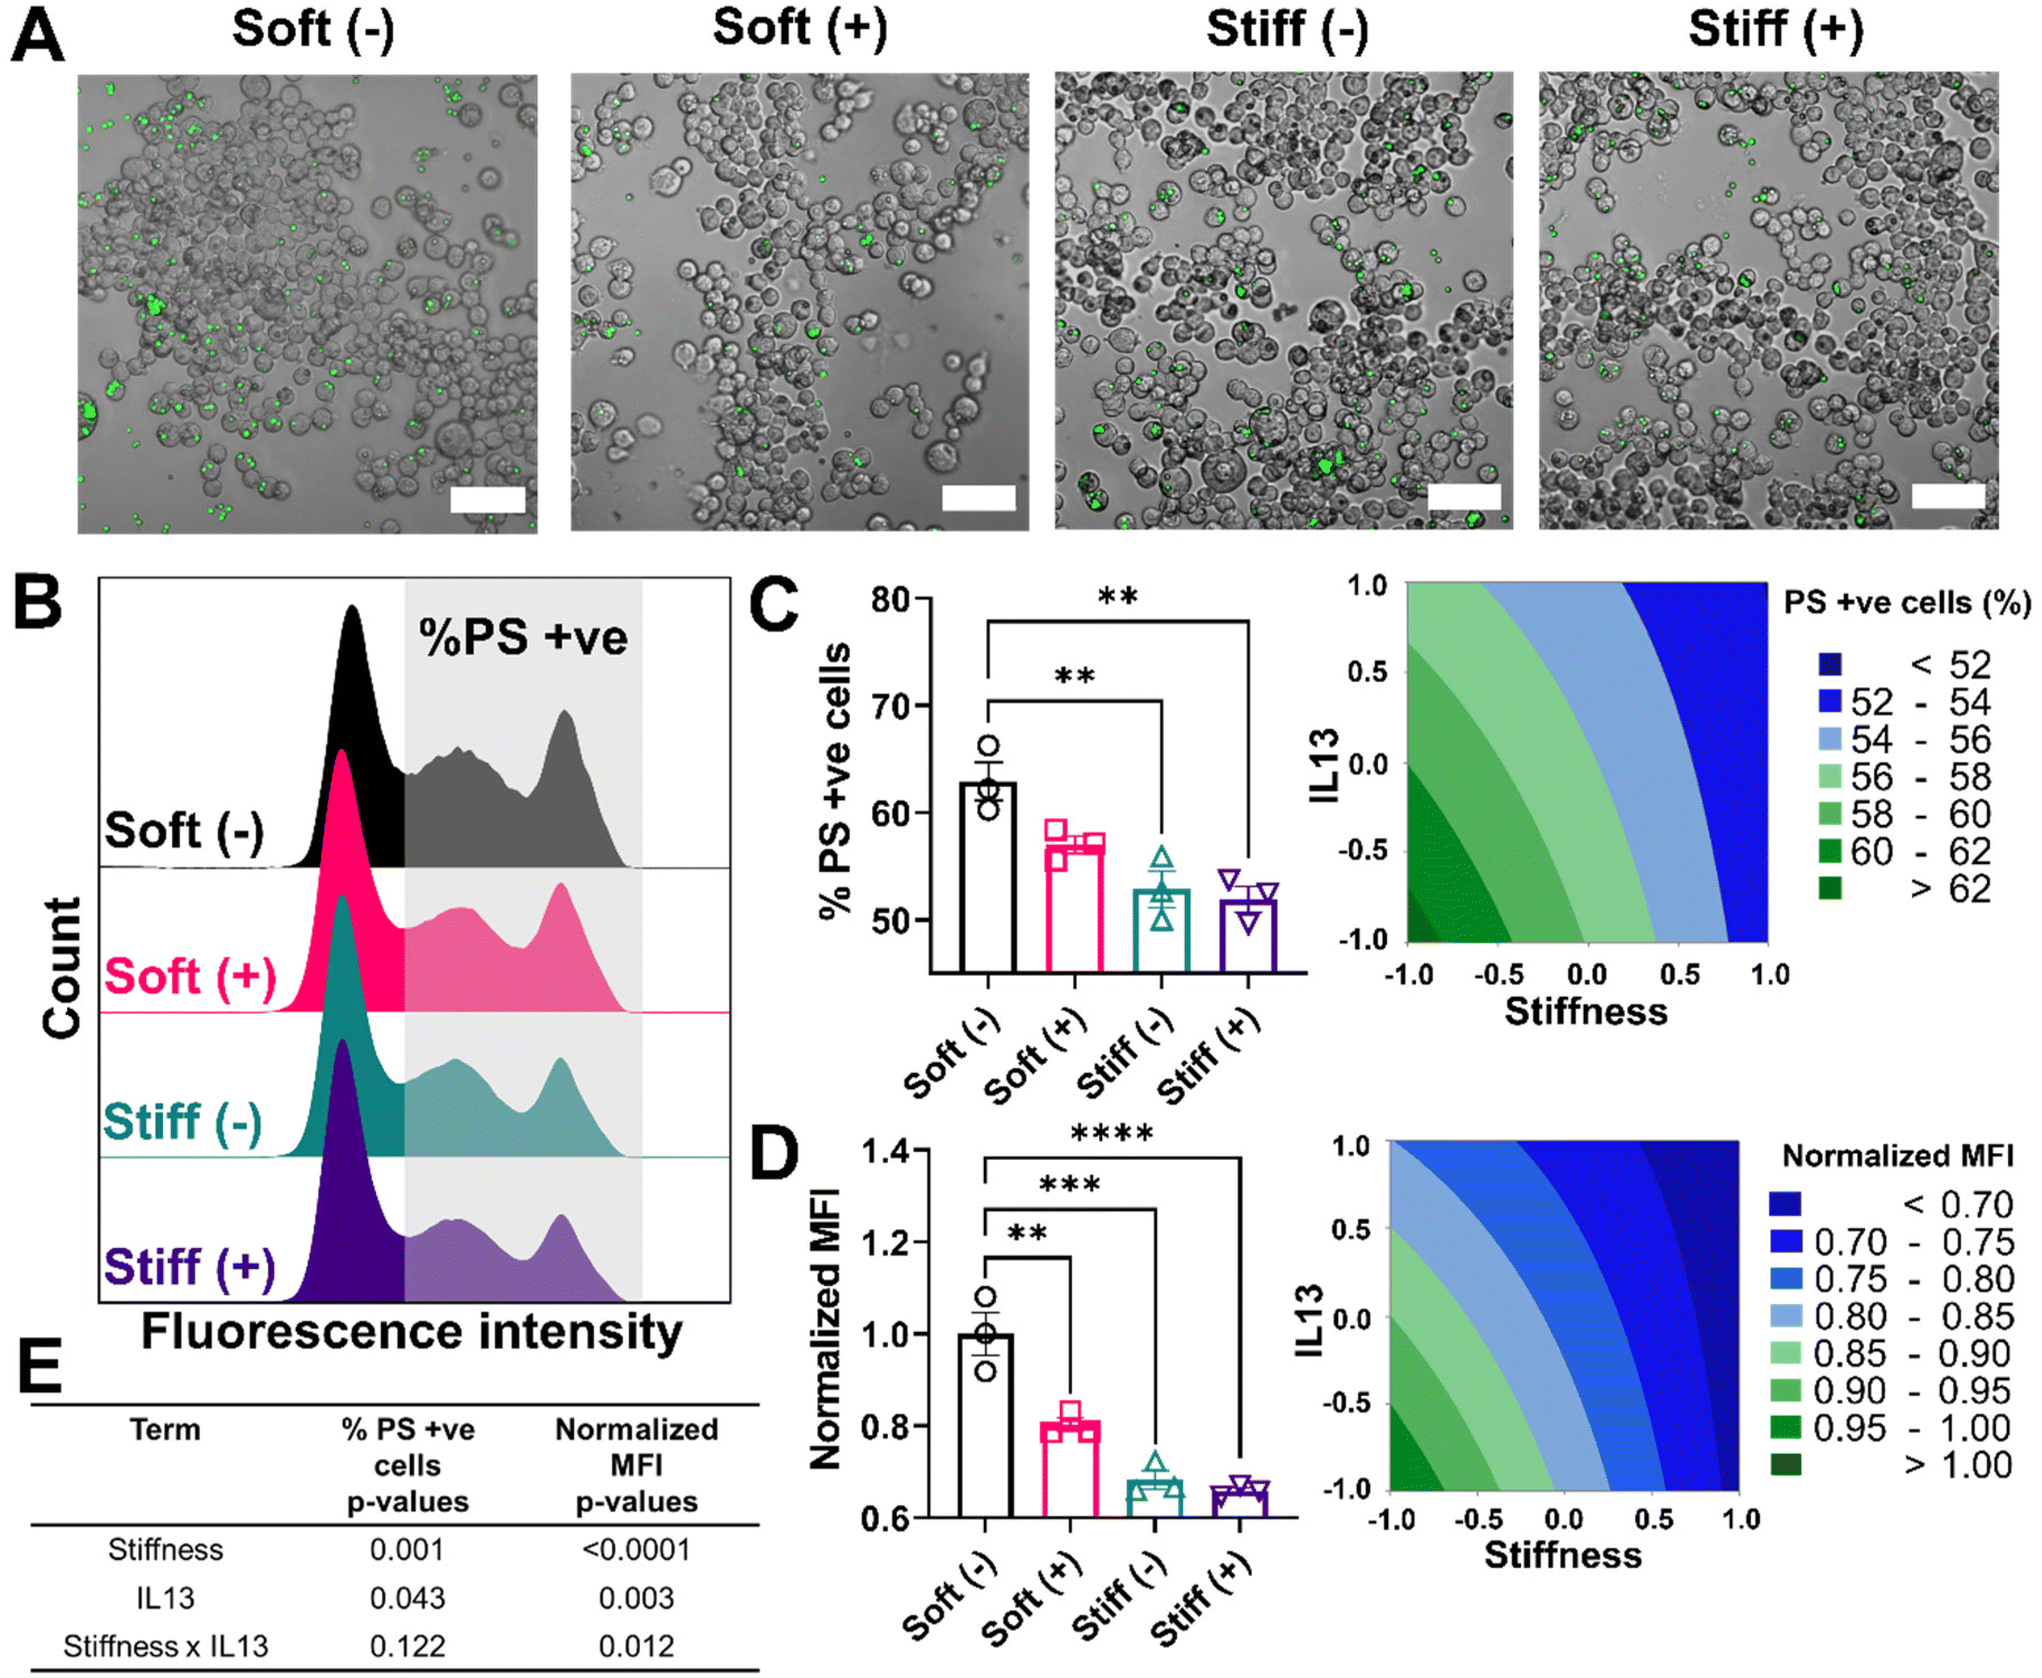 | ||
| Fig. 7 Effect of fibrotic cues on efferocytosis and associated DOE analysis. A 2-factorial statistical approach was applied to study the effect of stiffness and IL13 on efferocytosis of phosphatidylserine (PS) coated fluorescent microparticles. Here, PS coated beads were used as efferocytic mimics. (A) Representative image of MH-S cells with internalized PS microparticle (green) showed a decrease in the uptake of particles with increased stiffness and IL13. (B) Representative histograms of population of MH-S cells that internalized PS microparticles. A decrease in the fluorescence intensity of the second peak with higher stiffness and IL13 corresponds to a decreased uptake of particles by cells. (C) A decrease in the population of MH-S cells (%) that internalized PS microparticles was observed with increased stiffness and IL13. (D) A decrease in the normalized mean fluorescence intensity (MFI) (normalized to Soft (–)) was observed with increased stiffness and IL13, indicating reduced uptake. (**) signifies p < 0.01, (***) signifies p < 0.001, (****) signifies p < 0.0001. Statistical significance was determined using one-way ANOVA. (E) A two-way ANOVA to determine which factors had significant effects (p < 0.05) showed both stiffness and IL13 were significant in reducing the uptake (% PC positive cells and normalized MFI) independently; however, only normalized MFI showed synergistic effects. Scale bar = 50 μm. “n” refers to the number of replicates used in each study. | ||
Overall, our results highlight the utility of statistical DOE in conjunction with bioinspired culture model systems to assess the individual and synergistic effects of pro-fibrotic stimuli on alveolar macrophage response and function. With this approach, we elucidated that the M2 macrophage phenotype and their particle uptake (phagocytosis and efferocytosis) are independently regulated by both stiffness and IL13. Further, we identified synergistic effects of these stimuli on downregulation of the M1 macrophage phenotype and efferocytosis. These results provide key insights into how multiple pro-fibrotic stimuli work in tandem to exacerbate macrophage phenotype and response, where misregulation of alveolar macrophage debris clearing is implicated in pulmonary fibrosis yet mechanistically not well understood, as well as a platform for future studies (e.g., evaluating therapeutic candidates that target multiple fibrotic pathways).
Discussion
In this study we presented a statistical DOE approach to investigate the effect of commonly observed profibrotic stimuli (i.e., increased tissue stiffness and IL13 soluble factor) on the phenotype and functions of alveolar macrophages. Excess deposition of ECM is a hallmark of disease progression for pulmonary fibrosis, which results in increased stiffness of the lung tissue leading to eventual decline in lung function. In addition, increased presence of IL13 has been observed in fibrotic lungs in both humans and animal models and has been shown to activate different immune cells including alveolar macrophages, epithelial cells, and fibroblasts.25,44 Previous studies56,57 (as detailed later in the discussion) have demonstrated the effect of substrate stiffness on altered macrophage properties in non-respiratory contexts; here, we focus on applying a rigorous statistical approach to investigate the independent and synergistic effects of stiffness and soluble cues specifically on alveolar macrophages, using the MH-S murine cell line. We showed that increasing the stiffness of the hydrogel from Soft (E ∼ 2.5 kPa) to Stiff (E ∼ 23 kPa) and adding pro-fibrotic soluble cues (e.g., IL13) led to increased spreading of MH-S cells, a phenotypical shift towards anti-inflammatory phenotype, and impaired phagocytic and efferocytic functions of these alveolar macrophages. While both stiffness and IL13 independently influenced cell spreading, phenotypical markers, phagocytosis and efferocytosis, synergistic effects between these fibrotic cues also were observed in further influencing macrophage phenotype (i.e., CD86 and CD80 marker expression) and efferocytosis. Thus, the work presented here has important implications in identifying underlying drivers of fibrosis and their interactions with each other in regulating the immune microenvironment during disease progression.Synthetic hydrogel systems allow for integration of relevant biomechanical and biochemical cues and opportunities to investigate cell response, including phenotype and functionality. Multiple studies42,58 have investigated the polarization profile of macrophages cultured on synthetic substrates, using varied cell sources and materials across a range of moduli. For example, Sridharan and colleagues41 showed that collagen coated polyacrylamide hydrogels of increasing stiffness (11, 88 and 323 kPa) promoted THP-1 derived human macrophages towards a M1 phenotype in the presence of M1 stimuli. In contrast, Scott and colleagues59 showed PEG hydrogels of increasing stiffness (0.1, 3.4, and 10.3 kPa) resulted in an increased CD206+ cell population (M2 marker) and a further increase in CD206+ population in the presence of M2 stimuli (IL4/IL13) for cord blood derived human macrophages. These results indicate the importance of careful selection of the synthetic model system, mechanical properties, and cell type for the application of interest, since macrophages from different sources can produce different phenotypical profiles and are highly sensitive to relevant microenvironmental cues. Building from this nuanced backdrop, we sought to explicitly study parallel or synergistic drivers of the impaired phenotype of alveolar macrophages (MH-S cells) in a system inspired by the biomechanical and biochemical cues of IPF for informing hypotheses of ILD initiation and progression.
Focusing on alveolar macrophages specifically is crucial to understanding the impaired macrophage response in IPF, as alveolar macrophages dominate the lung immune landscape and display distinct phenotypes and functions when compared to macrophages from other tissue compartments.17 Under homeostatic conditions, alveolar macrophages are the most abundant immune cells in the lungs and are phenotypically identified by high surface marker expression of SiglecF and CD11c, which is unique to this subclass of macrophages.60 Alveolar macrophages are highly responsive to external stimuli and can change their phenotypical profile to either pro-inflammatory (M1) or anti-inflammatory (M2) depending on the pulmonary microenvironment.61 They are also remarkably plastic cells that can switch their polarization profile in the presence of different stimuli, making them not only critical for maintaining homeostasis but also as potential targets in regulating and reprogramming disease responses for therapeutic benefit.14 However, due to limitations of sample collection and in situ measurements, it is challenging to study the phenotypical and functional response of alveolar macrophages directly in the lung during disease progression. Alveolar macrophages are currently obtained from patients in limited numbers by performing bronchoalveolar lavage through invasive bronchoscopy which makes it difficult to study cellular response and testing therapeutics ex vivo.62 Alternatively, murine models for diseased states (e.g., bleomycin induced fibrosis) are established to study the cell response and for therapeutics testing.24 However, due to low recovery of alveolar macrophages from the mice lungs, similar challenges in ex vivo analysis persist. MH-S cells, an immortalized cell line derived from Balb/c murine alveolar macrophages, allow us to assess the response of alveolar macrophages with phenotypic similarity to in vivo studies,63 providing a robust and tissue-specific cell type to establish our model system.
To investigate the effect of stiffness and IL13 on MH-S cell response, we first established the synthetic hydrogel system by identifying monomer conditions to prepare hydrogels inspired by the stiffness of healthy and fibrotic lung tissue and achieving a similar final seeding density and nonsignificant differences in the metabolic activity for all the culture conditions, facilitated by the presence of a fibronectin-inspired integrin binding peptide (Fig. 2). After establishing the culture system, we assessed the effect of the stimuli individually and in combination on cell morphology and observed that both stiffness and IL13 increased the cell area of alveolar macrophages. Previous studies41,42 have reported similar observations showing an increase in the cell area with an increase in the substrate stiffness. Indeed, it is widely shown that cells can recognize substrate stiffness via cell–ECM adhesion structures called focal adhesions (FAs); accordingly, we hypothesize that stiff hydrogels promote higher FA formation in macrophages, resulting in an increased cell spread and more flattened morphology.64,65 Similarly, M2 polarizing stimuli have been reported to produce an elongated macrophage morphology on tissue culture plastic, and macrophages cultured on hydrogels in the presence of IL4 (M2 polarizing stimuli) increased expression of vinculin, an actin-binding FA protein, suggesting that presence of these stimuli contribute to higher FA formation and therefore increased cell spreading.66 We report similar observations for alveolar macrophages, where MH-S cells cultured on Stiff hydrogels with IL13 showed the highest cell area compared to other conditions. Both IL13 and mechanical stimuli are known to act through integrin-mediated signaling pathways, which may contribute to increased cell area.67 Interestingly, DOE analysis showed that, while both stiffness and IL13 independently increase cell area, these factors do not act synergistically in increasing the cell area (Fig. 3).
We next investigated cell response for MH-S cells in the presence of profibrotic stimuli on the cell surface, protein, and gene level. Immunostaining and flow cytometry analysis showed both stiffness and IL13 result in an increased CD206 expression (M2 marker), which was followed with decreased expression of both CD86 and CD80 (M1 markers) (Fig. 4). DOE analysis showed that, while both stiffness and IL13 were independently effective in increasing CD206 expression and decreasing both CD80 (only stiffness) and CD86 expression, the effect was synergistic for CD86 and CD80. The effect of stiffness was further confirmed on the gene level, where Stiff hydrogels had significantly higher CD206 expression compared to Soft hydrogels (Fig. S6†), indicating these phenotypical changes were observed on both the surface and gene level. Our ELISA results yield interesting insights: M2-associated cytokines (TGF-β and CCL2) showed only IL13 dependent increases, while M1-associated cytokines (TNF-α and IL-1β) showed non-significant decrease in the presence of both the profibrotic stimuli (Fig. 5). We hypothesized that the lack of statistical significance for the latter two cytokines (TNF-α and IL-1β) relative to the former two cytokines (TGF-β and CCL2) may be due differences in the timescales of their secretion and their relative stability or consumption after secretion in cell culture and during processing; for example, the half-life of TNF-α is on the order of minutes, whereas the half-life of secreted latent TGF-β is on the order of hours and is then activated into TGF-β1.68–70 To circumvent these potential sources of variability at the protein level and quantitatively confirm phenotypic trends, we looked at the gene-level quantifying the expression of both M1 (IL-1β) and M2 (CD206) markers using RT-qPCR and found that stiff hydrogels significantly downregulated IL-1β gene expression while upregulating CD206 gene expression.71 Furthermore, our studies explain that the M2 macrophage phenotype, commonly observed in fibrosis, is regulated by multiple fibrotic stimuli working both parallel and in tandem synergistically. Both mechanotransduction cues66 and IL-13 receptor72 signaling have been shown to signal through the JAK/STAT pathway to drive M2 polarization, a pathway that has also been implicated broadly in ILDs and represents an important therapeutic target.73 Given this overlap, we hypothesize that more phenotypical markers may show synergistic effects; this increased interaction may become more apparent with longer time points. The approach and system established here provides opportunities for further probing such synergies and temporal effects in future studies. Our studies presented here highlight that multiple profibrotic stimuli work synergistically in promoting dysregulated wound healing and the opportunity for future therapeutic strategies for IPF to simultaneously address multiple fibrotic drivers for effective treatments.
While macrophage phenotype was found to be influenced by both biophysical and biochemical cues, we sought to identify if these factors equally impair phagocytic capacity, given the importance of macrophages in clearing debris and damaged cells, which are thought to exacerbate IPF progression. Phagocytosis is an essential macrophage function that plays an important role in host defense by removing microbial pathogens and other foreign objects.53 Efferocytosis, which is a specialized type of phagocytosis, involves internalization of apoptotic cells, which is crucial in maintaining normal wound healing.74 We first studied the effect of stiffness and IL13 on phagocytosis by MH-S cells using PC coated microparticles and found that both stiffness and IL13 significantly decreased the uptake of PC microparticles independently without synergy, indicating an impaired macrophage function in the presence of both pro-fibrotic stimuli (Fig. 6). Next, we performed a similar analysis to study efferocytosis using PS microparticles and found that both stiffness and IL13 independently and synergistically reduce the uptake of PS microparticles with pro-fibrotic stimuli. Li and Bratlie43 have shown similar results, where increasing substrate stiffness of gellan gum hydrogels with IL4 significantly reduced uptake of polystyrene particles by RAW 264.7 macrophage cells. Another study by Sridharan and colleagues41 further reported a biphasic response in phagocytosis where THP-1 macrophage cells cultured on polyacrylamide gels with medium stiffness (88 kPa) showed the highest phagocytic capacity followed by those on Soft (11 kPa) or Stiff gels (323 kPa), demonstrating stiffness-dependent phagocytic effects. Our studies show that multiple aspects of the fibrotic microenvironment contribute to defective phagocytosis, which would limit effective removal of foreign pathogen, and defective efferocytosis, which would increase apoptotic debris in the lungs, contributing to the profibrotic feedback loop. Observations of impaired phagocytic profiles by macrophages are also reported in human patients29 and in animal models75 of pulmonary fibrosis; our work highlights that defective phagocytosis observed in fibrosis is regulated by both substrate stiffness and presence of IL13. Furthermore, identifying treatment strategies to restore the normal phagocytic functions of alveolar macrophages is critical for effective fibrosis treatment and points to another prospective therapeutic target.
The DOE approach presented in this study allows us to extract information about the interactions of different factors on our variable of interest using few total samples compared to investigating each factor one at a time. However, the fibrotic milieu is developed dynamically over a much longer time scale that our current approach does not permit. These dynamic shifts in pulmonary microenvironment are critical in understanding disease initiation and progression, specifically understanding cell response during intermediate stages of fibrosis which is currently not known. While we only investigated the effect of two profibrotic stimuli (stiffness and IL13) on macrophage phenotype and properties, the statistical approach presented here provides much more versatility in terms of including other factors, such as introducing other cell types (e.g., epithelial cells and fibroblasts) or including different ECM components (e.g., laminins and collagens) commonly found in the fibrotic interstitium. Additionally, incorporating different types of cells (e.g., macrophages, epithelial cells, and fibroblasts) and studying the effects of different ECM components on cellular responses more broadly would further capture aspects of more complex fibrotic microenvironments and provide insights into the pro-fibrotic responses of immune cells. Furthermore, more complex statistical models (such as response surface analysis with the addition of center points in addition to high and low points45) could also be used to investigate cell responses at intermediate stages of fibrosis and understand how these factors interact with each other and individually in this context. The data presented here demonstrate the benefit of using a DOE approach to study the effect of the complex immune microenvironment on biological responses in a more efficient and robust manner. In addition, hydrogel platforms that allow in situ modification of substrate stiffness can be incorporated in future investigation to examine the temporal dynamics of the reversibility of pro-fibrotic cell responses towards stopping or reversing the progression of fibrosis.76–78
Overall, our studies show that multiple profibrotic stimuli work both in parallel and in synergy to impair macrophage functional responses under fibrosis inspired conditions. Using a DOE based approach, we showed that while both substrate stiffness and IL13 independently modulate macrophage cell spreading, anti-inflammatory phenotype, and reduced phagocytosis and efferocytosis, whereas synergistic effects were observed in downregulating a pro-inflammatory phenotype and decreasing efferocytosis suggesting an intertwined effect of multiple fibrotic stimuli in dysregulated wound healing. These observations highlight the need for use of well-defined in vitro model systems with multiple fibrotic cues to probing the multifaceted fibrotic response systematically investigating how underlying drivers of fibrosis modulate the fibrotic cascade. Building this model not only provides opportunities to elucidate fibrotic drivers, but also provides an important platform to screen potential new therapeutics that target these abundant alveolar macrophages in the lung in future studies. The platform presented here allows for incorporation of other fibrotic players to understand the crosstalk between the different fibrotic factors in the pulmonary microenvironment and assess different therapeutic strategies targeted towards investigating the potential reversibility of fibrosis. Taken together, this work lays a critical foundation to support identification of novel therapeutic targets surrounding innate immune cell regulation with the long-term goal of stopping or reversing fibrosis.
Conclusion
In this work, we present a statistical approach to study the individual and synergistic effects of matrix stiffness and profibrotic soluble factor (IL13) on the phenotype and properties of alveolar macrophages. We found that both stiffness and IL13 independently regulate macrophage morphology, M2 polarization profile, and reduced phagocytosis and efferocytosis. Further, some synergistic effects are also observed especially in tuning macrophage phenotype and efferocytosis, which have potential further downstream effects in promoting dysregulated wound healing in pulmonary fibrosis. Taken together, these results indicate that multiple profibrotic factors play a complex role in modulating impaired macrophage response, and a more detailed mechanistic understanding is required to delineate the role of complex fibrotic microenvironment on immune cell response. Furthermore, the framework established in this study provides an opportunity to study the combinatorial effects of multiple fibrotic microenvironment cues to better understand the complex pathology of the pulmonary fibrosis and identify novel therapeutic targets for stopping the progression of fibrosis or even potentially reversing it.Conflicts of interest
The authors declare no conflict of interest.Acknowledgements
This work was supported by Collins fellowship (Bomb), NIH Director's New Innovator Award with grant number DP2HL152424 (Kloxin), and NIH NIGMS R35GM142866A Award (Fromen). The authors thank Lisa Hester and the University of Maryland Cytokine Core Laboratory for assistance with ELISA assays. The authors thank Kimberly Wodzanowski for initial training on gene expression analysis. The authors thank Samantha Cassel for her insight in experimental design, help with norbornene functionalization of PEG, and feedback throughout this work. The authors thank the Delaware Biotechnology Institute (DBI) for providing access to the CFX96 detection module to run RT-qPCR samples. Additionally, the authors acknowledge the use of facilities and instrumentation supported by the National Science Foundation through the University of Delaware Materials Research Science and Engineering Center (DMR-2011824) and the National Institute of General Medical Sciences, part of the National Institutes of Health, through the Delaware COBRE (P20GM104316). Fig. 1, Fig. 2A, and Table of Content figures were created using BioRender.com.References
- P. W. Noble, C. E. Barkauskas and D. Jiang, J. Clin. Invest., 2012, 122, 2756–2762 CrossRef CAS PubMed.
- V. J. Thannickal, G. B. Toews, E. S. White, J. P. Lynch III and F. J. Martinez, Annu. Rev. Med., 2004, 55, 395–417 CrossRef CAS PubMed.
- S. H. Abid, V. Malhotra and M. C. Perry, Curr. Opin. Oncol., 2001, 13, 242–248 CrossRef CAS PubMed.
- W. J. Huang and X. X. Tang, J. Transl. Med., 2021, 19, 1–15 CrossRef PubMed.
- M. Ekström, T. Gustafson, K. Boman, K. Nilsson, G. Tornling, N. Murgia and K. Torén, BMJ open, 2014, 4, e004018 CrossRef PubMed.
- M. P. Steele and K. K. Brown, Respiration, 2007, 74, 601–608 CrossRef PubMed.
- L. Richeldi, H. R. Collard and M. G. Jones, The Lancet, 2017, 389, 1941–1952 CrossRef.
- A. Betensley, R. Sharif and D. Karamichos, J. Clin. Med., 2016, 6, 2 CrossRef PubMed.
- S. Kolahian, I. E. Fernandez, O. Eickelberg and D. Hartl, Am. J. Respir. Cell Mol. Biol., 2016, 55, 309–322 CrossRef CAS PubMed.
- T. A. Wynn, J. Exp. Med., 2011, 208, 1339–1350 CrossRef CAS PubMed.
- D. S. Glass, D. Grossfeld, H. A. Renna, P. Agarwala, P. Spiegler, L. J. Kasselman, A. D. Glass, J. DeLeon and A. B. Reiss, Respir. Invest., 2020, 58, 320–335 CrossRef PubMed.
- N. Sakai and A. M. Tager, Biochim. Biophys. Acta, Mol. Basis Dis., 2013, 1832, 911–921 CrossRef CAS PubMed.
- K. Blirando, EC Pulmonol. Respir. Med., 2018, 7, 98–120 Search PubMed.
- T. Hussell and T. J. Bell, Nat. Rev. Immunol., 2014, 14, 81–93 CrossRef CAS PubMed.
- C. E. Witherel, D. Abebayehu, T. H. Barker and K. L. Spiller, Adv. Healthcare Mater., 2019, 8, 1801451 CrossRef PubMed.
- E. M. O’Brien and K. L. Spiller, J. Leukocyte Biol., 2021, 111(5), 989–1000 CrossRef PubMed.
- A. J. Byrne, S. A. Mathie, L. G. Gregory and C. M. Lloyd, Thorax, 2015, 70, 1189–1196 CrossRef PubMed.
- K. L. Wofford, D. K. Cullen and K. L. Spiller, J. Biomed. Mater. Res., Part A, 2019, 107, 1213–1224 CrossRef CAS PubMed.
- T. T. Braga, J. S. H. Agudelo and N. O. S. Camara, Front. Immunol., 2015, 6, 602 Search PubMed.
- A. Prasse, D. V. Pechkovsky, G. B. Toews, W. Jungraithmayr, F. Kollert, T. Goldmann, E. Vollmer, J. Müller-Quernheim and G. Zissel, Am. J. Respir. Crit. Care Med., 2006, 173, 781–792 CrossRef CAS PubMed.
- L. A. Murray, R. Rosada, A. P. Moreira, A. Joshi, M. S. Kramer, D. P. Hesson, R. L. Argentieri, S. Mathai, M. Gulati and E. L. Herzog, PLoS One, 2010, 5, e9683 CrossRef PubMed.
- D. V. Pechkovsky, A. Prasse, F. Kollert, K. M. Engel, J. Dentler, W. Luttmann, K. Friedrich, J. Müller-Quernheim and G. Zissel, Clin. Immunol., 2010, 137, 89–101 CrossRef CAS PubMed.
- J. C. Schupp, H. Binder, B. Jäger, G. Cillis, G. Zissel, J. Müller-Quernheim and A. Prasse, PLoS One, 2015, 10, e0116775 CrossRef PubMed.
- P. J. Wermuth and S. A. Jimenez, Clin. Transl. Med., 2015, 4, 1–19 CrossRef PubMed.
- L. A. Murray, R. L. Argentieri, F. X. Farrell, M. Bracht, H. Sheng, B. Whitaker, H. Beck, P. Tsui, K. Cochlin and H. L. Evanoff, Int. J. Biochem. Cell Biol., 2008, 40, 2174–2182 CrossRef CAS PubMed.
- C. Jakubzick, S. L. Kunkel, R. K. Puri and C. M. Hogaboam, Immunol. Res., 2004, 30, 339–349 CrossRef CAS PubMed.
- L. Sun, M. C. Louie, K. M. Vannella, C. A. Wilke, A. M. LeVine, B. B. Moore and T. P. Shanley, Am. J. Physiol.: Lung Cell. Mol. Physiol., 2011, 300, L341–L353 CrossRef CAS PubMed.
- S. J. Allden, P. P. Ogger, P. Ghai, P. McErlean, R. Hewitt, R. Toshner, S. A. Walker, P. Saunders, S. Kingston and P. L. Molyneaux, Am. J. Respir. Crit. Care Med., 2019, 200, 209–219 CrossRef CAS PubMed.
- K. Morimoto, W. J. Janssen and M. Terada, Respir. Med., 2012, 106, 1800–1803 CrossRef PubMed.
- A. Sundarakrishnan, Y. Chen, L. D. Black, B. B. Aldridge and D. L. Kaplan, Adv. Drug Delivery Rev., 2018, 129, 78–94 CrossRef CAS PubMed.
- K. E. Bailey, M. L. Floren, T. J. D'Ovidio, S. R. Lammers, K. R. Stenmark and C. M. Magin, Am. J. Physiol.: Lung Cell. Mol. Physiol., 2019, 316, L303–L320 CrossRef CAS PubMed.
- M. A. Freeberg, A. Perelas, J. K. Rebman, R. P. Phipps, T. H. Thatcher and P. J. Sime, Am. J. Pathol., 2021, 191, 18–25 CrossRef CAS PubMed.
- S.-W. Park, M.-H. Ahn, H. K. Jang, A. S. Jang, D.-J. Kim, E.-S. Koh, J.-S. Park, S.-T. Uh, Y. H. Kim and J. S. Park, J. Korean Med. Sci., 2009, 24, 614–620 CrossRef CAS PubMed.
- J. Herrera, C. A. Henke and P. B. Bitterman, J. Clin. Invest., 2018, 128, 45–53 CrossRef PubMed.
- M. E. Smithmyer, J. B. Spohn and A. M. Kloxin, ACS Biomater. Sci. Eng., 2018, 4, 3304–3316 CrossRef CAS PubMed.
- M. E. Smithmyer, L. A. Sawicki and A. M. Kloxin, Biomater. Sci., 2014, 2, 634–650 RSC.
- J. P. Woodley, D. W. Lambert and I. O. Asencio, Tissue Eng., Part B, 2021, 28(3), 569–578 CrossRef PubMed.
- C. L. Petrou, T. J. D'Ovidio, D. A. Bölükbas, S. Tas, R. D. Brown, A. Allawzi, S. Lindstedt, E. Nozik-Grayck, K. R. Stenmark and D. E. Wagner, J. Mater. Chem. B, 2020, 8, 6814–6826 RSC.
- T. Okamoto, Y. Takagi, E. Kawamoto, E. J. Park, H. Usuda, K. Wada and M. Shimaoka, Exp. Cell Res., 2018, 367, 264–273 CrossRef CAS PubMed.
- Z. Li and K. M. Bratlie, ACS Appl. Bio Mater., 2018, 2, 217–225 CrossRef PubMed.
- R. Sridharan, B. Cavanagh, A. R. Cameron, D. J. Kelly and F. J. O'Brien, Acta Biomater., 2019, 89, 47–59 CrossRef CAS PubMed.
- Z. Zhuang, Y. Zhang, S. Sun, Q. Li, K. Chen, C. An, L. Wang, J. J. van den Beucken and H. Wang, ACS Biomater. Sci. Eng., 2020, 6, 3091–3102 CrossRef CAS PubMed.
- Z. Li and K. M. Bratlie, Mater. Sci. Eng., C, 2021, 128, 112303 CrossRef CAS PubMed.
- Y. Ito, R. Al Mubarak, N. Roberts, K. Correll, W. Janssen, J. Finigan, R. Mishra and H. W. Chu, PLoS One, 2018, 13, e0196256 CrossRef PubMed.
- M. S. Rehmann, J. I. Luna, E. Maverakis and A. M. Kloxin, J. Biomed. Mater. Res., Part A, 2016, 104, 1162–1174 CrossRef CAS PubMed.
- B. D. Fairbanks, M. P. Schwartz, C. N. Bowman and K. S. Anseth, Biomaterials, 2009, 30, 6702–6707 CrossRef CAS PubMed.
- A. Moore, J. DeLucca, D. Elliott and D. Burris, J. Tribol., 2016, 138, 041405 CrossRef PubMed.
- H. Deng, L. Wu, M. Liu, L. Zhu, Y. Chen, H. Zhou, X. Shi, J. Wei, L. Zheng and X. Hu, Shock, 2020, 54, 828–843 CrossRef CAS PubMed.
- M. E. Smithmyer, S. E. Cassel and A. M. Kloxin, AIChE J., 2019, 65, e16837 CrossRef CAS PubMed.
- G. Burgstaller, B. Oehrle, M. Gerckens, E. S. White, H. B. Schiller and O. Eickelberg, Eur. Respir. J., 2017, 50, 1601805 CrossRef PubMed.
- S. Féréol, R. Fodil, B. Labat, S. Galiacy, V. M. Laurent, B. Louis, D. Isabey and E. Planus, Cell Motil. Cytoskeleton, 2006, 63, 321–340 CrossRef PubMed.
- B. Allard, A. Panariti and J. G. Martin, Front. Immunol., 2018, 9, 1777 CrossRef PubMed.
- B. M. Jarai and C. A. Fromen, Adv. Nanobiomed Res., 2022, 2100127 CrossRef PubMed.
- P. J. Dalal and R. Sumagin, J. Cell. Immunol., 2020, 2, 250 Search PubMed.
- I. Vermes, C. Haanen, H. Steffens-Nakken and C. Reutellingsperger, J. Immunol. Methods, 1995, 184, 39–51 CrossRef CAS PubMed.
- A. K. Blakney, M. D. Swartzlander and S. J. Bryant, J. Biomed. Mater. Res., Part A, 2012, 100, 1375 CrossRef PubMed.
- H. Zhou, Y. Xue, L. Dong and C. Wang, J. Mater. Chem. B, 2021, 9, 3608–3621 RSC.
- E. Gruber, C. Heyward, J. Cameron and C. Leifer, Int. Immunol., 2018, 30, 267–278 CrossRef CAS PubMed.
- R. A. Scott, K. L. Kiick and R. E. Akins, Acta Biomater., 2021, 122, 220–235 CrossRef CAS PubMed.
- M. Guilliams, B. Lambrecht and H. Hammad, Mucosal Immunol., 2013, 6, 464–473 CrossRef CAS PubMed.
- J. Kulikauskaite and A. Wack, Trends Immunol., 2020, 41, 864–877 CrossRef CAS PubMed.
- E. Mitsi, R. Kamng'ona, J. Rylance, C. Solórzano, J. Jesus Reiné, H. C. Mwandumba, D. M. Ferreira and K. C. Jambo, Respir. Res., 2018, 19, 1–4 CrossRef PubMed.
- J. S. Erdem, M. Alswady-Hoff, T. K. Ervik, Ø. Skare, D. G. Ellingsen and S. Zienolddiny, Biomaterials, 2019, 203, 31–42 CrossRef PubMed.
- K. Ye, X. Wang, L. Cao, S. Li, Z. Li, L. Yu and J. Ding, Nano Lett., 2015, 15, 4720–4729 CrossRef CAS PubMed.
- D. W. Zhou, T. T. Lee, S. Weng, J. Fu and A. J. García, Mol. Biol. Cell, 2017, 28, 1901–1911 CrossRef CAS PubMed.
- B. H. Cha, S. R. Shin, J. Leijten, Y. C. Li, S. Singh, J. C. Liu, N. Annabi, R. Abdi, M. R. Dokmeci and N. E. Vrana, Adv. Healthcare Mater., 2017, 6, 1700289 CrossRef PubMed.
- L. P. Desai, Y. Wu, R. S. Tepper and S. J. Gunst, Am. J. Physiol.: Lung Cell. Mol. Physiol., 2011, 301, L275–L284 CrossRef CAS PubMed.
- A. Diez-Ruiz, G. P. Tilz, R. Zangerle, G. Baier-Bitterlich, H. Wachter and D. Fuchs, Eur. J. Haematol., 1995, 54, 1–8 CrossRef CAS PubMed.
- M. Goppelt-Struebe and M. Stroebel, FEBS Lett., 1995, 374, 375–378 CrossRef CAS PubMed.
- J. Nüchel, S. Ghatak, A. V. Zuk, A. Illerhaus, M. Mörgelin, K. Schönborn, K. Blumbach, S. A. Wickström, T. Krieg and G. Sengle, Autophagy, 2018, 14, 465–486 CrossRef PubMed.
- P. Israelsson, E. Dehlin, I. Nagaev, E. Lundin, U. Ottander and L. Mincheva-Nilsson, Am. J. Reprod. Immunol., 2020, 84, e13249 CrossRef CAS PubMed.
- G. K. Hershey, J. Allergy Clin. Immunol., 2003, 111, 677–690 CrossRef CAS PubMed ; quiz 691.
- P. Montero, J. Milara, I. Roger and J. Cortijo, Int. J. Mol. Sci., 2021, 22, 6211 CrossRef CAS PubMed.
- M. R. Elliott, K. M. Koster and P. S. Murphy, J. Immunol., 2017, 198, 1387–1394 CrossRef CAS PubMed.
- K. K. Kim, M. R. Dotson, M. Agarwal, J. Yang, P. B. Bradley, N. Subbotina, J. J. Osterholzer and T. H. Sisson, Cell Death Dis., 2018, 9, 1–12 CrossRef PubMed.
- A. M. Kloxin, J. A. Benton and K. S. Anseth, Biomaterials, 2010, 31, 1–8 CrossRef CAS PubMed.
- A. M. Rosales, S. L. Vega, F. W. DelRio, J. A. Burdick and K. S. Anseth, Angew. Chem., Int. Ed., 2017, 56, 12132–12136 CrossRef CAS PubMed.
- H. Wang, S. M. Haeger, A. M. Kloxin, L. A. Leinwand and K. S. Anseth, PLoS One, 2012, 7, e39969 CrossRef CAS PubMed.
Footnote |
| † Electronic supplementary information (ESI) available. See DOI: https://doi.org/10.1039/d2bm00828a |
| This journal is © The Royal Society of Chemistry 2022 |