 Open Access Article
The influence of Gd-DOTA conjugating ratios to PLGA-PEG micelles encapsulated IR-1061 on bimodal over-1000 nm near-infrared fluorescence and magnetic resonance imaging†
Thi Kim Dung
Doan
 *ab,
Masakazu
Umezawa
 c,
Kazunobu
Ohnuki
b,
Karina
Nigoghossian
 c,
Kyohei
Okubo
 cd,
Masao
Kamimura
 cd,
Masayuki
Yamaguchi
b,
Hirofumi
Fujii
 b and
Kohei
Soga
acd
aResearch Institute for Biomedical Science, Tokyo University of Science, 2669 Yamazaki, Noda, Chiba 278-0022, Japan. E-mail: doan@rs.tus.ac.jp
bDivision of Functional Imaging, Exploratory Oncology Research & Clinical Trial Center, National Cancer Center, 6-5-1 Kashiwanoha, Kashiwa 277-8577, Japan
cDepartment of Material Science and Technology, Tokyo University of Science, 6-3-1 Niijuku, Katsushika-ku, Tokyo 125-8585, Japan
dImaging Frontier Center (IFC), Tokyo University of Science, 2641 Yamazaki, Noda, Chiba 278-8510, Japan
First published on 11th January 2022
Abstract
Multimodal imaging can provide multidimensional information for understanding concealed microstructures or bioprocesses in biological objects. The combination of over-1000 nm near-infrared (OTN-NIR) fluorescence imaging and magnetic resonance (MR) imaging is promising in providing high sensitivity and structural information of lesions. This combination can be facilitated by the development of an imaging probe. The OTN-NIR and MR bimodal fluorescence probes reported to date primarily involve ceramic particles for fluorescence and MRI contrast enhancement effect. In this study, we designed a new bimodal OTN-NIR/MR imaging probe from organic components including an OTN-NIR fluorescent organic dye (IR-1061) encapsulated in the core of a micelle composed of poly(lactic-co-glycolic acid)-block-poly(ethylene glycol) copolymer (PLGA-PEG). For the MRI contrast, gadobutrol (Gd-DOTA) was introduced at the end of the PEG chain at various ratios. Thereafter, the OTN-NIR fluorescence and MR bimodal imaging probes of ca. 20 nm in size were successfully prepared and applied in mouse imaging. The probe exhibited absorption and emission in the OTN-NIR, and T1 contrast enhancement effects on MRI. Moreover, it demonstrated bright OTN-NIR fluorescence and MRI contrast enhancement to depict veins and observe the organs in live mice. The imaging results revealed that the Gd-DOTA introduction ratio is of great importance for controlling the biological response of the probe without reducing the contrast enhancement effect.
Introduction
Recently, the number of studies focused on multimodal imaging has increased significantly.1–8 The advent of multimodal imaging heralds novel biological or medical imaging methods that offer higher dimensions of information and aid in the recognition of underlying structures or phenomena. In addition, the combination of imaging techniques that favour either hardware integration or multimodal probe design can predominantly facilitate multimodal imaging. Among the multimodal platforms investigated to date, magnetic resonance (MR) imaging (MRI) and near-infrared (NIR) fluorescence imaging are emergent potential tools for several medical applications, such as surgical aid imaging.9–11 In this context, MRI is effective in unlimited deep-penetration imaging and is generally used in clinical practice to navigate lesions inside the body. Additionally, fluorescence imaging is a sensitive and high-resolution technique that is capable of imaging bioprocesses in real time. In particular, tissue regions at centimetre-level depths have been extensively investigated using over-1000 nm near-infrared (OTN-NIR) light to detect sensitive signals from deeper regions. Moreover, several probes have been designed and developed for promoting the application of the OTN-NIR/MR combination, and various structures have been proposed.12–16The majority of the OTN-NIR/MR probing structures reported comprise inorganic compounds, especially ceramic nanoparticles12 such as rare-earth-doped ceramic nanoparticles (RED-CNPs), widely used as an OTN-NIR/MRI probe. More importantly, the emission range can be controlled by selecting suitable dopant ions or integrating the MRI contrast enhancement effect into the structure by codoping with gadolinium ions—a predominant T1 contrast enhancement agent.17 However, a significant drawback of RED-CNPs is their large particle size. The size of RED-CNPs should be sufficiently large for emitting a detectable signal in vivo.12 Besides, hybrid structures, including organic molecules and inorganic compounds, such as quantum dots (QDs), manganese or gadolinium nanoparticles, are also extensively employed to design multimodal probes combining fluorescence and MR imaging.18–22 For instance, a bimodal probe from inorganic core Ag2S QDs with Gd-DOTA organic molecules functionalized on the surface was applied to image brain tumors. The structure had a diameter smaller than 100 nm; thus, the blood retention could last up to several hours in mouse bodies.19 In contrast, several organic platforms have been designed for the OTN-NIR/MR imaging of liver and brain tumours with an OTN-NIR probe CH1055 binding to Mn2+ lactoferrin nanoparticles of sizes larger than 200 nm.16
The probe diameter is an essential factor in pharmacokinetic properties during circulation inside the body, wherein a large structure can trigger a response from the reticuloendothelial system (RES), especially for probe sizes of 100 nm approximately. The RES recognises the larger-sized probes as foreign entities, and consequently, activates the phagocytic cells such as macrophages to capture the probes and confine them to the liver.23–26 Moreover, the probe diameter can enlarge owing to the interaction with plasma proteins and the formation of corona shells on the surface of the probe.23,26 Therefore, an appropriate probe should possess a sufficiently small size or typical surface characteristics to avoid plasma–protein interactions and activate immune responses for enhancing biodistribution and circulation.23,25,27,28
Organic compounds, such as polymeric micelles, can be potentially used in imaging probes as they exhibit small hydrodynamic sizes, which aid in avoiding identification by the RES as foreign entities.24,25,29 Their structure contains a hydrophobic polymer core for carrying organic dyes and hydrophilic polymer shell, such as poly(ethylene glycol) (PEG). PEG inherits an active steric repulsion that can propel any potential interaction.30 Systemically administered PEG-shell micelles with a negative charge were reported to deplete protein adsorption and prolong the retention time in blood.28,31,32 Moreover, it facilitates the introduction of functional molecules into the structures via covalent bonding. Various micellar structures utilizing IR-1061 with PEG block copolymers have been reported by our group, such as IR-1061 encapsulated by self-assembly in either poly(ε-caprolactone)-block-poly(ethylene glycol) (PCL-PEG) or PLGA-PEG.33,34
Among the currently known T1 contrast molecular agents, Gd chelates, i.e., Gadovist (Gd-DOTA), are generally used in clinical practice. Gd-chelates are conjugated to other fluorescent dyes for bimodal imaging. However, fluorescence and MR imaging exhibit variations in terms of sensitivity, whereas MRI requires a high dose to release detectable signals, which result in inequivalent signal detection as equal molar numbers are integrated into the probing structure.35,36 A carrying platform that can regulate the molar number of the individual probes is advantageous for application as a multimodal probe. On the other hand, the presence of MRI contrast may cause damage to fluorescence properties.37 To trade off the disadvantages and to get the brightness enhancement from two modalities, the efficient ratios must be investigated.
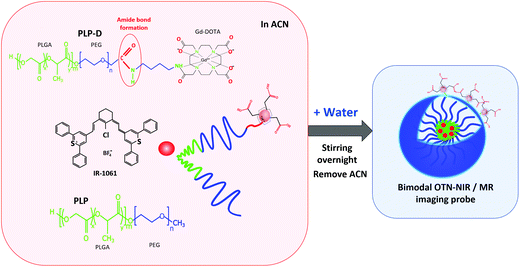
In this study, we prepared a novel bimodal OTN-NIR/MR imaging probe utilising polymeric micelles as used in our previous methods34,38,39 with modification. In particular, an amine derivative of Gd-DOTA (Gd-DO3A-butylamine) is firstly conjugated to the carboxyl group at the terminal of the PEG chain in the PEG-PLGA copolymer; the conjugation product is used to prepare micelles encapsulating the OTN-NIR dye IR-1061. The schematic procedure is illustrated in Fig. 1. The bimodal properties and the influence of Gd-DOTA ratios are also investigated.
Materials and methods
Reagents
PLGA-PEG (Mn = 2000–2000) and PLGA-PEG possessing a carboxyl group at the α-end of PEG chain (PLGA-PEG-COOH) (Mn = 2000–2000) were purchased from Nanosoft Polymers, Winton-Salem, NC, USA. IR-1061, ethylene diamine tetra-acetic acid (EDTA), 1-(3-dimethylaminopropyl)-3-ethylcarbodiimide hydrochloride (EDC), N-hydroxy-succinimide (NHS), 4-morpholineethanesulfonic acid (MES), 4-morpholineethanesulfonic acid sodium salt (MES sodium salt), bovine serum albumin, deuterated chloroform (CDCl3) and deuterated dimethyl sulfoxide-d6 (DMSO-d6) were purchased from Sigma-Aldrich, St Louis, MO, USA. Dichloromethane (DCM), acetonitrile (ACN), diethyl ether, dimethyl sulfoxide (DMSO), potassium chloride (KCl), sulfuric acid (H2SO4), hydrogen peroxide (H2O2), and normal mouse serum were purchased from FUJIFILM Wako Pure Chemical Corporation, Osaka, Japan. Normal saline was obtained from Otsuka Pharmaceutical Factory, Inc., Tokushima, Japan, and Gd-DO3A-butylamine was purchased from Macrocyclics, Inc., Plano, TX, USA. Moreover, phosphate buffered saline (PBS) was obtained from Thermo Scientific, Inc., Waltham, MA, USA. All the reagents were used without further purification.Preparation of imaging probes
The conjugation yield was calculated by the eqn (1):
 | (1) |
The conjugation efficiency in eqn (2) was analysed by inductively coupled plasma-atomic emission spectroscopy (ICP-AES).
 | (2) |
To obtain different Gd-DOTA molecular ratios during micelle preparation, PLP-D was mixed with PLGA-PEG (PLP) at various special concentrations (PLP-D [m (%)]) from eqn (3):
 | (3) |
Micelle characterization
![[thin space (1/6-em)]](https://www.rsc.org/images/entities/char_2009.gif) :
:![[thin space (1/6-em)]](https://www.rsc.org/images/entities/char_2009.gif) 1 mixture of H2SO4 and H2O2 – and shaken overnight prior to the measurement.
1 mixture of H2SO4 and H2O2 – and shaken overnight prior to the measurement.
To determine the stability of the imaging probe, the PLP-D mixed micelles were dispersed in water, physiological saline, PBS, and albumin solution (40 mg ml−1). Four solutions of each ratio were incubated for 30, 60, and 90 min, and thereafter, the absorption, emission, and DLS were measured. To measure R1 relaxation rates, after incubating with albumin and mouse serum for 30 min, the solutions were filtered to eliminate the leaking polymer chains. The remaining micelles were dissolved in water for further analysis.
In vivo imaging
In vivo imaging was performed using two procedures. Firstly, the probes were used to perform bimodal OTN-NIR/MR imaging with only one shot. Following this, the OTN-NIR and MR imaging were separately conducted. In addition, all animal experiments were conducted in accordance with the Guidelines for Care and Use of Laboratory Animals of Tokyo University of Science and Japanese National Cancer Center along with the Animal Welfare Management Act and under approvals from the Animal Ethics Committee of Tokyo University of Science as well as Japanese National Cancer Center. Seven-week-old BALB/c female mice were procured from Japan SLC, Inc. (Shizuoka, Japan) and used for MRI and one-shot bimodal imaging. For the OTN-NIR imaging, 7-week-old BALB/c female null mice were procured from Japan SLC, Inc. (Shizuoka, Japan). Prior to in vivo imaging experiments, the mice were fed iVid # 2 (Oriental Yeast Co., Ltd, OYC, Tokyo, Japan) for 7 days.In vivo OTN-NIR imaging. The mice were anaesthetised with 1–1.5% isoflurane via a nose mask. Additionally, bimodal micelles [100 μl of bimodal micelles in saline (50 mg ml−1 and 100 μg of IR-1061 dye)] were injected into the tail vein. The OTN-NIR images were acquired at 0, 5, 10, 30, 60, and 90 min post-injection.
In vivo MRI. The MRI was acquired using a T1 IG-FLASH (intragate fast low-angle shot) at scan intervals of 0, 30, and 60 min. Furthermore, the time-dependent images of the mouse were acquired using the following sequences: T1-weighted gradient echo (TR = 120 ms, TE = 3.2 ms, FA = 40°, NEX = 1). The matrix size was set at 125 × 125, and six 1.0 mm-thick slice sections with a 1.25 mm gap were acquired.
Image analysis
The OTN images were transferred and analysed using the open-source ImageJ software ver. 1.8. In particular, regions of interest (ROIs) of 2 mm × 2 mm were placed in the liver and spleen, and the line profile of the vessel was applied to measure the ROI values. The time-dependent signal intensities were measured by ImageJ to evaluate the temporal variations.The MR image data were exported to the Digital Imaging and Communications in Medicine (DICOM) format and imported into the Bio-Formats importer plugin of Fiji—a package based on ImageJ. The ROIs (2 mm × 2 mm) were placed in the liver, spleen, vena cava, bladder, and kidneys, and the signal intensities were measured using ImageJ.
For both the modalities, the average intensity (It) was considered from the same ROI at various time instants (t), which were subtracted from the background (BG) of the intensity threshold (e.g., 30% of black pixels) and plotted as the relative intensity (IR) for each corresponding organ. Then, the plots of relative intensity for each organ were used to compare the temporal distribution of the probe.
| IR = (It − BG) × (t) | (4) |
Results
Probe characteristics
The successful conjugation of the Gd-DOTA was used to prepare the imaging probe. Initially, the probe with a high PLP-D ratio of 70% was prepared and characterized. The micellar structure was confirmed by 1H NMR (400 MHz) spectroscopy. Fig. 2(a) depicts the chemical structure of synthesized PLP-D, and (b) illustrates the corresponding NMR spectrum of PLP-D. The reference spectra of commercial products, including PLGA-PEG-COOH and Gd-DOTA butylamine are shown in Fig. 2(c), and (d), respectively. In Fig. 2(b), the spectrum was obtained for PLP-D [70] micelle with δ 0.8–1.2 ppm for the –CH2 of butyl branch, δ 1.25–2.08 ppm for the –CH3 of lactide, δ 2.4–2.8 ppm for –CH2COOH of DOTA, δ 2.8–3.36 ppm for –CH2 of DOTA, δ 3.1–3.6 ppm for –CH2 of PEG, δ 4.2–5.0 ppm for –CH2 and –CH2OH of glycolide, δ 4.9–5.8 ppm for –CH of lactide, δ 6.32 ppm for –CO–NH (amide), and δ 11.6 ppm in Fig. 2(c) represents for –COOH of PLGA-PEG-COOH. Those peaks are in agreement with the previous reports of PEG conjugated to Gd-DOTA, PEG, and PLGA compositions, DOTA conjugation compounds, and the amide bond formation among the structures.41–49 All of these confirmed the presence of Gd-DOTA in the PLGA-PEG polymer. The other confirmation data by Fourier-transform infrared spectroscopy and fluorescence spectrometer are presented in the ESI.† The synthesis yield of PLP-D was 37.8%, and the conjugation yield was 91.7%.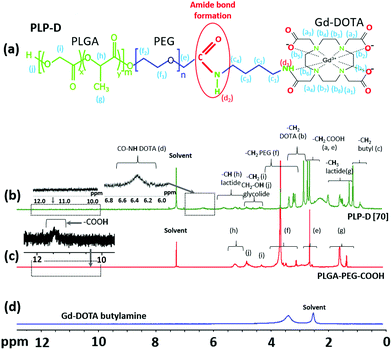 | ||
| Fig. 2 Chemical structure of PLP-D (a), 1H NMR spectra of PLP-D [70] micelles (b), PLGA-PEG-COOH polymer (c) in CDCl3, and Gd-DOTA butylamine (d) in DMSO-d6. | ||
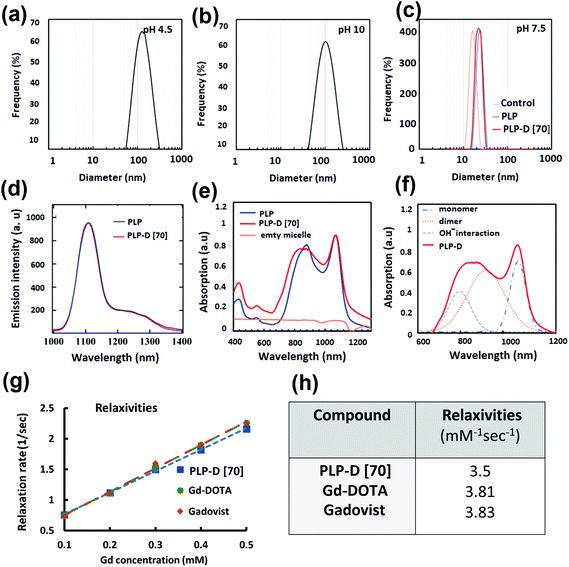
Stable blood circulation depends on the small size of the probe and the PEG coated on the particle surface, which is typically used as a blood plasma expander.25,27,28,31,50,51 The probe sizes obtained in various pH values are shown in Fig. 3(a–c); with a pH ∼ 7.5, the probe diameter is approximately 20 nm. According to the DLS results presented in Fig. 3(c), the hydrodynamic diameters of the control micelle (no IR-1061 and no-Gd), PLGA-PEG (no-Gd), and PLP-D (with Gd) were 16.18 ± 0.6 nm, 22.5 ± 0.35 nm, and 22.8 ± 0.31 nm, respectively. Compared to the control micelles, the hydrodynamic diameters of the PLGA-PEG (no Gd) and PLP-D (with Gd) micelles slightly increased. The isoelectric points dependent on pH values are presented in the ESI.†
The emission and absorption spectra of the bimodal probe with and without the PLP-D in the structure are presented in Fig. 3(d) and (e), respectively, and the fitting displays the contribution of the absorption spectra (f). The emitted spectra exhibited no difference with and without Gd-DOTA in the structure, including the main peak at around 1100 nm and a slight shoulder at around 1200–1300 nm under NIR excitation of 980 nm. Besides, the imaging probe absorbed light over a broad wavelength of 740 ± 1100 nm and demonstrated a major absorption peak around 1064 nm and a slight shoulder at 890 nm.
The relaxivities, r1, estimated from the slope of the relaxation rate plot (1/T1, R1) as a function of Gd3+ concentration ranging within 0.0–0.5 mmol L−1, are shown in Fig. 3(g and h). The probe relaxivity is 3.5 mM−1 s−1 and is comparable to that of the Gd-DOTA complex (r1 = 3.81 mM−1 s−1) and a clinical MRI contrast agent GADOVIST—a commercial product approved for use as an MRI contrast enhancement agent in clinical trials (3.83 mM−1 s−1). The T1-weighted images of the micelles in the phantom and the OTN-NIR emission intensity are discussed in the following sections.
OTN-NIR fluorescence and MR bimodal imaging with one shot
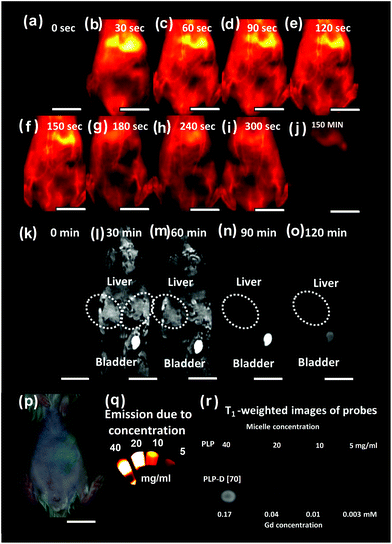
We initially performed the bimodal imaging with one shot using PLP-D [70], with 70% of Gd-DOTA introduced at the end of PEG chains, and the results are presented in Fig. 4(a–o). The bright-field image of the mouse is shown in Fig. 4(p), and OTN-NIR images and T1-weight images of PLP-D [70] at different concentrations are shown in Fig. 4(q) and (r), respectively.At first, the images of mice before injection were obtained by OTN-NIR (a) and MRI (k). The OTN-NIR images were obtained at 30 s after intravenous injection and at intervals of 30 s up to 300 s (Fig. 4(b–i)). A final image was taken 150 min after injection (j). MR images were acquired at 30 min after injection with an interval of 30 min, as shown in Fig. 4(l–o). The blood vessel and liver are visualised in Fig. 4(b–i). In particular, the probe travelled from the heart to the liver before being distributed throughout the body. Thereafter, the signal was observed from the hind limb, followed by the signal from the vessel system throughout the mouse body. The signal remained stable for the first 300 s after the injection. After 150 min, a majority of the signals accumulated in the liver and spleen.
The pattern distribution in the mouse body can be observed under MRI conducted from 30 min onwards. As illustrated in Fig. 4(k), the images of the liver, bladder area, and the entire mouse body before injecting the bimodal probe are dark. The signal intensity of the liver increases within 30–60 min after injection (l and m) owing to the introduction of the contrast agent consistent with the OTN-NIR images. However, signal enhancement was observed in the bladder. The whole body of the mouse showed reduced brightness at 90 min (n) onwards; and at 120 min (o) the images are equivalent dark as before injection.
The results show an inconsistency between OTN-NIR and MR images at the bladder where the OTN-NIR showed no signal, but MR images displayed a brightness. It implies that the state of the micellar probe became incohesive during circulation. The mismatch may derive from the leak of polymer chain bearing Gd-DOTA out of the structure due to the interaction with the plasma component. The thermodynamic behaviors of the micelles are changed with the residence of Gd-DOTA at the PEG end. In a complex environment such as plasma, the structures with a high number of DOTA ratios may interact with the plasma components and lead to their disruption. To clarify this issue, we further investigated the influence of Gd-DOTA ratios on the properties of imaging probes in vitro and in vivo.
Influence of Gd-DOTA specific concentration (PLP-D) on bimodal properties of the imaging probe
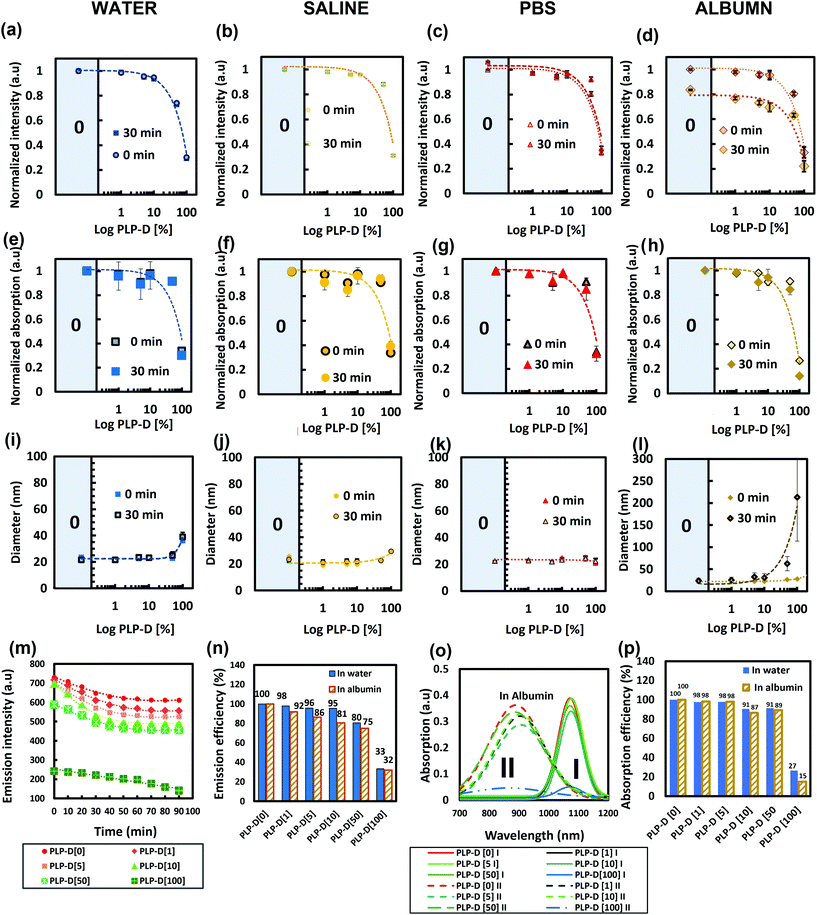
A DOTA molecule possesses triple carboxyl groups. Upon introduction on the surface of the micelles, they can cause a high density of negative charges on the surface and result in undesirable consequences. Thus, the impact of Gd-DOTA on the properties of the probe was determined by introducing various Gd-DOTA special concentrations into the structure and dispersing the probe in biological environments containing multiplex ions and proteins such as water, saline, PBS, and albumin solution (Fig. 5). The corresponding emission (a–d), absorption at 1064 nm (e–h), and size distribution (i–l) are measured. The PLP-D values used in this study were 0, 1, 5, 10, 50, and 100. The decay of the emission intensity and emission percentage at 1100 nm in albumin are shown in Fig. 5(m) and (n), respectively. The deconvolution and the comparison of the absorption intensity at 1064 nm are presented in Fig. 5(o) and (p), respectively. The emission in four media reveals that the probes emit stable signals in the water, saline, PBS, regardless of the varying PLP-D values. However, the PLP-D impact on the fluorescence quenching can be recognised when the probe is dispersed in the albumin solution. After mixing with albumin, all samples decrease their emissions. The decay rates (Fig. 5(m)) indicate that the effect of albumin on the probe emission occurs in the early stage after mixing. After 30 min, the decay rate becomes steady. Among all the ratios, samples with low PLP-D ratios ≤ [10] show a moderate reduction, while samples with the values > [10] show a steep declination. Likewise, the samples with low PLP-D values (≤[10]) preserve the emission intensity close to PLP-D [0] without the introduction of any Gd-DOTA in the structure (>95% in water and >80% in albumin) (Fig. 5(n)). Furthermore, the absorption in four media is consistent with the emission, where the lower PLP-D ratios (≤[10]) maintain their stable absorption and higher ratio (>[10]) incline to reduce the absorption. The deconvoluted absorption spectra show the contribution PLP-D ratios on the dimer and monomer distribution in the core of the imaging probe (Fig. 5(o)). Because the monomer is the main contributor to the emission, the comparison only utilized the intensity of the monomer. The results showed an agreement to the former results, i.e., the increasing PLP-D values decreased absorption. In Fig. 5(p), the monomer absorption peak at 1064 nm in the samples with PLP-D ≤ [10] remained close to PLP-D [0] (>90% in water and >85% in albumin). A similar range in DLS can be observed from Fig. 5(i–l), wherein the size distribution of all the samples was stable in water, saline, and PBS; however, only the samples with PLP-D (≤10%) were stable in albumin.Impact of differentiating Gd-DOTA special concentration and micelle number concentration on probe relaxation rate
The relaxation rates of the imaging probe with various PLP-D [1–100] values in the four media are presented in the ESI.† For the in vivo application, a low negative charge density on the surface yielded higher micelle stability. In contrast, the MRI acquisition required a certain Gd-ion concentration to be detectable. Therefore, we investigated the relaxation rate variation in varied PLP-D values in various micelle number concentrations to clarify the efficiency of micelle number concentration versus Gd-DOTA ratio in vivo. The PLP-D values used in this study were 0, 0.01, 0.05, 0.1, 0.5, 1, 5, 10, 50, and 100. The relaxation rate of the PLP-D values dispersed in water and albumin (5 mg ml−1) are presented in Fig. 6(a), and the 3D plots of PLP-D values 0.01–10 with micelle number concentrations of 1.25, 2.5, 5, and 7.5 mg ml−1 in water and mouse serum are depicted in Fig. 6(b) and (c). In water, the relaxation rate was strongly dependent on the amount of Gd-DOTA in the structure, i.e., higher PLP-D values yielded a higher relaxation rate. Samples dispersed in albumin and mouse serum exhibited relaxation rates higher than that of water. In albumin, the relaxation rates depicted a notable increase in all the samples due to the macromolecule-repressed rotating effect of Gd chelates and thus enhanced the T1 contrast effect.52 However, higher PLP-D values such as [50] and [100] show lower values than that of [5] and [10]. The discrepancy indicates that the micelle structures of higher PLP-D ratios > 10% are degraded in the presence of albumin or plasma serum. We confirmed the polymer chains leak out of the structure by using 1H NMR (data are not shown here).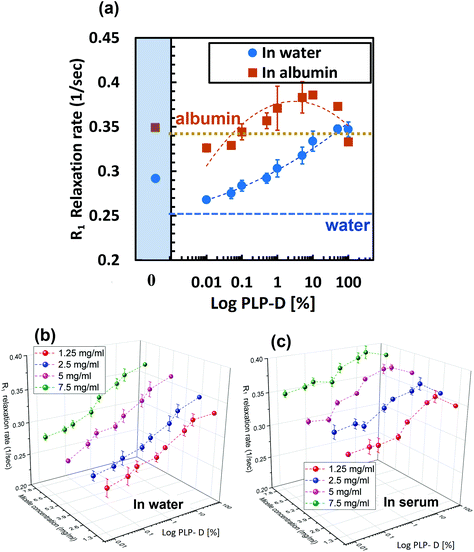 | ||
| Fig. 6 (a) R1 relaxations of PLP-D [0.01–100] in water and albumin (5 mg ml−1). R1 relaxation rates of various micelle concentrations of PLP-D [0.01–70] in water (b) and mouse serum (c). | ||
Influence of Gd-DOTA special concentration on the stability and evasion from RES recognition of in vivo imaging probe
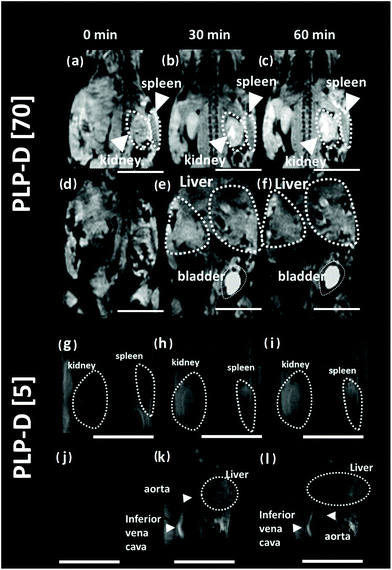
MR images of the mice were acquired before and after intravenous administration (∼260 μg g−1 body weight, micellar probe concentration in mouse blood at 2.5 mg ml−1) at 30 and 60 min. The MR images of the mice are presented in Fig. 7. In which, images (a–f) represent the experiments using PLP-D [70], and (g–l) represent the experiments using PLP-D [5]. Before the injection of PLP-D [70], the kidney and the spleen area (a), liver and bladder area (d) are dark. After injection at 30 min, the kidney, spleen area (b) shows a remarkable brightness in the kidney pelvis and in the spleen and it remains stable up to 60 min (c). Similarly, the signal in the liver and bladder area is relatively strong at 30 min (e) and 60 min (f). It indicates that a portion of the imaging probe was cleared from the liver and spleen by mononuclear phagocytes, while the other portion undergoes renal excretion. Furthermore, the abdominal region of the mouse injected with PLP-D [70] was opened to capture the OTN-NIR images of the bladder; however, no OTN-NIR signal was observed. Meanwhile, MR images of the mouse injected with PLP-D [5] are displayed in Fig. 7(g–l). The images of the kidney and spleen at 0 min (g), 30 min (h), and 60 min (i) post-injection showed no contrast enhancement effect. Whereas the signal intensity in the liver and vena cava is dark at 0 min (j) but becomes stronger at 30 min (k) and 60 min (l) post-injection. It indicates that the probe is not cleared via the kidney pathway.
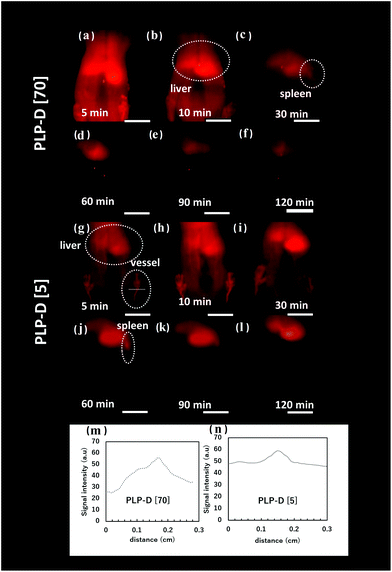
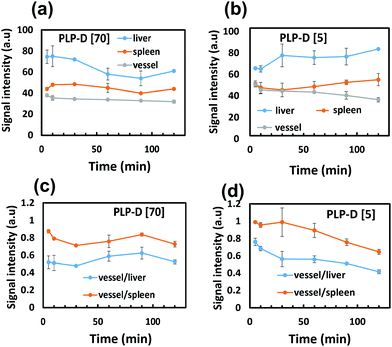
The OTN-NIR images of mice were taken at 5, 10, 30, 60, 90 and 120 min post-injection using PLP-D [70] and PLP-D [5] that are displayed in Fig. 8(a–f) and (g–l), respectively. The line profiles of the blood vessels are displayed in Fig. 8(m and n). The fluorescence intensity represented by ROIs in the liver, spleen, and blood vessels was analysed at a series of time instants. The OTN-NIR images exhibited a strong signal in the liver and blood vessels from 5–10 min in mice injected with both samples. At 30 min, the signal primarily accumulated in the liver and spleen of the mice injected with PLP-D [70]. Although the mice injected with PLP-D [5] displayed a stable signal in blood vessels. At 60 min, the signal from the blood vessel decreased, and the signal from the spleen became more apparent. From 90 min, the signal was primarily observed in the livers with both the samples.
Discussion
Probe characteristics
The probe diameter is a key pharmacokinetic factor in the circulation inside the body,53,54 as it aids the probe to escape from the RES identification, especially when the sizes are less than 100 nm. The diameter of the bimodal imaging probe is around 20 nm, which is sufficiently small to be neglected by the immune response and can enhance biodistribution and circulation.55–57Moreover, Gd-complexes modified OTN-NIR micelle surface via amide bonds to bind the –COOH terminal of the polymer and the NH2 terminal of Gd-DOTA. In particular, the Gd-DO3A is a monoamine derivative of Gd-DOTA with macrocyclic ligands, which is metabolically more stable than linear ligands and is able to bind tightly to Gd3+ ions to reduce potential toxicity issues. More importantly, the Gd-DO3A retained the amide oxygen atom and still coordinated the Gd3+ ions in the center, whereas the water exchange rate did not vary in comparison to the Gd-DOTA.58
The IR-1061, accompanied by a PLGA core, exhibited an emission peak at approximately 1100 nm, a major absorption peak at 1064 nm, and a slight shoulder at 890 nm. In particular, the absorption shoulder was broader owing to the encapsulation effects in the micelle core and was attributable to dimers or multimers in the structure or the interaction with –OH or –COOH groups at the water interface. These factors broadened the absorption shoulder to 890 nm. In the presence of Gd-DOTA, it can indirectly interact with the –COOH groups of the structure, thereby resulting in a broadened absorption shoulder at 890 nm.
OTN-NIR fluorescence and MR bimodal imaging—depicting blood circulation and localising organs
In vivo bimodal imaging was performed by one injection shot of PLP-D [70] at various time instants, depending on the merits of each technique. For instance, real-time and dynamic fluorescent imaging promptly provides mobility routes for micelles in the circulatory system after injection. In context, MRI provides the structural images of probe distribution in deep organs throughout the body. Polymeric micelles are potential candidates for use in vivo, because they exhibit small dynamic sizes that can leak to complex and small structures inside the blood contrast enhancement effect.59–61 The signal is adequately strong for localising organs such as the heart, liver, and spleen.The significant point for applying polymeric micelles as bimodal imaging probe is their stability which is governed by multiple factors such as the composition, critical micelle concentration (CMC), surface charge density, or ionic strength of the environments. When a specific ratio of PLP was replaced by PLP-D, the properties of the micelles were also affected. To minimize the effect, the mixing ratios were clarified.
Influence of Gd-DOTA special concentration on bimodal properties of the imaging probe
PLGA-PEG micelles carrying IR-1061 display stability and elongate circulation in vivo and reduced the recognition of the RES system.34 To introduce Gd-DOTA, a certain amount of neutral PLGA-PEG chains was replaced by PLGA-PEG chains bound to Gd-DOTA. As MRI is not sensitive, it often requires a high probe dose to provide contrast.36,62 However, the increase of Gd-DOTA residence on the roof of the PEG chain triggered the interaction with plasma proteins and reversed the advantages of PEG. Upon reducing the number of Gd-DOTA molecules, the interaction with albumin decreased as well. The essential tradeoff aspect for the effective doses of both techniques along with maintaining the stability of the structure, is to determine an appropriate replacement number that can maintain both the PEG impact and enhance the T1 contrast effect. In the case of introducing ratios lower than 10%, the interaction with albumin was reduced, and the optical properties were preserved. Moreover, the lower ratios were preferable for application in vivo, but the T1 contrast enhancement effect is required to be investigated for obtaining the appropriate ratios for in vivo imaging.Impact of differentiating Gd-DOTA special concentration and micelle concentration on relaxation rate of probe
The in vitro experiment demonstrated that the relaxation rates were manipulated by Gd-DOTA in water. However, in the presence of albumin, the relaxation rate represented a remarkable increase, probably caused by macromolecules repressing the rotating effect of Gd-chelates as the probe bound to albumin.52 Overall, higher PLP-D ratios (>[10]) were inclined to reduce the relaxation rate as compared to lower ratios. Presumably, higher PLP-D ratio micelles favoured an active interaction with albumin as it provided numerous binding sites on the surface. As the anionic group is extremely active toward albumin, it may detach the PLP-D out of the micelle structures and reduce the micelle aggregate number, resulting in a disrupted imaging probe. In contrast, the lower ratios (PLP-D ≤ [10%]) preserved their structural stability as well as the relaxation rates in albumin. However, the practical limitations of the low ratios used pertained to the diluted concentration of the probe in vivo.Influence of Gd-DOTA special concentration on stability and evasion from RES recognition of imaging probe in vivo
The durability of micellar structures is an essential factor because it ensures cohesive bimodal imaging. The stability of self-assembled micelles depends on intrinsic parameters such as CMC, solubility parameters, and hydrophilic–lipophilic balance (HLB), as well as the effect of the microenvironment surrounding the micelles.63–65 Any changes in the micellar composition can affect the stability of the micelle. In this work, PLGA-PEG chains are bound to Gd-DOTA molecules via a stable covalent amide bond; therefore, the residence of Gd-DOTA on the surface is significant for the probe stability. The experiments in vitro confirmed the vital role of Gd-DOTA for the probe unity, especially in the presence of plasma proteins. MR images of mice injected with high ratio PLP-D [70] and low ratio PLP-D [5] were aligned with the in vitro results. In mice injected with PLP-D [70], the MRI contrast enhancement appeared in the kidneys and bladder at 30 min post-injection and was detected in large amounts in the liver and spleen. The signals in the liver rapidly decayed after 30 min, whereas the signal in the bladder was extremely strong throughout the investigation. For the PLP-D [5], the probe resided in the vena cava (a large blood vein in the mouse body) and the liver, whereas no signal was observed in the kidneys or bladder. The biodistribution of the imaging probe as entrapment in various organs implies different clearance pathways. Generally, the kidneys and bladder are accumulation sites for structures smaller than 10 nm. Conversely, the distribution in the liver was associated with the capture by the RES of structures larger than 100 nm. The PLP-D [70] probe was eliminated by both the renal and hepatic pathways, indicating possible degradation. There is a high risk of PLP-D chains dissociating from the micelles owing to the strong interaction with the plasma proteins of PLP-D [70], and consequently excreting via the kidneys.Consistent with the MRI, the fluorescence images displayed a shorter blood residence time in mice injected with PLP-D [70] than PLP-D [5]. Within 10 min, the circulation of both probes was bright enough to depict the blood vessels. However, a large portion of PLP-D [70] accumulated in the liver and spleen after 10 min and rapidly decayed. Nonetheless, a small but stable portion can escape from the RES recognition and circulate through the blood vessels for up to 60 min prior to the entire degradation. Conversely, the relative intensity ratios between vessel/liver and spleen/liver were stable for up to 60 min, indicating that a large portion of the PLP-D [5] probe could evade RES recognition. However, the effect of RES could not be completely avoided for periods longer than 60 min.
Several studies have consistently reported that PEG-shell structures smaller than 100 nm can prolong the circulation process by suppressing protein absorption in the bloodstream and avoiding protein corona formation.19 This aids them in escaping the macrophage response in the liver and spleen.66 Moreover, the negatively charged surface of PEG reduces protein adsorption and enhances long circulation.24,67 The diameter of the proposed and developed micellar structure was approximately 20 nm, and the PEG chains were partly associated with the negative charge derived from DOTA at the end. The protein adsorption could be suppressed at the surface of micelles to prolong the circulation period. However, in the body, numerous factors can escalate protein interactions to the negative surface of micelles, including the co-adsorption by low-molecular-weight ions in the body fluids and annihilation of the electrostatic repulsion between the micelle surface and proteins.68 The location on the micelle surface allows Gd-DOTA to be directly exposed to water and maximize its relaxivity. Moreover, the remained –COOH groups on the surface of Gd-DOTA also provide binding sites to functionalize with other biomolecules for further applications in biomedical research. Therefore, the regulation of the ratio of DOTA molecules on the surface of micelles is vital for preserving the probe stability, enhancing probe evasion from the RES recognition. However, the regulation ratios should be optimized to utilise the merits of bimodal OTN-NIR and MR imaging.
Conclusions
An OTN-NIR fluorescence and MRI bimodal imaging probe with ca. 20 nm size without ceramic components was successfully prepared and applied in mouse imaging. It demonstrated well bright OTN-NIR fluorescence and MRI contrast enhancement to depict the blood circulation and to observe the organs in live mice. The probe exhibited absorption and emission in OTN-NIR and T1 contrast enhancement effect in MRI. The imaging results revealed that the Gd-DOTA introduction ratio is important to control the biological response of the probe without losing the imaging contrasts. It was found that Gd-DOTA percentage ratios/PLGA-PEG micelle between 0.5 and 10% can give sufficient MRI contrast with a reduction of the RES response.Author contributions
K. S. and D. T. K. D. devised the concept. D. T. K. D., M. U., K. O., K. N., K. O., M. K. and M. Y. carried out the experiments and analysed data. K. S. and H. F. directed the project and developed procedures. D. T. K. D., M. U. and K. O. wrote the manuscript. All authors contributed to the discussion of the project.Conflicts of interest
The authors declare no conflict of interest.Acknowledgements
This work was financially supported by the Japan Society for the Promotion of Science (JSPS) through KAKENHI (Grant numbers: 19H01179 and 21K15577), the Japan Science and Technology Agency (JST) through the Center of Innovation (COI) Program: Center of Open Innovation Network for Smart Health (COINS; Grant number: JPMJCE1305), and the National Cancer Center through Research and Development Fund (Grant number: 31-A-11) and Superhuman Medical Care Project. We thank Dr Syuuhei Komatsu from Tokyo University of Science for NMR measurements.References
- T. K. D. Doan, in Transparency in Biology: Making the Invisible Visible, ed. K. Soga, M. Umezawa and K. Okubo, Springer Singapore, Singapore, 2021, ch. 11, pp. 223–263 Search PubMed.
- T. K. D. Doan, M. Umezawa, K. Nigoghossian, G. Yeroslavsky, K. Okubo, M. Kamimura, M. Yamaguchi, H. Fujii and K. Soga, J. Photopolym. Sci. Technol., 2020, 33, 117–122 CrossRef.
- S. R. Cherry, Semin. Nucl. Med., 2009, 39, 348–353 CrossRef PubMed.
- L. Cheng, K. Yang, Y. Li, X. Zeng, M. Shao, S. T. Lee and Z. Liu, Biomaterials, 2012, 33, 2215–2222 CrossRef CAS PubMed.
- F. Chao, Y. Shen, H. Zhang and M. Tian, BioMed. Res. Int., 2013, 2013, 849819 Search PubMed.
- J. Key and J. F. Leary, Int. J. Nanomed., 2014, 9, 711–726 Search PubMed.
- B. Du, X. Cao, F. Zhao, X. Su, Y. Wang, X. Yan, S. Jia, J. Zhou and H. Yao, J. Mater. Chem. B, 2016, 4, 2038–2050 RSC.
- X. Li, X. N. Zhang, X. D. Li and J. Chang, Cancer Biol. Med., 2016, 13, 339–348 CAS.
- J. Zheng, N. Muhanna, R. De Souza, H. Wada, H. Chan, M. K. Akens, T. Anayama, K. Yasufuku, S. Serra, J. Irish, C. Allen and D. Jaffray, Biomaterials, 2015, 67, 160–168 CrossRef CAS PubMed.
- C. Zeng, W. Shang, K. Wang, C. Chi, X. Jia, C. Fang, D. Yang, J. Ye, C. Fang and J. Tian, Sci. Rep., 2016, 6, 21959 CrossRef CAS PubMed.
- R. Yan, Y. Hu, F. Liu, S. Wei, D. Fang, A. J. Shuhendler, H. Liu, H. Y. Chen and D. Ye, J. Am. Chem. Soc., 2019, 141, 10331–10341 CrossRef CAS PubMed.
- K. Okubo, R. Takeda, S. Murayama, M. Umezawa, M. Kamimura, K. Osada, I. Aoki and K. Soga, Sci. Technol. Adv. Mater., 2021, 22, 160–172 CrossRef PubMed.
- J. J. Ma, M. X. Yu, Z. Zhang, W. G. Cai, Z. L. Zhang, H. L. Zhu, Q. Y. Cheng, Z. Q. Tian and D. W. Pang, Nanoscale, 2018, 10, 10699–10704 RSC.
- Q. Fu, Z. Li, J. Ye, Z. Li, F. Fu, S. L. Lin, C. A. Chang, H. Yang and J. Song, Theranostics, 2020, 10, 4997–5010 CrossRef CAS PubMed.
- Z. Zhou, Y. Sun, J. Shen, J. Wei, C. Yu, B. Kong, W. Liu, H. Yang, S. Yang and W. Wang, Biomaterials, 2014, 35, 7470–7478 CrossRef CAS PubMed.
- H. Zhou, H. Yang, L. Tang, Y. Wang, Y. Li, N. Liu, X. Zeng, Y. Yan, J. Wu, S. Chen, L. Xiao, Y. Yu, Z. Deng, H. Deng, X. Hong and Y. Xiao, J. Mater. Chem. C, 2019, 7, 9448–9454 RSC.
- T. K. D. Doan, S. Fukushima, T. Furukawa, H. Niioka, T. Sannomiya, K. Kobayashi, H. Yukawa, Y. Baba, M. Hashimoto and J. Miyake, Nanomaterials, 2016, 6, 163 CrossRef PubMed.
- F. Li, T. Li, D. Zhi, P. Xu, W. Wang, Y. Hu, Y. Zhang, S. Wang, J. Matula Thomas, J. Beauchamp Norman, W. Ding, L. Yan and B. Qiu, Biomaterials, 2020, 256, 120219 CrossRef CAS PubMed.
- C. Li, L. Cao, Y. Zhang, P. Yi, M. Wang, B. Tan, Z. Deng, D. Wu and Q. Wang, Small, 2015, 11, 4517–4525 CrossRef CAS PubMed.
- V. G. Demillo, M. Liao, X. Zhu, D. Redelman, N. G. Publicover and K. W. Hunter, Colloids Surf., A, 2015, 464, 134–142 CrossRef CAS PubMed.
- V. G. Demillo and X. Zhu, J. Mater. Chem. B, 2015, 3, 8328–8336 RSC.
- J. Liu, Z. Xiong, J. Zhang, C. Peng, B. Klajnert-Maculewicz, M. Shen and X. Shi, ACS Appl. Mater. Interfaces, 2019, 11, 15212–15221 CrossRef CAS PubMed.
- M. Lundqvist, J. Stigler, G. Elia, I. Lynch, T. Cedervall and K. A. Dawson, Proc. Natl. Acad. Sci. U. S. A., 2008, 105, 14265–14270 CrossRef CAS PubMed.
- A. Albanese, P. S. Tang and W. C. Chan, Annu. Rev. Biomed. Eng., 2012, 14, 1–16 CrossRef CAS PubMed.
- I. Alberg, S. Kramer, M. Schinnerer, Q. Hu, C. Seidl, C. Leps, N. Drude, D. Mockel, C. Rijcken, T. Lammers, M. Diken, M. Maskos, S. Morsbach, K. Landfester, S. Tenzer, M. Barz and R. Zentel, Small, 2020, 16, e1907574 CrossRef PubMed.
- W. Richtering, I. Alberg and R. Zentel, Small, 2020, 16, e2002162 CrossRef PubMed.
- R. Gref, M. Lück, P. Quellec, M. Marchand, E. Dellacherie, S. Harnisch, T. Blunk and R. H. Müller, Colloids Surf., B, 2000, 18, 301–313 CrossRef CAS PubMed.
- K. Partikel, R. Korte, N. C. Stein, D. Mulac, F. C. Herrmann, H. U. Humpf and K. Langer, Eur. J. Pharm. Biopharm., 2019, 141, 70–80 CrossRef CAS PubMed.
- M. Longmire, P. L. Choyke and H. Kobayashi, Nanomedicine, 2008, 3, 703–717 CrossRef CAS PubMed.
- S. R. Sheth and D. Leckband, Proc. Natl. Acad. Sci. U. S. A., 1997, 94, 8399–8404 CrossRef CAS PubMed.
- J. S. Suk, Q. Xu, N. Kim, J. Hanes and L. M. Ensign, Adv. Drug Delivery Rev., 2016, 99, 28–51 CrossRef CAS PubMed.
- Y. Lu, E. Zhang, J. Yang and Z. Cao, Nano Res., 2018, 11, 4985–4998 CrossRef PubMed.
- M. Kamimura, S. Takahiro, M. Yoshida, Y. Hashimoto, R. Fukushima and K. Soga, Polym. J., 2017, 49, 799–803 CrossRef CAS.
- Y. Ueya, M. Umezawa, Y. Kobayashi, H. Kobayashi, K. Ichihashi, T. Matsuda, E. Takamoto, M. Kamimura and K. Soga, ACS Nanosci. Au, 2021, 1, 61–68 CrossRef CAS.
- A. Louie, Chem. Rev., 2010, 110, 3146–3195 CrossRef CAS PubMed.
- V. S. Harrison, C. E. Carney, K. W. MacRenaris, E. A. Waters and T. J. Meade, J. Am. Chem. Soc., 2015, 137, 9108–9116 CrossRef CAS PubMed.
- B. P. Burke, C. Cawthorne and S. J. Archibald, Philos. Trans. R. Soc., A, 2017, 375, 2017021 CrossRef PubMed.
- F. Gu, R. Langer and O. C. Farokhzad, Methods Mol. Biol., 2009, 544, 589–598 CrossRef CAS PubMed.
- H. K. Makadia and S. J. Siegel, Polymers, 2011, 3, 1377–1397 CrossRef CAS PubMed.
- M. Mitsuda, M. Yamaguchi, T. Furuta, A. Nabetani, A. Hirayama, A. Nozaki, M. Niitsu and H. Fujii, Magn. Reson. Med. Sci., 2011, 10, 229–237 CrossRef PubMed.
- C. W. Liu and W. J. Lin, Int. J. Nanomed., 2012, 7, 4749–4767 CAS.
- A. Fontes, S. Karimi, L. Helm, P. M. Ferreira and J. P. André, Eur. J. Inorg. Chem., 2015, 2015, 4798–4809 CrossRef CAS.
- D. Häussinger, J. Huang and S. Grzesiek, J. Am. Chem. Soc., 2009, 131(41), 14761–14767 CrossRef PubMed.
- C. Diaferia, F. A. Mercurio, C. Giannini, T. Sibillano, G. Morelli, M. Leone and A. Accardo, Sci. Rep., 2016, 6, 26638 CrossRef CAS PubMed.
- E. Boros, S. Karimi, N. Kenton, L. Helm and P. Caravan, Inorg. Chem., 2014, 53, 6985–6994 CrossRef CAS PubMed.
- M. J. Fisher, D. J. Williamson, G. M. Burslem, J. P. Plante, I. W. Manfield, C. Tiede, J. R. Ault, P. G. Stockley, S. Plein, A. Maqbool, D. C. Tomlinson, R. Foster, S. L. Warriner and R. S. Bon, RSC Adv., 2015, 5, 96194–96200 RSC.
- M. Grogna, R. Cloots, A. Luxen, C. Jérôme, J.-F. Desreux and C. Detrembleur, J. Mater. Chem., 2011, 21, 12917 RSC.
- N. Kamaly, G. Fredman, M. Subramanian, S. Gadde, A. Pesic, L. Cheung, Z. A. Fayad, R. Langer, I. Tabas and O. Cameron Farokhzad, Proc. Natl. Acad. Sci. U. S. A., 2013, 110, 6506–6511 CrossRef CAS PubMed.
- A. Singh, N. Thotakura, B. Singh, S. Lohan, P. Negi, D. Chitkara and K. Raza, AAPS PharmSciTech, 2019, 20, 220 CrossRef CAS PubMed.
- M. Hadjidemetriou, S. McAdam, G. Garner, C. Thackeray, D. Knight, D. Smith, Z. Al-Ahmady, M. Mazza, J. Rogan, A. Clamp and K. Kostarelos, Adv. Mater., 2019, 31, e1803335 CrossRef PubMed.
- S. D. Li and L. Huang, Biochim. Biophys. Acta, 2009, 1788, 2259–2266 CrossRef CAS PubMed.
- Y. Song, Y. J. Kang, H. Jung, H. Kim, S. Kang and H. Cho, Sci. Rep., 2015, 5, 15656 CrossRef CAS PubMed.
- X. Liu, N. Huang, H. Li, Q. Jin and J. Ji, Langmuir, 2013, 29, 9138–9148 CrossRef CAS PubMed.
- D. Kryza, J. Taleb, M. Janier, L. Marmuse, I. Miladi, P. Bonazza, C. Louis, P. Perriat, S. Roux, O. Tillement and C. Billotey, Bioconjugate Chem., 2011, 22, 1145–1152 CrossRef CAS PubMed.
- M. Yasunaga, S. Manabe, A. Tsuji, M. Furuta, K. Ogata, Y. Koga, T. Saga and Y. Matsumura, Bioengineering, 2017, 4, 78 CrossRef PubMed.
- W. Xiao and H. Gao, Int. J. Pharm., 2018, 552, 328–339 CrossRef CAS PubMed.
- L. Shang, K. Nienhaus and G. U. Nienhaus, J. Nanobiotechnol., 2014, 12, 5 CrossRef PubMed.
- L. Granato, L. Vander Elst, C. Henoumont, R. N. Muller and S. Laurent, Chem. Biodivers., 2018, 15, e1700487 CrossRef PubMed.
- S. M. Moghimi, A. C. Hunter and J. C. Murray, Pharmacol. Rev., 2001, 53, 283–318 CAS.
- G. S. Kwon and T. Okano, Adv. Drug Delivery Rev., 1996, 21, 107–116 CrossRef CAS.
- Z. Ahmad, A. Shah, M. Siddiq and H. B. Kraatz, RSC Adv., 2014, 4, 17028–17038 RSC.
- J. Zhao, J. Chen, S. Ma, Q. Liu, L. Huang, X. Chen, K. Lou and W. Wang, Acta Pharm. Sin. B, 2018, 8, 320–338 CrossRef PubMed.
- S. C. Owen, D. P. Y. Chan and M. S. Shoichet, Nano Today, 2012, 7, 53–65 CrossRef CAS.
- M. Ghezzi, S. Pescina, C. Padula, P. Santi, E. Del Favero, L. Cantù and S. Nicoli, J. Controlled Release, 2021, 332, 312–336 CrossRef CAS PubMed.
- Y. H. A. Hussein and M. Youssry, Materials, 2018, 11, 688 CrossRef PubMed.
- F. Alexis, E. Pridgen, L. K. Molnar and O. C. Farokhzad, Mol. Pharm., 2008, 5, 505–515 CrossRef CAS PubMed.
- Y. Yamamoto, Y. Nagasaki, Y. Kato, Y. Sugiyama and K. Kataoka, J. Controlled Release, 2001, 77, 27–38 CrossRef CAS PubMed.
- W. Norde and J. Lyklema, J. Biomater. Sci., Polym. Ed., 1991, 2, 183–202 CrossRef CAS PubMed.
Footnote |
| † Electronic supplementary information (ESI) available. See DOI: 10.1039/d1bm01574e |
| This journal is © The Royal Society of Chemistry 2022 |

