
 Open Access Article
 This Open Access Article is licensed under a
 Creative Commons Attribution 3.0 Unported Licence
A ratiometric, fluorometric approach for surface charge mapping of biosilica features†
Mithun
Parambath‡
,
Aneeqa
Fayyaz‡
,
Igor
Efimov
,
Quentin S.
Hanley
and
Carole C.
Perry
 *
*
Interdisciplinary Biomedical Research Centre, School of Science and Technology, Nottingham Trent University, Nottingham, NG11 8NS, UK. E-mail: carole.perry@ntu.ac.uk
First published on 4th November 2022
Abstract
We describe a surface charge imaging method for heterogeneous biosilicas based on relationships between zeta (ζ) potential, feature size of nanoparticles, and PDMPO fluorescence and apply it to silicified structures from plants and diatoms. The methodology provides the first opportunity to map the surface charge of large heterogeneous biosilica materials and indicates that local surface charge is related to morphology below the diffraction limit (ca. 20–130 nm) with sharper features showing less negative zeta potential equivalent surface charge suggesting that the zeta potential of silica structures can be adjusted by engineering surface morphology. We show that the approach can be used to study living silicified biological tissues without recourse to sectioning and fixation. Further, the approach could be used for the study of other metal oxides possessing hydroxylated moieties. The method has potential to open up opportunities for the engineering of materials with defined charge characteristics for the solution of biomedical engineering problems including materials for tissue replacement.
1. Introduction
Surface charge estimation on silica surfaces is crucial in nanotechnology applications such as monitoring DNA hybridization,1 protein transport,2 drug delivery,3 cellular uptake,3 and microchip sensors.4 Surface charge is critical in biosilicification and an accurate measurement of local charge would be an enabling technology for probing the mechanisms of silica formation in vivo. Maintenance of surface charge is fundamental in silica deposition,5 silica condensation,6 adsorption of solutes7,8 and adaptive response to environmental pH variation.8 The quantification of in vivo and in vitro surface charge density on silica is not easy, however, if properly done can be extremely useful in understanding biosilicification and nanoscale processes at the silica–water interface. Surface charge density is altered by surface area,9 pH,10 ionic strength11 and the presence of counter ions.12 For all these reasons, surface charge determination must be consistent to ensure reproducibility and reliability.Existing techniques for the measurement of surface charge at the solid–liquid interface include Kelvin Probe Force Microscopy,13 Atomic Force Microscopy (AFM) using colloidal probes14 and zeta potential measurements.15 In recent years the AFM approach has been developed to explore spatial distributions of surface charge density on mixed phase minerals16 and more recently on different crystal faces of the same nanomaterial.17 There have been considerable advances in the application of electrochemistry at the nanoscale to the study of cellular systems and materials18 including the development of scanning electrochemical microscopy (SECM) in conjunction with nanometer-sized electrodes.19 Recent advances in light addressable potentiometric sensors (LAPS) are able to map surface charge on cells on the side adjacent to an electrode20,21 Although non-linear optical methods have been developed to study localised water at interfaces22 to the best of our knowledge, no optical technique to measure surface charge on mineral structures embedded in biological materials is available. Where such a technique would be useful is in the study of biological silicification where many structural particulate arrangements at the nanoscale exist within a single microscopic sample.23,24 Although hydration levels (as a proxy for surface silanol content on silicas) can be probed using a hydroxyl responsive chemical marker in the analytical transmission electron microscope,25 it is not possible to identify individual structures in heterogeneous samples as are regularly found for living or fixed biological samples.
The fluorescent probe PDMPO (2-(4-pyridyl)-5((4-(2dimethylaminoethylaminocarbamoyl) methoxy)phenyl)oxazole) exhibits unique silicaphilic fluorescence.26 We have previously shown that when bound to silica, PDMPO resides within the Stern layer which affects the dye's excited state behaviour and chromaticity.27 While recent work has challenged the view that PMDPO has a unique Si specific fluorescence based on solution studies,28 the behaviour of PMDPO on the surface of solid phase silica remains a useful probe. Here, we demonstrate a new surface charge imaging method using the relationship between zeta (ζ) potential, feature size of nanoparticles, and PDMPO fluorescence. Following calibration with Stöber silica particles (22–133 nm), we demonstrate confocal local surface charge imaging of biosilica features below the diffraction limit using spectroscopic and ratiometric approaches applied to composite mixed silica structures produced by silicifying plants and diatoms.
2. Materials and experimental methods
2.1 Materials
PDMPO (LysoSensor™ yellow/blue DND-160), 1 mM in dimethylsulfoxide was obtained from Life Technologies. Chemicals for preparation of citrate and phosphate buffers, ammonia solutions, tetraethoxysilane (TEOS), HPLC grade water, concentrated nitric acid, concentrated sulfuric acid and guanidine hydrochloride (GHCl) were obtained from Sigma Aldrich. Plant material, Equisetum arvense, was collected locally and a dry powder sample of the Antarctic diatom, Nitzschia stellata, a present from Dr Mark Hildebrand, Scripps Institute of Oceanography had originally been collected by Dr Joyce C. Lewin. Living diatoms: freshwater species were obtained from the balance pond on the Clifton Campus at Nottingham Trent University and saltwater species were obtained from https://www.ccap.ac.uk/ with culture cultivation as per CCAP guidelines.2.2 Silica PDMPO morphology dependent interaction
Silica nanoparticles (SNPs) were prepared using a modified Stöber process7 as a model of morphology. These particles systematically vary surface curvature which can be used as an index of local surface curvature/sharpness. Silica nanoparticles with diameters of 22 (21.6 ± 0.4) nm, 32 (32.1 ± 0.4) nm, 56 (56 ± 4) nm, 77 (76.6 ± 0.7) nm and 133 (132.7 ± 1.3) nm based on the average of 5 dynamic light scattering measurements and further characterised for zeta potential (MALVERN Nano-S Zetasizer at 25 °C) were used to study the behaviour of PDMPO emission via fluorescence spectroscopy.2.3 Fluorescence spectroscopy on silica nanoparticles
Fluorescence measurements on the silica nanoparticles were carried out in 96-well plates (Nunc Optical bottom plates; 164![[thin space (1/6-em)]](https://www.rsc.org/images/entities/char_2009.gif) 588) using a commercial microplate reader (M200 pro; Tecan) with excitation at 360 nm which is near the isosbestic point for excitation of the PDMPOH22+ and PDMPOH+ forms of the dye.27 Emission data was collected from 400–650 nm. Additional spectroscopic data were collected at 405 nm excitation to match the excitation wavelength used in the Confocal Scanning Laser Microscope, CSLM.
588) using a commercial microplate reader (M200 pro; Tecan) with excitation at 360 nm which is near the isosbestic point for excitation of the PDMPOH22+ and PDMPOH+ forms of the dye.27 Emission data was collected from 400–650 nm. Additional spectroscopic data were collected at 405 nm excitation to match the excitation wavelength used in the Confocal Scanning Laser Microscope, CSLM.
2.4 Surface charge measurement and imaging
Confocal measurements and imaging were made in an inverted geometry (Leica TCS SP5 II) with 405 nm excitation. The maximum intensity along the z-axis was found and subsequently used for wavelength scans. Confocal images were collected with either 63× NA 0.7 or 20× NA 0.5 air objectives (HCX PL FLUOTAR; Leica) and a 63 μm pinhole. Two modes of acquisition were used for assessment of local surface charge: (a) a point-by-point procedure in which the spectrum from an xy-position was measured and the relative amounts of PDMPOH22+ and PDMPOH+ estimated by fitting the spectrum27 and (b) whole image monitoring of images at 460–470 nm and 500–510 nm (collected with a 10 nm bandwidth for PDMPOH+ and PDMPOH22+ respectively) followed by ratiometric processing. For the latter, 16-bit 8192 × 8192 images were collected then binned to 4096 × 4096, despeckled, filtered (4 × 4 Gaussian blur), divided (500–510 nm/460–470 nm) and transformed into local surface charge units using the calibration from SNPs. The ratiometric processing of the images was obtained using ImageJ v1.50c. Some images presented in the paper and the ESI† have had their brightness enhanced in order to help readers visualise the silicified objects. Sample morphology was confirmed by scanning electron microscopy (SEM) (JEOL JSM-840A, 20 kV) wherever possible.:1 mixture (v/v) of concentrated nitric and sulphuric acid. The samples were heated at 100 °C for >24 h, washed to remove acid and freeze dried. For imaging, samples with a nominal concentration of 1 mg mL−1 were treated with PDMPO (1.0 μM) in 0.1 M Phosphate Buffer (pH 7.1). CSLM measurements were made following incubation with shaking (60 min, 10 RPM, 25 °C). Variation between measurements made using the single point spectroscopic method were t-tested for significance.
Preparation of the plant material used two approaches. Living samples of immature Equisetum arvense branches (ca. 3 mm diameter) were cut and immediately submerged in an aqueous solution of 0.5 μM PDMPO for up to 24 hours at room temperature, with the effect of time in contact with PDMPO being presented in the ESI.† Greyscale and bright field images were captured on the sample lying perpendicular to the optical axis with the data treated as described in section 2.4. The potential of chlorophyll fluorescence to interfere with the surface charge mapping approach using PDMPO was checked. Experimental details and results are provided in the ESI.† To explore the ability of PDMPO to be taken up into living plant material in situ, Equisetum arvense plants raised in the laboratory were watered with 0.5 μM PDMPO for several weeks during the time when fertile spore heads were developing. Mature spores were isolated by tapping the spore head onto a microscope slide.
Examples of both fresh water and salt-water diatoms were treated with PDMPO to give a final concentration of 0.5 μM and incubated for up to 72 hours at RT before a drop of liquid containing diatoms was dropped onto a microscope slide.
3. Results and discussion
3.1 Size dependent silica PDMPO interaction for particles
To study the effect of surface acidity on interaction between PDMPO and silica particles, a set of pristine silica spheres ranging between 22 and 133 nm diameter were used for investigations. Initial interaction studies were conducted in the microplate reader at a single pH (7.08) where strong fluorescence emission from PDMPOH22+ was typically observed. Silica particle size can significantly affect the surface acidity of particles greater than ca. 10 nm29 as shown here by increased negative zeta potential values as particle size increased from 22 nm up to 133 nm, ESI Fig. S1.† This size dependent behaviour was matched by an increase in PDMPO emission ratio (PDMPOH22+/PDMPOH+), Fig. 1. Since zeta potential is an indicator of surface acidity which changes with particle size, these results, Fig. 1, suggested PDMPO could be used to study the surface charge by fixing pH and monitoring the dyes’ fluorescence emission behaviour.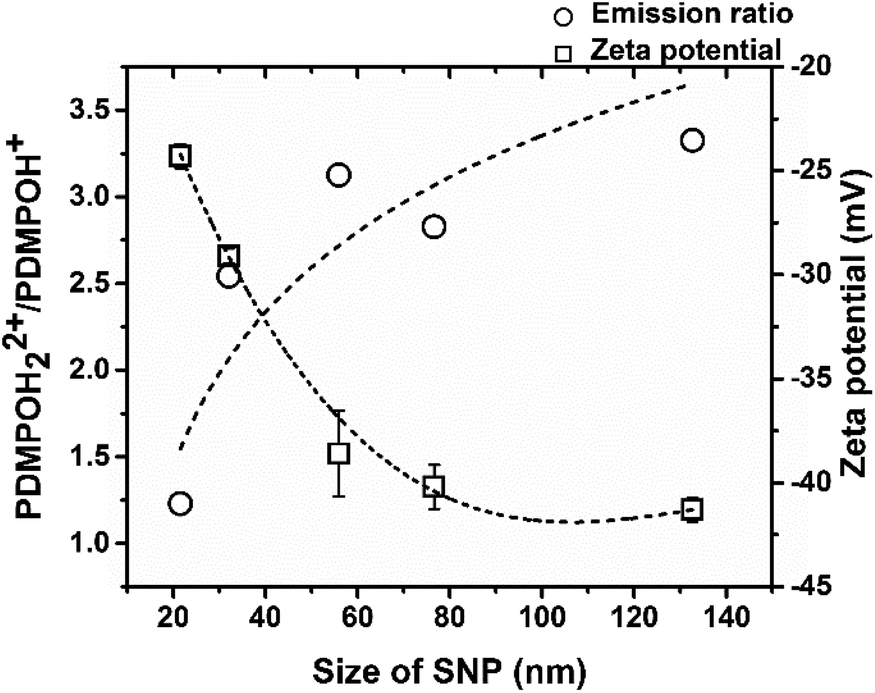 | ||
| Fig. 1 Relationship between PDMPO emission ratio and SNP size for silica particles measured in a microplate reader. Fluorescence emission ratio is plotted against zeta potential and particle size. The lines shown are to guide the eye only. | ||
3.2 Calibration for charge mapping using silica nanoparticles – zeta potential prediction
To create a new imaging method for surface charge on silica, two further demonstrations were required: (i) the behaviour of PDMPO had to be confirmed in a microscope using the available 405 nm excitation; and (ii) the response from PDMPO had to be proven to be from surface charge and not from other size related characteristics.Confocal spectral data were collected from xy-points corresponding to particle locations at the position of maximum intensity along the z-axis. The spectra were decomposed by least squares minimisation25 into components corresponding to PDMPOH22+ and PDMPOH+ (Fig. S2†). Emission ratios were compared with zeta potential values, Fig. 2a, confirming the size dependent effects seen in solution (Fig. 1) and that the measurements can be done in a confocal imaging arrangement.
 | ||
| Fig. 2 Confocal imaging of silica nanoparticles excited at 405 nm in the presence and absence of GHCl (a–c) and ‘Master’ zeta potential vs. pH plot (d). (a) Comparative plot of emission ratios and zeta potential values of a range of SNPs at fixed pH (7.0) (b) fluorescence emission ratio on Silica nanoparticles (132.7 nm) upon charge neutralization using GHCl. (c) Fluorescence emission ratio (PDMPOH22+/PDMPOH+) plotted against zeta potential combining values from a and b. (d) ζ/logd variation with pH for silica particle sizes from ca. 22–133 nm diameter. The dotted lines in a and b are to guide the eye only. The solid line in c is a linear fit with coefficients presented in eqn (1). | ||
To demonstrate the behaviour of PDMPO was due to changes in surface charge and not other size related effects, charge neutralization experiments were carried out using a single size of SNPs (132.7 nm) and a chaotropic agent, guanidine hydrochloride (GHCl). By adjusting the GHCl concentration, surface charge neutralisation occurs resulting in changes in zeta potential that are independent of SNP diameter. Confocal fluorescence emission data revealed a GHCl concentration dependent shift in the ratio PDMPOH22+/PDMPOH+ (ESI Fig. S3†) which was complemented by an increase of zeta potential (−35 ± 1.3 mV to 19 ± 1.2 mV), Fig. 2b. Charge neutrality on silica surfaces is known to occur with increased cation concentrations11 and these results demonstrated the PDMPOH22+/PDMPOH+ ratio tracked surface charge independent of size and morphology and that this relationship can be calibrated to measure local surface charge, Fig. 2c.
The logarithm of [PDMPOH22+]/[PDMPOH+] followed an approximately linear relationship with zeta potential (Fig. 2c) providing an empirical method for estimating an effective ζ from image data.
 | (1) |
This can be understood by noting the protonation equilibrium PDMPOH+ + H+ = PDMPOH22+ is related to the potential E on the surface where the fluorophore is adsorbed.
 | (2) |
Here, aH+ is the activity of protons and 2.3RT/F ≈ 60 mV at room temperature. The experimentally accessed zeta potential ζ is measured at the slip-plane. We can consider two boundary conditions: (i) if the slip-plane coincides with the surface of the particle, then δζ = δE and (ii) if the slip plane is infinitely remote from the surface, δζ = 0. Between these two boundaries, δζ is a fraction 0 < α < 1 of the actual surface potential in eqn (2) which is constant to a first approximation with a particular value α = 0.36 (21.3/60 = 0.36). Upon integration one obtains:
 | (3) |
The significance of eqn (3) is that it provides a theoretical basis for the proposed method which is realised empirically in eqn (1). Usually, zeta potential is expressed through bulk concentrations of absorbing charged species. However, since their surface concentration is not known, only model based assumptions are possible. For strong electric fields where this is the Stern layer, any model approximations fail and there is typically limited agreement with experiment. In the proposed method, the ratio of concentrations of adsorbed species is accessed directly, without any model assumptions.
Data in Fig. 2a–c are for single fixed pH. Analysis of the pH dependence of ζ for particles of various sizes (Fig. S1†) revealed that ζ vs. pH plots collapse on to one master curve at various ionic strengths, I, for normalized zeta potential ζ/pI, where pI = −logI.30 From solution of the exact nonlinear equation for potential distribution, it can be shown that zeta potential at ζ ≫ kT depends on the Debye length λD, and the concentration of counter ions c, with charges ze mainly as ζ ∼ logλD ∼ log(cz2). Therefore, normalization of ζ by log(cz2) eliminates concentration dependence.
For particles of different size d, the only other length scale in the system is λD. Thus from dimension considerations, zeta potential should re-scale as ζ ∼ log(λD/d), with normalized curves ζ/log(d) expected to collapse onto one master curve as a function of pH. This is observed if data in Fig. S1† are re-plotted in a normalized version, Fig. 2d. Thus, scaling dependence ζ/log(d) allows extension of the method to different pH values, making our approach very widely applicable for a wide range of environmental conditions. In the current situation the pH of the plant cell wall is ca. pH 7 so we can compare different sizes of structures in the same local environment. We note that the analytical approach presented does not theoretically address the potential for charge accumulation around curved features which can distort the direct relationship between surface charge density and potential.31 The potentials we report are according to the experimental data collected as inferred in the situation where the surface is behaving as a simple object of constant curvature and are termed ‘effective’ zeta potentials, up to the level of accuracy introduced by the complex surface geometry present.
3.3 Charge estimation on silica using fluorescence emission ratio single position method
Confocal spectral imaging has the capability to create a complete fluorescence emission spectrum of a specimen at any pixel location. When combined with the linear correlation between zeta potential and PDMPO emission ratio, Fig. 2c, this allowed us to estimate the surface charge on the individual biosilica nanostructures found in nature. This approach was used to measure local surface charge in silicified material from a heavily silicified primitive plant, Equisetum arvense, and an Antarctic diatom, Nitzschia stellata, Fig. 3 and ESI Fig. S4 and S5.† All fluorescence data is complemented by representative surface morphological data collected by scanning electron microscopy.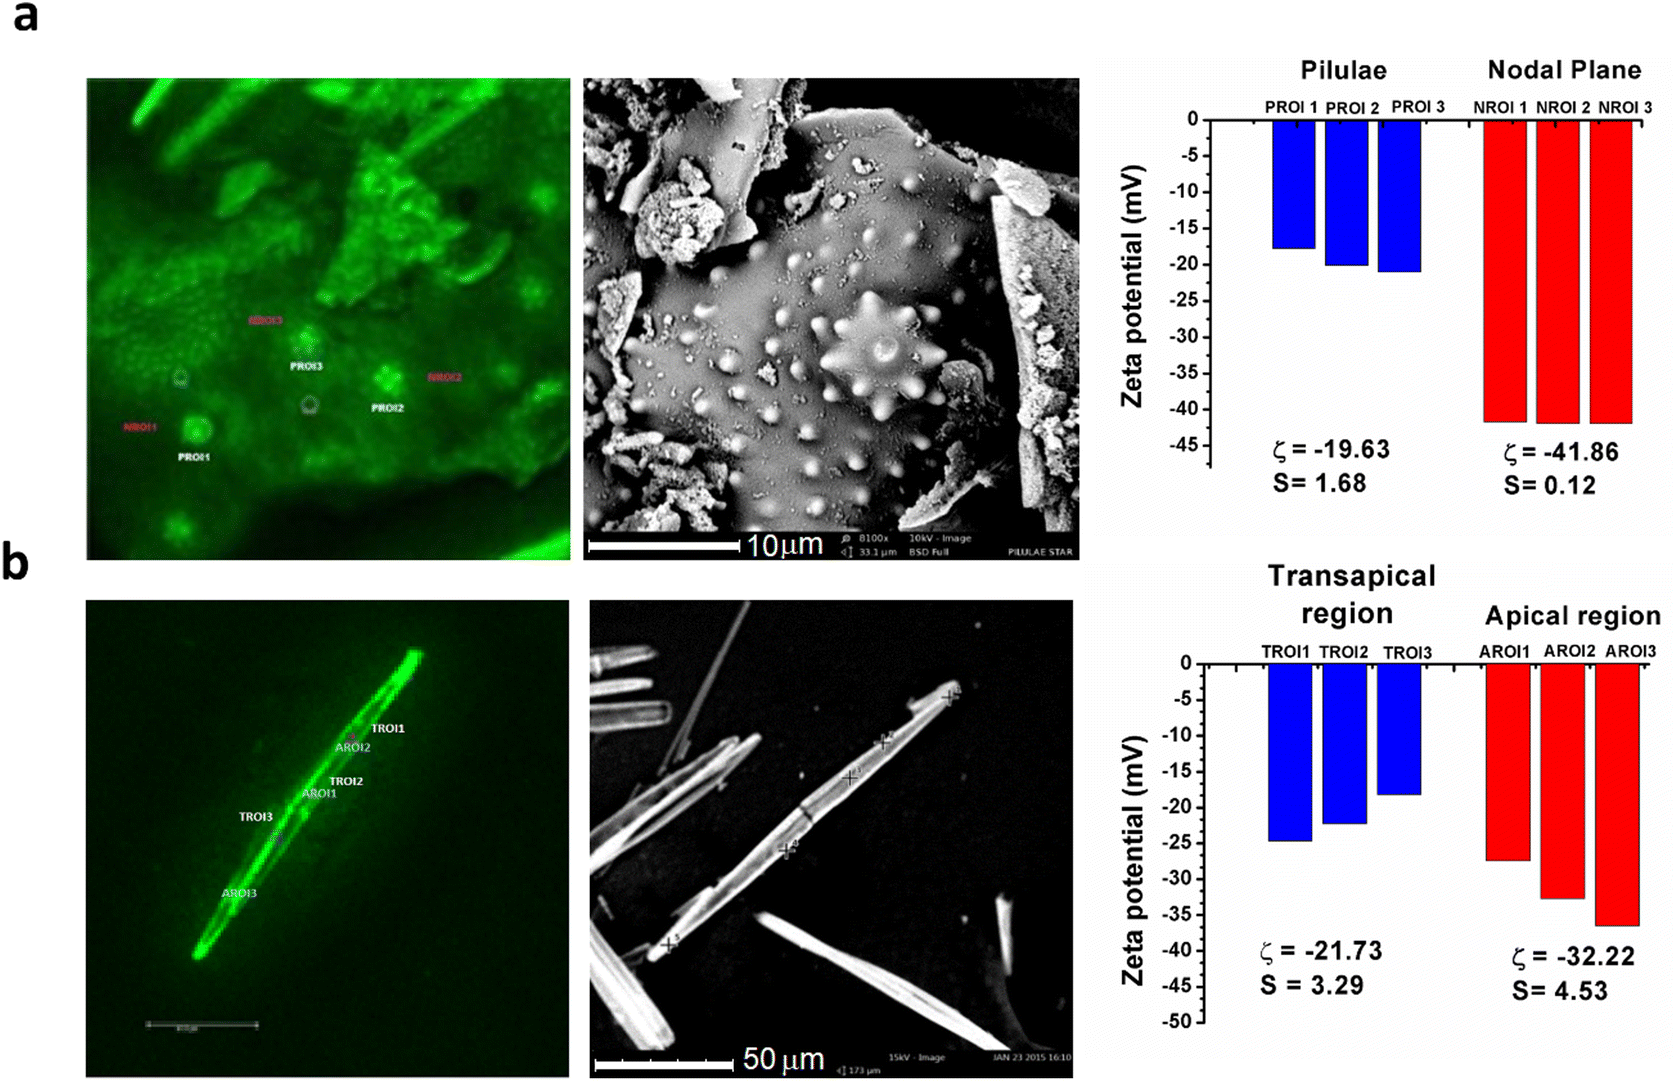 | ||
| Fig. 3 Charge estimation on different silicified parts of an Equisetum arvense plant and Nitzschia stellata diatom: left panel confocal image, middle panel SEM image, of regions chosen to illustrate the types of structures that could be present but are not images of the same area studied by confocal imaging, and right panel charge of the different regions estimated using data from Fig. 2c. (a) Star-shaped rosettes and nodal planes containing arrays of single pilulae on the branches of Equisetum arvense, (b) apical and trans apical axis of the Antarctic diatom, Nitzschia stellata. The two tailed p-value for (a) is 0.0019 and for (b) 0.0316 suggesting statistical significance for both biological samples. The positions used for analysis are marked on the left-hand images with annotation that relates to the charge data presented in the right hand plots. | ||
As an example of the approach, we compared the local surface charge found at the locations of three star shaped pilulae to three locations in the nodal plane covered by a random array of pilulae of Equisetum arvense, Fig. 3a and S4.†23 Inspection of the spectra found that both the objects analysed in the nodal plane and the star shaped clusters were dominated by PDMPOH22+ compared to PDMPOH+; however, the emission ratio indicated significant (p = 0.0019) differences in local surface charge (−20 mV and −42 mV, for the star shaped pilulae and objects in the nodal plane, respectively), Fig. 3a suggesting differences in the local biochemical and/or aqueous environment during the biosilicification process.23 Similar data were collected from the apical and transapical axes of Nitzschia stellata, Fig. 3b and S5.† Local surface charge measurements yielded significant (p = 0.0316) variation between the apical (−32 mV) and transapical (−22 mV) axes of Nitzschia stellata, again suggesting local differences on the micron length scale in the mineralisation environment, in this case the silica deposition vesicle (SDV), during biosilicification.32
3.4 Charge mapping on biogenic silica
The point-by-point decomposition procedure was effective for specific regions of interest but is cumbersome for larger scale surface charge mapping. To perform whole field charge mapping, we used two images collected at different wavelengths to compute a ratio which was converted to local surface charge. The method was applied to the basal portion of the branch of a silicified plant, Equisetum arvense, exhibiting stomata, Fig. 4. The estimated surface charge data shows that the silica structures delineating the stomata have a higher effective zeta potential, −28 mV compared with adjacent epidermal silicified structures at −25 mV. In this material which has not undergone surface charge neutralisation, local surface charge is a surrogate for local topography with the charge map indicating silica structures with length scales consistent with ∼40–60 nm which is well below the classical resolution limit of this confocal microscope and yet consistent with published data on the sizes of the globular silica aggregates that make up the silica structures found in the branches of this plant.16 Further, using this charge imaging approach, we were able to determine that both stomata and basal structures of the sample are hydrated at the local scale (water in the Stern layer is needed for PDMPO to interact with silica) and highly charged with emission from the stomata dominated by the spectral behaviour of PDMPOH22+ (Fig. 4a and b).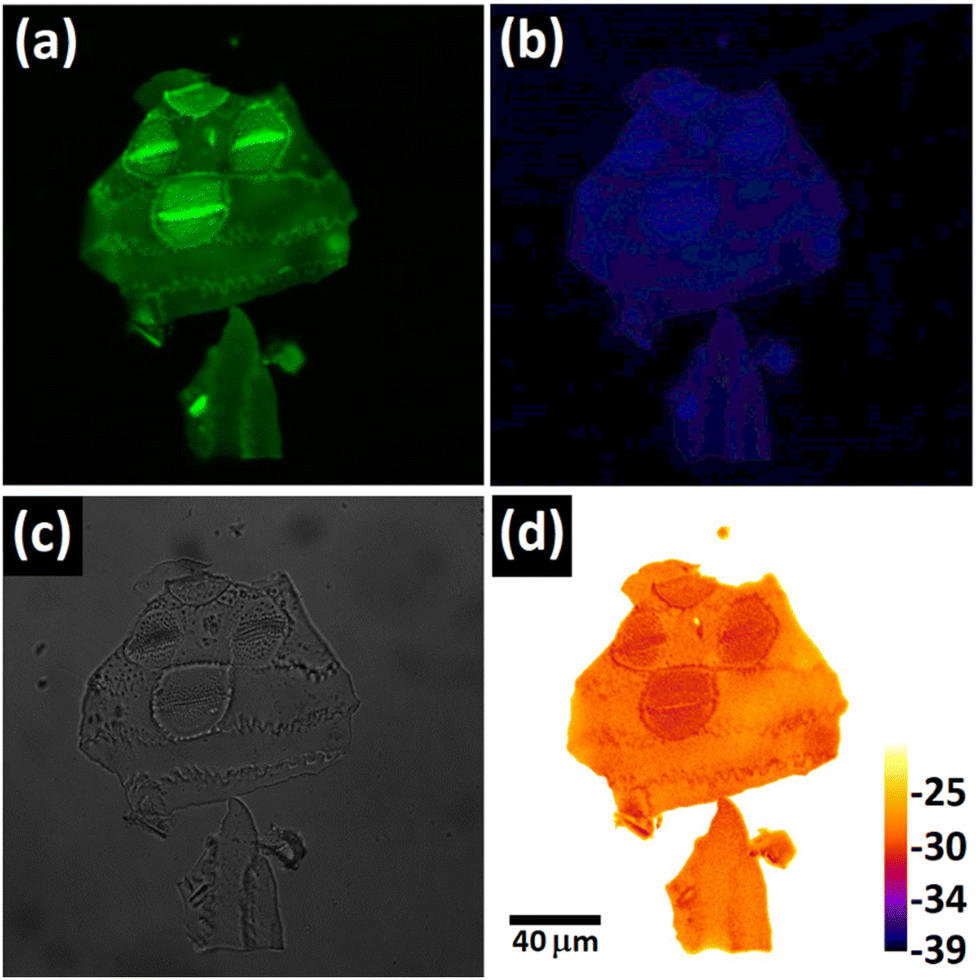 | ||
| Fig. 4 Functional imaging of charge on stomata and basal region of Equisetum arvense, (a) PDMPOH22+ imaging with data collected over the wavelength range 500–510 nm, (b) PDMPOH+ imaging with data collected over the wavelength range 460–470 nm, (c) bright field image of same sample, (d) effective zeta potential image calculated from the ratio of PDMPOH22+/PDMPOH+. The colours in (a) and (b) are false colours meant to represent the wavelength ranges measured. Image (b) has had its brightness increased to improve visibility. | ||
3.5 Charge mapping in intact biological material
To test the approach using intact biological tissues containing a range of carbohydrates, proteins, and lipids as well as silica we investigated the ability of the CSLM approach to characterise the nature of silica structures embedded within the cell wall of living tissues without fixation or sectioning. For this we used young branches and spores of the heavily silicified plant, Equisetum arvense, Fig. 5, and both freshwater and saltwater diatom species, Fig. 6. We checked that chlorophyll did not interfere with the collection of fluorescence data at 500–510 nm and 460–470 nm, Fig. S6† and explored the time needed for effective uptake of PDMPO into living tissue, ESI, Fig. S7.†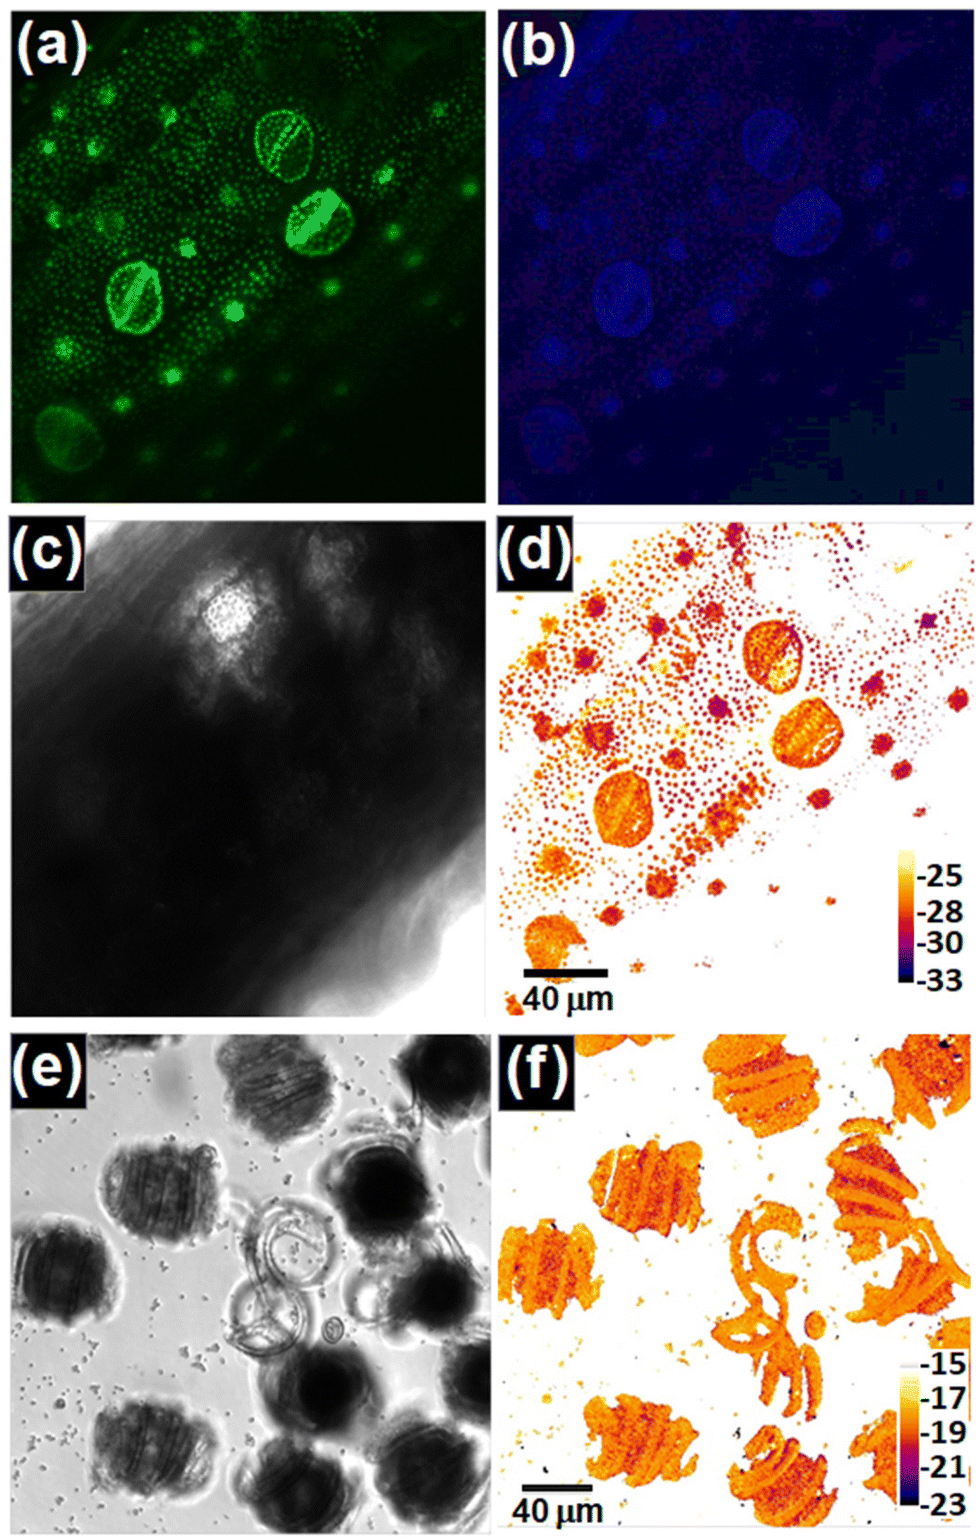 | ||
| Fig. 5 Functional imaging of structures from Equisetum arvense. (a)–(d) Stomata and rosette like structures present in the cell wall of immature branches of Equisetum arvense, (a) PDMPOH22+ imaging with data collected over the wavelength range 500–510 nm, (b) PDMPOH+ imaging with data collected over the wavelength range 460–470 nm, (c) bright field image of same sample and (d) effective zeta potential image calculated from the ratio of PDMPOH22+/PDMPOH+ using ImageJ. (e) and (f) spores from Equisetum arvense. (e) Bright field image, and (f) effective zeta potential image calculated from the ratio of PDMPOH22+/PDMPOH+ using ImageJ. The colours in (a) and (b) are false colours meant to represent the wavelength ranges measured. Image (b) has had its brightness increased to improve visibility. | ||
 | ||
| Fig. 6 Functional imaging of charge on diatoms, Coscinodiscus Wailesii (valve view), (a) bright field image and (b) effective zeta potential image calculated from the ratio of PDMPOH22+/PDMPOH+; and an exemplar freshwater diatom (c) bright field image, (d) effective zeta potential image calculated from the ratio of PDMPOH22+/PDMPOH+. PDMPOH22+ imaging with data collected over the wavelength range 500–510 nm and PDMPOH+ imaging with data collected over the wavelength range 460–470 nm for these samples is shown in Fig. S10.† | ||
Both branch material and spores show a varying range of effective zeta potential, Fig. 5 which is compatible with the fact that the plant is still growing and hence a range of silica sizes are present. For the branch sample, Fig. 5a–d, a range of −25 to −33 mV effective zeta potential leads to an estimation of silica particle sizes up to around 100 nm, consistent with particle sizes found from TEM studies of silica extracted from immature samples.23 By comparison of the bright field images Fig. 5c to the fluorescence images at different wavelengths Fig. 5a and b obtained through CSLM, it is clear that some of the structural features seen in bright field are not seen in the fluorescence images and vice versa. The ability to sample the fluorescence signal at different depths within the sample, and specifically not at the surface shows that the fluorescence observed is solely due to the PDMPO dye which accumulates where silica is present. Using this charge imaging approach, we were able to determine that both stomata and basal structures of the sample are hydrated at the local scale as water in the Stern layer is needed for PDMPO to interact with silica.27 Further, we could show that, the silica structures present in the stomata were highly charged as fluorescence emission was dominated by the spectral behaviour of PDMPOH22+ (Fig. 5a and b). For the spore sample, Fig. 5e and f, comparison of the light microscope image and the effective zeta potential image suggests the whole structure is silicified. The low effective zeta potential values support electron microscopy analysis of spore samples33,34 where small sub 1 micron sized particles coated with a ca. 40 nm layer of silica are present on the surface of the spores and the elaters that are thought to provide readily soluble silicon for the development of new plants. The CSLM method is further able to show that a thin coating of nano-sized silica, probably smaller than ca. 30 nm and having no distinct structure is present across the whole elater structure supporting previous EDXa analysis and Raman imaging data.34 Supporting data; images of the growing plant and individual images of the PDMPOH22+ and PDMPOH+ imaging are shown in Fig. S8 and S9† respectively.
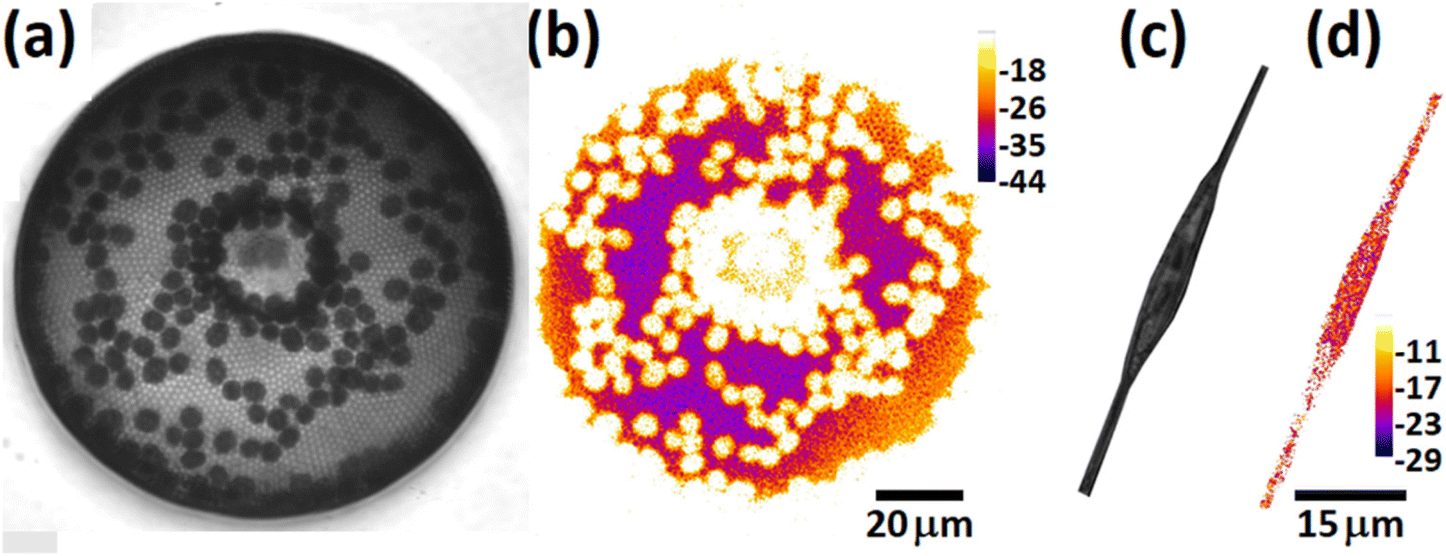
Freshwater and saltwater diatoms, both centric and pennate were studied. Fig. 6a shows a light microscope image of the valve of a saltwater diatom, Coscinodiscus Wailesii of around 110 μm size. A porous hexagonal array of silica covering the valve is clear in the effective zeta potential image. The range of −24 to −37 mV effective zeta potential values, Fig. 6b leads to an estimation of varying silica particle sizes as granular agglomerated nanostructures up to around 110 nm which is consistent with particle sizes of 50–200 nm found from AFM studies of silica extracted from two similar species of the Coscinodiscus genus.35–37 Comparative bright field images of a fresh water diatom, likely to be Cylindrotheca Closterium or Nitzschia Closterium38 by the dimensions and presence of two chloroplasts symmetrically distributed towards the middle of the elongated body39 are presented together with the corresponding zeta potential image in Fig. 6c and d. The diatom is known to be weakly silicified38,39 and this is supported by the low level of fluorescence observed. The effective zeta potential value at −17 to −20 mV leads to an estimation of silica particle sizes of between 10–20 nm. Bright field and zeta potential images of two other freshwater diatoms, suggested to be diatoma mesodon and diatoma vulgaris bory are presented in Fig. S11.† By changing the timing of addition of PDMPO to living organisms it may be possible to monitor both the early stages of silica deposition and maturation for a range of organisms.
4. Conclusion
We demonstrated a method for imaging surface charge density on heterogeneous silica structures using the fluorescence emission ratio of PDMPOH22+ and PDMPOH+ in both bare biosilica and intact living systems. Using silica nanoparticles of different sizes, we have shown that PDMPO as a fluorescent pH indicator when located in the Stern layer is an indicator of surface charge on silica.27 The relationship between surface charge, spectroscopy, and size has been shown empirically and reinforced by theory describing zeta potential. Based on this, we used PDMPO emission ratios to monitor surface charge and topography simultaneously on silicified heterogeneous surfaces. Calibration of surface charge and emission ratios using PDMPO on silica nanoparticles opens up the possibility of using confocal microscopy to determine surface charge on inert and living biological samples where the process of biosilicification can be followed under a range of environmental conditions. It is possible to use this technique under conditions where we assume pH is fixed and the effect of the dye on particles of different size, can be measured, as in this contribution, or alternatively experiments could be performed where particle sizes are fixed/known and the effect of pH monitored. Straightforward adaptation of existing technologies for rapid, ratiometric imaging of calcium40 to incorporate our method may enable real-time surface charge images to be measured on living organisms which will be of immense value in the study of the biosilicification process in vivo in a range of organisms including diatoms, sponges, and higher plants. The chemistry and spectroscopy of PDMPO is complex with dependency on solvent, pH, and environment, however, on the surface of silica in an aqueous environment it provides a morphology and surface charge dependent signal that could be adapted to real time monitoring. More recent developments in understanding the behaviour of PDMPO and related molecules only enhance the opportunities to adapt the methodology to other materials such as alumina, titania, ceria, and zinc oxide where surfaces include hydroxylated moieties. The method provides opportunities to engineer materials with defined charge characteristics for the solution of biomedical engineering problems including materials for tissue replacement.Conflicts of interest
There are no conflicts to declare.Acknowledgements
Support from NTU via University sponsored PhD scholarships for MP and AF and from AFOSR (AFOSR FA9550-13-1-0040, FA9550-16-1-0213 and FA9550-20-1-0206) in support of this research is gratefully acknowledged. Assistance from Dr Victor V. Volkov in the collection of plants and diatoms is gratefully acknowledged.References
- M. S. Azam and J. M. Gibbs-Davis, Monitoring DNA hybridization and thermal dissociation at the silica/water interface using resonantly enhanced second harmonic generation spectroscopy, Anal. Chem., 2013, 85, 8031–8038 CrossRef CAS PubMed.
- Z.-Y. Wu, C.-Y. Li, X.-L. Guo, B. Li, D.-W. Zhang, Y. Xu and F. Fang, Nanofracture on fused silica microchannel for Donnan exclusion based electrokinetic stacking of biomolecules, Lab Chip, 2012, 12, 3408–3412 RSC.
- R. Kotcherlakota, A. Barui, S. Prashar, M. Fajardo, D. Briones, A. Rodríguez-Diéguez, C. Patra and S. Gómez-Ruiz, Curcumin loaded mesoporous silica: an effective drug delivery system for cancer treatment, Biomater. Sci., 2016, 4(3), 448–459 RSC.
- Y. A. Song, L. Wu, S. R. Tannenbaum, J. S. Wishnok and J. Han, Tunable membranes for free-flow zone electrophoresis in PDMS microchip using guided self-assembly of silica microbeads, Anal. Chem., 2013, 85, 11695–11699 CrossRef CAS PubMed.
- K. Ikuma, A. S. Madden, A. W. Decho and B. L. T. Lau, Deposition of nanoparticles onto polysaccharide-coated surfaces: implications for nanoparticle–biofilm interactions, Environ. Sci. Nano, 2014, 1, 117–122 RSC.
- G. Cho, D. Lee, H. Lim, S. Lee, C. Kim and D. Kim, Characterization of surface charge and zeta potential of colloidal silica prepared by various methods, Korean J. Chem. Eng., 2014, 31(11), 2088–2093 CrossRef CAS.
- P. Roach, D. Farrar and C. C. Perry, Surface tailoring for controlled protein adsorption: Effect of topography at the nanometer scale and chemistry, J. Am. Chem. Soc., 2006, 128, 3939–3945 CrossRef CAS PubMed.
- O. Kroutil, Z. Chval, A. A. Skelton and M. Předota, Computer simulations of quartz (101)-water interface over a range of pH values, J. Phys. Chem. C, 2015, 119, 9274–9286 CrossRef CAS.
- M. Barisik, S. Atalay, A. Beskok and S. Z. Qian, Size Dependent Surface Charge Properties of Silica Nanoparticles, J. Phys. Chem. C, 2014, 118, 1836–1842 CrossRef CAS.
- Z. Ovanesyan, A. Aljzmi, M. Almusaynid, A. Khan, E. Valderrama, K. Nash and M. Marucho, Ion–ion correlation, solvent excluded volume and pH effects on physicochemical properties of spherical oxide nanoparticles, J. Colloid Interface Sci., 2016, 462, 325–333 CrossRef CAS PubMed.
- A. Salis, L. Medda, F. Cugia and M. Monduzzi, Effect of electrolytes on proteins physisorption on ordered mesoporous silica materials, Colloids Surf., B, 2016, 137, 77–90 CrossRef CAS PubMed.
- M. A. Brown, G. V. Bossa and S. May, Emergence of a Stern Layer from the Incorporation of Hydration Interactions into the Gouy-Chapman Model of the Electrical Double Layer, Langmuir, 2015, 31, 11477–11483 CrossRef CAS PubMed.
- L. Collins, J. I. Kilpatrick, S. A. L. Wever, A. Tselev, I. V. Vlassiouk, I. N. Ivanov, S. Jesse, S. V. Kalinin and B. J. Rodrigues, Open loop Kelvin probe force microscopy with single and multi-frequency excitation, Nanotechnology, 2013, 24, 475702 CrossRef CAS PubMed.
- Y. Gan and G. V. Franks, Charging behavior of the gibbsite basal (001) surface in NaCl solution investigated by AFM colloidal probe technique, Langmuir, 2006, 22, 6087–6092 CrossRef CAS PubMed.
- O. Stern, Zur theorie der elektrolytischen doppelschicht, Z. Elektrochem. Angew. Phys. Chem., 1924, 30, 508–516 CAS.
- X. Yin and J. Drelich, Surface Charge Microscopy: Novel Technique for Mapping Charge-Mosaic Surfaces in Electrolyte Solutions, Langmuir, 2008, 24, 8013–8020 CrossRef CAS PubMed.
- S. Su, I. Siretanu, D. van der Ende, B. Mei, G. Mul and F. Mugele, Facet dependent surface charge and hydration of semi-conducting nanoparticles at variable pH, Adv. Mater., 2021, 33, 2106229 CrossRef CAS PubMed.
- J. Zhang, T. Zhu, J. Lang, W. Fu and F. Li, Recent advances of scanning electrochemical microscopy and scanning ion conductance microscopy for single-cell analysis, Curr. Opin. Electrochem., 2020, 22, 178–185 CrossRef.
- T. Kai, C. G. Zoski and A. J. Bard, Scanning electrochemical microscopy at the nanometer level, Chem. Commun., 2018, 54, 1934–1947 RSC.
- T. Yoshinobu and M. J. Schöning, Light-addressable potentiometric sensors for cell monitoring and biosensing, Curr. Opin. Electrochem., 2021, 28, 100727 CrossRef CAS.
- X. Li, S. Liu, J. Tan and C. Wu, Light-Addressable Potentiometric Sensors in Microfluidics, Front. Biomed. Biotechnol., 2022, 10, 833481 CrossRef PubMed.
- C. Macias-Romero, I. Nahalka, H. I. Okur and S. Roke, Optical imaging of surface chemistry and dynamics in confinement, Science, 2017, 357, 784–788 CrossRef CAS PubMed.
- C. C. Perry and M. A. Fraser, Silica deposition and ultrastructure in the cell wall of Equisetum arvense: the importance of cell wall structures and flow control in biosilicification?, Philos. Trans. R. Soc. London, Ser. B, 1991, 334, 149–157 CrossRef.
- N. Kröger and N. Poulsen, Diatoms—From Cell Wall Biogenesis to Nanotechnology, Annu. Rev. Genet., 2008, 42, 83–107 CrossRef PubMed.
- C. C. Perry, E. J. Moss and R. J. P. Williams, A staining agent for biological silica, Proc. R. Soc. B, 1990, 241, 47–50 CrossRef CAS.
- K. Shimizu, Y. Del Amo, M. A. Brzezinski, G. D. Stucky and D. E. Morse, A novel fluorescent silica tracer for biological silicification studies, Chem. Biol., 2001, 8, 1051–1060 CrossRef CAS PubMed.
- M. Parambath, Q. Hanley, F. Martin-Martinez, T. Giesa, M. Buehler and C. C. Perry, The nature of the silicaphilic fluorescence of PDMPO, Phys. Chem. Chem. Phys., 2016, 18(8), 5938–5948 RSC.
- P. Merdy, C. Neyard, J.-D. Meunier and Y. Lucas, PDMPO: a specific silicon or silica, pH sensitive fluorescent probe?, RSC Adv., 2020, 10, 31003–31011 RSC.
- V. Puddu and C. C. Perry, Interactions at the Silica – Peptide Interface: The Influence of Particle Size and Surface Functionality, Langmuir, 2014, 30, 227–233 CrossRef CAS PubMed.
- B. J. Kirby and E. F. Hasselbrink, Zeta potential of microfluidic substrates: 1. Theory, experimental techniques, and effects on separations, Electrophoresis, 2004, 25, 187–202 CrossRef CAS PubMed.
- W. B. Russel, D. A. Saville and W. R. Schwalter, Colloidal Dispersions, Cambridge University Press, 1989. DOI:10.1017/CBO9780511608810.
- V. Herve, J. Derr, S. Douady, M. Quinet, L. Moisan and P. J. Lopez, Multiparametric analyses reveal the pH-dependence of silicon biomineralization in diatoms, PLoS One, 2012, 7, e46722 CrossRef CAS PubMed.
- C. C. Perry, Chemical Studies of Biogenic Silica, in Biomineralisation, chemical and biochemical perspectives, ed. S. Mann, J. Webb and R. J. P. Williams, VCH, 1989, pp. 223–256 Search PubMed.
- V. V. Volkov, G. J. Hickman, A. Sola-Rabada and C. C. Perry, Distributions of Silica and Biopolymer Structural Components in the Spore Elater of Equisetum arvense, an Ancient Silicifying Plant, Front. Plant Sci., 2019, 10, 1–10 CrossRef PubMed.
- F. Noll, M. Sumper and N. Hampp, Nanostructure of Diatom Silica Surfaces and of Biomimetic Analogues, Nano Lett., 2002, 2(2), 91–95 CrossRef CAS.
- D. Losic, K. Short, J. Mitchell, R. Lal and N. Voelcker, AFM Nanoindentations of Diatom Biosilica Surfaces, Langmuir, 2007, 23(9), 5014–5021 CrossRef CAS PubMed.
- M. Hildebrand, G. Holton, D. Joy, M. Doktycz and D. Allison, Diverse and conserved nano- and mesoscale structures of diatom silica revealed by atomic force microscopy, J. Microsc., 2009, 235(2), 172–187 CrossRef CAS PubMed.
- E. F. Reimann and J. C. Lewin, The diatom genus Cylindrotheca Rabenhorst (with a reconsideration of Nitzschia closterium), J. R. Microsc. Soc., 1964, 83(3), 283–296 CrossRef.
- H. Li, G. Yang, Y. Sun, S. Wu and X. Zhang, Cylindrotheca closterium is a species complex as was evidenced by the variations of rbcL gene and SSU rDNA, J. Ocean Univ. China, 2007, 6(2), 167–174 CrossRef CAS.
- D. Schild and A. S. H. Jung, Localization of calcium entry through calcium channels in olfactory receptor neurones using a laser scanning microscope and the calcium indicator dyes Fluo-3 and Fura-Red, Cell Calcium, 1994, 15, 341–348 CrossRef CAS PubMed.
Footnotes |
| † Electronic supplementary information (ESI) available: Fig. S1–S11. See DOI: https://doi.org/10.1039/d2an01196d |
| ‡ These authors contributed equally. |
| This journal is © The Royal Society of Chemistry 2022 |