
 Open Access Article
 This Open Access Article is licensed under a
 Creative Commons Attribution 3.0 Unported Licence
Pseudopeptidic host adaptation in peptide recognition unveiled by ion mobility mass spectrometry†
Lucia
Tapia
a,
Yolanda
Pérez
 b,
Jordi
Solà
a,
Santiago V.
Luis
c,
Ignacio
Alfonso
*a and
Cristian
Vicent
*d
b,
Jordi
Solà
a,
Santiago V.
Luis
c,
Ignacio
Alfonso
*a and
Cristian
Vicent
*d
aDepartment of Biological Chemistry, Institute for Advanced Chemistry of Catalonia, IQAC-CSIC, Jordi Girona 18-26, 08034, Barcelona, Spain. E-mail: ignacio.alfonso@iqac.csic.es
bNMR Facility, Institute for Advanced Chemistry of Catalonia, IQAC-CSIC, Jordi Girona 18-26, 08034, Barcelona, Spain
cDepartamento de Química Inorgánica y Orgánica, Universitat Jaume I, Av. de Vicent Sos Baynat s/n, 12071 Castellón, Spain
dServei Central d'Instrumentació Científica (SCIC), Universitat Jaume I, Avda. Sos Baynat s/n, 12006 Castellón, Spain. E-mail: barrera@uji.es
First published on 28th October 2022
Abstract
Complexation of the glutamic–tyrosine–glutamic tripeptide (EYE) with a series of pseudopeptidic cages has been thoroughly investigated using different analytical techniques. The stoichiometry and affinities of the supramolecular host![[thin space (1/6-em)]](https://www.rsc.org/images/entities/char_2009.gif) :guest complexes both in aqueous solution and in the gas-phase were obtained from a suitable combination of fluorescence spectroscopy, NMR, and mass spectrometry (MS) methods. The cages bearing basic groups (lysine, ornitine and histidine) display the tightest EYE binding in aqueous media following the order CyHis > CyLys>CyOrn, thus suggesting that Tyr side chain encapsulation is additionally modulated by the identity of the cage side chains and their ability to be engaged in polar interactions with the EYE peptide. Similarly, binding affinities estimated by MS methods clearly point towards a reduced affinity for the Cy cages with acidic pendant groups and a higher affinity of the CyHis cage over CyLys and CyOrn. Ion mobility spectrometry (IMS)-MS, assisted by molecular modelling, has been used to uncover the structural and conformational characteristics of the pseudopeptidic hosts and their supramolecular adducts with the EYE peptide. The cages display a collisional cross-section increase upon EYE inclusion that is associated with the expansion of the binding pocket of the cage cavity, thus constituting a unique example of conformational pseudopeptidic host adaptation to accommodate the inclusion of the guest.
:guest complexes both in aqueous solution and in the gas-phase were obtained from a suitable combination of fluorescence spectroscopy, NMR, and mass spectrometry (MS) methods. The cages bearing basic groups (lysine, ornitine and histidine) display the tightest EYE binding in aqueous media following the order CyHis > CyLys>CyOrn, thus suggesting that Tyr side chain encapsulation is additionally modulated by the identity of the cage side chains and their ability to be engaged in polar interactions with the EYE peptide. Similarly, binding affinities estimated by MS methods clearly point towards a reduced affinity for the Cy cages with acidic pendant groups and a higher affinity of the CyHis cage over CyLys and CyOrn. Ion mobility spectrometry (IMS)-MS, assisted by molecular modelling, has been used to uncover the structural and conformational characteristics of the pseudopeptidic hosts and their supramolecular adducts with the EYE peptide. The cages display a collisional cross-section increase upon EYE inclusion that is associated with the expansion of the binding pocket of the cage cavity, thus constituting a unique example of conformational pseudopeptidic host adaptation to accommodate the inclusion of the guest.
Introduction
Peptide molecular recognition is a challenging task that has been faced with synthetic macrocycles and cages. They can display selective binding thanks to their encapsulation properties, preorganization and available interaction modes.1,2 Enhancing their selective and sensitive peptide recognition abilities in biological media has become an appealing topic in supramolecular chemistry inspired mainly by nature.3–11 The incorporation of different functional units in appropriate places of the artificial hosts offers a powerful platform to control their pre-organization in order to imitate the properties of natural receptors. In recent years, we have developed a family of macrobicyclic cages (see Chart 1) with peptide recognition abilities. They are based on (i) flexible amino acid derived chemical moieties (pseudopeptides) and (ii) rigid 1,2-trans diaminocyclohexane (DACH) units and capping aromatic rings. These opposite characteristics keep the cavity of the hosts in a unique semi-rigid arrangement that defines a binding pocket for Tyr-containing peptides,12–15 especially for polypeptides containing the glutamic–tyrosine–glutamic (EYE) sequence. Such an EYE motif is a well-known substrate epitope for protein tyrosine kinases (TKs), which catalyse the transfer of a phosphoryl group from ATP to the Tyr hydroxyl group.16–18 Some of the pseudopeptidic cages displayed in Chart 1 are able to inhibit the TK-promoted phosphorylation by the selective encapsulation of the Tyr residue in competition with the kinase.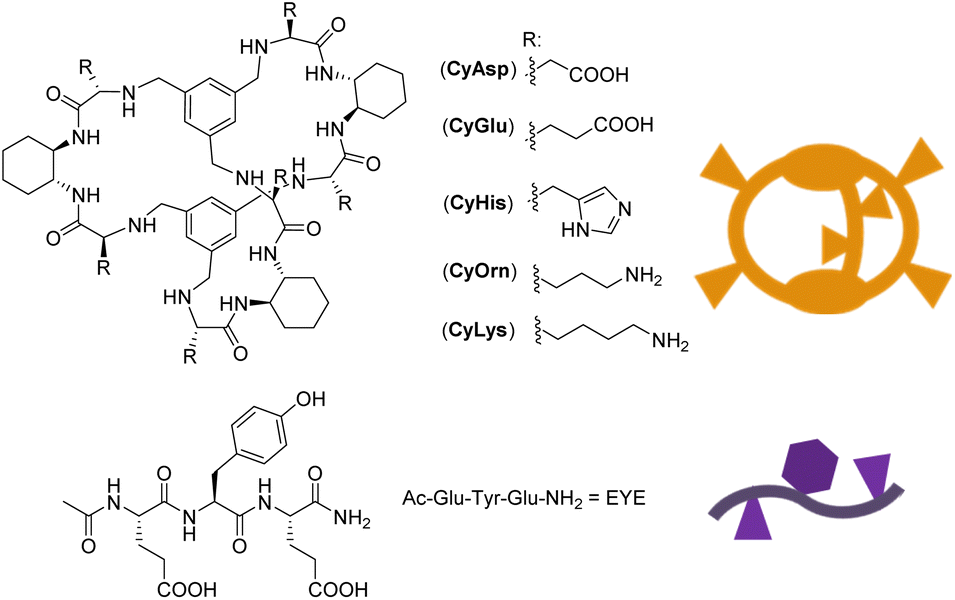 | ||
| Chart 1 Structure of the pseudopeptidic Cy cages and the EYE substrate investigated in this work. | ||
An important challenge in the design of new and improved peptide receptors is their structural and conformational analysis. As specific host modifications are introduced, the structure–function relationship of pseudopeptidic cages may become difficult to explore by solution-phase or solid state techniques.19–22 In the present case, the cages shown in Chart 1 display highly symmetric NMR spectra (providing limited structural insights) in aqueous biomimetic media. Furthermore, suitable single-crystals for X-ray diffraction studies could not be attained so far; thus structural and conformational details remain limited. Therefore, it is highly desirable to develop new analytical toolsets and strategies to assess the characterization of the Cy cages and their cage:guest complexes.
In this context, mass spectrometry (MS) soft ionization methods, such as electrospray ionization (ESI), have long been used as an analytical method to study biological noncovalent macromolecular complexes.23–26 Properties like stoichiometry, binding affinities or stability of host–guest complexes in the gas phase can be determined, with a very low sample consumption. In addition, ion mobility spectrometry (IMS) MS has emerged in recent years as a powerful tool to gain insights into the conformational dynamics of biological systems,27–30 offering a unique means of characterizing molecular dimensions, structure, flexibility and folding mechanisms.31–33 IMS separates gaseous ions based on their sizes and shapes as the ions travel through a chamber filled with a buffer gas in an electric field. Based on the IMS-MS experimental conditions and the arrival time distribution (ATD) of ions, their mobility (K) and the collision cross section (CCS) derived property can be determined. However, IMS-MS is still highly underexploited in the field of synthetic cages or macrocycles and their host:guest chemistry.34–43 Herein, a combination of MS methods (single-stage, collision induced dissociation (CID) and IMS-MS experiments), fluorescence spectroscopy, NMR and molecular modelling of the supramolecular complexes of the Cy cages and the peptide EYE is reported to decipher the intimate details of the binding event, both in aqueous solution and in the gas-phase.
Results and discussion
Structural features of the pseudopeptidic cage receptors
The studied cage receptors display reasonable water solubility and their 1H NMR spectra are highly symmetric in all tested media; i.e. the D3 symmetry is proved from the observation of single resonances for the trisubstituted capping phenyl group and the peptide backbone. Because of the large number of available protonable groups at neutral pH, this symmetrical 1H NMR pattern likely implies rapid protonation/deprotonation on the 1H NMR time scale associated with minimal conformational cage variations (large conformational cage distortions should be associated with kinetically slow motion readily distinguishable by NMR). However, the detailed determination of the acid–base properties of the cages by standard titration methods was difficult due to the large number (up to 12) of protonable sites with similar acid–base properties (i.e.CyOrn and CyLys) that hampers a reliable fitting of pH-metric titrations. An estimation of a charge state close to +5 for CyLys and CyOrn at neutral pH can be inferred (see Fig. S1 in the ESI†). Moreover, several cages display limited solubility at extreme pH values (especially CyHis), which additionally precludes suitable titration experiments. These solubility issues are even more important at the concentrations required to acquire the corresponding NMR spectra over a wide range of pH.To overcome the inherent limited structural and conformational information gathered from NMR, we turned our attention to MS methods as an alternative analytical tool. The ESI mass spectra of the cages shown in Chart 1, investigated from aqueous 10 μM solutions, are very much alike displaying protonated adducts of the general formula [M + nH]n+ (n = 2–5) with a unimodal distribution. For CyOrn, CyLys and CyHis, the average charge states (zaverage) range from +3.6 to +3.8 (see the Experimental section). For CyAsp and CyGlu, average charge states are similar (close to +3.5) under identical ESI conditions. Hence, the distribution of charge states of the Cy cages produced in the gas phase by ESI do not reflect either the number of acid/base groups on the side chain or the solution-phase charge state of CyLys and CyOrn (close to +5). These ESI characteristics are reminiscent of those of globular biomolecules for which it has been shown that the extent of ionization correlates well with the solvent-accessible surface area of the tridimensional structure,44–47 rather than the number of acid/base groups on the side chains. We hypothesize that the close zaverage values for Cy cages, regardless of the peripheral acid (CyGlu and CyAsp) or basic (CyLys, CyOrn and CyHis) groups, can be explained by the common cage topology across the Cy series that should result in similar solvent-accessible surface area.
For IMS-MS experiments, we employed an ESI travelling wave ion mobility (TWIM)-MS instrument with nitrogen as the buffer. Arrival time distributions (ATDs) for each protonated adduct were extracted from their corresponding ESI IMS mass spectra. Illustrative ATDs for [CyLys + nH]n+ (n = 2–4), [CyOrn + nH]n+ (n = 2–4) and [CyHis + nH]n+ (n = 2–4) are shown in Fig. 1.
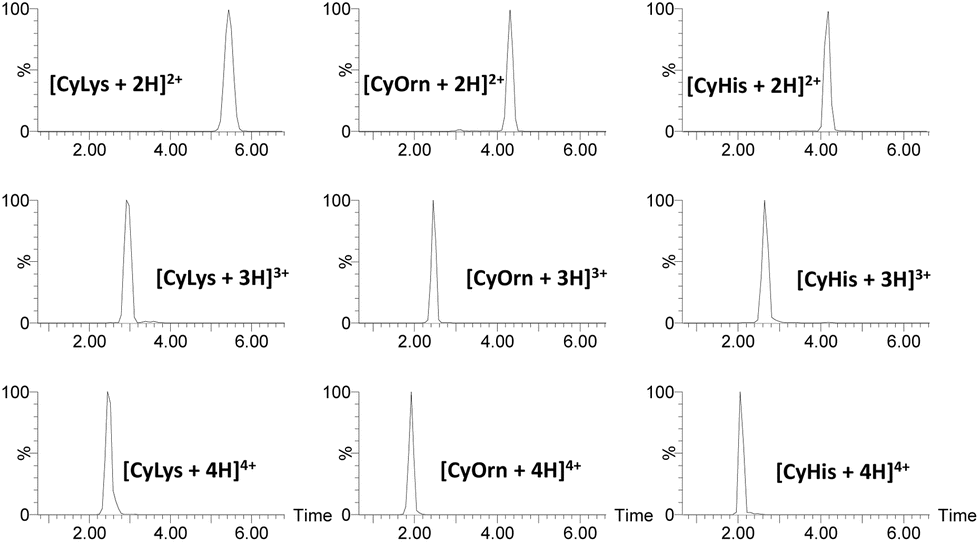 | ||
| Fig. 1 Arrival time distribution for [CyLys + nH]n+, [CyOrn + nH]n+ and [CyHis + nH]n+ (n = 2–4). | ||
Irrespective of the charge state, narrow and Gaussian-shaped ATD profiles were observed for the various m/z selected cage ions [Cy + nH]n+ (n = 2–4), confirming low conformational dispersion (see also Fig. S3†). Such a narrow conformational ensemble can be ascribed to the rigidity imparted by the DACH groups and the capping aromatic rings to the macrobicyclic structure. The TWCCSN2 values (TWCCSN2 refers to the determined CCS values using a TWIM-MS instrument and nitrogen as buffer gas)48 were determined by the calibration approach.49 There is a slight increase in TWCCSN2 (see Table 1) values as a function of charge state across the whole series that is associated with the charge repulsion effects together with the impossibility of such medium-sized and rigid cages to expand/fold to a large extent. For the CyLys/CyOrn and CyAsp/CyGlu pairs, the TWCCSN2 values increase simultaneously with the molecular weight in agreement with the six extra methylenes of the Lys (or Glu) pendant groups that increase the area colliding with the buffer gas giving corresponding larger CCS values.
| Adduct/cages | CyOrn | CyLys |
TWCCSN2a (Å2) |
CyGlu | |
|---|---|---|---|---|---|
| CyHis | CyAsp | ||||
| a Values obtained by calibrating the drift time scale of the TWIM device with standards of known DTCCSN2 (DTCCSN2 refers to the determined CCS values using a drift tube instrument and nitrogen as buffer gas) cross-sectional data from the literature. Samples were measured by triplicate, and standard deviations were below 0.5%. b The supramolecular [CyAsp + EYE + 3H]3+ and [CyGlu + EYE + 3H]3+ adducts were not observed experimentally; (n.d. means not detected). | |||||
| [Cy + 3H]3+ | 414 | 467 | 437 | 411 | 415 |
| [Cy + 2H]2+ | 401 | 448 | 395 | 377 | 388 |
| [Cy + EYE + 3H]3+ | 480 | 515 | 506 | n.d.b | n.d.b |
The spray solvent, pH or counterion are known to induce distinctive conformation of macrocycles and cages, and IMS-MS is an excellent tool to uncover such conformational characteristics.35–37,40,50 For the investigated Cy cages, changing the solvent from water to CH3CN, CH3OH or water mixtures with both solvents produces ESI mass spectra in which charge envelopes shift towards lower charge states, yet the ATD of each identified protonated [Cy + nH]n+ adduct remains unchanged. The ESI mass spectra of formic acid-acidified (pH 4) aqueous solutions closely resemble those found in water, both in terms of the identity of the species as well as the narrow ATD for each protonated adduct.‡51 As pH of the solvent is raised, charge envelopes are slightly shifted towards lower charge states. Such a minor shift of charge states contrasts with the large charge state variation estimated in water solutions (see Fig. S1†) on going from acidic to basic pH. It is additional evidence of the small dependence on the solution-phase charge state of the Cy cages and the charge state observed upon ESI of aqueous solutions.52 Nonetheless, the ATD profiles for the various m/z selected cage ions [Cy + nH]n+ (n = 2, 3 and 4) do not vary, thus clearly evidencing that the inherent low conformational dispersion of [Cy + nH]n+ cations holds for a wide range of experimental conditions.
Complexation studies of Cy cages and the EYE peptide by fluorescence spectroscopy, NMR and MS methods
Motivated by the biological relevance of the recognition of the EYE motif, the interaction of these pseudopeptidic cages with the EYE guest was investigated in aqueous buffered solutions. A methodological advantage of studying supramolecular interactions with sequences containing Tyr residues relies on the convenient use of fluorescence spectroscopy (see Fig. 2 and S4–S8†). Thus, the inclusion of the Tyr side chain within the cage cavity strongly affects its fluorescence emission properties, allowing the accurate determination of the corresponding cage-EYE binding affinities by fluorescence emission titration experiments (Fig. 2 and Table 2).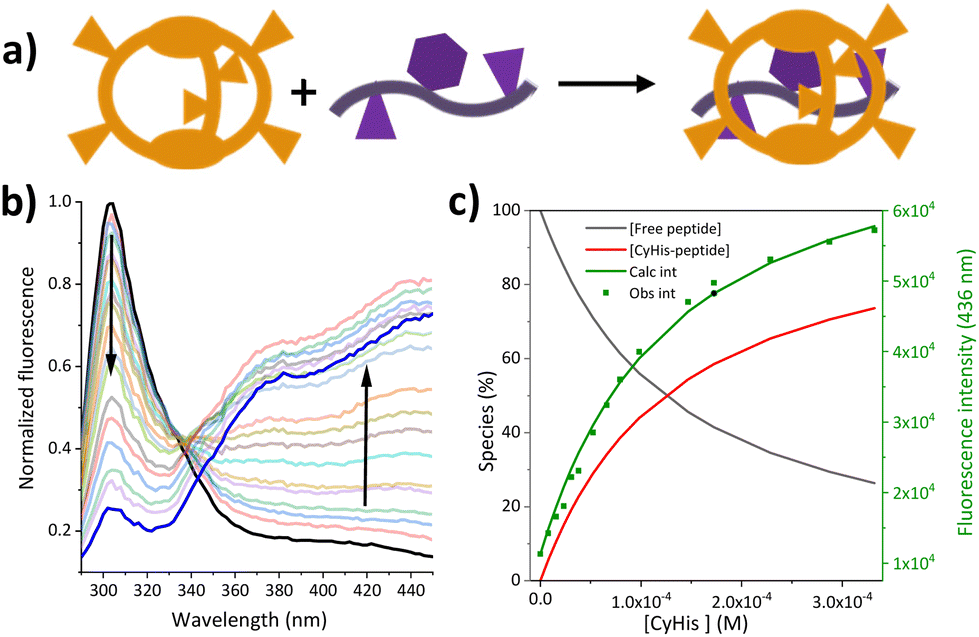 | ||
| Fig. 2 (a) Schematic representation of the binding event between the Cy cages and the EYE guest; (b) normalized fluorescence emission of the EYE peptide with increasing amount of CyHis (up to 3 × 10⁻⁴ M) and (c) the fitting of the corresponding Tyr emission at 436 nm to a 1:1 binding mode (Obs. int and Calc. int stands for the observed and fitted fluorescence emission, respectively). | ||
β, standard deviation on last significant figure in parenthesis) and affinity constants  for the corresponding cage-EYE supramolecular complexes obtained by fluorescence titration experiments (excitation at 276 nm, 50 mM TRIS buffer, pH 7.3)
| Entry | Cage | logβ |
|
Selectivity |
|---|---|---|---|---|
| a The weak interaction in this case leads to a less reliable fitting since in both cases CyAsp and CyGlu less than 60% of complexation is reached during the titration. b From ref. 14. | ||||
| 1 | CyOrn | 2.94(1) | 1150 ± 30b | 0.10 |
| 2 | CyLys | 3.26(2) | 550 ± 25b | 0.21 |
| 3 | CyHis | 3.94(1) | 115 ± 3 | 1.00 |
| 4 | CyAsp | 2.69(1) | 2040a ± 50 | 0.056 |
| 5 | CyGlu | 2.37(1) | 4270a ± 100 | 0.026 |

Table 2 shows that CyHis (entry 3) displays the strongest binding towards the guest with a Kd of 115 μM followed by CyLys and CyOrn. CyAsp and CyGlu show a much weaker binding with a Kd in the millimolar range. The corresponding selectivity, defined as the relative affinity towards the EYE substrate, is especially remarkable for CyHis in comparison with the other hosts. This trend implies that the Tyr inclusion within the cage is additionally modulated by the secondary side chain–side chain cage–EYE polar interactions. Intuitively, CyHis, CyLys and CyOrn show a stronger binding due to the basic R substituents, which can better interact with the anionic glutamate groups next to the Tyr in EYE, whereas the carboxylate residues of CyAsp and CyGlu would produce a repulsion effect reducing their affinity. The superior affinity of CyHis is associated with the unique characteristics of imidazole that can be engaged in a wide range of non-covalent interactions (ionic, H bonds as donor or acceptor, and through its π aromatic cloud) which play crucial structural roles in protein structure, interactions and function.53–59
The CyHis–EYE interaction was also studied by NMR in buffered D2O (deuterated Tris, pH 7). Despite the strong interaction determined by fluorescence titrations, modest chemical shift perturbations were observed in the 1H NMR signals. Such observed CSPs (see Fig. S9†) follow the trends previously observed in closely related host–guest systems.15 Attempts to observe host-to-guest intermolecular NOEs (or ROEs) were unsuccessful most likely due to unsuitable relaxation properties.60
Moved by the somehow limited structural information obtained by NMR, and the impossibility to grow single-crystals for X-ray diffraction studies, the EYE complexation was also investigated by MS methods. Increasing amounts of EYE, hereafter G (0.5, 1 and 4 equivalents), were added to 1 mM aqueous solutions of the host receptors. The resulting mixtures were diluted with water at different pH values to a final 10 μM concentration and directly analysed by ESI-MS. Two distinctive MS complexation behaviours are identified for hosts either with acid (CyAsp and CyGlu) or basic (CyOrn, CyLys and CyHis) pendant groups. For CyAsp and CyGlu, supramolecular 1:1 [CyGlu + G + 2H]2+ and [CyAsp + G + 2H]2+ adducts are barely detected in the positive ESI mass spectra. The negative ESI mass spectra did not show adducts assigned to supramolecular cage:EYE complexes. Supramolecular 1:1 adducts are identified as prominent peaks to a much larger extent for CyLys, CyOrn and CyHis as compared with the hosts with acidic pendant groups. Fig. 3 shows the positive ESI mass spectrum of CyLys and 1 equivalent of EYE recorded in water.
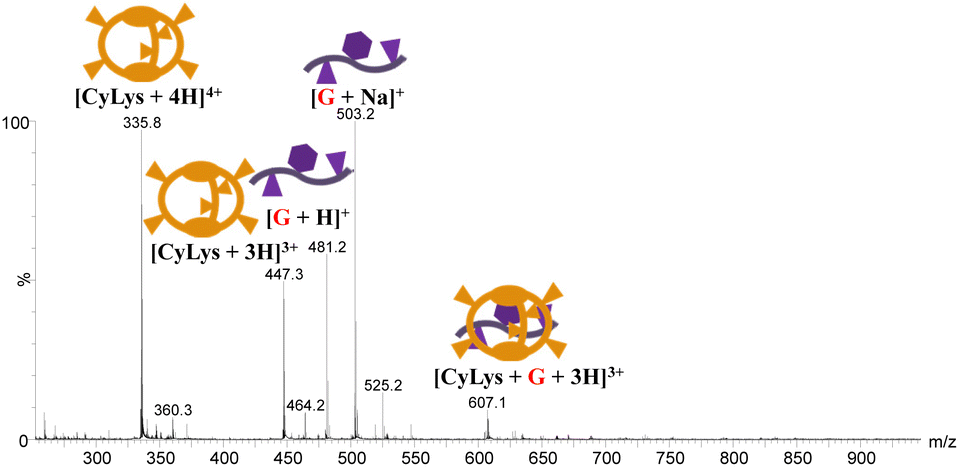 | ||
| Fig. 3 ESI mass spectrum of an aqueous solution of CyLys and 1 equivalent of the EYE guest. | ||
The supramolecular 1:1 [CyLys + G + 3H]3+ (m/z 607.1) adduct can be observed along with barely detected doubly-charged [CyLys + G + 2H]2+ after addition of 0.5 equivalent of G. These mass spectral peaks grow smoothly as the number of equivalents is increased. Apart from the deprotonated [Cy − H]− species, peaks corresponding to host:guest assemblies could not be observed in the negative ESI mass spectrum. The ESI mass spectrum recorded from acidified (pH 4) solutions closely resembles that obtained in aqueous solutions, both in terms of the identity of the detected supramolecular species, namely [CyLys + G + nH]n+ (n = 2 and 3) as well as their relative ratio. However, the ESI mass spectrum recorded at pH 9 shows a shift of the charge states of CyLys towards lower values accompanied by a significant reduction of the relative abundance of the 1:1 adducts with respect to the unbound cage. This result indicates a less favourable recognition of G under basic conditions and points to a pivotal role of cage protonation to attain EYE peptide recognition. Positive-mode ESI mass spectra of aqueous solutions of CyOrn and CyHis hosts with G are very much alike to those found for CyLys, resulting in mass spectra showing doubly and triply charged 1:1 [Cy + G + nH]n+ species (see Fig. S10 and S11†) and a closely related pH-dependent behaviour.
The intrinsic gas-phase stability of the 1:1 supramolecular complexes was investigated by CID experiments. Illustrative CID mass spectra upon mass-selection of [CyHis + G + 3H]3+ (m/z 625.7) are shown in Fig. 4a at different fragmentation conditions. Partial G dissociation is initially clear even at the lowest collision energy used under CID conditions. Each supramolecular adduct follows the same mechanism upon dissociation (dissociation by a charge separation mechanism into a singly charged guest [G + H]+ (m/z 481.2) and the doubly charged host [Cy + 2H]2+ according to eqn (1)). Dissociation efficiency curves (plots of percent dissociation versus centre-of-mass collision energy) were generated.61,62 The charge splitting dissociation depicted in eqn (1) is presumably facilitated by coulombic repulsion of the triply charged precursor ion together with the presence of mobile protons in the supramolecular complex.63,64 Hence, upon collisional activation, mobile protons may be transferred from the sites of higher gas-phase basicity from the cages to several carboxylate or backbone amides of the EYE guest to form energetically less favoured protonated species that eventually dissociate by disrupting non-covalent bonds. The involvement of mobile protons under CID conditions also implies that a population of precursor and product ions heterogeneous with respect to charge localization can be accessed. All attempts to identify other protomers in the precursor and product ions on the basis of CID-IM experiments were unsuccessful.
| [Cy + G + 3H]3+ → [Cy + 2H]2+ + [G + H]+ | (1) |
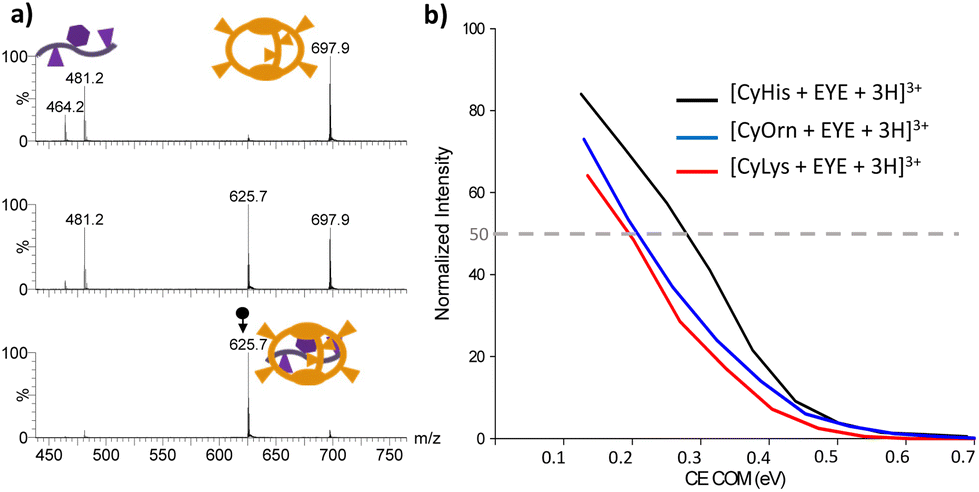 | ||
| Fig. 4 (a) CID mass spectra of mass-selected [CyHis + G + 3H]3+ (m/z 625.7) at increasing collision energies from the bottom (Elab 2 eV) to the top (Elab 15 eV); (b) dissociation efficiency curves for the [Cy + G + 3H]3+ (Cy = CyLys, CyOrn and CyHis) precursor ions as a function of collision energy in the centre-of-mass frame. | ||
Percent dissociation is calculated as the abundance of the precursor ion in proportion to the sum of the abundance of the host [Cy + 2H]2+, the guest [G + H]+ (m/z 481.2) and the product ion due to the successive fragmentation of the guest, namely [G + H-NH3]+ (m/z 464.2). The collision energy in the centre of mass required to dissociate 50% of the parent complex ions (referred to as CECOM50%) can be considered to compare the stability of the complexes.16 The dissociation efficiency curves for the [Cy + G + 3H]3+ (Cy = CyLys, CyOrn and CyHis) complexes are shown in Fig. 4b. Both CyOrn and CyLys supramolecular complexes are more readily dissociated than that containing CyHis (CECOM50% values close to 0.30 eV). Moreover, the absence of supramolecular adducts of the EYE tripeptide with CyAsp and CyGlu upon ESI-MS suggests a reasonable agreement with the trends observed in aqueous solutions in these particular cases. However, the complexes with CyLys and CyOrn display virtually identical CECOM50% values (close to 0.20 eV), despite the binding affinity towards the EYE guest in solution being favoured for CyLys (see Table 2). A plausible explanation for such higher affinity observed for CyLys can be ascribed to its higher basicity estimated in an aqueous solution (see Fig. S1†) whereas basicities for Lys and Orn are undistinguishable in the gas-phase.65
For the IMS-MS studies, we focused on the EYE complexation with CyOrn, CyLys and CyHis. The ATDs of the corresponding 1:1 adducts, namely [Cy + G + 3H]3+ display only a narrow and Gaussian-shaped ATD profile. Like their empty cage homologues, namely [Cy + 3H]3+ and [Cy + 3H]2+, they evidence a low conformation dispersion (see Fig. S10–S12†). Estimated TWCCSN2 values are 480 Å2, 506 Å2 and 515 Å2 for [CyOrn + G + 3H]3+, [CyHis + G + 3H]3+ and [CyLys + G + 3H]3+, respectively, which reflects a clear TWCCSN2 increase ranging from 50 to 70 Å2 upon EYE binding (see Table 1). The structural and conformational details that accounts for such increase are addressed in the next section on the basis of molecular modelling and comparison of experimental TWCCSN2 with those CCS calculated from the minimized structures.
Molecular basis for EYE binding by Cy cages with basic pendant groups
IMS-MS experiments allow obtaining structural insights of the ionic species from the structure-derived TWCCSN2 parameter, thus being a suitable approach for studying elusive supramolecular structures. In this section, we address the search of reliable gas-phase molecular models that could be linked to experimentally determined TWCCSN2 and establish the molecular basis for EYE recognition.66 For this purpose, we first explored the structural characteristics in aqueous solution using restraints derived from fluorescence spectroscopy to subsequently use them as input for gas-phase minimized structures. Our experimental results from fluorescence spectroscopy help us not only to rank the binding affinities of the Cy series but also to confirm the inclusion of the Tyr residue of EYE within the cage cavity and the pivotal role of the protonation of the cage side chains. Towards this aim, we focused on the charged states (+3) observed in the ESI-MS experiment. For CyOrn we considered protonation of three Orn primary amines, since these are more basic than the core secondary amines and this would also maximize the distance between charges of the same sign (see Fig. S2†). On the other hand, molecular modelling of CyHis with either side-chain or core-amine triprotonation suggested that protonation in the core is more favourable. To build the corresponding cage–EYE complexes, we followed a similar approach (see the Experimental section). The obtained structures (either cages alone or the corresponding complexes) were subjected to Monte Carlo conformational searches with OPLS3e force field minimizations in implicit water. The global minima thus obtained were further subjected to a second conformational search in vacuum, without restraints. This process was repeated several times starting from meaningful different host–guest dispositions in order to better map the wide conformational space. The rationale behind this protocol is to emulate the ESI-MS experiments, since we start from an equilibrated sample in an aqueous solution that is transferred to the gas phase, where solvent interactions are withdrawn.28 The final conformational ensembles in the gas phase and in the presence of water were individually analysed. In spite of the intrinsic flexibility of the systems, small differences in size and shape of the molecules with respect to the initial models in water were observed. Then, the global minimum geometry in each case was used for the theoretical calculation of the CCS using different approaches (see below). Structural models for the gas-phase [CyOrn + 3H]3+/[CyHis + 3H]3+ and the 1:1 [CyOrn + EYE + 3H]3+/[CyHis + EYE + 3H]3+ complexes are shown in Fig. 5.
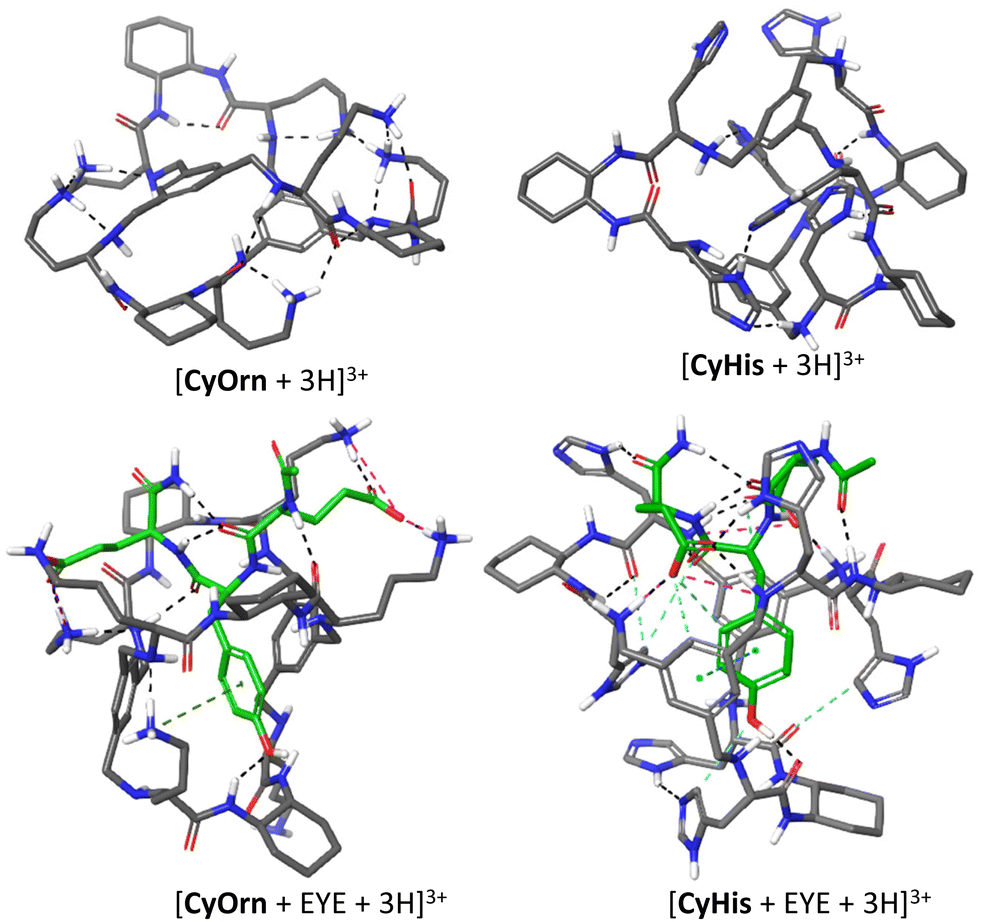 | ||
| Fig. 5 Minimized geometries for the triply charged species of CyOrn and CyHis cages, as well as their corresponding complexes with EYE peptide. Non polar H atoms are omitted for clarity and C atoms in EYE are shown in green (dashed lines: H-bonds black, salt bridges pink, aryl interactions light blue and cation-aryl interactions green). | ||
Despite the soft desolvation and ion transfer conditions typically used in the present work, changes in the stability of the inter- and intramolecular interactions as a result of solvent removal cannot be excluded, even without separation of the host:guest partners. Solvent removal eliminates the competition of water for hydrogen bonds and reinforces electrostatic interactions in the host:guest supramolecular complex. The partial flexibility of the cages is reflected in the folded geometries of the triply charged ions of the hosts, stabilized by a network of intramolecular H-bonds between the amides/amines of the core and the amine or imidazole groups from the side chains. For the corresponding cage-EYE complexes, in both cases, the Tyr residue remains included within the cage cavity, stabilized by either π-stacking (CyHis) or π–cation (CyOrn) interactions. Besides, the phenolic OH of EYE is H-bound to the polar groups of the hosts. The side chains of the hosts additionally interact with the anionic Glu residues and the backbone of EYE, through salt bridges and polar H-bonds. In this case, the number of non-covalent interactions identified in the complex with CyHis is sensibly higher than for CyOrn (Fig. 5).
The CyOrn and CyHis cages suffer a remarkable distortion upon EYE binding as it was anticipated from the TWCCSN2 enhancement upon EYE inclusion. Specifically, the binding pocket defined by the two capping phenyl rings and the three DACH groups is expanded on going from [Cy + 3H]3+ to [Cy + EYE + 3H]3+. Such distortions are illustrated in Fig. 6 by the overlapping CyOrn and CyHis cages both in their respective [Cy + 3H]3+ and the 1:1 [Cy + EYE + 3H]3+ trications (aligning one of the capping aromatic rings in each case). It clearly shows how the binding pocket in both cages is expanded on going from the free cage (orange structures) to the complex (purple structures) species. Such distortion can be gauged by considering the size of the triangle defined by the centroid of the three DACH groups as well as the distance of the centroids of the two capping phenyl groups. If we consider the triangle defined by the centroids of the DACH moieties, the side lengths vary from 9.1–15.2–16.0 Å to 11.4–15.2–15.7 Å for [CyOrn + 3H]3+ to [CyOrn + EYE + 3H]3+ whereas this triangle size remains virtually unchanged for the [CyHis + 3H]3+ and [CyHis + EYE + 3H]3+ pair. However, the distance between the centroids of the capping phenyl groups moves from 5.6 and 7.1 Å in [CyOrn + 3H]3+ and [CyHis + 3H]3+ to 7.0 and 9.1 Å in the 1:1 supramolecular adducts [CyOrn + EYE + 3H]3+ and [CyHis + EYE + 3H]3+.
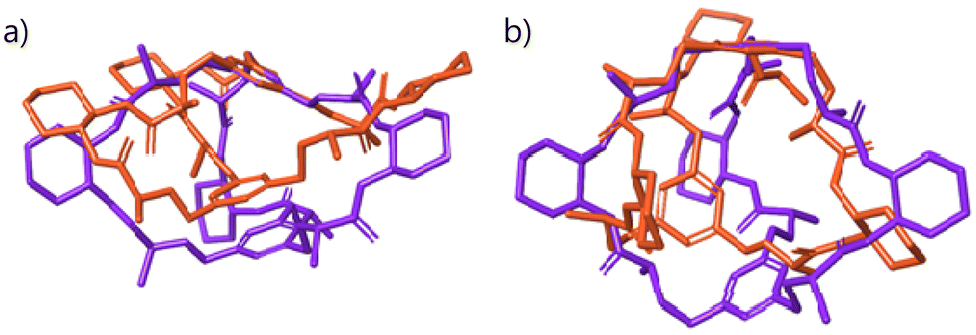 | ||
| Fig. 6 Superposition of the binding pockets in the empty [Cy + 3H]3+ cages (orange) and the 1:1 [Cy + EYE + 3H]3+ (purple) complexes for (a) CyOrn and (b) CyHis. Hydrogen atoms and the respective sidechains are omitted for clarity. | ||
The suitability of the structural models considered was checked against the experimental TWCCSN2 values using two computational CCS methods, namely projection superposition approximation (PSA) and trajectory methods (TM). The percentage differences between experimental and theoretical values using different methods are shown in Fig. 7. Predicted CCS values using the PSA method, parameterized for nitrogen drift gas, are within good accuracy with the experimental values. The PSA method accounts for effects of size and shape of the ions and has proved to yield accurate ion mobility cross sections for complex peptide systems with great computational efficiency.67–70 Deviations lower than 4% for the [CyOrn + 3H]3+/[CyOrn + G + 3H]3+ pair and 3% for [CyHis + 3H]3+/[CyHis + G + 3H]3+ are estimated compared to experimentally obtained TWCCSN2 values. The TM constitutes the most physically rigorous approach to estimate CCS as it considers the potential between the drift gas and the polyatomic ion. Like the PSA method, the agreement between the calculated CCS via TM approximation using IMos and the experiment is notable (within 4% and 7% for the CyOrn and CyHis members, respectively).71 Overall, the very good agreement between calculated and experimental values suggests that the considered models represent a good approximation to the intrinsically complex molecular recognition event.
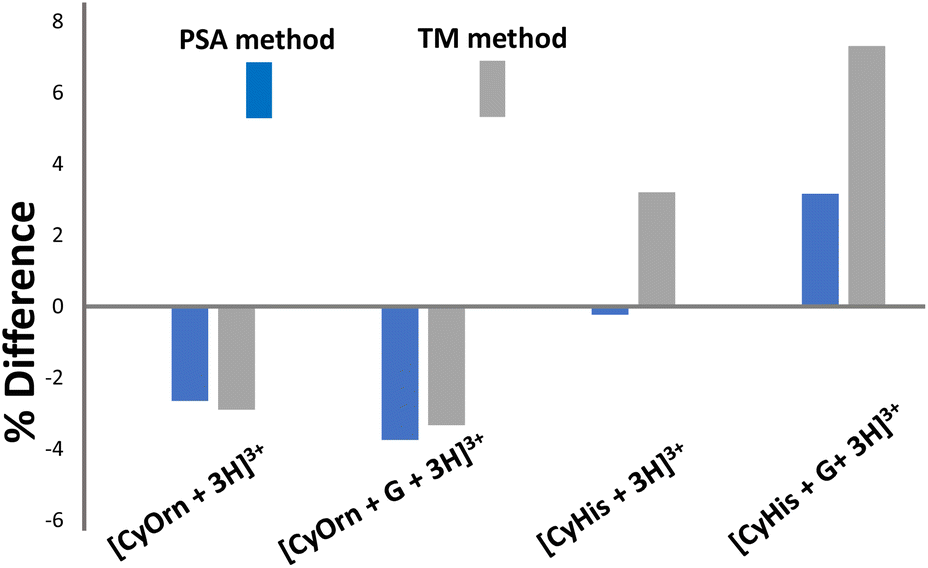 | ||
| Fig. 7 Plot of % CCS deviation (% difference = ((CALCCCS − TWCCSN2)/TWCCSN2) × 100) between values computationally calculated from molecular modelled structures using the PSA and TM methods with respect to the experimentally determined TWCCSN2 values. | ||
Experimental
Materials
The pseudopeptidic cages used in this study were synthesized as previously reported by us,12–15 while the Ac-Glu-Tyr-Glu-NH2 peptide (EYE) substrate was prepared by conventional solid-phase peptide synthesis. All the newly synthesized compounds were conveniently purified by reverse-phase semi-preparative HPLC, and their structure and purity confirmed by convenient spectroscopic (NMR, ESI-MS) and analytical (HPLC) techniques. Angiotensin I and PolyAlanine were purchased from Sigma Aldrich.ESI-MS and CID experiments
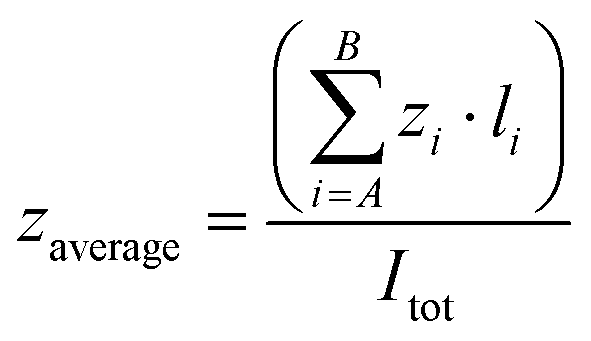
A Q-TOF Premier (Waters) mass spectrometer with an electrospray source operating in the V-mode was used. Sample solutions were prepared as follows: to 1 mM aqueous solutions of one of the hosts were added increasing amounts of EYE. The resulting mixture was diluted with water or buffered water to a final 10 μM concentration and analyzed by positive ESI-MS. The drying gas as well as the cone gas was nitrogen at a flow of 300 L h−1 and 30 L h−1, respectively. A capillary voltage of 3.0 kV was used in the positive scan mode. The temperature of the source block was set to 110 °C and the desolvation temperature was set to 150 °C. The cone voltage was adjusted typically to Uc = 10 V to control the extent of fragmentation. Mass calibration was performed using NaI solutions in isopropanol:water (1:1) from m/z 50–3000. The parameter used to describe a given charge state distribution is the average charge state (zaverage). This parameter was calculated from mass spectra as:where A and B are the lowest and the highest charge states of a distribution, z is the charge state, and I is signal intensity measured as peak height.
For collision induced dissociation (CID) experiments, the complete isotopic envelope of the 1:1 host:guest adducts of interest was mass-selected with the first quadrupole and interacted with argon in the T-wave collision cell while analyzing the ionic fragments with the TOF analyzer. The collision energy (CElab) was systematically stepped up in the CElab = 1–17 eV range. Relative abundance of the precursor ion was calculated as Ip/(Ip + ∑Ifrag), where Ip is the peak intensity of the precursor ion, and ∑Ifrag is the sum of the peak intensities corresponding to all fragments. This ratio is used to monitor the internal energy added to the complex ions to dissociate. The maximum energy that ions can acquire in the collision cell is the center-of-mass collision energy (CECoM) of each collision summed overall. Laboratory frame collision energies (CElab) are converted to center-of-mass energies using the equation CECoM = z × CElab × (m/m + M) where z is the charge state of the precursor ion and m and M are the mass of the target gas and of the complex ion, respectively. The guest ([EYE + H]+) and host [Cy + 2H]2+ product ions and the precursor [Cy + EYE + 3H]3+ ion were thus monitored. Their relative abundances from CID experiments were determined from mass spectra averaged over 120 scans. There was little variation (max. 3%) in the relative product ion abundances from three consecutive CID mass spectra.
ESI IMS-MS
ESI-IMS-MS experiments were performed using a SYNAPT XS high definition mass spectrometer (Waters Corporation, Manchester, UK) equipped with an electrospray ionization (ESI) source. The ion mobility separation occurs through the so-called triwave device that operates with three regions: trap, ion mobility separation, and transfer with a helium cell located between the trap and ion mobility separation regions. A capillary voltage was set to 1.5 kV operated in the positive ionization mode and in the resolution mode. Source settings were adjusted to keep intact the supramolecular adducts of interest. Typical values were a cone voltage of 20 to 40 V and a source offset of 4 V; source and desolvation temperatures were set to 110 and 350 °C, respectively. Cone and desolvation gas flows were 150 and 500 (L h−1), respectively. Calibration of the m/z axis up to m/z 1200 was performed using the routine implemented in intellistart from a mixture of sodium hydroxide and formic acid in 1:9 v/v H2O:isopropanol. The instrument was switched from TOF acquisition to mobility TOF acquisition mode and left for 30 minutes before recording TWIM mass spectra. The m/z 50–1200 range was investigated and ion mobility separation settings were used as follows: the traveling wave height was set to 40 V and wave velocity was set to 650 m s−1. The drift gas was nitrogen (N2) at a flow rate set to 90 mL min−1. The helium cell gas flow was 180.00 mL min−1. IMS DC values were as follow: entrance 20; helium cell DC 50; helium exit −20; bias 3; exit 0. Trap DC bias was 45 V; entrance, 3; exit 0. The TWIM-MS data were processed using Masslynx 4.2 (SCN 982). All ions of interest displayed a Gaussian-shaped arrival time distribution profile. Ion mobility spectra of the species of interest were extracted using a 0.15 Da mass window and were converted from waters.raw to .txt files. Gaussian fitting of the IM data was applied to improve the precision of the drift time measurements. The reported drift time values were obtained by Gaussian peak fitting using origin 6.0 (Microcal) rendering good correlation in all cases. Each sample was recorded by triplicate on the same day and the deviation in the drift time values was less than 0.5%.
CCS calibration
Drift times were converted into CCS following the CCS calibration protocol reported by Ruotolo.49 Calibration of the IMS device for determining collision cross-sectional areas from drift time measurements was performed using a mixture of polyalanine reference ions (a series of doubly-charged [(Ala)n + 2H]2+ and triply-charged [(Ala)n + 3H]3+ species) and angiotensin I [(angiotensin I + 3H]3+ species covering the transit time of the investigated ions. Their DTCCSN2 values were taken from the literature (angiotensin I72 and polyAlanine27). As the TWIMS device is operated with N2 buffer gas, the obtained TWCCS values will be denoted as TWCCSN2. Drift times (tD) were subjected to correction for mass-dependent and mass-independent flight times according to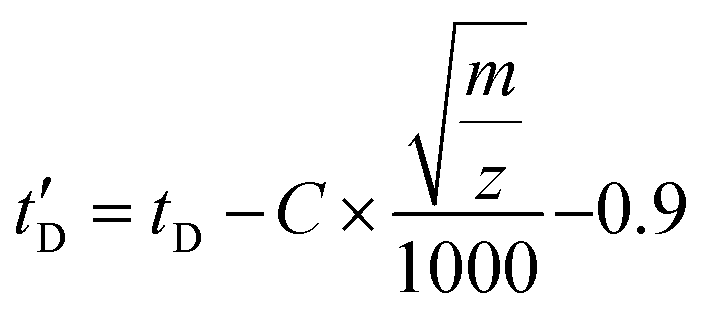 (C = 1.5 and the term 0.9 ms is the mass-independent time to account for the time of transit of one wave in the IMS and the transfer region). The literature CCS values were converted to CCS′ according to
 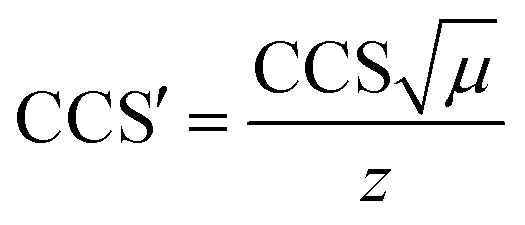 where μ and z stands for the reduced mass of the collision partners and the charge state, respectively. The calibration curve is represented as CCS′ as a function of t′D using a power law,73 CCS′ = A × (t′D)B. Constants A and B were subsequently derived from the calibration plot and used to calculate cross-sectional areas (TWCCSN2) of unknown species from corrected drift time measurements extracted for specific m/z values from the data. Tables S1 and S2† collect the list of doubly and triply charged IM calibrants, respectively, including charge state, experimental drift time, corrected drift time and published collision cross sections DTΩN2 (Å2).
Calculated CCS with TM and PSA methods
PSA calculations were performed on the PSA WebServer (v0.5.1, psa.chem.fsu.edu) parametrized for N2 as buffer gas using default parameters.67–70 Atomic coordinates were exported as .xyz files from minimized energy models in the pdb format. For TM calculations, IMoS 1.10 was used.71 Atomic coordinates were exported as .xyz files from minimized energy models in the pdb format. For TM methods, the potentials employed are standard TM Lenard-Jones (LJ) methods using a 4-6-12 potential. The number of rotations was 3 with 300000 gas molecules per rotations. Positive charges were located at the specific atoms (see the Molecular modeling section) in the .xyz file for TM calculation.
Fluorescence spectroscopy titrations
Fluorescence emission and excitation spectra were collected on a Photon Technology International Instrument, the Fluorescence Master Systems, with an excitation bandwidth: 9 nm, emission bandwidth: 15 nm, light source: xenon flash lamp (1 J per flash), emission read every 1 nm. All the fluorescence experiments were performed at 20 °C and in cuvettes with a path length of10 mm. The different peptide-cage titrations were conducted in a 700 μL fluorescence cuvette following the protocol as previously reported in ref. 14. A solution of the peptide (100, 10 or 1 μM) was prepared in buffered water (50 mM Tris, pH 7.5). 300 μL of the peptide solution was titrated with a solution of the cage (1–4 mM) in buffered water (50 mM Tris, pH 7.5) containing the titrated peptide in the same concentration (100, 10 or 1 μM) to maintain the peptide concentration constant throughout the whole titration. The peptide concentration was adjusted for each titration to the concentration that prevents precipitation events and allows to get a larger number of meaningful experimental points for the fitting. The excitation wavelength was λex: 276 nm and the emission window recorded was adjusted for each peptide to acquire the emission band for the excimer λem 290–500/550 nm. The HypSpec74 software was used to fit the fluorescence titration data to every proposed interaction model. This software performs the global fitting of the whole emission band (or a selected range) for each titration point, to satisfy the interaction model in each case.Molecular modelling
All the molecular models were performed with Macromodel as in Maestro Version 12.3.013, MMshare Version 4.9.013, Release 2020-1, from Schrödinger. Molecular models of protonated CyOrn and CyHis, and their most stable complexes with the EYE tripeptide were obtained by Monte Carlo conformational searches with OPLS3e75 minimizations in implicit water solvent76 and in vacuum. For CyOrn, we considered protonation of three Orn primary amines, since these are more basic than the core secondary amines and this would also maximize the distance between charges of the same sign. Molecular modelling of CyHis with either side-chain or core-amine triprotonation suggested that protonation in the core is more favourable. To build the corresponding cage–EYE complexes, we followed a similar approach. Thus, in relation to the expected acid–base properties, we considered dianionic EYE substrate (with the Glu side chains ionized). Accordingly, the observation of the ESI-MS triply-charged complexes with the cages implies the attachment of five protons to the receptors. Following the same rationale and for consistency, these protons were located in the side chains of CyOrn but in the core of CyHis. Actually, in the case of CyHis–EYE, the corresponding complex protonated at the imidazoles was also considered rendering a much less stable structure. The host–guest relative dispositions were manually docked following previous knowledge on similar systems and the data obtained in solution, i.e. inclusion of the Tyr in the cage cavity.Conclusions
The binding properties of the EYE tripeptide (G) to the series of pseudopeptidic cages were studied using various analytical tools both in solution and in the gas phase. Two distinctive G affinities are observed: weak G binding to those cages with acidic groups (CyAsp and CyGlu) and tighter EYE peptide binding to cages bearing basic groups (CyLys, CyOrn and CyHis). For the latter cages, the Tyr inclusion within the cage is modulated by secondary electrostatic interactions between the basic side chains decorating the external side of the cage and the glutamic residues around the tyrosine in the tripeptide. Such secondary interactions have a profound impact on the magnitude of the binding constants with CyLys, CyOrn and CyHis cages displaying a wide range of Kd values encompassing up to one order of magnitude in solution. This observation paves the way to further design cages for the selective recognition of Tyr residues located at a specific peptide sequence.A series of MS methods was used to characterize the supramolecular G:cage complexes and prove their intrinsic gas-phase stability. The negligible guest complex formation with CyAsp and CyGlu shown by single-stage ESI-MS suggests weaker guest binding than that observed for the CyHis, CyOrn and CyLys cages in agreement with the solution affinities determined by fluorescence spectroscopy. Thus, as in solutions, the selectivity in G recognition is mainly due to polar (ionic or H-bonding) interactions with the basic pendant groups, which are retained and even strengthened in the gas phase. This observation, together with the reduced binding abilities upon pH raising points to a crucial role of cage protonation in the binding event. However, the correlation between gas-phase dissociation (CECOM50%) and solution dissociation constants (Kd) is not perfect for CyHis, CyLys and CyOrn. CyHis features the tightest binding in both media. CyLys and CyOrn display virtually identical gas-phase dissociation characteristics whereas in solution the Kd value for CyLys is ca. half of that for CyOrn. Although soft ionization MS methods can be used to study a wide spectrum of host:guest systems based on biomolecules, the extent to which the technique is useful for studying binding affinities depends critically on the inherent nature of the noncovalent interactions involved in the host:guest complex. For the investigated Cy:G complexes, where electrostatic and a complex network of hydrogen bonding has been shown to play a predominant role in noncovalent complexation, the energetics of gas-phase binding more closely reflect aqueous solution behaviour. Thus, we envision that MS methods may be used as a high-throughput assay for Cy-guest complexation or in screening peptide libraries.
The use of novel analytical approaches such as IMS-MS was also introduced to obtain structural and conformational insights on the empty cages and their corresponding complexes with the EYE tripeptide. These pseudopeptidic hosts display a series of favourable characteristics, such as robustness, ESI-amenability and most importantly shape-adaptability that prompt us to undertake its study by ESI-IMS-MS aimed to link structures to unique functions and potentially add significant value to the field. In the present work, IMS-MS analysis has provided the first physical analysis related to the dimensions of the Cy cages in the gas phase, allowing us to monitor the change in the CCS in response to the scaffold alteration upon binding. Moreover, the inner cavity of the Cy cages is flexible enough to adjust its shape to accommodate the EYE guest according to a mechanism reminiscent of the induced-fit enzyme model formulated by Koshland77 in which allosteric regulation through conformational changes upon binding attains a tight binding between a molecular host (both synthetic or natural) and a guest.78 Hence, it is demonstrated that combining rigid and flexible moieties in the Cy cages circumvents the characteristic lower binding affinities attained by synthetic receptors that display strong rigidity (typically lower peptide affinity because the impossibility to adjust its shape to match its target) or large flexibility (that often display low pre-organization). These IMS-MS results provide a basis for refining the conformational and structural characteristics of the Cy cages and their supramolecular complexes otherwise inaccessible by other analytical techniques.
Conflicts of interest
There are no conflicts to declare.Acknowledgements
Financial support from the Spanish Ministry of Science and Innovation and the Spanish Research Agency (RTI2018-096182-B-I00, RED2018-102331-T, PID2021-128411NB-I00, MCI/AEI/10.13039/501100011033, and FEDER/EU) and AGAUR (2017 SGR 208) and personal support for L. Tapia (BES-2016-076863) are gratefully acknowledged. We also thank Naiara Solozabal for technical assistance in performing the NMR experiments. We are grateful to the Serveis Centrals d'Instrumentació Científica (SCIC-UJI) for providing the spectroscopy facilities. We acknowledge support of the publication fee by the CSIC Open Access Publication Support Initiative through its Unit of Information Resources for Research (URICI).References
- E. A. Villar, D. Beglov, S. Chennamadhavuni, J. A. Porco, D. Kozakov, S. Vajda and A. Whitty, Nat. Chem. Biol., 2014, 10, 723–731 CrossRef CAS PubMed.
- I. Alfonso and J. Solà, Chem. – Asian J., 2020, 15, 986–994 CrossRef CAS PubMed.
- W. C. Still, Acc. Chem. Res., 1996, 29, 155–163 CrossRef CAS.
- M. W. Peczuh and A. D. Hamilton, Chem. Rev., 2000, 100, 2479–2494 CrossRef CAS PubMed.
- R. E. McGovern, H. Fernandes, A. R. Khan, N. P. Power and P. B. Crowley, Nat. Chem., 2012, 4, 527–533 CrossRef CAS PubMed.
- L. A. Logsdon, C. L. Schardon, V. Ramalingam, S. K. Kwee and A. R. Urbach, J. Am. Chem. Soc., 2011, 133, 17087–17092 CrossRef CAS PubMed.
- L. C. Smith, D. G. Leach, B. E. Blaylock, O. A. Ali and A. R. Urbach, J. Am. Chem. Soc., 2015, 137, 3663–3669 CrossRef CAS PubMed.
- J. E. Beaver and M. L. Waters, ACS Chem. Biol., 2016, 11, 643–653 CrossRef CAS PubMed.
- S. van Dun, C. Ottmann, L.-G. Milroy and L. Brunsveld, J. Am. Chem. Soc., 2017, 139, 13960–13968 CrossRef CAS PubMed.
- Z. Hirani, H. F. Taylor, E. F. Babcock, A. T. Bockus, C. D. Varnado, C. W. Bielawski and A. R. Urbach, J. Am. Chem. Soc., 2018, 140, 12263–12269 CrossRef CAS PubMed.
- Synthetic Receptors for Biomolecules, ed. B. Smith, Monographs in Supramolecular Chemistry, The Royal Society of Chemistry, 2015 Search PubMed.
- A. Moure, S. V. Luis and I. Alfonso, Chem. – Eur. J., 2012, 18, 5496–5500 CrossRef CAS PubMed.
- E. Faggi, A. Moure, M. Bolte, C. Vicent, S. V. Luis and I. Alfonso, J. Org. Chem., 2014, 79, 4590–4601 CrossRef CAS PubMed.
- E. Faggi, Y. Pérez, S. V. Luis and I. Alfonso, Chem. Commun., 2016, 52, 8142–8145 RSC.
- L. Tapia, N. Solozabal, J. Solà, Y. Pérez, W. T. Miller and I. Alfonso, Chem. – Eur. J., 2021, 27, 9542–9549 CrossRef CAS PubMed.
- P. Bayat, D. Gatineau, D. Lesage, S. Marhabaie, A. Martinez and R. B. Cole, J. Mass Spectrom., 2019, 54, 437–448 CrossRef CAS PubMed.
- D. M. Williams, D. Wang and P. A. Cole, J. Biol. Chem., 2000, 275, 38127–38130 CrossRef CAS PubMed.
- M. D. Haskell, J. K. Slack, J. T. Parsons and S. J. Parsons, Chem. Rev., 2001, 101, 2425–2440 CrossRef CAS PubMed.
- V. Poongavanam, E. Danelius, S. Peintner, L. Alcaraz, G. Caron, M. D. Cummings, S. Wlodek, M. Erdelyi, P. C. D. Hawkins, G. Ermondi and J. Kihlberg, ACS Omega, 2018, 3, 11742–11757 CrossRef CAS PubMed.
- C. Peng, Y. Atilaw, J. Wang, Z. Xu, V. Poongavanam, J. Shi, J. Kihlberg, W. Zhu and M. Erdélyi, ACS Omega, 2019, 4, 22245–22250 CrossRef CAS PubMed.
- L. A. Viarengo-Baker, L. E. Brown, A. A. Rzepiela and A. Whitty, Chem. Sci., 2021, 12, 4309–4328 RSC.
- E. Danelius, V. Poongavanam, S. Peintner, L. H. E. Wieske, M. Erdélyi and J. Kihlberg, Chem. – Eur. J., 2020, 26, 5231–5244 CrossRef CAS PubMed.
- J. A. Loo, Int. J. Mass Spectrom., 2000, 200, 175–186 CrossRef CAS.
- S. Banerjee and S. Mazumdar, Int. J. Anal. Chem., 2012, 2012, 282574 Search PubMed.
- M. Kogej and C. A. Schalley, Mass Spectrometry and Gas Phase Chemistry of Supramolecules, in Analytical Methods in Supramolecular Chemistry, ed. C. A. Schalley, 2007 Search PubMed.
- J. S. Brodbelt, Int. J. Mass Spectrom., 2000, 200, 57–69 CrossRef CAS.
- M. F. Bush, I. D. G. Campuzano and C. V. Robinson, Anal. Chem., 2012, 84, 7124–7130 CrossRef CAS PubMed.
- T. Wyttenbach and M. T. Bowers, J. Phys. Chem. B, 2011, 115, 12266–12275 CrossRef CAS PubMed.
- E. Jurneczko and P. E. Barran, Analyst, 2011, 136, 20–28 RSC.
- N. Geue, R. E. P. Winpenny and P. E. Barran, Chem. Soc. Rev., 2022, 51, 8–27 RSC.
- F. Lanucara, S. W. Holman, C. J. Gray and C. E. Eyers, Nat. Chem., 2014, 6, 281–294 CrossRef CAS PubMed.
- E. Kalenius, M. Groessl and K. Rissanen, Nat. Rev. Chem., 2019, 3, 4–14 CrossRef CAS.
- J. Y. Han, T. S. Choi, C. E. Heo, M. K. Son and H. I. Kim, Mass Spectrom. Rev., 2019, 38, 483–500 CrossRef CAS PubMed.
- C. Nortcliffe, L. G. Migas, X. Liu, H. T. Ngo, K. A. Jolliffe and P. E. Barran, Int. J. Mass Spectrom., 2015, 391, 62–70 CrossRef CAS.
- A. L. H. Gray, C. A. Steren, I. W. Haynes, G. A. Bermejo, F. Favretto, M. Zweckstetter and T. D. Do, J. Phys. Chem. B, 2021, 125, 1378–1391 CrossRef CAS PubMed.
- I. W. Haynes, G. Wu, M. A. Haque, H. Li and T. D. Do, Anal. Chem., 2019, 91, 13439–13447 CrossRef CAS PubMed.
- C.-L. Tsai, S.-Y. Wu, H.-K. Hsu, S.-B. Huang, C.-H. Lin, Y.-T. Chan and S.-K. Wang, Nanoscale, 2021, 13, 4592–4601 RSC.
- J. Shen and D. V. Dearden, Isr. J. Chem., 2018, 58, 225–229 CrossRef CAS.
- F. Yang and D. V. Dearden, Isr. J. Chem., 2011, 51, 551–558 CrossRef CAS.
- M. Zimnicka, E. Kalenius, J. Jurczak and W. Danikiewicz, Analyst, 2021, 146, 5337–5346 RSC.
- N. Alizadeh, R. Parchami, E. De Pauw and M. Tabrizchi, Int. J. Mass Spectrom., 2021, 461, 116512 CrossRef CAS.
- W. Zhang, A. Abdulkarim, F. E. Golling, H. J. Räder and K. Müllen, Angew. Chem., Int. Ed., 2017, 56, 2645–2648 CrossRef CAS PubMed.
- D. S. Oluwatoba, M. F. Islam, B. Som, A. J. Sindt, M. D. Smith, L. S. Shimizu and T. D. Do, J. Am. Soc. Mass Spectrom., 2022, 33, 840–850 CrossRef CAS PubMed.
- J. D. Carbeck, J. C. Severs, J. Gao, Q. Wu, R. D. Smith and G. M. Whitesides, J. Phys. Chem. B, 1998, 102, 10596–10601 CrossRef CAS.
- L. Testa, S. Brocca and R. Grandori, Anal. Chem., 2011, 83, 6459–6463 CrossRef CAS PubMed.
- I. A. Kaltashov and A. Mohimen, Anal. Chem., 2005, 77, 5370–5379 CrossRef CAS PubMed.
- L. Konermann, E. Ahadi, A. D. Rodriguez and S. Vahidi, Anal. Chem., 2013, 85, 2–9 CrossRef CAS PubMed.
- V. Gabelica, A. A. Shvartsburg, C. Afonso, P. Barran, J. L. P. Benesch, C. Bleiholder, M. T. Bowers, A. Bilbao, M. F. Bush, J. L. Campbell, I. D. G. Campuzano, T. Causon, B. H. Clowers, C. S. Creaser, E. De Pauw, J. Far, F. Fernandez-Lima, J. C. Fjeldsted, K. Giles, M. Groessl, C. J. Hogan Jr., S. Hann, H. I. Kim, R. T. Kurulugama, J. C. May, J. A. McLean, K. Pagel, K. Richardson, M. E. Ridgeway, F. Rosu, F. Sobott, K. Thalassinos, S. J. Valentine and T. Wyttenbach, Mass Spectrom. Rev., 2019, 38, 291–320 CrossRef CAS PubMed.
- B. T. Ruotolo, J. L. P. Benesch, A. M. Sandercock, S.-J. Hyung and C. V. Robinson, Nat. Protoc., 2008, 3, 1139–1152 CrossRef CAS PubMed.
- C. Vicent, A. Valls, J. Escorihuela, B. Altava and S. Luis, Chem. Commun., 2021, 57, 8616–8619 RSC.
- Aqueous solution pH may be decreased in the positive scan mode as a result of the electrolytic oxidation of water. Because of the inherent electrolytic nature of the ESI process, G. J. Van Berkel, F. Zhou and J. T. Aronson, Int. J. Mass Spectrom. Ion Processes, 1997, 162, 55–67 CrossRef CAS.
- G. Wang and R. B. Cole, Org. Mass Spectrom., 1994, 29, 419–427 CrossRef CAS.
- S. M. Liao, Q. S. Du, J. Z. Meng, Z. W. Pang and R. B. Huang, Chem. Cent. J., 2013, 7, 1 CrossRef PubMed.
- R. Loewenthal, J. Sancho and A. R. Fersht, J. Mol. Biol., 1992, 224, 759–770 CrossRef CAS PubMed.
- C. D. M. Churchill and S. D. Wetmore, J. Phys. Chem. B, 2009, 113, 16046–16058 CrossRef CAS PubMed.
- J. Heyda, P. E. Mason and P. Jungwirth, J. Phys. Chem. B, 2010, 114, 8744–8749 CrossRef CAS PubMed.
- K. Haghani, K. Khajeh, H. Naderi-Manesh and B. Ranjbar, Int. J. Biol. Macromol., 2012, 50, 1040–1047 CrossRef CAS PubMed.
- K. Dashtban, M. E. Akbari and N. Khajeh, Mol. Biol. Res. Commun., 2014, 3, 119 Search PubMed.
- L. Zhang, J.-C. Wang, L. Hou, P.-R. Cao, L. Wu, Q.-S. Zhang, H.-Y. Yang, Y. Zang, J.-P. Ding and J. Li, Sci. Rep., 2015, 5, 10115 CrossRef CAS PubMed.
- D. Neuhaus, Encycl. Magn. Reson., 2011 DOI:10.1002/9780470034590.emrstm0350.pub2.
- T. J. D. Jørgensen, D. Delforge, J. Remacle, G. Bojesen and P. Roepstorff, Int. J. Mass Spectrom., 1999, 188, 63–85 CrossRef.
- J. M. Daniel, S. D. Friess, S. Rajagopalan, S. Wendt and R. Zenobi, Int. J. Mass Spectrom., 2002, 216, 1–27 CrossRef CAS.
- V. H. Wysocki, G. Tsaprailis, L. L. Smith and L. A. Breci, J. Mass Spectrom., 2000, 35, 1399–1406 CrossRef CAS.
- L. Konermann, E. Aliyari and J. H. Lee, J. Phys. Chem. B, 2021, 125, 3803–3814 CrossRef CAS PubMed.
- I. K. Webb, C. E. Muetterties, C. B. Platner and J. C. Poutsma, Int. J. Mass Spectrom., 2012, 316–318, 126–132 CrossRef CAS.
- V. D'Atri, M. Porrini, F. Rosu and V. Gabelica, J. Mass Spectrom., 2015, 50, 711–726 CrossRef PubMed.
- C. Bleiholder, T. Wyttenbach and M. T. Bowers, Int. J. Mass Spectrom., 2011, 308, 1–10 CrossRef CAS.
- S. E. Anderson, C. Bleiholder, E. R. Brocker, P. J. Stang and M. T. Bowers, Int. J. Mass Spectrom., 2012, 330–332, 78–84 CrossRef CAS.
- C. Bleiholder, S. Contreras and M. T. Bowers, Int. J. Mass Spectrom., 2013, 354–355, 275–280 CrossRef CAS.
- C. Bleiholder, S. Contreras, T. D. Do and M. T. Bowers, Int. J. Mass Spectrom., 2013, 345–347, 89–96 CrossRef CAS.
- J. Coots, V. Gandhi, T. Onakoya, X. Chen and C. Larriba-Andaluz, J. Aerosol Sci., 2020, 147, 105570 CrossRef CAS.
- S. M. Stow, T. J. Causon, X. Zheng, R. T. Kurulugama, T. Mairinger, J. C. May, E. E. Rennie, E. S. Baker, R. D. Smith, J. A. McLean, S. Hann and J. C. Fjeldsted, Anal. Chem., 2017, 89, 9048–9055 CrossRef CAS PubMed.
- J. P. Williams and J. H. Scrivens, Rapid Commun. Mass Spectrom., 2008, 22, 187–196 CrossRef CAS PubMed.
- A. Gans, P. Sabatini and A. Vacca, Talanta, 1996, 43, 1739–1753 CrossRef PubMed , https://www.hyperquad.co.uk/HypSpec2014.
- K. Roos, C. Wu, W. Damm, M. Reboul, J. M. Stevenson, C. Lu, M. K. Dahlgren, S. Mondal, W. Chen, L. Wang, R. Abel, R. A. Friesner and E. D. Harder, J. Chem. Theory Comput., 2019, 15, 1863–1874 CrossRef CAS PubMed.
- W. C. Still, A. Tempczyk, R. C. Hawley and T. Hendrickson, J. Am. Chem. Soc., 1990, 112, 6127–6129 CrossRef CAS.
- D. E. Koshland, Proc. Natl. Acad. Sci. U. S. A., 1958, 44, 98–104 CrossRef CAS PubMed.
- D. E. Koshland Jr., Angew. Chem., Int. Ed. Engl., 1995, 33, 2375–2378 CrossRef.
Footnotes |
| † Electronic supplementary information (ESI) available. See DOI: https://doi.org/10.1039/d2an01091g |
| ‡ Because of the inherent electrolytic nature of the ESI process, aqueous solution pH may be decreased in the positive scan mode as a result of the electrolytic oxidation of water (see ref. 52). |
| This journal is © The Royal Society of Chemistry 2022 |