
 Open Access Article
 This Open Access Article is licensed under a
 Creative Commons Attribution 3.0 Unported Licence
Detection of lipid efflux from foam cell models using a label-free infrared method
Bowen
Xie
 a,
Wanjiku
Njoroge
a,
Lewis M.
Dowling
a,
Josep
Sulé-Suso
ab,
Gianfelice
Cinque
c and
Ying
Yang
*a
a,
Wanjiku
Njoroge
a,
Lewis M.
Dowling
a,
Josep
Sulé-Suso
ab,
Gianfelice
Cinque
c and
Ying
Yang
*a
aSchool of Pharmacy and Bioengineering, Keele University, Stoke-on-Trent, ST4 7QB, UK. E-mail: y.yang@keele.ac.uk
bOncology Department, Cancer Centre, University Hospitals of North Midlands, Stoke-on-Trent, ST4 6QG, UK
cMIRIAM beamline B22, Diamond Light Source, Harwell Science and Innovation Campus, Chilton-Didcot OX11 0DE, UK
First published on 20th October 2022
Abstract
Cardiovascular diseases are still among the leading causes of mortality and morbidity worldwide. The build-up of fatty plaques in the arteries, leading to atherosclerosis, is the most common cause of cardiovascular diseases. The central player in atherosclerotic plaque formation is the foam cell. Foam cells are formed when monocytes infiltrate from the blood stream into the sub-endothelial space, differentiating into macrophages. With the subsequent uptake and storage of lipoprotein, especially low-density lipoprotein (LDL), they change their phenotype to lipid laden cells. Lowering circulating LDL levels, or initiating cholesterol efflux/reverse cholesterol transport in foam cells, is one of the current clinical therapies. Prescription of the pleiotropic drugs, statins, is the most successful therapy for the treatment and prevention of atherosclerosis. In this study, we used a foam cell model from the macrophage cell line, RAW 246.7, and applied the label-free Fourier Transform Infrared Spectroscopy (FTIR) method, i.e. synchrotron-based microFTIR spectroscopy, to study the lipid efflux process initiated by statins in a dose and time dependent manner. We used glass coverslips as substrates for IR analysis. The optical images (visible and fluorescent light) clearly identify the localization and lipid distribution within the foam cells, and the associated changes before and after culturing them with atorvastatin at concentrations of 0.6, 6 and 60 μg mL−1, for a culture duration between 24 to 72 hours. MicroFTIR spectroscopic spectra uniquely displayed the reduction of lipid content, with higher lipid efflux observed at higher doses of, and longer incubation time with, atorvastatin. Principal Component Analysis (PCA) and t-distributed Stochastic Neighbor Embedding (t-SNE) analysis demonstrated defined cluster separation at both lipid (3000–2800 cm−1) and fingerprint (1800–1350 cm−1) regions, with more profound discrimination for the atorvastatin dose treatment than time treatment. The data indicate that combining synchrotron-based microFTIR spectroscopy and using glass substrates for foam cells can offer an alternative tool in atherosclerosis investigation at a molecular level, and through cell morphology.
Introduction
Cardiovascular disease (CVD) has been identified as the biggest killer in the developed world, with rising incidences in the developing world. Atherosclerosis is one of the starting points for most CVD, and is the underlying cause of 50% of all deaths in westernised societies.1,2 CVD covers a wide range of conditions that affect the heart and blood vessels. These include: coronary heart disease which results from the build-up of an atherosclerotic plaque in the coronary arteries; stroke resulting from obstructed blood supply to the brain; transient ischaemic attacks which are temporary disruptions to blood flow to the brain; peripheral arterial disease which refers to blockage of vessels in the limbs; and aortic disease which are conditions affecting the aorta, such as aortic aneurism.2Atherosclerosis is characterised by the accumulation of fatty and fibrous material beneath the intimal layer of arteries.3,4 This accumulation of fatty material is initiated by elevated levels of cholesterol in the blood, which in turn leads to endothelial activation and inflammation. Studies into the pathogenesis of atherosclerosis have identified low-density lipoprotein (LDL) particles as the cause of atherosclerosis,4 with their accumulation into the sub-endothelial space leading to the formation of atherosclerotic plaques.5 Passage of LDL into the sub-endothelial space is facilitated through endothelial LDL receptors, specifically scavenger receptors.6
Macrophages are a key cell type in the pathogenesis of atherosclerosis. As a result of steady lipid accumulation, the dysfunctional endothelium, which secrets cytokines and expresses adhesion molecules, recruits monocytes from circulation and surrounding tissue.7 The recruited monocytes infiltrate the sub-endothelial space, differentiating into macrophages and dendritic cell like phenotypes.8 Once exposed to atherogenic lipoproteins, macrophages become foam cells, which are lipid laden cells created through the excessive influx of modified low-density lipoprotein, such as oxidized LDL (oxLDL), as well as the accumulation of cholesterol esters. These lipid laden foam cells then aggregate and proliferate, further contributing to plaque progression by inducing the release of inflammatory mediators that increase lipoprotein retention, sustained chronic inflammation, and extracellular matrix (ECM) modification.8,9
Macrophages have one of two defined phenotypes, i.e., M1 or pro-inflammatory and M2 or anti-inflammatory. Within this general definition, factors that affect their phenotype are dependent on recruiting signals and the macrophage location, resulting in a spectrum of activation between M1 and M2, a collection of which can be found within the atherosclerotic lesions.10–12 A number of factors are capable of affecting macrophage activation, and these include bacterial components, oxidatively modified molecules, and changes in their microenvironment, such as endoplasmic reticulum (ER) stress.10 There is still ongoing investigation into the inflammatory phenotype of foam cells, with data indicating complex, and also contrasting, situations with both enhanced and decreased production of pro-inflammatory cytokines by atherogenic foam cells.13
Statins are the most commonly used drugs for both the treatment and prevention of atherosclerosis. They work by lowering circulating LDL levels through inhibition of 3-hydroxy-3-methylglutaryl coenzyme A (HMG-CoA).14 The incidence of cardiovascular disease is more inversely related to cholesterol efflux capacity, than to high density lipoprotein (HDL) levels.15,16 Regarding foam cells, debate still remains as to the effect statins, specifically atorvastatin, have on initiating cholesterol efflux/reverse cholesterol transport (RCT). Some studies have reported an inhibitory effect of atorvastatin on foam cell models. It was found that atorvastatin enhanced cholesterol efflux and decreased cholesterol content in a dose dependent manner.17,18 These data suggest that atorvastatin is able to switch macrophages from a pro-inflammatory to an anti-inflammatory phenotype, an observation supported by Cheng et al.,14 who noted that atorvastatin was able to modulate the Th1/Th2 response in patients with chronic heart failure through inhibition of Th1 cytokine production.14
The evaluation of cholesterol efflux is commonly conducted using radioisotope labelled cholesterol that is loaded into cells and quantified.19–21 Alternatively, safer methods have been employed, in which the stable isotope, D7 cholesterol ([d7]C), is used, but quantification involves extraction of internalised cholesterol from lysed cells.15 To better understand the role which statins have in initiation of cholesterol efflux/RCT, the dose effect of statin and responding time on RCT, a non-destructive and label free characterisation tool is required.
Ultraviolet–Visible (UV-Vis) spectroscopy has a long application history, and is still the most widely used optical analysis method for molecular chemicals. A rapid and non-destructive UV-Vis application, Diffuse Reflectance Spectroscopy (DRS) has been applied in qualitative and quantitative analysis with relatively high resolution and low cost, where the UV radiation can only be absorbed by valence electron functional groups with very low excitation energy.22,23 Consequently, UV-Vis has made more contributions the fields to geology and chemistry in the past few decades. At the level of macromolecule analysis, Fourier-transform infrared (FTIR) and Raman spectroscopies have both great accuracy and specificity, and show a complementary vibrational spectrum in most cases.24 The common advantage of FTIR and Raman spectroscopies is their label-free feature. The ease of use, lower maintenance, and higher sensitivity make FTIR spectroscopy more worthwhile for anhydrous specimens.25
Synchrotron radiation covers wavelengths from the range of far infrared to X-ray, and can provide a diffraction limited source with unique broadband-ness in comparison to conventional laboratory sources. Thus, application of synchrotron radiation for FTIR microspectroscopy as a diffraction limited source endorsed with high brilliance (i.e., more than two orders higher than thermal ones),26,27 enables the observation of micrometer scale features with a spectral quality across the whole IR range, which is prevented by the use of conventional sources. Recent studies have proven the benefits of using synchrotron based FTIR on biological and clinical microsamples, where multiple spectra are generated accurately with a high spatial resolution, while simultaneously having no issue of radiation damage.28–30
In this work, we used synchrotron-based microFTIR spectroscopy at Diamond Light Source MIRIAM beamline B22 to study foam cell models, through activation of macrophages via intake of LDL.31,32 The effect of atorvastatin on the efflux of LDL has been investigated using this label-free method at a single cell level. This study demonstrates atorvastatin's ability to initiate reverse cholesterol transport in a dose dependent manner, resulting in reduced amounts of internalised cholesterol, and reduced nitric oxide (NO) production in activated macrophages. Through the use of the synchrotron microFTIR spectroscopy, we probed differences in activation states of macrophages under the influence of atorvastatin, also in a dose or reaction time dependent manner. Furthermore, we used glass coverslips as sampling substrate,33 instead of conventional IR window materials. The combination of a label-free method, in this case synchrotron-based microFTIR spectroscopy, and with a commercially economical substrate can become a new tool in atherosclerosis investigation at a single cell level.
Materials and methods
RAW264.7 cell culture and biochemical analysis
Murine macrophage cell line, RAW264.7 (ATCC), was induced into M1 phenotype by treatment with 100 ng mL−1 LPS (Merck) and 100 ng mL−1 IFN-γ (Peprotech), followed by stimulation with 100 μg mL−1 LDL (2Bscientific) for 24 h to generate foam cells. Foam cells were then incubated with atorvastatin (Active Pharma Supplies Ltd) at 0.6 μg mL−1, 6 μg mL−1, and 60 μg mL−1 to investigate the efflux effect on the internalised lipid. Dynamic efflux was studied by incubating the foam cells with 6 μg mL−1 atorvastatin for 24 h, 48 h, and 72 h. These experimental variable settings were based on clinical information (up to 120 mg atorvastatin being taken daily, with detection of mean plasma concentration of atorvastatin 14 ng mL−1 24 hours after intake)34 and our preliminary trial outcome. Typically, 2.5 × 10⁵ RAW264.7 cells were seeded in individual wells in a 24-well plate. Media was collected at each sampling time point. The control wells were those cultured in untreated culture media, and those treated with either atorvastatin or LDL alone.Imaging of dynamic efflux was taken following a 20-minute fixation with 4% paraformaldehyde (PFA), and staining with 1 μg mL−1 Nile red (Merck). The dye was added to samples for 20 minutes at room temperature, followed by two PBS washes. DAPI, used as counterstaining dye at 10 ng mL−1, was then added, followed by a 10-minute incubation at room temperature. DAPI solution was aspirated, and cells washed a further two times with PBS for imaging.
Nitric oxide (NO) quantification was conducted by mixing culture media samples at 1![[thin space (1/6-em)]](https://www.rsc.org/images/entities/char_2009.gif) :1 volume ratio with Griess buffer (1% sulphonamide, 2.5% phosphoric acid and 0.1% naphthalene–diamine–hydrochloride), followed by measurement of absorption with a plate reader (Biotec) set at 546 nm.35
:1 volume ratio with Griess buffer (1% sulphonamide, 2.5% phosphoric acid and 0.1% naphthalene–diamine–hydrochloride), followed by measurement of absorption with a plate reader (Biotec) set at 546 nm.35
MicroFTIR spectroscopic analysis
After treatment for each time point and dynamic efflux studies, all the foam cells were trypsinised, then cytocentrifuged at relative centrifugal force of 90g for 1 minute with a cytospin™ 4 centrifuge (Fisher Scientific). The cytofunnel contained 20 μL cell suspension with about 2 × 10⁴ cells per sample. A microscope glass coverslip (24 × 50 mm), of 0.13 to 0.17 mm thickness (GalvOptics), was inserted between a 1 mm thick glass slide and the filter card before cytospinning, allowing the foam cells to attach to the coverslip. The cytospun cells were then fixed with 4% Paraformaldehyde and washed with saline solution (0.9% NaCl) and deionized water, then air dried at room temperature. The visible images of the cytospun cells were taken by an Olympic microscope.MicroFTIR spectra of prepared specimens were collected in transmission mode via a 36× magnification objective/condenser, in the HYPERION 3000 (Bruker) microscope at MIRIAM beamline B22 of Diamond Light Source.36 FTIR spectra in the range of 4000–1000 cm−1, with 4 cm−1 resolution and 512 co-added scans per cell spectrum, were collected using slit size at the sample of 15 μm × 15 μm, i.e., fitting the single cell size. Averagely, 50 cells per group were analysed and their spectra were collected.
The spectra between 1800–1350 cm−1 (partial fingerprint region) and 3000–2800 cm−1 (lipid rich region) regions of interest were cut from the intact FTIR spectra, and correlated via rubber band type baseline correction, then a Savitzky–Golay filter was applied at window level 15 to obtain the 2nd derivative of spectra. The data were respectively post-processed via two dimensionality reduction methods: PCA and t-SNE.37,38 An average of 50 spectra per group were analysed, and all the data correction and post-processing were conducted through the QUASAR software (https://zenodo.org/record/4617978).39 Relative changes of key peak intensities caused by engulfing of LDL and atorvastatin treatment in both protein and lipid rich region were calculated via GraphPad Prism 8.
Statistical analysis
Statistical analysis of NO data was carried out using GraphPad Prism 8. Two-way ANOVA was used to analyse the data sets represented for NO quantification. The data presented is the representative of mean ± SEM, n = 5. A value of p < 0.05 was considered to be statistically significant.The statistics of PCA data was output from Quasar software. The continuous attributes of principal components in PCA analysis were displayed as histograms to fit normal distribution, all residuals of PC1 and PC2 in efflux study and time efflux study were normally distributed. A significance of PC1 and PC2 at the spectra regions of interest was then measured via ANOVA, the p < 0.05 was taken as statistically significant.
Results
LDL intake and Atorvastatin effect on efflux over culture time
Fig. 1 shows the bright field images of the foam cells cytospun on the GalvOptics coverslips. The internalized lipid in the macrophages appeared as bright lines or dots densely packed along the cell membrane of the foam cells (Fig. 1a(B), clearer images in insets). Additionally, a less bright layer covering the whole cytoplasm compared to plain macrophages (Fig. 1a(A)), in which no bright content was noticeable along cell membrane peripheries, and the cytoplasm was dark/grey in colour. With the addition of atorvastatin, especially with 6 and 60 μg mL−1 dose, for 24-hour culture, the densely packed bright lines/dots disappeared considerably in all cells, and small bright dots presented in cytoplasm. The bright layer covering the bulk of the cytoplasm was replaced by dark/grey colouration. The sample with 60 μg mL−1 atorvastatin treatment showed a large contrast in morphology to that without atorvastatin treatment (Fig. 1a(E)). Fig. 1b reveals the bright field images of foam cells subjected to 6 μg mL−1 atorvastatin treatment, for different culture durations. The appearance and disappearance of the bright lines/dots within foam cells was very similar to those in Fig. 1a with atorvastatin treatment. It is apparent that a longer incubation with atorvastatin resulted in fewer bright lines/dots within the foam cells. By the 72-hour time point, there were very few bright dots remaining in the cells. | ||
| Fig. 1 1(a) Bright field image of foam cells treated with different concentrations of atorvastatin for 24 hours and cytospun on the GalvOptics coverslips. (A) M1 cells (RAW cells stimulated by 100 ng mL−1 LPS and IFN-γ for 24 hours); (B) foam cells generated through culturing the M1 cells with 100 μg mL−1 LDL for 24 hours without atorvastatin; (C) foam cells treated with 0.6 μg mL−1 atorvastatin; (D) foam cells treated with 6 μg mL−1 atorvastatin; (E) foam cells treated with 60 μg mL−1 atorvastatin. The inset shows the location of lipid as white lines and dots more clearly at high magnification. Scale bar = 100 μm. 1(b) Bright field image of foam cells treated with 6 μg mL−1 atorvastatin for different durations and cytospun on the GalvOptics coverslips. (A) M1 cells (RAW cells stimulated by 100 ng mL−1 LPS and IFN-γ for 24 hours); (B) foam cells generated through culturing the M1 cells with 100 μg mL−1 LDL for 24 hours without the addition of atorvastatin; (C) foam cells incubated with the atorvastatin for 24 hours; (D) foam cells incubated with the atorvastatin for 48 hours; (E) foam cells incubated with the atorvastatin for 72 hours. The inset shows the location of lipid as white lines and dots more clearly at high magnification. Scale bar = 100 μm. | ||
Fig. 2 shows images of Nile red stained foam cells under variable culture conditions. It was demonstrated that the LDL loaded samples, without atorvastatin, displayed strong and sharp bright red fluorescence on nearly all cell membranes, in addition to red dots throughout the cytoplasm. Clearly, atorvastatin had an effect on efflux of internalised LDL, an effect observable after 24 hours at the highest dose used, 60 μg mL−1, and again after 72 hours, also at the two highest doses used, 6 μg mL−1 and 60 μg mL−1. Across all samples, cell density decreases over time, with the greatest reduction in cell numbers observed at 60 μg mL−1. Cells appeared slightly larger at the 48-hour time point compared to 24 hours for all samples, and smaller at the 72-hour time point compared to both 24 and 48 hours, especially the cells dosed with 60 μg mL−1, and to a lesser extent, 6 μg mL−1 atorvastatin. Some spindle shaped cells were also visible after 72 hours in the LDL only and 0.6 μg mL−1 atorvastatin treated samples, with some elongated/irregularly shaped cells presented in the 6 and 60 μg mL−1 atorvastatin treated samples.
 | ||
| Fig. 2 Nile red staining showing atorvastatin dose effect on LDL efflux. Over the course of 72 hours of culture, RAW264.7 cells cultured with LDL showed denser accumulation of lipid droplets compared to the drug treated samples, with 60 μg mL−1 atorvastatin demonstrating the lowest density of droplets after 72 hours, followed closely by 6 μg mL−1. Red = Nile red; blue = DAPI. Scale bar = 50 μm. | ||
NO production in foam cells
The NO data presented in Fig. 3 indicates that atorvastatin, used at 6 μg mL−1, was able to lower NO production in RAW264.7 cells. Atorvastatin was able to significantly reduce RAW264 NO production compared to untreated control (p = 0.001), and also significantly in comparison to LDL treated samples (p = 0.0086). Inclusion of atorvastatin resulted in a decrease in quantifiable NO in RAW264.7 cells. LDL was also shown to restrict RAW264.7 NO production (p = 0.0001), an effect that was enhanced by atorvastatin. | ||
| Fig. 3 NO assay results showing atorvastatin's effect on production of NO by RAW264.7 cells following stimulation with LDL and 6 μg mL−1 atorvastatin for 24-hour incubation. The data represents mean ± SEM, n = 5. Significance denoted by ***, p = 0.001. Control: M0 macrophages, in comparison to LDL contained control (LDL). | ||
Characterisation of treated foam cells by synchrotron based FTIR spectroscopy
The average spectra at 3000–2800 cm−1 and 1800–1350 cm−1 wavenumber region of foam cells treated with different atorvastatin doses are shown in Fig. 4. It can be seen that the control group, i.e., foam cells without atorvastatin treatment, exhibited strong peaks at 2851 cm−1 and 2925 cm−1 of the lipid region, and the M1 cells showed lowest intensity in the two peaks. In contrast, the atorvastatin treated foam cells demonstrated a reduction of the lipids’ peak intensity, which indicated a lower lipid content in these cells (Fig. 4A), and the decreases observed were dose dependent. This efflux effect was also clearly demonstrated in the fingerprint region peaking at 1730, 1652 and 1545 cm−1. With a higher dose of atorvastatin applied, i.e., 6 and 60 μg mL−1, the peaks’ intensities were reduced further between 1800 cm−1 and 1350 cm−1, in comparison to the group with the lower dose, i.e., 0.6 μg mL−1 (Fig. 4B). Uniquely, M1 cells did not show a peak at 1730 cm−1, hence this peak was quite possibly linked to LDL. The results demonstrated the efflux effect of atorvastatin on internalized LDL, where internalized lipids were decreased by atorvastatin at an effective dose range, and proportionally to dose. However, a low dose treatment left the fingerprint region less affected.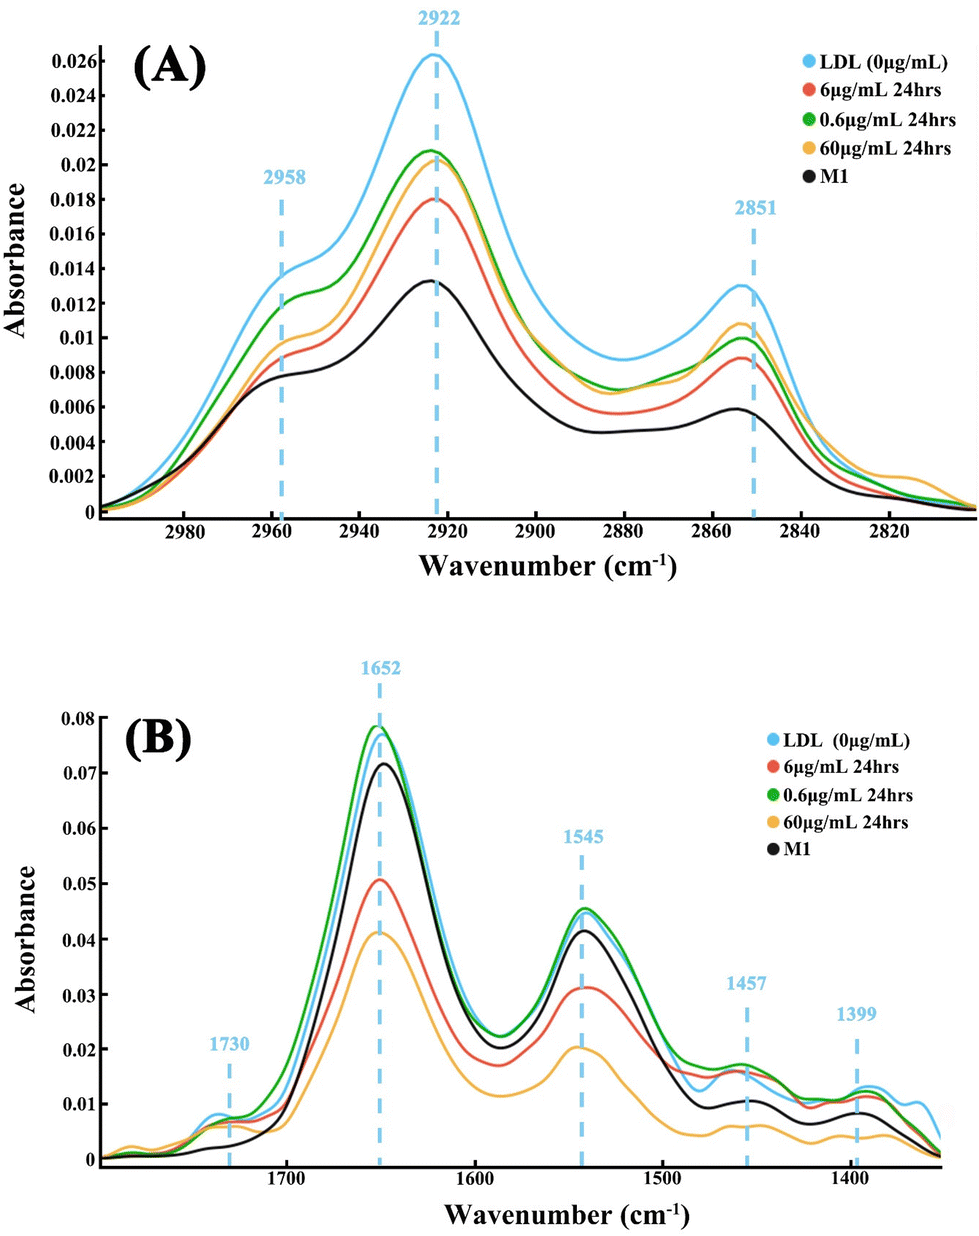 | ||
| Fig. 4 Mean spectra of foam cells treated with atorvastatin at 0 μg mL−1 (blue, LDL), 0.6 μg mL−1 (green), 6 μg mL−1 (red) and 60 μg mL−1 (orange) in compassion to control group, M1, which had not engulfed LDL (black). (A) The lipid region between 3000–2800 cm−1, and (B) the fingerprint region between 1800–1350 cm−1. An average of 50 spectra were used to generate each mean spectrum. | ||
The effect of atorvastatin reaction-time on LDL efflux efficacy has been studied by assessment of foam cells treated with 6 μg mL−1 atorvastatin for 24-hours, 48-hours and 72-hours (Fig. 5). By treating cells with 6 μg mL−1 atorvastatin, a considerable intensity decrease appeared on the spectra, at both lipid and fingerprint regions, in the dynamic efflux study in comparison to control spectrum. However, the lipid peaks at 48 hours appeared slightly sharper and stronger than other timings (Fig. 5A).
 | ||
| Fig. 5 Mean spectra of foam cells treated with 6 μg mL−1 atorvastatin with different incubation times; 24 h (red), 48 h (green), and 72 h (orange) in compassion to control groups which engulfed LDL (blue) and had not engulfed LDL (black, M1). (A) The lipid region between 3000–2800 cm−1, and (B) the fingerprint region between 1800–1350 cm−1. An average of 50 spectra were used to generate each mean spectrum. | ||
The mean relative change of peak intensity (±standard deviation) from original absorbance spectra is shown in Fig. 6. It can be seen that engulfing of LDL caused peak (2958, 2922, 2865, 2851 cm−1) intensities in the lipid region to increase. In the fingerprint region, some peak (1730, 1457, 1399 cm−1) intensities increased, and no changes were seen in other peaks (1652, 1645 cm−1). Following treatment with atorvastatin at different doses and incubation times, the above peak intensities changed toward those of M1 cells, further evidence that atorvastatin had an efflux effect on LDL.
 | ||
| Fig. 6 The mean relative change of peak intensity (±standard deviation) from original absorbance spectra. The relative intensity changes of foam cells, in comparison to M1 cells, in lipid rich region (A) and fingerprint region (B); the relative intensity change of foam cells treated with atorvastatin at different doses, in comparison to foam cells in lipid rich region (C) and fingerprint region (D); the relative intensity change of foam cells treated with 6 μg mL−1 atorvastatin and different culture times, in comparison to foam cells in lipid rich region (E) and fingerprint region (F). | ||
The PCA results, their corresponding loading plots based on 2nd derivative spectra, and t-SNE analysis results on the LDL efflux study under different atorvastatin doses are shown in Fig. 7 and 8. For the 24-hour atorvastatin culture, the scatter plot of the lipid region (3000–2800 cm−1) (Fig. 7) demonstrated a clear separation of control group (LDL laden group) from all atorvastatin dose treated groups. Apparently, atorvastatin treatment at 60 μg mL−1, was most effective for the efflux effect. The spectral dots in the control group and 60 μg mL−1 treatment were closely packed into a cluster, and the clusters of other dose groups were located in different quadrants. The spectral dots of the 6 μg mL−1 group were grouped together, but a few spectral dots overlap with those of the 0.6 μg mL−1 treated group (Fig. 7A). A similar conclusion can be drawn from the clustering on the t-SNE plot (Fig. 7B), where the lipid regions of all groups were separated. It is interesting to note that the t-SNE plot showed neater and clearer spectral clustering and separation between the atorvastatin dose groups, with much less spectral dot overlapping between 0.6 μg mL−1 and 6 μg mL−1 treated groups in comparison to the PCA plot. The much neater and clearer separation at fingerprint region (1800 and 1350 cm−1) by both PCA and t-SNE plots are visible in Fig. 8A and B. The spectral dots of atorvastatin treatment groups were all separate from the control group, with the clusters located in different quadrants. The 60 μg mL−1 group seemed to be the most effective in changing the fingerprint region by t-SNE analysis, with this cluster being farthest away from the control one (Fig. 8B).
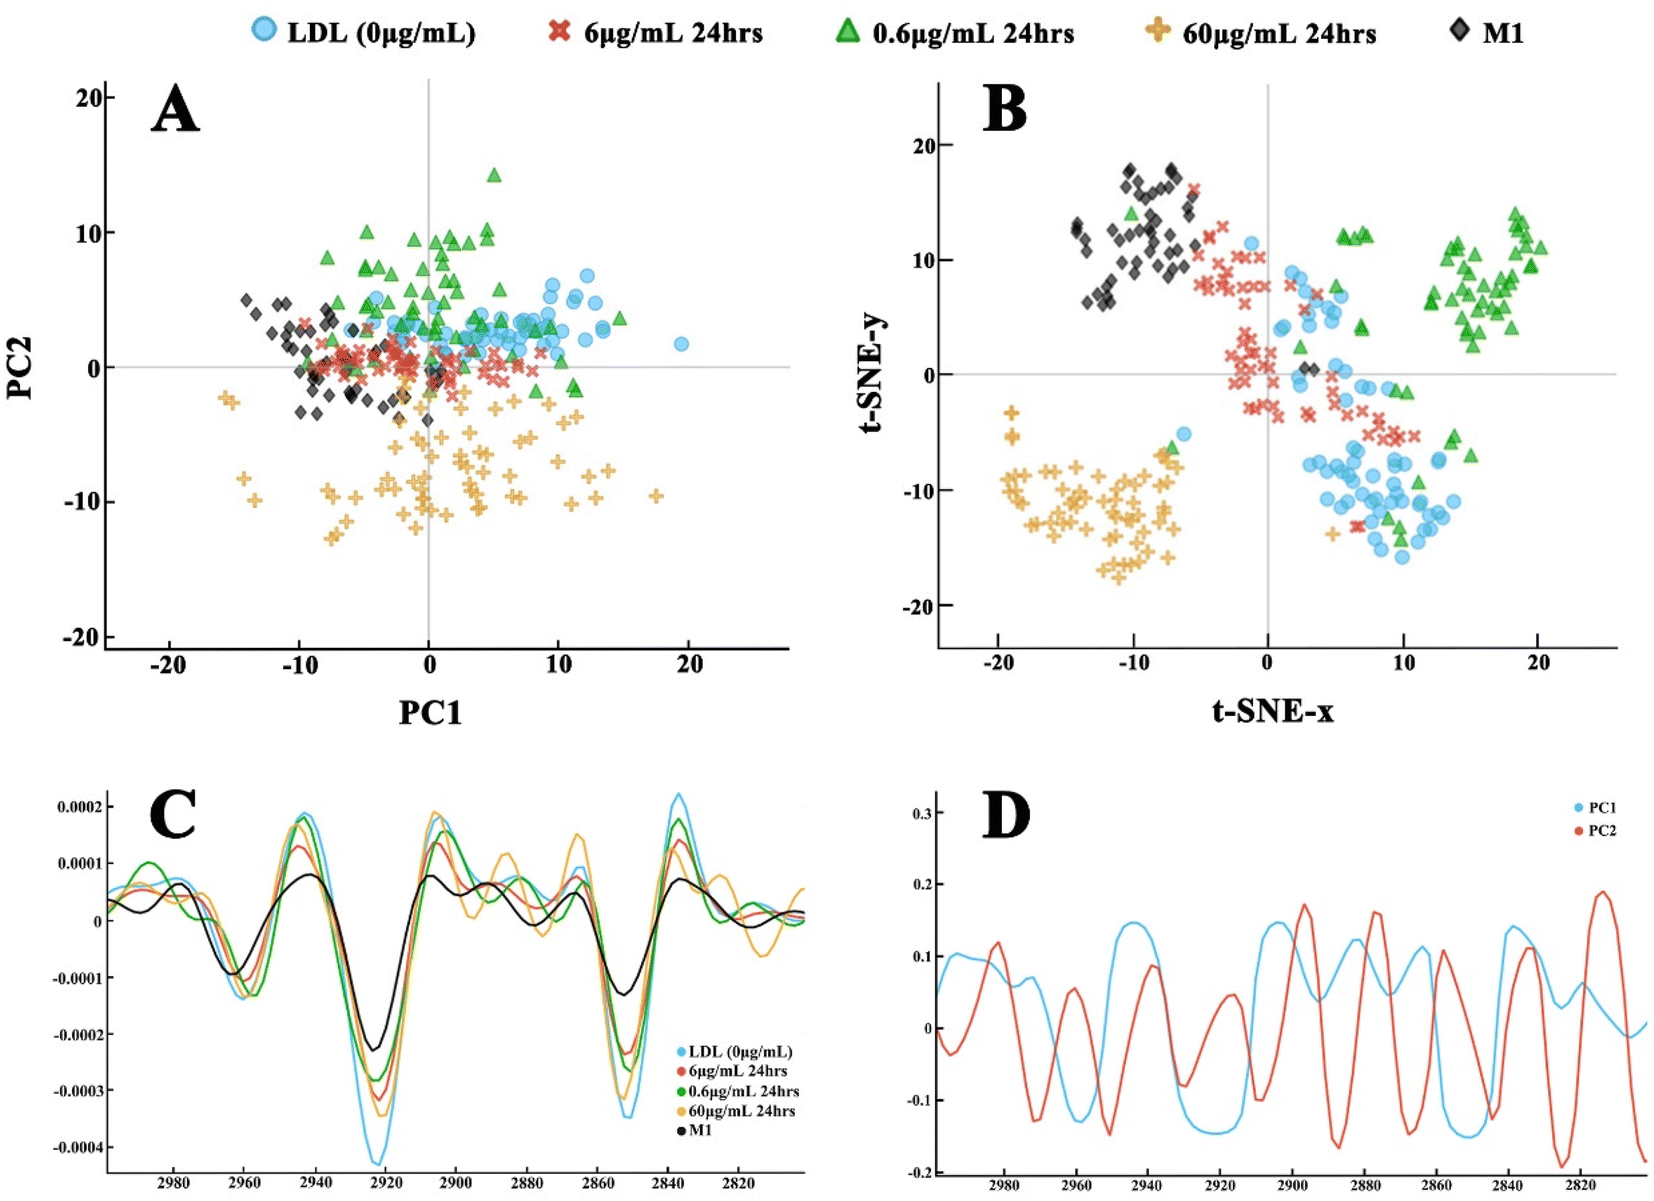 | ||
| Fig. 7 The second derivative of spectra of the lipid region (3000–2800 cm−1) through Savitzky–Golay filter, and post-processing for the clustering on the LDL efflux effect study with atorvastatin treatment at: 0 μg mL−1 (blue), 0.6 μg mL−1 (green), 6.0 μg mL−1 (red), and 60 μg mL−1 (orange) for 24 hours, in comparison to M1 control (black). (A) PCA scatter plot; (B) t-SNE plot; (C) the 2nd derivative of spectra; (D) the loading plot of principal components: PC1 (blue) and PC2 (red). | ||
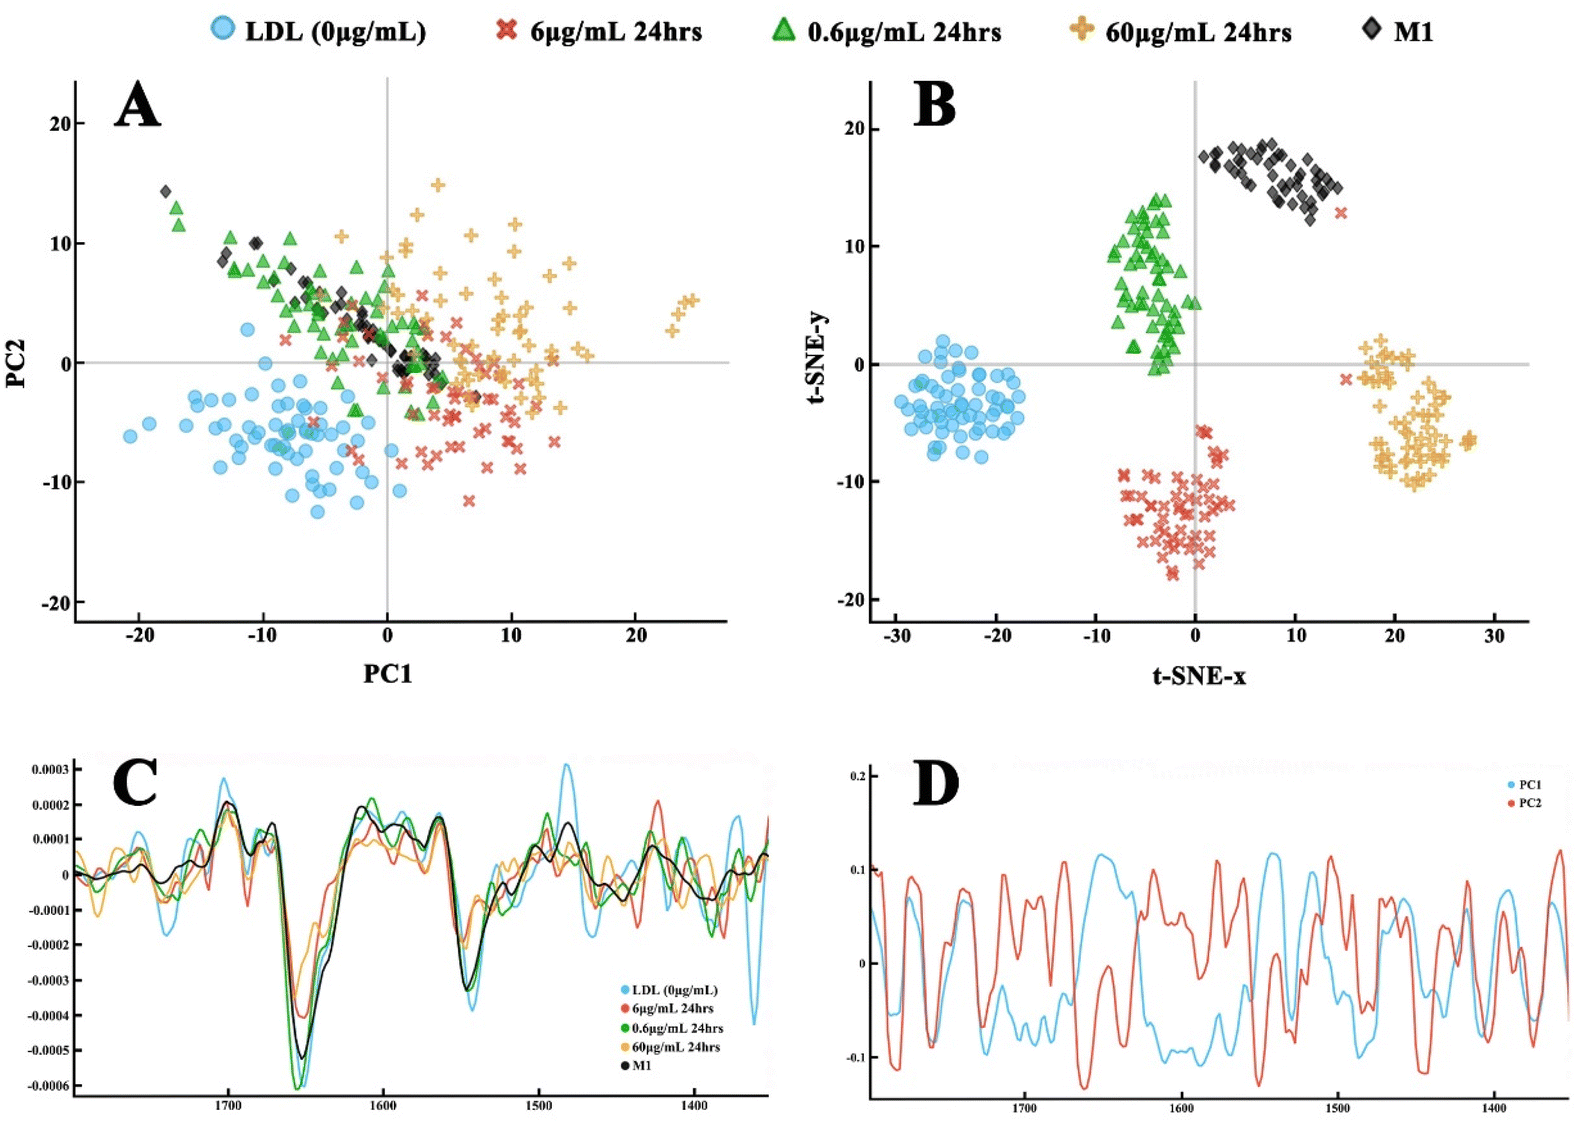 | ||
| Fig. 8 The second derivative of spectra of the fingerprint region (1800–1350 cm−1) through Savitzky–Golay filter and post-processing for the clustering on the LDL efflux effect study with atorvastatin treatment at 0 (blue), 0.6 (green), 6.0 (red), 60 μg mL−1 (orange) for 24 hours in comparison to M1 control (black). (A) PCA scatter plot; (B) t-SNE plot; (C) the 2nd derivative of spectra; (D) the loading plot of principal components: PC1 (blue) and PC2 (red). | ||
The PCA and t-SNE analysis plots of dynamic study on LDL efflux under different incubation durations are presented in Fig. 9 and 10. As shown in Fig. 9A, the PCA plot in the lipid region (3000–2800 cm−1) had moderate separation, with clustering between control group and atorvastatin treated groups at all reaction time points. The longer treatment time, i.e., the 72-hour group, clustered tightly compared to the other two groups in which a few spectral dots overlapped. All clusters were approximately located in different quadrants. Again, the t-SNE plot exhibited far clearer separation between the treatment groups and the control group, with the longest treatment time group located at the farthest distance from the control group. The fingerprint region (1800 and 1350 cm−1) clusters of all dynamic efflux treatment groups are shown in Fig. 10A and B. Both PCA and t-SNE demonstrated very good separation of the treatment groups against each other, and the control group. The t-SNE analysis gave a clearer separation of the control group and the treatment groups than PCA analysis (Fig. 10B), with all four groups clustering in separate quadrants.
 | ||
| Fig. 9 The second derivative of spectra of the lipid region (3000–2800 cm−1) through Savitzky–Golay filter and post-processing for the clustering on the LDL efflux effect study with 6 μg mL−1 atorvastatin treatment for 24 hours (red), 48 hours (green), 72 hours (orange) in comparison to foam cell (blue) and M1 cells (black). (A) PCA scatter plot; (B) t-SNE plot; (C) the 2nd derivative of spectra; (D) the loading plot of principal components: PC1 (blue) and PC2 (red). | ||
 | ||
| Fig. 10 The second derivative of spectra of the fingerprint region (1800–1350 cm−1) through Savitzky–Golay filter and post-processing for the clustering on the LDL efflux effect study with 6 μg mL−1 atorvastatin treatment for 24 hours (red), 48 hours (green), 72 hours (orange) in comparison to foam cell (blue) and M1 cells (black). (A) PCA scatter plot; (B) t-SNE plot; (C) the 2nd derivative of spectra; (D) the loading plot of principal components: PC1 (blue) and PC2 (red). | ||
Further, in addition to the PCA analysis with multiple groups, pairwise PCA analysis among individual atorvastatin treated group to controls (M1 and foam cells) have been undertaken. The separations in both lipid and fingerprint regions were clearly indicated (Fig. 11).
 | ||
| Fig. 11 Pairwise PCA analysis between foam cell (blue), M1 (black) and individual atorvastatin treated group through the 2nd derivative of spectra. The original spectra, and PCA, t-SNE plots are included. (I) With dose effect: (A) 0.6 μg mL−1 (green); (B) 6 μg mL−1 (red); (C) 60 μg mL−1 (orange). (II) With incubation time effect: (A) 24 h (red); (B) 48 h (green); (C) 72 h (orange). | ||
An ANOVA test was conducted to assess the statistical differences in the PCA analysis between the groups treated with atorvastatin in both the lipid and the fingerprint regions (Table 1). It is revealed that only PC2 on the fingerprint region for the comparison groups, i.e., M1 vs. LDL control vs. 60 μg mL−1, at 24 hours, had a p value larger than 0.05, all other separations between the possible pairs of groups were statistically significant for both the lipid and fingerprint regions.
| Lipid region (3000–2800 cm−1) | Amide region (1800–1350 cm−1) | |||
|---|---|---|---|---|
| PC1 | PC2 | PC1 | PC2 | |
| M1 vs. LDL con vs. 6 μg mL−1 −24 h | p < 0.001 | p = 0.027 | p < 0.001 | p < 0.001 |
| M1 vs. LDL con vs. 6 μg mL−1 −48 h | p < 0.001 | p < 0.001 | p < 0.001 | p < 0.001 |
| M1 vs. LDL con vs. 6 μg mL−1 −72 h | p < 0.001 | p < 0.001 | p < 0.001 | p < 0.001 |
| M1 vs. LDL con vs. 0.6 μg mL−1 −24 h | p < 0.001 | p < 0.001 | p < 0.001 | p < 0.001 |
| M1 vs. LDL con vs. 60 μg mL−1 −24 h | p < 0.001 | p < 0.001 | p < 0.001 | p = 0.111 |
| M1 vs. LDL con vs. all 6 μg mL−1 groups | p < 0.001 | p < 0.001 | p < 0.001 | p < 0.001 |
| M1 vs. LDL con vs. all 24 h groups | p < 0.001 | p < 0.001 | p < 0.001 | p < 0.001 |
| 6 μg mL−1 at 24, 48, and 72 h | p < 0.001 | p < 0.001 | p < 0.001 | p < 0.001 |
| 0.6, 6, and 60 μg mL−1 at 24 h | p = 0.001 | p < 0.001 | p < 0.001 | p < 0.001 |
Discussion
Synchrotron based-FTIR spectroscopy has been proven to be applicable to various types of research, with samples ranging from microorganisms, clinical samples, cultured cells and tissues, and biomaterials amongst others.30,36 The high resolution of FTIR spectroscopy allows for the detection of different states of single cells based on their chemical components,40 and can have potential application for disease diagnosis. The drug induced phospholipidosis cell model has been identified via other synchrotron based infrared microspectroscopy,41 whereas the capability of FTIR spectroscopy in the characterisation of LDL efflux, and dynamic efflux effects on foam cells triggered by statin treatment has not been explored. To this end, we report the potential of synchrotron based FTIR spectroscopy in such research areas, alongside drug delivery methods.Foam cells are lipid laden cells. The FTIR spectrum of lipids displays distinct peaks, and contains a wealth of information on lipid composition (head group and chain length/unsaturation) as well as on cell membrane physical state. The absorption bands representing methylene symmetric stretching (sνCH2) and methylene antisymmetric stretching (as νCH2) vibrations bands, centre near 2850 cm−1 and 2920 cm−1 respectively, whilst methyl stretching (vCH3) is at 2960 cm−1.42 The shape and intensity of these peaks shows high sensitivity to environment change such as the lipid type, quantity and location, which indicate FTIR spectroscopy as a convenient tool for the study of foam cells, and lipid efflux in response to statin treatment. The mean spectra clearly showed the significant variations in the region of 2970 to 2850 cm−1 that arise from the stretching vibrations of vCH3 and vCH2 groups in LDL and macrophage membrane. The significant lower intensity of these bands in foam cells after 60 μg mL−1 atorvastatin treatment, or longer incubation with 6 μg mL−1 atorvastatin, indicates that the environment became less lipophilic due to fragmentation of the lipoproteins, or efflux out of cells. The comparison of the spectra of foam cells and the macrophages which have not taken LDL demonstrates clear differences in the IR spectra in the region of 3000–2800 cm−1, including the shape and intensity. The macrophages showed a medium intensity peak at 2958 cm−1, whilst foam cells exhibited a shoulder peak. Interestingly, the macrophages displayed a medium intensity peak at 2875 cm−1, but foam cells did not. These features further confirm that FTIR approach is very sensitive to evaluating lipid-content in cells.
We further analysed the variances of spectra by unsupervised PCA, which is widely accepted as an effective manner of reducing the dimensionality of FTIR data. The PCA scatter plots presented clear spectral separation of different treatment groups at the lipid region. The dose variation of atorvastatin seemingly exerted more impact on the lipid efflux than the incubation duration. Fig. 7B shows more distinct cluster separation by the different dose treatments, compared to treatment for varying incubation times with 6 μg mL−1 atorvastatin, in the lipid region (Fig. 9B). With this established model, we may further explore the threshold of a therapeutic dose on the lipid efflux effect. Below the therapeutic dose, extending reaction time may not increase the lipid efflux effect considerably. Interestingly, PCA plots at the fingerprint region between 1800 and 1350 cm−1, showed distinct separation of the treated groups in both dose and time treatments, and from the control group. It has been identified that macrophages engulf LDL through multiple scavenger receptors such as LOX-1, CD36, and SR-A1.43 The taken cholesteryl ester can be hydrolysed by lysosomal acid lipase, and free cholesterol can be esterified with acyl–CoA cholesterol acyltransferase 1 (ACAT1).44 The separated PCA clusters and peak intensity changes in the lipid and protein regions, showed that these reactions involving the ingested LDL within macrophagic organelles were rather rapid (within 24 hours), and the atorvastatin reaction to the cholesterol compounds within macrophages was also fast (as short as 24 hours), which explained the distinct protein profile compositions in the macrophages with different treatments. It also implied that atorvastatin treatment is functionally effective and highly targeted.
While using FTIR spectral analysis, selection of proper analysis tools is important to reveal the subtle changes caused by chemical treatment. In our datasets, the ingested and cell membrane lipids are spectroscopically similar. The PCA analysis of original spectra showed less profound separation of the treated groups, with groups overlapping (data not shown). The second derivative spectra generated distinct PCA clustering in both dose and time treatment groups, and also at both lipid and fingerprint regions. Furthermore, we ran PCA and t-SNE analysis in parallel for our datasets. Embedding the t-SNE algorithm is a dimensionality-reduction method, to convert the high-dimensional dataset into a two-dimensional dataset, allowing visualization of the datasets by plotting them in the two-dimensional space. Although it has been used in other dataset analysis, e.g., hyperspectral imaging analysis,45 there are few applications of the algorithm for microFTIR data analysis. Through the analysis, it is confirmed that t-SNE analysis showed better clustering and separation of the treatment groups’ spectra. The locations and correlation of the clusters are supported and justified by PCA analysis outcome. Thus, it is suggested that t-SNE can be a useful analysis tool for the datasets which have subtle differences between the treated groups. Our data confirm that IR spectra can detect the subtle changes of lipid content in cells, which provide a powerful tool for investigating clinical specimens in the future, allowing quantification of the lipid content and therapeutic outcome.
The creation of a foam cell model to study the effect of statins on lipid efflux has the advantage over the study of plaque tissue samples. Mamarelis et al.,46 studied carotid artery with atheromatic plaque, and found foam cells surrounded by fibrils, haemorrhagic and calcified tissues. All of these components in the plaque generated compound and overlapped spectra. In our study, the foam cell only model enabled us to investigate the drug dose and treatment time separately without much background involvement.
FTIR technique is a label-free technique, which does not use any labelling agents such as fluorescence or luminesce dyes, or particles to bind to cellular components for contrast. Detection of absorption from a particular frequency of infrared radiation used to excite molecular bonds in FTIR technique, requires minimal sample pre-treatment, which avoids operational error. On the other hand, it is more difficult for FTIR spectroscopy in general to assess live cells due to strong water absorption. Other sample preparation techniques, e.g., freeze-drying or cryofixation is possible for FTIR microscopy, but the longevity of biomedical specimens is a major issue for any microscopy analysis. Thus, preservation of cellular integrity, and elimination of enzymatic reaction on cellular structure for FTIR measurement, are inevitable through chemical or physical fixation. The fixation using PFA in our study will break hydrogen bonds within intracellular molecules, causing denaturation of proteins through the formation of cross-links between amine residues. FTIR studies have already showed the spectroscopic differences between the fixed and hydrated cellular specimens.47,48 The amide I band profile is sensitive to hydrogen-bonding strengths, hence fixation will cause protein secondary conformational changes, thus spectral change. We did not study the spectral changes caused by PFA fixation in this study, however, all specimens implemented the same PFA fixation procedure, and exhibited spectroscopic differences between the treatment groups, we believe, which were beyond the fixation effects. We used PFA fixation, not ethanol, which avoided strong effect on lipid region spectra.48
In this study, a convenient and economical type of IR substrate, GalvOptics microscope coverslips, was confirmed. Compared to conventional IR spectral window substrates, for instance, calcium fluoride or barium fluoride, glass coverslips offer several advantages: first, they are far cheaper than other windows, allowing a fresh window to be used every time; secondly, some cells can be grown directly on the coverslip for IR studies, maintaining their original cellular morphology. Uniquely, the high refractive index of lipid (n = 1.44), in comparison to other biological components (n = ∼1.36),49 provided us the great opportunity to visualize the lipid location and their distribution both before, and after the atorvastatin treatment with the same sample window used for IR spectroscopy. The thin glass thickness (0.13 mm) and matched refractive index of the used coverslips allowed the collection of images to validate the FTIR spectral data easily and reliably. Additionally, as increased NO production is an indicator of macrophage activation,50 the NO readings provide support for the observation that atorvastatin affects macrophage activation/polarization by restricting NO production.
The limitation of this study is that the fingerprint spectral range has been cut (spectra down from 1350 cm−1 is not fully usable). Conventionally, the fingerprint region is defined from 1800 cm−1 to 400 cm−1 or 1500 cm−1 to 400 cm−1.51–55 This region of the spectra contains a large number of peaks, being sensitive to functional groups of, amongst others, phosphates of the DNA backbone. The use of this glass substrate does not allow for the study of this region below 1350 cm−1.
Conclusions
The optical images (visible and fluorescent light) clearly localized the lipid distribution within the foam cells, the associated changes after culturing with atorvastatin 0.6, 6 and 60 μg mL−1, and culturing time of 24, 48 and 72 hours. MicroFTIR spectroscopic spectra uniquely displayed the reduction of lipid content with higher efflux effect at a higher atorvastatin dose, and longer incubation time with atorvastatin. PCA and t-SNE analysis demonstrated defined cluster separation at both lipid (3000–2800 cm−1) and fingerprint (1800–1350 cm−1) regions, with more profound clustering for the atorvastatin dose treatment than time treatment. The combination of excellent bright field imaging capacity, and low IR radiation absorption at key wavenumbers for biological samples on GalvOptics thin glass coverslip, confirms that it is a good option for an IR sampling window, with the additional benefit of cross-validating the cellular morphology and IR spectra. The foam cell model provides a convenient experimental approach for pre-clinic study on atherosclerosis and its management through microFTIR spectroscopy, as a label-free method.Author contributions
BWX, WN: methodology, writing—original draft; BWX, WN, LD: data curation, formal analysis; YY, JSS, GC: writing—review and editing; YY: conceptualization and supervision. All authors have read and approved to the published version of the manuscript.Conflicts of interest
There are no conflicts to declare.Acknowledgements
This work is funded by Diamond Light Source UK synchrotron radiation facility for IR beamtime under proposal SM27175-1.References
- A. Lusis, Atherosclerosis, Nature, 2000, 407, 233–241 CrossRef CAS PubMed.
- F. Biscetti, N. Bonadia, E. Nardella, C. Leonardo, R. Landolfi and A. Flex, The Role of the Stem Cells Therapy in the Peripheral Artery Disease, Int. J. Mol. Sci., 2019, 20, 2233 CrossRef CAS PubMed.
- W. Herrington, B. Lacey, P. Sherliker, J. Armitage and S. Lewington, Epidemiology of Atherosclerosis and the Potential to Reduce the Global Burden of Atherothrombotic Disease, Circ. Res., 2016, 118, 535–546 CrossRef CAS PubMed.
- P. Libby, J. Buring, L. Badimon, G. Hansson, J. Deanfield, M. Bittencourt, L. Tokgözoğlu and E. Lewis, Atherosclerosis, Nat. Rev. Dis. Primers, 2019, 5, 56 CrossRef PubMed.
- A. Lillis, S. Catania, D. Au, M. Migliorini, M. J. Lee, S. Fried, I. Mikhailenko and D. Strickland, LDL Receptor-Related Protein-1 (LRP1) Regulates Cholesterol Accumulation in Macrophages, PLoS One, 2015, 10, e0128903 CrossRef PubMed.
- X. Zhang, W. Sessa and C. Fernández-Hernando, Endothelial Transcytosis of Lipoproteins in Atherosclerosis, Front. Cardiovasc. Med., 2018, 5, 130 CrossRef CAS PubMed.
- J. F. Bentzon, F. Otsuka, R. Virmani and E. Falk, Mechanisms of Plaque Formation and Rupture, Circ. Res., 2014, 114, 1852–1866 CrossRef CAS PubMed.
- H. Xu, J. Jiang, W. Chen, W. Li and Z. Chen, Vascular Macrophages in Atherosclerosis, J. Immunol. Res., 2019, 2019, 1–14 Search PubMed.
- S. Collot-Teixeira, J. Martin, C. McDermott-Roe, R. Poston and J. L. McGregor, CD36 and macrophages in atherosclerosis, Cardiovasc. Res., 2007, 75, 468–477 CrossRef CAS PubMed.
- N. Leitinger and I. G. Schulman, Phenotypic Polarization of Macrophages in Atherosclerosis, Arterioscler., Thromb., Vasc. Biol., 2013, 33, 1120–1126 CrossRef CAS PubMed.
- P. J. Murray, J. E. Allen, S. K. Biswas, E. A. Fisher, D. W. Gilroy, S. Goerdt, S. Gordon, J. A. Hamilton, L. B. Ivashkiv, T. Lawrence, M. Locati, A. Mantovani, F. O. Martinez, J.-L. Mege, D. M. Mosser, G. Natoli, J. P. Saeij, J. L. Schultze, K. A. Shirey, A. Sica, J. Suttles, I. Udalova, J. A. van Ginderachter, S. N. Vogel and T. A. Wynn, Macrophage Activation and Polarization: Nomenclature and Experimental Guidelines, Immunity, 2014, 41, 14–20 CrossRef CAS PubMed.
- S. Bashir, Y. Sharma, A. Elahi and F. Khan, Macrophage polarization: the link between inflammation and related diseases, Inflammation Res., 2016, 65, 1–11 CrossRef CAS PubMed.
- V. Guerrini and M. Gennaro, Foam Cells: One Size Doesn't Fit All, Trends Immunol., 2019, 40, 1163–1179 CrossRef CAS PubMed.
- X. Cheng, Y. Ding, C. Xia, T. Tang, X. Yu, J. Xie, M. Liao, R. Yao, Y. Chen, M. Wang and Y.-H. Liao, Atorvastatin Modulates Th1/Th2 Response in Patients With Chronic Heart Failure, J. Card. Failure, 2009, 15, 158–162 CrossRef CAS PubMed.
- T. Shimizu, O. Miyazaki, T. Iwamoto, T. Usui, R. Sato, C. Hiraishi and H. Yoshida, A new method for measuring cholesterol efflux capacity uses stable isotope-labeled, not radioactive-labeled, cholesterol, J. Lipid Res., 2019, 60, 1959–1967 CrossRef CAS PubMed.
- M. Adorni, N. Ronda, F. Bernini and F. Zimetti, High Density Lipoprotein Cholesterol Efflux Capacity and Atherosclerosis in Cardiovascular Disease: Pathophysiological Aspects and Pharmacological Perspectives, Cells, 2021, 10, 574 CrossRef CAS PubMed.
- S. Zheng, Y. Du, Q. Ye, K. Zha and J. Feng, Atorvastatin enhances foam cell lipophagy and promotes cholesterol efflux through the AMPK/mTOR pathway, J. Cardiovasc. Pharmacol., 2021, 77, 508–518 CrossRef CAS PubMed.
- S. Peng, L. W. Xu, X. Y. Che, Q. Q. Xiao, J. Pu, Q. Shao and B. He, Atorvastatin Inhibits Inflammatory Response, Attenuates Lipid Deposition, and Improves the Stability of Vulnerable Atherosclerotic Plaques by Modulating Autophagy, Front. Pharmacol., 2018, 9, 438 CrossRef PubMed.
- D. Greco, S. Battista, L. Mele, A. Piemontese, B. Papotti, S. Cavazzini, F. Potì, G. Rocco, A. Poli, F. Bernini and I. Zanotti, Alcohol Pattern Consumption Differently Affects the Efficiency of Macrophage Reverse Cholesterol Transport in Vivo, Nutrients, 2018, 10, 1885 CrossRef PubMed.
- M. Muñoz-Vega, F. Masso, A. Páez, G. Vargas-Alarcon, R. Coral-Vázquez, J. Mas-Oliva, E. Carreón-Torres and O. Pérez-Méndez, HDL-Mediated Lipid Influx to Endothelial Cells Contributes to Regulating Intercellular Adhesion Molecule (ICAM)-1 Expression and eNOS Phosphorylation, Int. J. Mol. Sci., 2018, 19, 3394 CrossRef PubMed.
- M. Hunjadi, C. Lamina, P. Kahler, T. Bernscherer, J. Viikari, T. Lehtimäki, M. Kähönen, M. Hurme, M. Juonala, L. Taittonen, T. Laitinen, E. Jokinen, P. Tossavainen, N. Hutri-Kähönen, O. Raitakari and A. Ritsch, HDL cholesterol efflux capacity is inversely associated with subclinical cardiovascular risk markers in young adults: The cardiovascular risk in Young Finns study, Sci. Rep., 2020, 10, 19223 CrossRef CAS PubMed.
- P. Morozzi, B. Ballarin, S. Arcozzi, E. Brattich, F. Lucarelli, S. Nava, P. J. Gómez-Cascales, J. A. G. Orza and L. Tositti, Ultraviolet–Visible Diffuse Reflectance Spectroscopy (UV–Vis DRS), a rapid and non-destructive analytical tool for the identification of Saharan dust events in particulate matter filters, Atmos. Environ., 2021, 252, 118297 CrossRef CAS.
- C. Adam, Shedding light on evidence: Forensic applications of UV/visible spectroscopy, Spectrosc. Eur., 2009, 21, 13–16 CAS.
- R. Jones, D. Hooper, L. Zhang, D. Wolverson and V. Valev, Raman Techniques: Fundamentals and Frontiers, Nanoscale Res. Lett., 2019, 14, 231 CrossRef PubMed.
- J. Trevisan, P. P. Angelov, P. L. Carmichael, A. D. Scott and F. L. Martin, Extracting biological information with computational analysis of Fourier-transform infrared (FTIR) biospectroscopy datasets: current practices to future perspectives, Analyst, 2012, 137, 3202–3215 RSC.
- Y. Ikemoto, M. Tanaka, T. Higuchi, T. Semba, T. Moriwaki, E. Kawasaki and M. Okuyama, Infrared synchrotron radiation and its application to the analysis of cultural heritage, Condens. Matter, 2020, 5, 28 CrossRef CAS.
- P. Yu, Application of advanced synchrotron radiation-based Fourier transform infrared (SR-FTIR) microspectroscopy to animal nutrition and feed science: a novel approach, Br. J. Nutr., 2004, 92, 869–885 CrossRef CAS PubMed.
- J. Pełka, Synchrotron Radiation in Biology and Medicine, Acta Phys. Pol., A, 2008, 114, 309–329 CrossRef.
- J. Doherty, A. Raoof, A. Hussain, M. Wolna, G. Cinque, M. Brown, P. Gardner and J. Denbigh, Live single cell analysis using synchrotron FTIR microspectroscopy: development of a simple dynamic flow system for prolonged sample viability, Analyst, 2019, 144, 997–1007 RSC.
- J. Meneghel, S. Passot, F. Jamme, S. Lefrançois, P. Lieben, P. Dumas and F. Fonseca, FTIR micro-spectroscopy using synchrotron-based and thermal source-based radiation for probing live bacteria, Anal. Bioanal. Chem., 2020, 412, 7049–7061 CrossRef CAS PubMed.
- B. Sengupta, C. A. Narasimhulu and S. Parthasarathy, Novel technique for generating macrophage foam cells for in vitro reverse cholesterol transport studies, J. Lipid Res., 2013, 54, 3358–3372 CrossRef CAS PubMed.
- W. Yao, K. Li and K. Liao, Macropinocytosis contributes to the macrophage foam cell formation in RAW264. 7 cells, Acta Biochim. Biophys. Sin., 2009, 41, 773–780 CrossRef CAS PubMed.
- A. Rutter, J. Crees, H. Wright, M. Raseta, D. Pittius, P. Roach and J. Sulé-Suso, Identification of a Glass Substrate to Study Cells Using Fourier Transform Infrared Spectroscopy: Are We Closer to Spectral Pathology?, Appl. Spectrosc., 2020, 74, 178–186 CrossRef CAS PubMed.
- M. K. DeGorter, R. G. Tirona, U. I. Schwarz, Y.-H. Choi, G. K. Dresser, N. Suskin, K. Myers, G. Zou, O. Iwuchukwu and W.-Q. Wei, Clinical and pharmacogenetic predictors of circulating atorvastatin and rosuvastatin concentrations in routine clinical care, Circ.: Cardiovasc. Genet., 2013, 6, 400–408 CAS.
- N. S. Bryan and M. B. Grisham, Methods to detect nitric oxide and its metabolites in biological samples, Free Radicals Biol. Med., 2007, 43, 645–657 CrossRef CAS PubMed.
- H. Owida, A. Rutter, G. Cinque, N. Kuiper, J. Suso and Y. Yang, Vibrational spectroscopic monitoring and biochemical analysis of pericellular matrix formation and maturation in a 3-dimensional chondrocyte culture model, Analyst, 2018, 143, 5979–5986 RSC.
- M. Cieslak, A. Castelfranco, V. Roncalli, P. Lenz and D. Hartline, t-Distributed Stochastic Neighbor Embedding (t-SNE): A tool for eco-physiological transcriptomic analysis, Mar. Genomics, 2019, 51, 100723 CrossRef PubMed.
- N. Luo, X. Yang, C. Sun, B. Xing, J.-W. Han and C. Zhao, Visualization of vibrational spectroscopy for agro-food samples using t-Distributed Stochastic Neighbor Embedding, Food Control, 2021, 126, 107812 CrossRef.
- M. Toplak, S. Read, C. Sandt and F. Borondics, Quasar: Easy Machine Learning for Biospectroscopy, Cells, 2021, 10, 2300 CrossRef PubMed.
- J. Vongsvivut, D. Perez-Guaita, B. R. Wood, P. Heraud, K. Khambatta, D. Hartnell, M. J. Hackett and M. J. Tobin, Synchrotron macro ATR-FTIR microspectroscopy for high-resolution chemical mapping of single cells, Analyst, 2019, 144, 3226–3238 RSC.
- K. L. A. Chan, I. Lekkas, M. D. Frogley, G. Cinque, A. Altharawi, G. Bello and L. A. Dailey, Synchrotron Photothermal Infrared Nanospectroscopy of Drug-Induced Phospholipidosis in Macrophages, Anal. Chem., 2020, 92, 8097–8107 CrossRef CAS PubMed.
- M. C. Hull, L. R. Cambrea and J. S. Hovis, Infrared Spectroscopy of Fluid Lipid Bilayers, Anal. Chem., 2005, 77, 6096–6099 CrossRef CAS PubMed.
- X. Gu, S. Xie, D. Hong and Y. Ding, An in vitro model of foam cell formation induced by a stretchable microfluidic device, Sci. Rep., 2019, 9, 7461 CrossRef PubMed.
- M. Sekiya, J.-I. Osuga, S. Nagashima, T. Ohshiro, M. Igarashi, H. Okazaki, M. Takahashi, F. Tazoe, T. Wada, K. Ohta, M. Takanashi, M. Kumagai, M. Nishi, S. Takase, N. Yahagi, H. Yagyu, K. Ohashi, R. Nagai, T. Kadowaki, Y. Furukawa and S. Ishibashi, Ablation of Neutral Cholesterol Ester Hydrolase 1 Accelerates Atherosclerosis, Cell Metab., 2009, 10, 219–228 CrossRef CAS PubMed.
- B. Melit Devassy, S. George and P. Nussbaum, Unsupervised Clustering of Hyperspectral Paper Data Using t-SNE, J. Imaging, 2020, 6, 29 CrossRef PubMed.
- I. Mamarelis, K. Pissaridi, V. Dritsa, P. Kotileas, V. Tsiligiris, V. Tzilalis and J. Anastassopoulou, Oxidative stress and atherogenesis. An FT-IR spectroscopic study, In Vivo, 2010, 24, 883–888 CAS.
- T. M. Pereira, M. L. Z. Dagli, G. Mennecier and D. M. Zezell, Influence of Fixation Products Used in the Histological Processing in the FTIR Spectra of Lung Cells, Spectrosc. Int. J., 2012, 27, 649094 Search PubMed.
- V. Zohdi, D. R. Whelan, B. R. Wood, J. T. Pearson, K. R. Bambery and M. J. Black, Importance of tissue preparation methods in FTIR micro-spectroscopical analysis of biological tissues:‘traps for new users’, PLoS One, 2015, 10, e0116491 CrossRef PubMed.
- A. Bashkatov, K. Berezin, K. Dvoretskiy, M. Chernavina, E. Genina, V. Genin, V. Kochubey, E. Lazareva, A. Pravdin, M. Shvachkina, P. Timoshina, D. Tuchina, D. Yakovlev, D. Yakovlev, I. Y. Yanina, O. Zhernovaya and V. Tuchin, Measurement of tissue optical properties in the context of tissue optical clearing, J. Biomed. Opt., 2018, 23, 091416 Search PubMed.
- Q. Guo, D. Bi, M. Wu, Y. Boming, L. Hu, L. Chenchen, G. Liang, H. Zhu, A. Lei, X. Xu and J. Wang, Immune activation of murine RAW264.7 macrophages by sonicated and alkalized paramylon from Euglena gracilis, BMC Microbiol., 2020, 20, 171 CrossRef CAS PubMed.
- P. Bassan, J. Mellor, J. Shapiro, K. J. Williams, M. P. Lisanti and P. Gardner, Transmission FT-IR chemical imaging on glass substrates: applications in infrared spectral histopathology, Anal. Chem., 2014, 86, 1648–1653 CrossRef CAS PubMed.
- P. Lasch and D. Naumann, Spatial resolution in infrared microspectroscopic imaging of tissues, Biochim. Biophys. Acta, Biomembr., 2006, 1758, 814–829 CrossRef CAS PubMed.
- M. J. Baker, J. Trevisan, P. Bassan, R. Bhargava, H. J. Butler, K. M. Dorling, P. R. Fielden, S. W. Fogarty, N. J. Fullwood and K. A. Heys, Using Fourier transform IR spectroscopy to analyze biological materials, Nat. Protoc., 2014, 9, 1771–1791 CrossRef CAS PubMed.
- D. L. Freitas, I. M. Câmara, P. P. Silva, N. R. Wanderley, M. B. Alves, C. L. Morais, F. L. Martin, T. B. Lajus and K. M. Lima, Spectrochemical analysis of liquid biopsy harnessed to multivariate analysis towards breast cancer screening, Sci. Rep., 2020, 10, 1–8 CrossRef PubMed.
- J. Zhou, Z. Wang, S. Sun, M. Liu and H. Zhang, A rapid method for detecting conformational changes during differentiation and apoptosis of HL60 cells by Fourier–transform infrared spectroscopy, Biotechnol. Appl. Biochem., 2001, 33, 127–132 CrossRef CAS PubMed.
| This journal is © The Royal Society of Chemistry 2022 |