
 Open Access Article
 This Open Access Article is licensed under a Creative Commons Attribution-Non Commercial 3.0 Unported Licence
Imaging mass spectrometry differentiates the effects of doxorubicin formulations on non-targeted tissues†
Željko
Debeljak
 *ab,
Ivana
Vinković Vrček
c,
Nikša
Drinković
d,
Vedran
Micek
c,
Emerik
Galić
e,
Dunja
Gorup
f,
Marija
Ćurlin
g,
Dario
Mandić
ab,
Ana
Bandjak
a,
Barbara
Pem
c,
Nikolina
Kalčec
c,
Krunoslav
Ilić
c,
Ivan
Pavičić
c,
Suzana
Mimica
ab,
Nazende
Günday-Türeli
h and
Emre
Türeli
h
*ab,
Ivana
Vinković Vrček
c,
Nikša
Drinković
d,
Vedran
Micek
c,
Emerik
Galić
e,
Dunja
Gorup
f,
Marija
Ćurlin
g,
Dario
Mandić
ab,
Ana
Bandjak
a,
Barbara
Pem
c,
Nikolina
Kalčec
c,
Krunoslav
Ilić
c,
Ivan
Pavičić
c,
Suzana
Mimica
ab,
Nazende
Günday-Türeli
h and
Emre
Türeli
h
aUniversity Hospital Osijek, Osijek, Croatia. E-mail: zeljko.debeljak@gmail.com
bJJ Strossmayer University of Osijek, Faculty of Medicine, Osijek, Croatia
cInstitute for Medical Research and Occupational Health, Zagreb, Croatia
dPolyclinic Drinković, Zagreb, Croatia
eJJ Strossmayer University of Osijek, Faculty of Agrobiotechnical Sciences, Osijek, Croatia
fUniversity of Zagreb, School of Medicine, Zagreb, Croatia
gCroatian Catholic University, Zagreb, Croatia
hMyBiotech, Überherrn, Germany
First published on 14th June 2022
Abstract
Administration of cytotoxic agents like doxorubicin (DOX) is restrained by the effects on different non-targeted/non-cancerous tissues, which instigates the development of nano-enabled drug delivery systems, among others. In this study, imaging mass spectrometry (IMS) was selected to examine the effects of DOX nanoformulations on non-targeted tissues. Chemical alterations induced by liposomal (LPS) and poly (lactic-co-glycolic acid) (PLG) nanoformulations were assessed against the ones induced by the conventional (CNV) formulation. Kidney cryosections of the treated and control Wistar rats were used as a model of the non-targeted tissue and analyzed by MALDI TOF IMS in the 200–1000 Da m/z range. Principal component analysis (PCA) and Volcano plots of the average mass spectra demonstrated a large overlap between treatments. However, the Venn diagram of significant m/z values revealed a nanoformulation-specific fingerprint consisting of 59 m/z values, which set them apart from the CNV formulation characterized by the fingerprint of 22 significant m/z values. Fingerprint m/z values that were putatively annotated by metabolome database search were linked to apoptosis, cell migration and proliferation. In CNV and PLG cases, false discovery rate adjusted ANOVA showed no differences in the spatial distribution of fingerprint m/z values between the histological substructures like glomeruli and convoluted tubules indicating their tissue-nonselective effect. LPS caused the least significant changes in m/z values and some of the LPS-specific fingerprint m/z values were primarily distributed in the glomeruli. The IMS based procedure successfully differentiated the effects of DOX formulations on the model non-targeted tissue, thus indicating the importance of IMS in effective drug development.
Introduction
Chemical fingerprinting using mass spectrometry (MS) has a wide array of applications. Identification of microorganisms by MALDI TOF MS represents a recent and very successful application of chemical fingerprinting in biomedicine.1 The development of imaging mass spectrometry (IMS) introduced spatial analysis and provided a possibility of the histochemical fingerprinting by MALDI TOF IMS. Simultaneous recording of numerous m/z values in the compound tissues provides abundant chemical information highlighting the advantage of IMS over more frequently used imaging techniques like immunohistochemistry and confocal microscopy. This feature enables the detection and differentiation of the chemical fingerprints in compound tissues which can be exploited in drug development and preclinical testing.2Great efforts in the design and development of cytotoxic drugs like doxorubicin (DOX) have been made to alleviate their side effects. Targeted drug design and nano-enabled formulations have been designed to increase the efficacy and reduce unwanted effects of DOX in non-targeted tissues.3–5 To check if these expectations have been met, besides histopathology and drug distribution studies, which do not provide much information about chemical alterations,6,7 biochemical assays in pure cell cultures are routinely used.8–15 The DOX-induced biochemical alterations studied in pure cell cultures include cell death by the inhibition of topoisomerase II, intercalation in DNA and oxidative stress induction. Pure cell cultures were also used to show cell's resistance to DOX due to increased reductive pentose phosphate cycle activity, expression of drug transporters and activity of aldo-keto reductases. But DOX has been associated with a wide array of different effects on different cell types in compound tissues.10 DOX induced responses by the resident immune and endothelial cells cannot be analysed in the pure cell cultures at all. Due to that recognition of changes in a complex chemical pattern of non-targeted tissues that are specific to different DOX formulations remains largely beyond the pure cell culture models and assays for well-known biochemical alterations. In that regard, IMS-derived histochemical fingerprints of non-targeted tissues may facilitate information gathering on the well-known alterations, but also on the less common, drug formulation-specific histochemical alterations.2
Due to the susceptibility to cytotoxic effects of DOX16 as well as the complex microscopic structure comprised of glomeruli, proximal and distal convoluted tubules (PCT, DCT, respectively), the kidney cortex represents a useful non-targeted tissue model for studying the effects of novel DOX formulations by imaging techniques, the IMS in particular. Recent IMS studies on DOX distribution in colon cancer cell spheroids and in mouse liver sections did not provide data on chemical disturbances induced by different DOX formulations,6,17 whereas research by Jung et al.18 and Sahin et al.19 demonstrated IMS as a valuable tool for the assessment of drug induced chemical alterations in the kidneys. In this study, we aimed to provide proof-of-concept for the implementation of the imaging mass spectrometry (IMS) in the safety and toxicity evaluation of novel drug formulations focusing on non-targeted tissues.
Results and discussion
Systemic administration of DOX causes numerous biochemical changes that leave little room for the formulation-specific histochemical changes to emerge. It is therefore expected that the mass spectra of animals’ kidneys treated with different DOX formulations are very similar and reflect the DOX-specific changes. The separation of the control (CTR) animals from the treated ones along the PC1 axis confirms these expectations (Fig. 1). A larger variation within the CTR group was noticeable while the closely located class centroids demonstrate similar responses to all formulations. Grouping of the results obtained for different DOX formulations suggests a concerted response to DOX formulations as opposed to less coherent behaviour of untreated, control animals. Grouping of the formulations indicates that the differentiation of histochemical fingerprints related to treatment with different drug formulations might be a challenging task. In comparison to the small differences in response to different DOX formulations, even the sex-related differences appeared more obvious (ESI, Part S1†).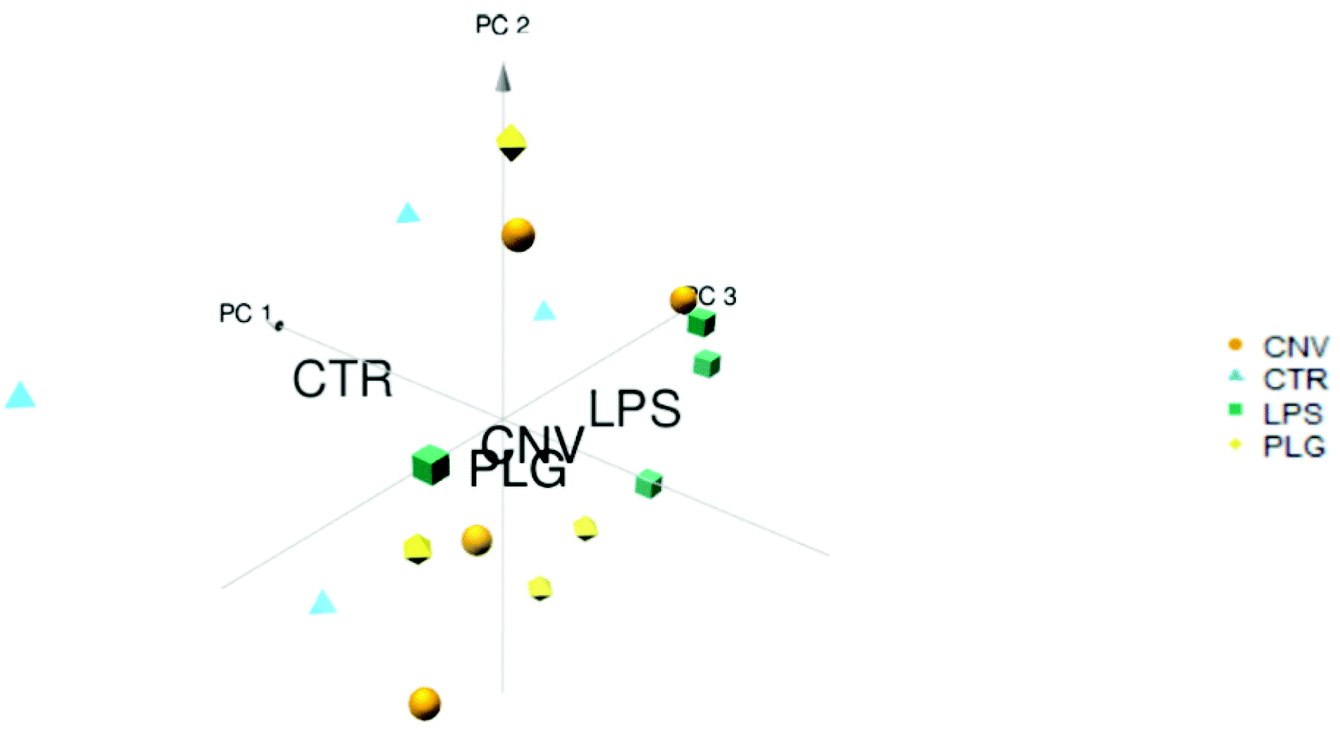 | ||
| Fig. 1 PCA of the average IMS spectra acquired on the kidney cortex of the CNV, LPS, PLG and CTR animal groups. Each polygon represents an individual animal. Position of the polygon is determined by mass spectrum averaged over all pixels of the kidney cortex of the respective animal. 80.9% of data variance has been explained. Group labels are placed at centroids of CTR, CNV, PLS, and PLG. | ||
To demonstrate histochemical differences induced by different formulations in more detail, the Volcano plot and Venn diagram have been generated (Fig. 2 and 3). The plot represents m/z values that were significantly changed in the kidney cortex of animals after DOX treatment compared to the CTR group. A total of 1084 m/z values were significantly altered due to treatment with at least one DOX formulation (Fig. 2 and 3). Such a high number of significantly changed m/z values refers to the large variety of chemical disturbances in the kidney cortex induced by DOX treatment. Consistent with PCA (Fig. 1), the most significant changes in m/z values in kidneys were common to all DOX formulations (Fig. 2 and 3). Significantly decreased m/z intensities were more dispersed which makes them a likely source of formulation-specific m/z values (Fig. 2): the largest negative log![[thin space (1/6-em)]](https://www.rsc.org/images/entities/char_2009.gif) 2-fold changes of significant m/z intensities were most frequently induced by LPS, followed by PLG, which may be a common trait of the nanoformulations.
2-fold changes of significant m/z intensities were most frequently induced by LPS, followed by PLG, which may be a common trait of the nanoformulations.
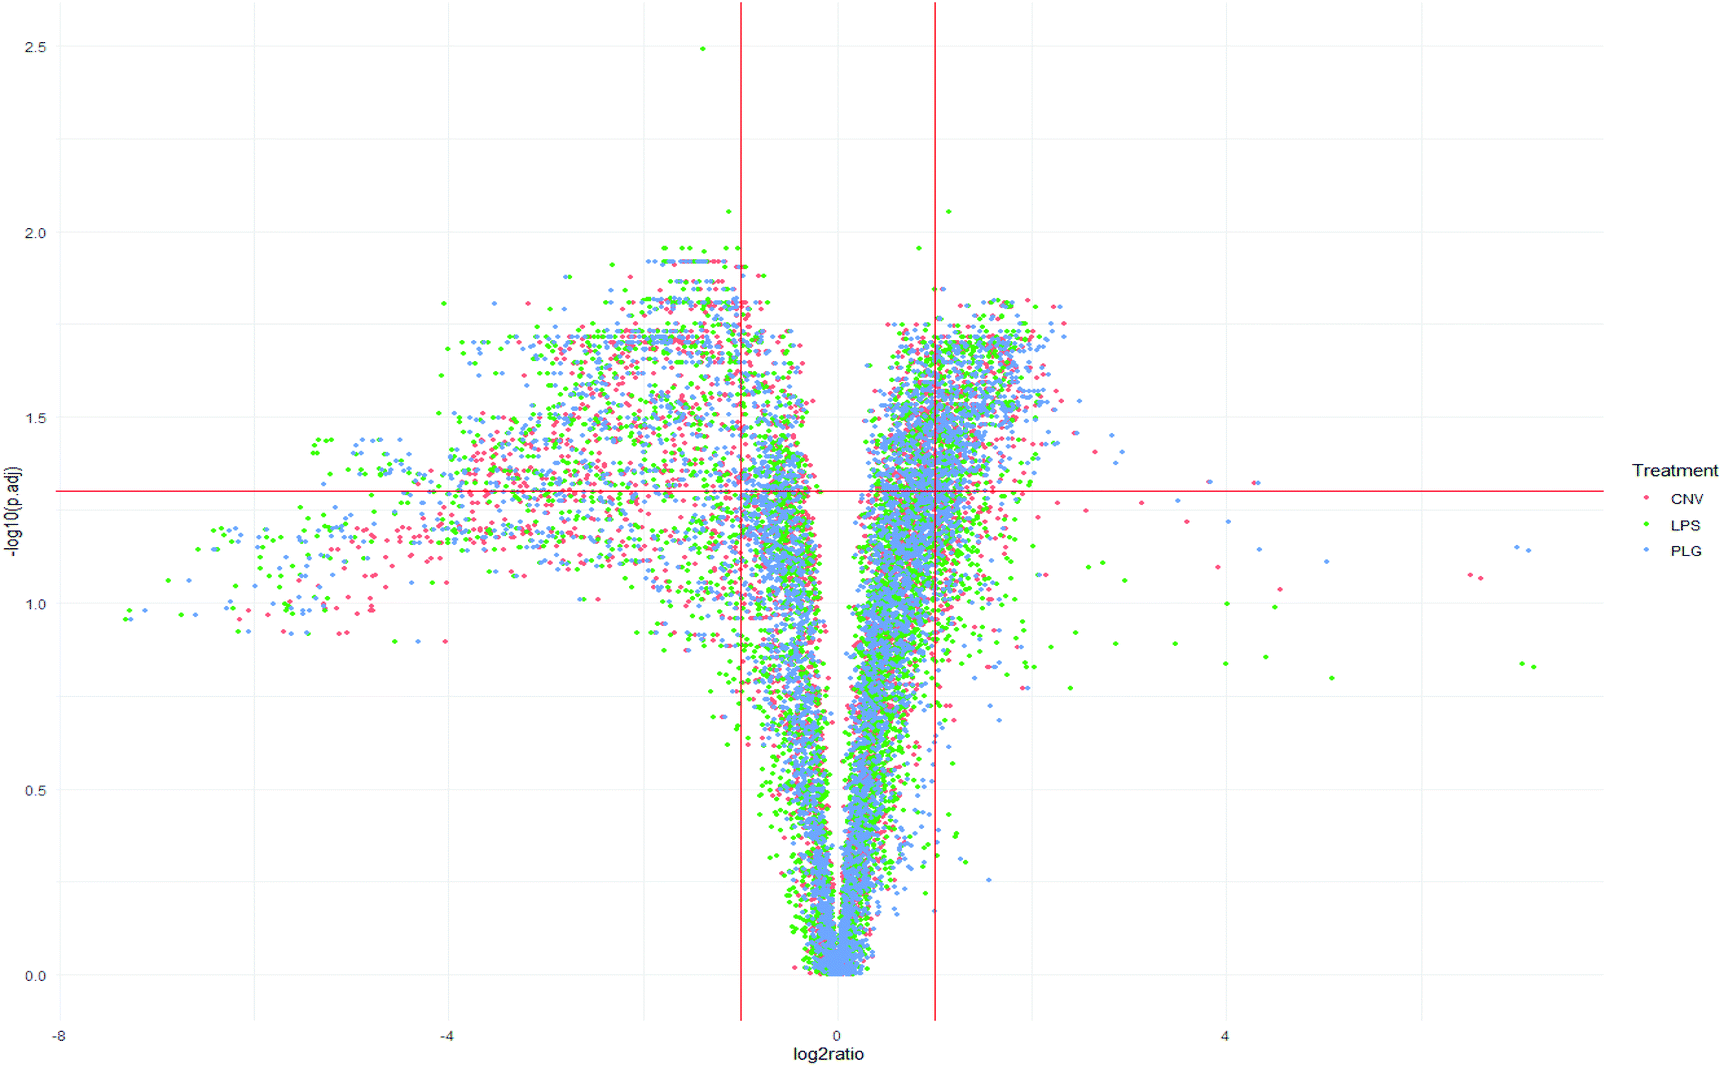 | ||
| Fig. 2 Volcano plots: depicted m/z values reflect different effects of CNV, LPS, and PLG DOX formulations in the kidney cortex of rats compared to the control group. Each strong m/z is represented by a dot. Vertical red lines denote log2-fold change of −1 and 1 while a horizontal red line denotes log of 0.05 which is a critical FDR adjusted p value of the Welch t-test (p.adj). | ||
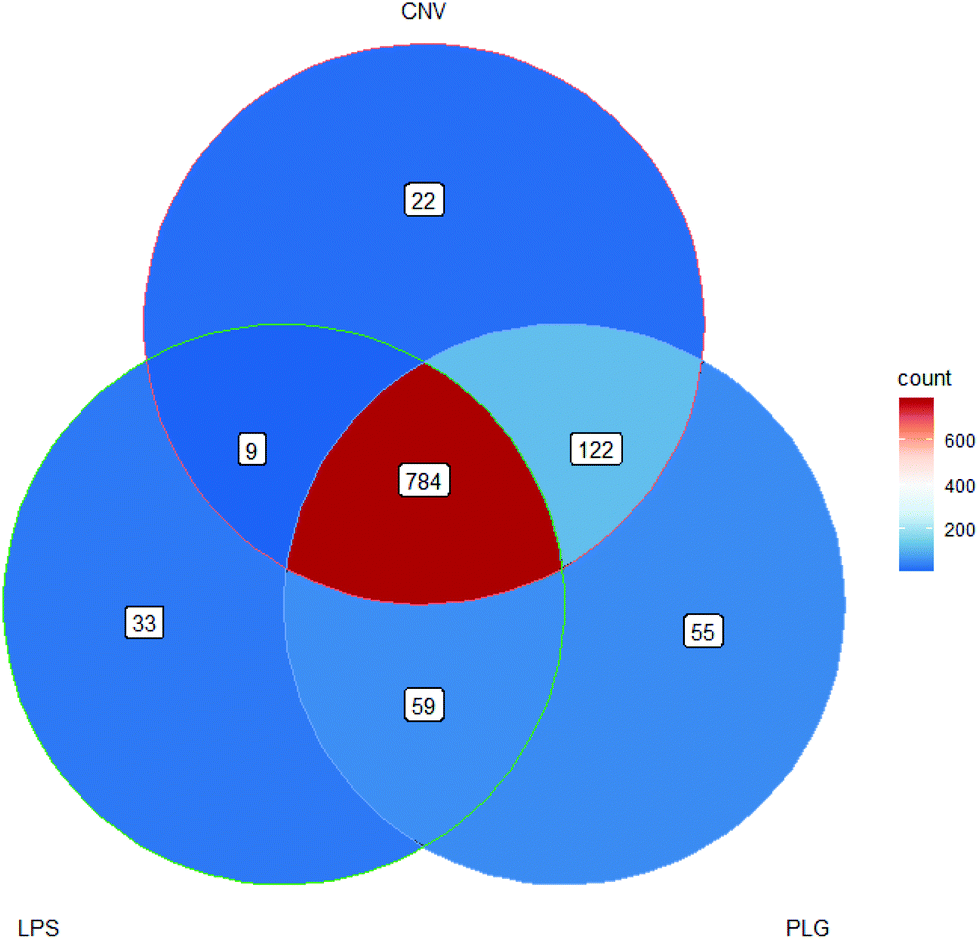 | ||
| Fig. 3 Venn diagram of m/z values that were significantly changed due to administration of each DOX formulation. Significant m/z values satisfy statistical and log2-fold change criteria. | ||
The most significantly changed m/z values were shared by all DOX formulations but 300 m/z values cannot be linked to DOX alone, rather they may be considered as drug formulation-specific (Fig. 3). Moreover, 22 significantly changed m/z values formed CNV-specific histochemical fingerprint and 59 m/z values formed the nanoformulation-specific histochemical fingerprint. Although LPS and PLG belong to the nanoformulations group, LPS specific and PLG specific fingerprints may be observed. A notable proportion of the significant m/z values that were shared by PLG and CNV treatments (122 m/z values) indicates a great degree of similarity in the impact of these two formulations on the rat kidney cortex indicating that the carrier particles’ dimensions alone cannot reduce effects of DOX. A complete list describing all these fingerprint m/z values is given in the ESI (Part S2†).
CNV-specific and nanoformulation-specific fingerprint m/z values were used for the Human Metabolome Database (HMDB) search (Table 1). Most 22 CNV-related and 59 nanoformulations-related fingerprint m/z values cannot be putatively annotated using HMDB (Table 1, ESI, Part 2†). HMDB search using ±50 ppm tolerance resulted in 11 unique endogenous hits i.e. putative metabolites. The remaining significantly changed m/z values either did not gain database search hits that correspond to the endogenous compounds or resulted in multiple hits leading to the intractable interpretation. Fingerprint m/z values didn't match DOX itself or to its well-known metabolites like the doxorubicinol or 7-deoxydoxorubicinone, either. The fact that it was not possible to relate some of the fingerprint m/z values with HMDB entries together with the fact that some putatively identified endogenous compounds have no known role in the kidney cortex implicate the existence of additional unknown DOX effects on the kidney cortex.
| m/z | Adduct | Putative endogenous metabolites | Alteration | p.adj | Metabolic roles in kidneys | |
|---|---|---|---|---|---|---|
| CNV formulation | 368.11 | M + H − H2O | Phosphatidylserine | ↑ | 0.039 | Apoptosis27 |
| 374.16 | M + Na | Trp-Phe/Phe-Trp | ↑ | 0.027 | Unknown | |
| 375.14 | M + H − H2O | Cyclic N-Acetylserotonin glucuronide | ↑ | 0.025 | Unknown | |
| 448.31 | M + H − H2O | Glycocholic acid | ↑ | 0.046 | Unknown | |
| 455.08 | M + Na | Estradiol disulfate | ↑ | 0.020 | Unknown | |
| 468.14 | M + Na | Tetrahydrofolic acid | ↑ | 0.045 | Oxidative stress and ferroptosis28 | |
| Nanoformulations: LPS & PLG | 377.17 | M + Na | LysoPA(i-12:0/0:0) isomers | ↑ | 0.041 | Cell migration and proliferation29,30 |
| 504.35 | M + H − H2O | LysoPC(18:1(9Z)/0:0) isomers | ↑ | 0.037 | Precursor of LysoPA29 | |
| 505.36 | M + H − H2O | LysoPA(i-24:0/0:0) isomers | ↑ | 0.022 | Cell migration and proliferation29,30 | |
| 721.88 | M + K | Guanosine 3′-diphosphate 5′-triphosphate | ↓ | 0.016 | Apoptosis31 | |
| 806.05 | M + K | Coenzyme A | ↑ | 0.042 | Mitochondrial function32 |
Although significantly decreased m/z intensities might differentiate CNV from the nanoformulations, their annotation was of limited success: only one of the decreased m/z intensities was matched to a single HMDB entry as opposed to 10 increased m/z intensities that were successfully annotated. Minor differences between CNV and nanoformulated DOX were found (Table 1): in animal groups treated with DOX nanoformulations, increased LysoPA was found, while compounds like glycocholic acid and tetrahydrofolic acid were found to be increased in kidneys of rats treated with CNV. But the majority of putatively identified metabolites associated with different DOX formulation were associated primarily with different mechanisms of apoptosis. Apoptosis of the cancerous cells is the expected outcome of DOX administration. However, DOX induces the same effect in non-targeted tissues. This is corroborated in Table 1, i.e. administration of any type of DOX formulation induces apoptosis in the kidney cortex. Results presented in Table 1 also suggest that CNV-related apoptosis was induced by different mechanisms compared to the nanoformulations-specific apoptosis. Moreover, nanoformulations also induced possible cell migrations and cell proliferations according to the results obtained for the LysoPA(i-12:0/0:0). Its lateral distributions in the kidney cortex clearly depict differences between different DOX formulations (Fig. 4).
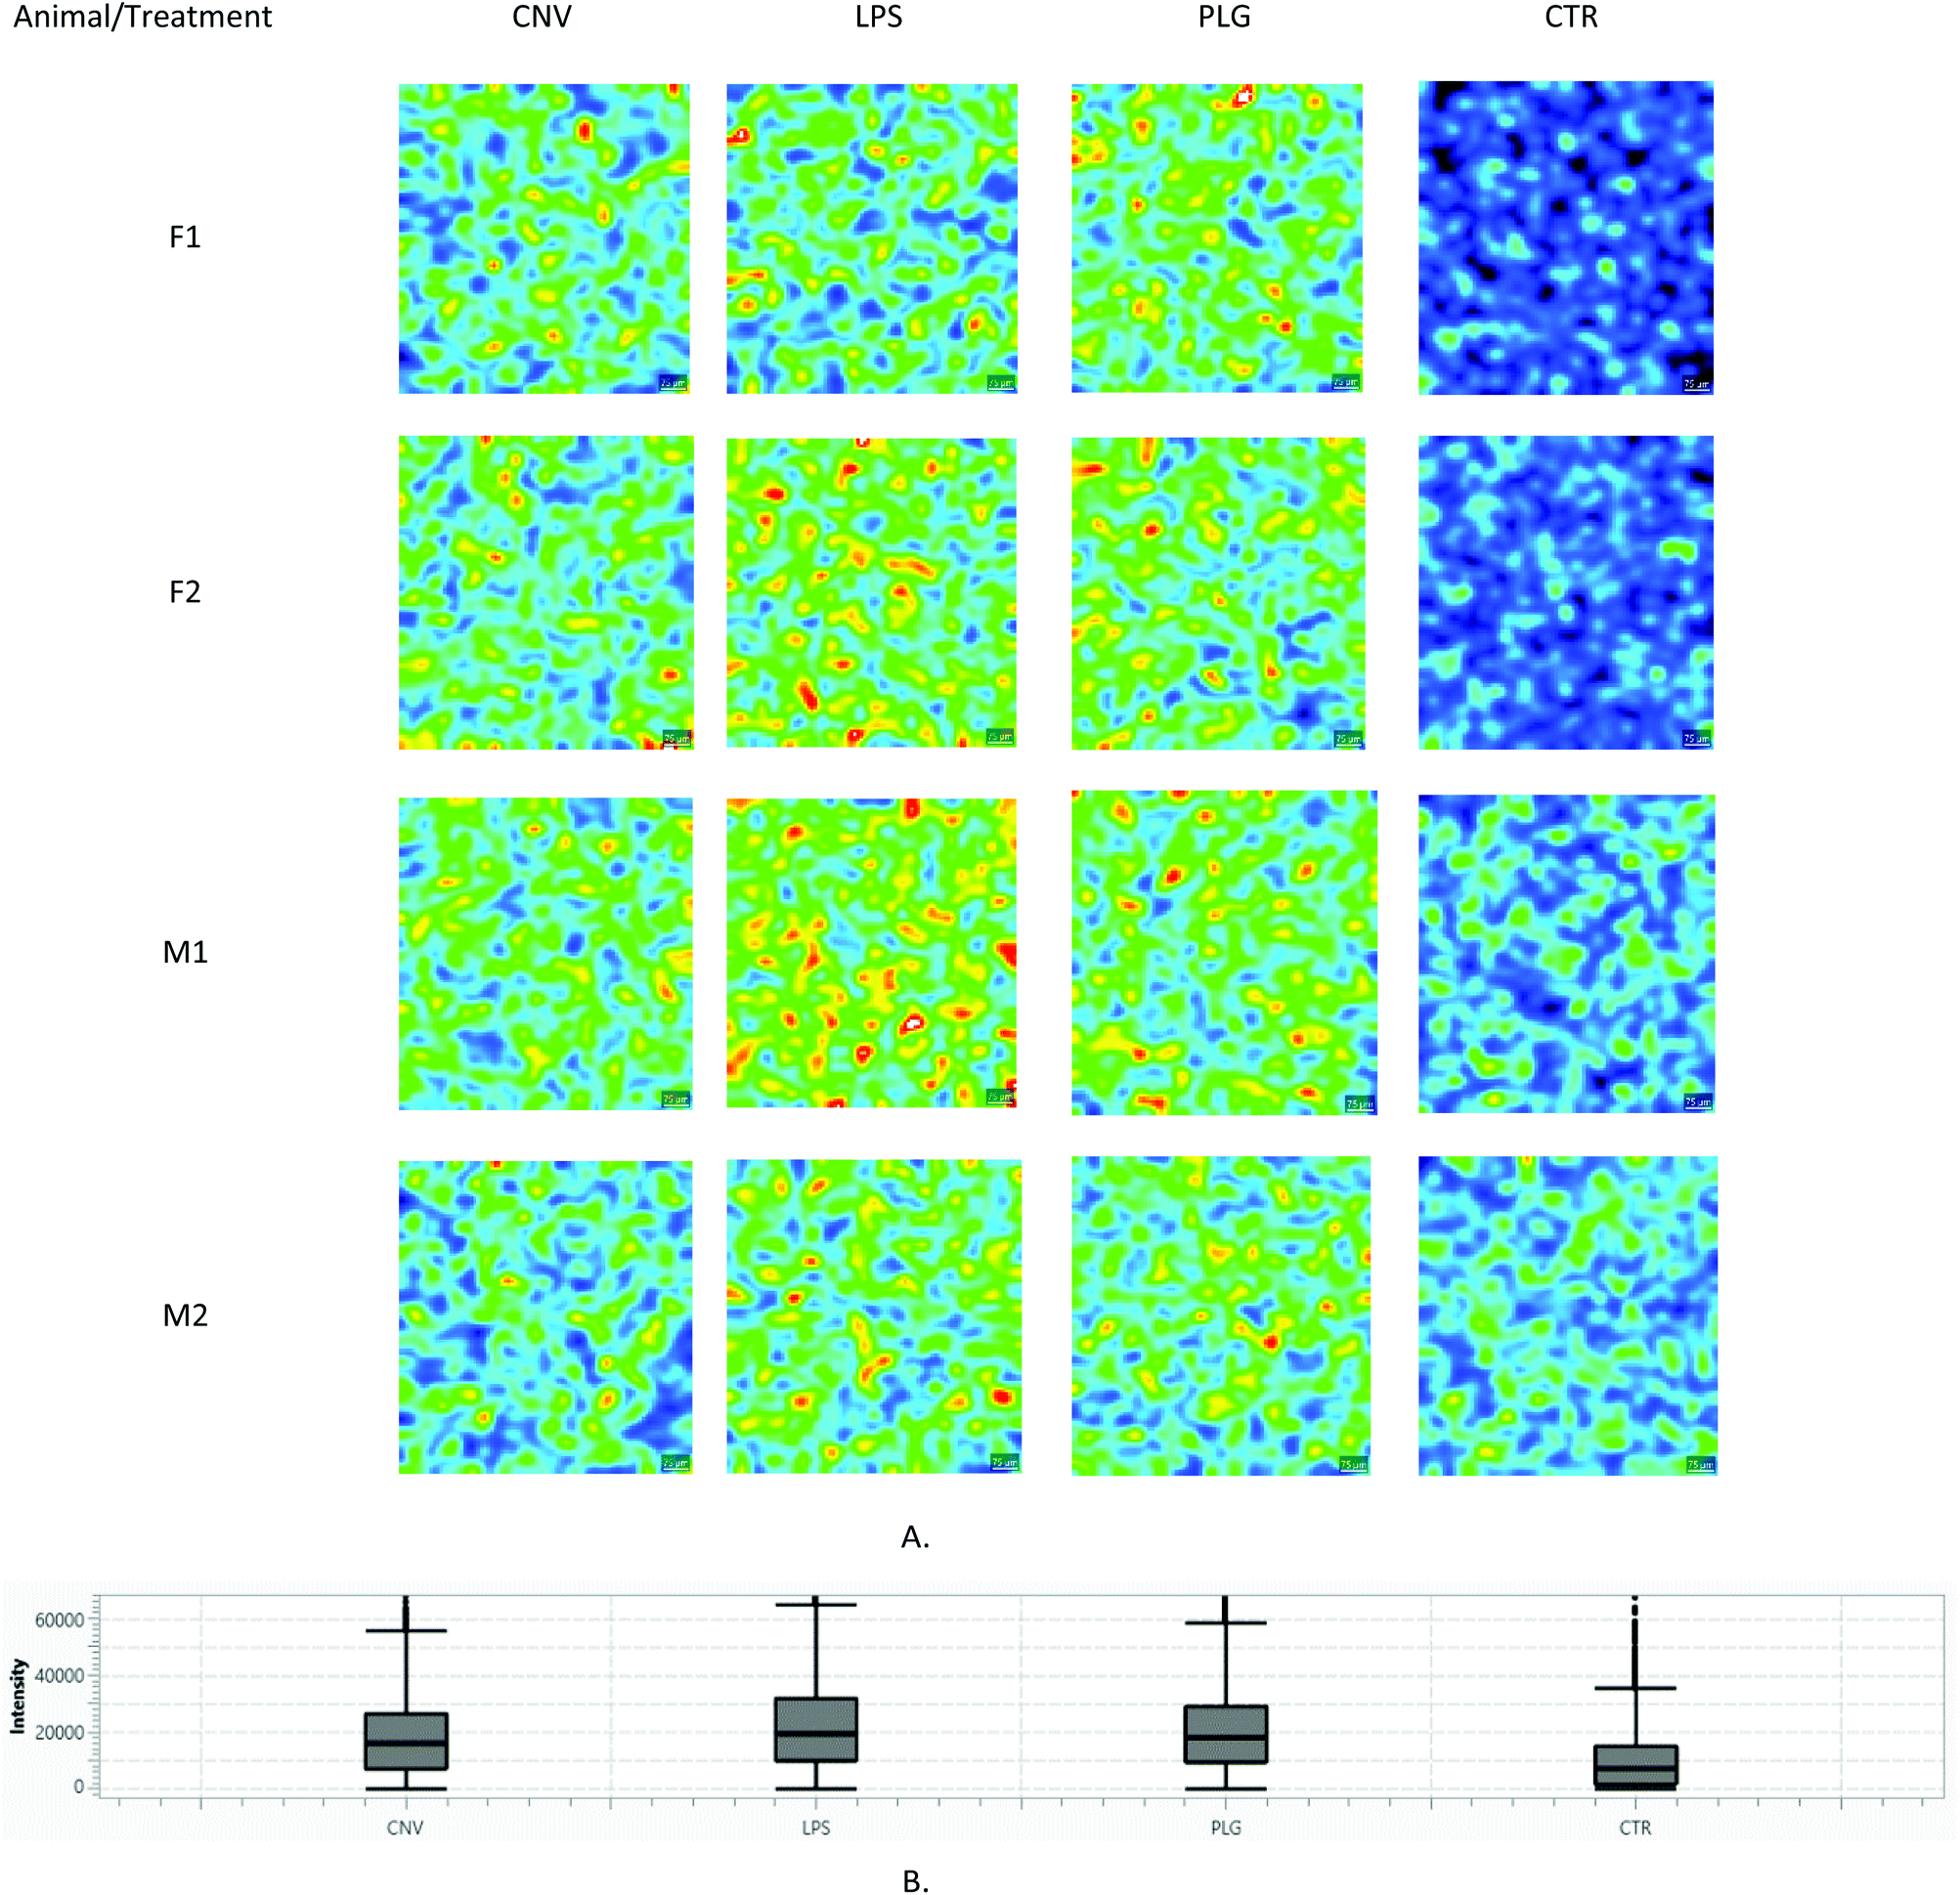 | ||
| Fig. 4 Comparison of m/z = 377.17 Da ± 50 ppm intensities (LysoPA(i-12:0/0:0)): (A) Lateral distributions: the same colour scale corresponding to measured a.u. is used in all images; (B) Box and Whisker plot. Each image corresponds to a different animal (N = 4 × 4). Corresponding light microscopy images are given in the ESI, Part S3.† | ||
Differences in m/z intensities between LPS, PLG and CNV treatments are clearly visible (Fig. 4.). The LysoPA(i-12:0/0:0) content descended in the following order: LPS > PLG > CNV > CTR. In the CTR group, only males showed clearly visible signals of the LysoPA(i-12:0/0:0). In contrast to that, LPS and PLG treatments induced the appearance of strong LysoPA(i-12:0/0:0) associated signals in the kidney cortices of both males and females. Interestingly, the LysoPA(i-12:0/0:0) associated m/z value was non-selective regarding the kidney substructures, i.e. its lateral distribution was diffuse irrespective of the type of DOX formulation (Fig. 4 and ESI, Part S3†). Diffuse kidney injury induced by non-selective DOX action might explain this behaviour: immune cells and fibroblasts recruited to the injured tissue as a part of the inflammatory response produce factors associated with cell migration and proliferation.20 Still, a level of selectivity toward the tissue substructures was expected, especially in the case of nanoformulations. These expectations were confirmed only for the LPS: 7 out of 81 fingerprint m/z values were non-homogeneously distributed in the kidney cortex (ESI, Part S4†). Most of these m/z values showed the strongest intensities in glomeruli regions. The most noticeable example is given in Fig. 5: m/z = 623.01 Da is almost undetectable over PCT regions of the LPS-treated animal while it covers regions of the glomeruli and, to a lesser extent, DCT. In contrast, in the PLG-treated animal corresponding lateral distribution is more homogeneous. It seems that LPS caused only limited chemical disturbances in tubular epithelia. Unfortunately, HMDB search using non-homogeneously distributed m/z values either resulted in multiple or no hits. Although 7 non-homogeneously distributed m/z values did not match any of the well-known metabolites of DOX itself, a possibility that some of these m/z values correspond to some of the less known DOX metabolites should not be neglected.21 A complete list of all 7 annotated m/z values characterized by tissue selective effects found in animals treated with LPS is given in the ESI (Part S4).†
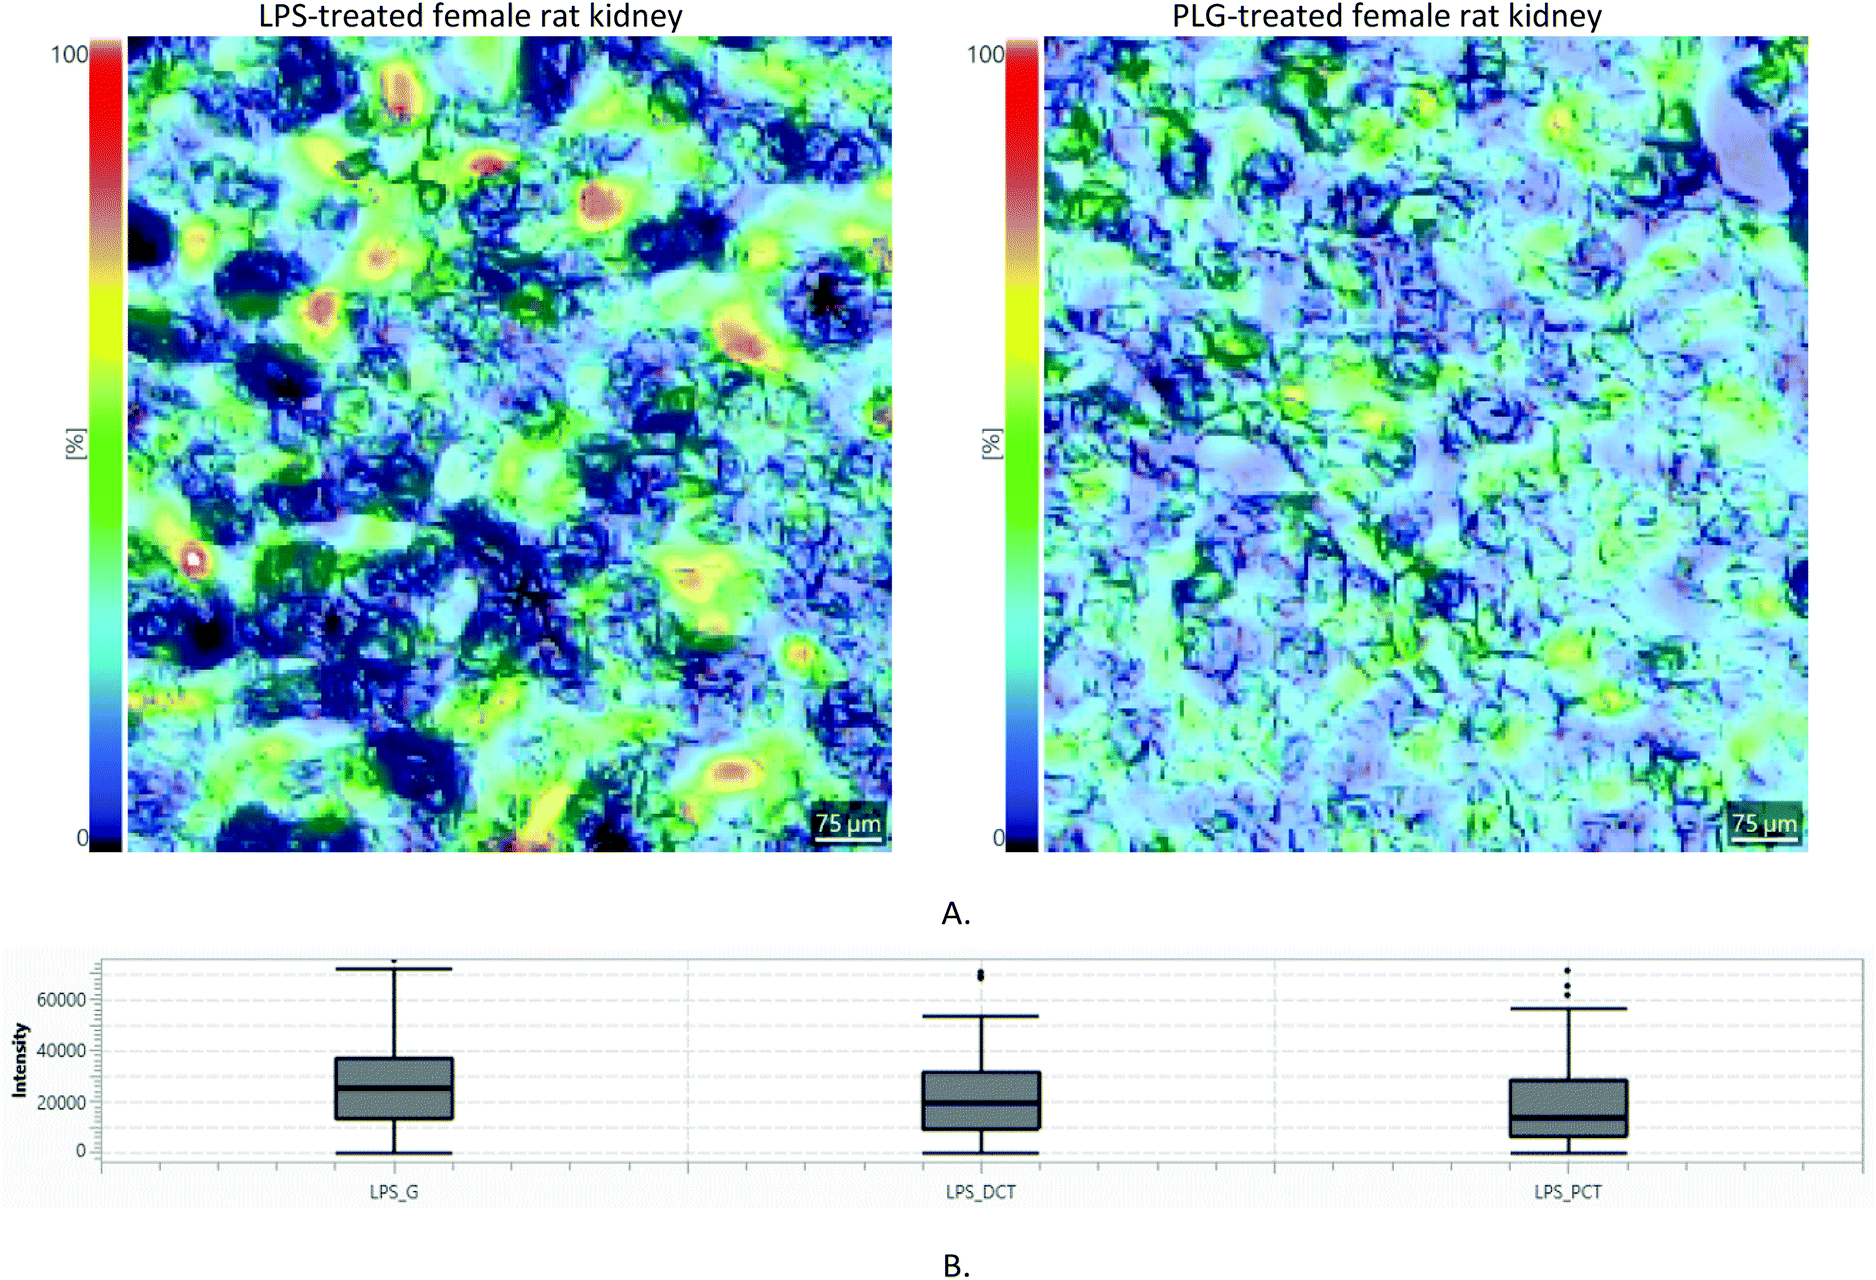 | ||
| Fig. 5 (A) Light microscopy image (25×) of a kidney cortex of the LPS- and PLG-treated animal overlaid with the lateral distribution of m/z value of 623.01 Da ± 50 ppm: dark, worm-like structures coming from the light microscopy image are PCT; (B) Box and Whisker plot showing intensity distribution (a.u.) in the kidney cortex of the LPS-treated animals. G stands for “glomeruli”. | ||
Experimental
Drug formulations
Conventional DOX formulation (CNV), purchased from PLIVA (Zagreb, Croatia), contained 2 mg mL−1 DOX dissolved in excipient solution (NaCl, HCl and NaOH in water) for intravenous use. Liposomal DOX nanoformulation (LPS), purchased from Teva (Petah Tikva, Israel), encapsulates DOX in stable plurilamellar liposomes composed of egg phosphatidylcholine and cholesterol with an aqueous core. It was reconstituted by mixing DOX hydrochloride powder with the liposomal dispersion and sodium carbonate buffer according to the manufacturer's instructions, which resulted in 2 mg mL−1 of DOX. The study also included non-commercial DOX nanoformulation designed by MyBioTech GmbH (Überherrn, Germany) as DOX loaded in poly(lactic-co-glycolic acid) (PLG) nanoparticles at a concentration of 1.9 mg DOX per mL. Details on physicochemical characterization and properties of DOX nanoformulations are given in the ESI (Part S5).†Animal experiments
The study was performed using healthy Wistar rats of both sexes, aged 12 weeks with a body weight (b.w.) of 320–350 g for males (M) and 190–220 g for females (F). Animals were divided into 3 experimental groups (CNV, LPS, and PLG) and one CTR group. Each group consisted of 2 M and 2 F animals (N = 4 × 4). Dose of 3 mg DOX per kg b.w., either in CNV, LPS or PLG dosage form, was administered intraperitoneally (i.p.) to animals from experimental groups 4 times, at 5-day intervals. The control CTR was treated i.p. with saline solution in a volume equivalent to those of the experimental groups. Animals were sacrificed 120 h after the last administration by exsanguination under general anesthesia using a cocktail of anaesthetics. Kidneys were immediately collected, transferred to the experimental tubes and stored at −70 °C until analysis. Experiments were approved by the Ethical Committee of the Croatian Ministry of Agriculture, Directorate of Veterinary and Food Safety, Department of Animal Welfare (approval no. P/8634610) respecting EU Directive 2010/63/EU for animal experiments, Animal Protection Act (OG 135/06), the Ordinance on the protection of animals used for experimental and other scientific purposes (OG, 47/11) and all other national and EU legislation relevant for the use of animals for scientific purposes. More details on animal experiments may be found in the ESI (Part S6).†Cryosections
Kidney cortex samples were prepared using a CM1950 cryostat (Leica, Wetzlar, Germany) that operated at −20 °C. The cuts were made in transversal orientation, with thickness set to 10 μm. All samples were mounted on the indium tin oxide (ITO) coated glass slides (Sigma Aldrich, Munich, Germany; sheet resistance of 15–25 Ω per sq) and stored at −70 °C until further analysis.Light microscopy
Light microscopy images of kidney cortex cryosections were recorded using incident light. Magnification was set to 25×. The light microscope integrated into the iMScope Trio mass microscope (Shimadzu, Kyoto, Japan) was used for this purpose.Matrix application
ITO slides were covered by 2,5-dihydroxybenzoic acid (DHB; Sigma Aldrich, St Louis, USA) using an iMLayer sublimation device (Shimadzu, Kyoto, Japan). Sublimation lasted for 25 min while all other parameters were set according to the manufacturer's instructions. After sublimation, the slides were enclosed in a plastic container that contained filter paper soaked in 5% methanol (Merck, Darmstadt, Germany). The container was heated to 70 °C for 105 s to allow the recrystallization of the matrix to occur. Afterwards, the slides were left to dry for 10 min.Acquisition of MS images
All mass spectra were recorded using an iMScope TRIO mass microscope (Shimadzu, Kyoto, Japan). MS images consisting of 1015 pixels were recorded in the 200–650 and 650–1000 m/z range using the following settings: positive ionization; laser diameter of ca. 25 μm and repetition rate of 1000 Hz; x and y laser pitch of 30 and 26 μm, respectively; 50 laser shots per pixel; laser intensity of 47%; 3.5 kV sample voltage and 1.9 kV detector voltage. Crystalline DHB was used for calibration of the mass spectrometer. Mass spectra of the kidney cortex averaged over each group of animals are given in the ESI (Part S7).†Data analysis
Recorded MS images were imported into the IMAGEREVEAL 1.1 software (Shimadzu, Kyoto, Japan). Total ion count (TIC) normalization was applied. m/z signals were divided into ±50 ppm bins and the matrix m/z values were eliminated. m/z intensities averaged over all recorded pixels per sample served as an input for processing in the R programming language.22,23 Data from two recorded m/z ranges were pooled to create a complete data list for each sample. Only the strong m/z values were retained for further analysis: strong m/z values were the ones in which the sum of intensities across all images (∑Im/z) was greater than 1% of the largest ∑Im/z. PCA of the kidney cortex histochemistry was performed using the average mass spectra of all animals. Scaled and centered spectra were restricted to strong m/z values. False discovery rate (FDR) adjusted Welch t test and log2-fold change were applied to each strong m/z value recorded on cryosections coming from the CTR and from each of the treatment groups (N = 4 + 4): the results were presented in the form of a Volcano plot and in the form of a Venn diagram. The statistical significance was set to p < 0.05 and absolute log2-fold change >1 represented the biological significance limit.24 Venn diagram has been chosen for the purpose of classification of the significant m/z values based on their associations to treatments: significant m/z values exclusively associated either with the CNV or with the nanoformulations (LPS and PLG) represent specific histochemical fingerprints which form easily identifiable subsets in the diagram. Fingerprint m/z values were used for the HMDB search:25 only the search hits corresponding to a single endogenous or essential compound, referred to as “putative metabolites”, were retained while the m/z values associated with multiple database search hits, like isobars, were excluded from further analyses.26 The database search was performed using the ±50 ppm matching tolerance and the following types of adducts: +H+, +Na+, +K+ and +H+-H2O. One-way analysis of variance (ANOVA) of the fingerprint m/z values aimed at the differentiation of the tissue substructures (glomeruli, DCT and PCT) specific responses to the administration of each DOX formulation was performed within IMAGEREVEAL 1.1 (Shimadzu, Kyoto, Japan) environment. FDR adjustment of p values coming from that analysis was performed using R script. Depiction of tissue substructures is given in the ESI (Part S3).†
Graphics
MS images of the selected putative metabolite's spatial distributions and associated Box–Whisker plots were created using IMAGEREVEAL 1.1 (Shimadzu, Kyoto, Japan): linear interpolation, Gaussian filter and ±50 ppm m/z width were used for that purpose.Conclusions
The IMS analysis indicated a wide range of chemical disturbances in the kidney cortex of rats treated with different formulations of DOX showing the importance of such analysis in safety profiling of drugs. Observed chemical changes in non-targeted tissue were divided into DOX-specific and formulation-specific ones, and subsequently, into CNV-specific and nanoformulation-specific fingerprints. Analysis yielded 22 significant m/z values forming CNV-specific histochemical fingerprint and 59 significant m/z values that form the nanoformulation-specific fingerprint. Some of these values were associated with apoptosis in the kidney cortex, an effect shared by all DOX formulations. However, cell migrations and cell proliferations were nanoformulation-specific. Quite unexpectedly, PLG effects were more similar to the effects of CNV than to the effects of LPS and PLG was also characterized by greater histochemical alterations. The advantages of the IMS technique for safety profiling of different drug formulations are convincingly represented by the images of lateral m/z distributions. Along with classifying different DOX formulations by their impact on specific m/z intensities, such analysis enabled visual assessment of DOX formulations’ selectivity for different tissue substructures. In contrast to CNV and PLG, LPS formulation showed some level of selectivity for kidney cortex substructures and it induced the least number of histochemical changes. These conclusions are limited to the toxicity testing of different DOX formulations using healthy animals of both sexes.In summary, this study demonstrated that IMS is an information-rich resource suitable for the analysis of the chemical effects of cytotoxic drugs in non-targeted tissues. Even more, IMS-based analysis enables differentiation of drug formulation-specific effects highlighting the value of IMS in drug development.
Author contributions
ZD and IVV designed the study. PLG DOX nanoformulation was prepared by NGT and ET. BP and NK performed characterizations of LPS and PLG DOX formulations. Animal experiments were performed by VM, KI and IP. Histological analysis was performed by DG and MC. MALDI TOF MS analysis was performed by EG, DM, AB and ZD. The manuscript was written by ZD, IVV, EG, ND and SM. All authors gave their consent for publication of the study.Conflicts of interest
The authors declare no conflict of interest.Acknowledgements
This study was financially supported by the “Research Cooperability” Program of the Croatian Science Foundation funded by the European Union from the European Social Fund under the Operational Programme Efficient Human Resources 2014–2020 (grant HRZZ-PZS-2019-02-4323), the European Regional Development and Croatian Ministry of Science fund under the Operational Programme “Competitiveness and Cohesion 2014–2020” (grant KK.01.1.1.02.0015.), and the EU H2020 project “PHOENIX – Pharmaceutical Open Innovation Test Bed for Enabling Nano-pharmaceutical Innovative Products” funded under grant agreement no. 953110.References
- N. Singhal, M. Kumar, P. K. Kanaujia and J. S. Virdi, Front. Microbiol., 2015, 6, 791 CrossRef PubMed.
- A. Nilsson, R. J. A. Goodwin, M. Shariatgorji, T. Vallianatou, P. J. H. Webborn and P. E. Andrén, Anal. Chem., 2015, 87, 1437–1455 CrossRef CAS PubMed.
- J. Shi, P. W. Kantoff, R. Wooster and O. C. Farokhzad, Nat. Rev. Cancer, 2016, 17, 20–37 CrossRef PubMed.
- J. Wolfram and M. Ferrari, Nano Today, 2019, 25, 85–98 CrossRef CAS PubMed.
- Y. S. Youn and Y. H. Bae, Adv. Drug Delivery Rev., 2018, 130, 3–11 CrossRef CAS PubMed.
- C. Zandanel, R. Legouffe, V. Trochon-Joseph, A. Tomezyk, M. Gaudin, D. Bonnel, J. Stauber, B. Vasseur and N. Bromet, J. Drug Delivery Sci. Technol., 2018, 47, 55–61 CrossRef CAS.
- M. Jove, J. Spencer, M. Clench, P. M. Loadman and C. Twelves, Crit. Rev. Oncol. Hematol., 2019, 141, 153–162 CrossRef PubMed.
- M. Polimeni, C. Voena, J. Kopecka, C. Riganti, G. Pescarmona, A. Bosia and D. Ghigo, Biochem. J., 2011, 439, 141–149 CrossRef CAS PubMed.
- C. F. Thorn, C. Oshiro, S. Marsh, T. Hernandez-Boussard, H. McLeod, T. E. Klein and R. B. Altman, Pharmacogenet. Genomics, 2011, 21, 440–446 CrossRef CAS PubMed.
- O. S. Bains, A. Szeitz, J. M. Lubieniecka, G. E. Cragg, T. A. Grigliatti, K. W. Riggs and R. E. Reid, J. Pharmacol. Exp. Ther., 2013, 347, 375–387 CrossRef CAS PubMed.
- A. Sun, Y. Cheng, Y. Zhang, Q. Zhang, S. Wang, S. Tian, Y. Zou, K. Hu, J. Ren and J. Ge, J. Mol. Cell. Cardiol., 2014, 71, 92–104 CrossRef CAS PubMed.
- C. M. Schaupp, C. C. White, G. F. Merrill and T. J. Kavanagh, Chem.-Biol. Interact., 2015, 234, 154–161 CrossRef CAS PubMed.
- H. Taymaz-Nikerel, M. E. Karabekmez, S. Eraslan and B. Kırdar, Sci. Rep., 2018, 8, 13672 CrossRef PubMed.
- T. Matsunaga, S. Kawabata, Y. Yanagihara, C. Kezuka, M. Kato, Y. Morikawa, S. Endo, H. Chen, K. Iguchi and A. Ikari, Chem.-Biol. Interact., 2019, 314, 108839 CrossRef CAS PubMed.
- H. Sonowal, A. Saxena, S. Qiu, S. Srivastava and K. V. Ramana, Eur. J. Pharmacol., 2021, 895, 173884 CrossRef CAS PubMed.
- A. Pugazhendhi, T. N. J. I. Edison, B. K. Velmurugan, J. A. Jacob and I. Karuppusamy, Life Sci., 2018, 200, 26–30 CrossRef CAS PubMed.
- J. K. Lukowski, E. M. Weaver and A. B. Hummon, Anal. Chem., 2017, 89, 8453–8458 CrossRef CAS PubMed.
- J. W. Jung, M. S. Lee, H. J. Choi, S. Jung, Y. J. Lee, G. S. Hwang and T. H. Kwon, Am. J. Physiol. – Renal Physiol., 2016, 310, F1317–F1327 CrossRef CAS PubMed.
- M. Sahin, J. M. Neumann, B. Riefke, H. Bednarz, K. Gutberlet, M. Giampà, K. Niehaus and A. Fatangare, Toxicol. Lett., 2020, 334, 36–43 CrossRef CAS PubMed.
- S. A. Lee, S. Noel, M. Sadasivam, A. R. A. Hamad and H. Rabb, Nephron, 2017, 137, 282–286 CrossRef CAS PubMed.
- X. Wang, R. Hui, Y. Chen, W. Wang, Y. Chen, X. Gong and J. Jin, Front. Pharmacol., 2019, 10, 1434 CrossRef CAS PubMed.
- R Core Team, A language and environment for statistical computing, R Foundation for Statistical Computing, Vienna, Austria, 2020 Search PubMed.
- J. Weiner, S. K. Parida, J. Maertzdorf, G. F. Black, D. Repsilber, A. Telaar, R. P. Mohney, C. Arndt-Sullivan, C. A. Ganoza, K. C. Fae, G. Walzl and S. H. E. Kaufmann, PLoS One, 2012, 7, e40221 CrossRef CAS PubMed.
- D. J. Mccarthy and G. K. Smyth, Bioinformatics, 2009, 25, 765–771 CrossRef CAS PubMed.
- D. S. Wishart, Y. D. Feunang, A. Marcu, A. C. Guo, K. Liang, R. Vázquez-Fresno, T. Sajed, D. Johnson, C. Li, N. Karu, Z. Sayeeda, E. Lo, N. Assempour, M. Berjanskii, S. Singhal, D. Arndt, Y. Liang, H. Badran, J. Grant, A. Serra-Cayuela, Y. Liu, R. Mandal, V. Neveu, A. Pon, C. Knox, M. Wilson, C. Manach and A. Scalbert, Nucleic Acids Res., 2018, 46, D608–D617 CrossRef CAS PubMed.
- L. W. Sumner, A. E. Alexander, A. Ae, D. B. Ae, M. H. B. Ae, R. Beger, C. A. Daykin, A. E. Teresa, W.-M. Fan, A. E. Oliver, F. Ae, R. Goodacre, A. E. Julian, L. Griffin, A. E. Thomas, H. Ae, N. Hardy, A. E. James, H. Ae, R. Higashi, A. E. Joachim, K. Ae, A. N. L. Ae, J. C. Lindon, A. E. Philip, M. Ae, A. W. N. Ae, M. D. Reily, J. J. T. Ae, M. R. Viant, L. W. Sumner, A. Amberg, D. Barrett, M. H. Beale, R. Beger, C. A. Daykin, Á. R. Higashi, R. Higashi, O. Fiehn and R. Goodacre, Metabolomics, 2007, 3, 211–221 CrossRef CAS PubMed.
- J. E. Vance and R. Steenbergen, Prog. Lipid Res., 2005, 44, 207–234 CrossRef CAS PubMed.
- L.-J. Yan, Anim. Models Exp. Med., 2021, 4, 329–342 CrossRef CAS PubMed.
- L. H. M. Geraldo, T. C. L. S. Spohr, R. F. do Amaral, A. C. C. da Fonseca, C. Garcia, F. de A. Mendes, C. Freitas, M. F. dosSantos and F. R. S. Lima, Signal Transduction Targeted Ther., 2021, 6, 1–18 CrossRef PubMed.
- F. Park and D. D. Miller, Physiol. Genomics, 2017, 49, 659–666 CrossRef CAS PubMed.
- D. Ito, H. Kawamura, A. Oikawa, Y. Ihara, T. Shibata, N. Nakamura, T. Asano, S. I. Kawabata, T. Suzuki and S. Masuda, Commun. Biol., 2020, 3, 1–11 CrossRef PubMed.
- A. Harzandi, S. Lee, G. Bidkhori, S. Saha, B. M. Hendry, A. Mardinoglu, S. Shoaie and C. C. Sharpe, iScience, 2021, 24, 102046 CrossRef PubMed.
Footnote |
| † Electronic supplementary information (ESI) available. See DOI: https://doi.org/10.1039/d2an00355d |
| This journal is © The Royal Society of Chemistry 2022 |