
 Open Access Article
 This Open Access Article is licensed under a Creative Commons Attribution-Non Commercial 3.0 Unported Licence
Hyphenated structural identification of additives in transmission fluids†
F. H. M.
van Zelst
ab,
J.
Romanuka
c and
A. P. M.
Kentgens
 *a
*a
aInstitute for Molecules and Materials, Radboud University, Heyendaalseweg 135, 6525 AJ Nijmegen, The Netherlands. E-mail: A.Kentgens@nmr.ru.nl
bTI-COAST, Science Park 904, 1098 XH Amsterdam, The Netherlands
cShell Global Solutions International B.V., 1031 HW Amsterdam, The Netherlands
First published on 11th April 2022
Abstract
Transmission fluids and other lubricants are used to reduce friction in engines and other surfaces. Additives in these transmission fluids are important for prolonging their lifetime and obtaining the desired physical properties for the lubricant. In this work, we show the successful structural identification of an important class of additives in transmission fluids by hyphenating several analytical techniques in-line. First, a separation of the additives in a transmission fluid was achieved within 10 minutes by using supercritical fluid chromatography. SFC-1H NMR was then used as a novel analysis method to structurally identify different additives in transmission fluids, in combination with mass spectrometry data. By this unique hyphenation of SFC, NMR spectroscopy and MS, several alkylated diphenylamines were identified, which are one of the most important classes of antioxidants.
1. Introduction
Lubricants, such as engine oils and transmission fluids, are used to reduce friction between moving surfaces. They typically consist of a base oil, which can be mineral-based or synthetic, and an additive package, which can make up to 30% of the total lubricant composition.1 These additive packages can be very complex and their exact composition, consisting of antioxidants, corrosion inhibitors, anti-foaming agents, etc., depends on the intended use of the lubricant. Due to their complexity, the exact composition of the additive package is often unknown. The additives make sure that the lubricant has the desired physical properties, such as viscosity, temperature resistance and pour point, but also prolong the lifetime of the lubricant and with that the lifetime of the engine, for example by preventing oxidation of the surfaces or the lubricant itself and preventing particle formation. For each of these purposes, not only one, but often a combination of additives gives the best result, adding up to a large amount of different molecules being present in the base oil. In order to fully understand the performance of the additives, it is useful to do a structural analysis of the lubricant, not only directly after fabrication, but also after use to track the changes and chemical reactions that occur during ageing of the lubricant. A better understanding of the ageing of additives by looking at structural changes over time can help prevent breakdown of the engine or transmission gear. Also when transmission fluids are not in use, ageing plays a role. For example, it is currently unknown if the additives are stable over time, or if oxidative processes occur on the shelf, which could compromise the working of the transmission fluid. An understanding of the ageing of additives can also help in determining the shelf-life of transmission fluids.There have been many efforts to study lubricant ageing and degradation. A few examples of the analytical techniques that are used for such studies are Fourier transform infrared spectroscopy (FT-IR),2 differential scanning calorimetry (DSC),3,4 gas or liquid chromatography coupled to mass spectrometry (GC-MS or LC-MS)16 and nuclear magnetic resonance spectroscopy (NMR).4,5 It is however difficult to find a technique that can handle the complexity of the mixtures as well as being able to handle the diversity of all the additives and other molecules that are present in different types of lubricants.
When specific structural information is needed, MS and NMR are generally the techniques of choice. Even though MS is very sensitive, it is not always straightforward to obtain the structure from the mass data without referring to, often incomplete, databases. NMR spectroscopy is a very versatile technique, and able to give direct structural information about a molecule. However, when samples are too complex, crowding in the NMR or MS spectra will hinder structural elucidation. Combining these techniques with a separation technique, such as what has been done with GC-MS and LC-MS, helps in reducing the sample complexity.
We have recently developed a new hyphenated methodology for studying a wide range of complex mixtures by coupling supercritical fluid chromatography (SFC)6 directly to a nuclear magnetic resonance (NMR) spectrometer.7–9 Given the complexity of the additive packages in lubricants, we have used this technique to first separate a complex lubricant sample, before structurally analysing the different components by NMR spectroscopy to see if specific additives can be identified.
2. Experimental
2.1. SFC-NMR set-up
The SFC-NMR set-up used for this research has been introduced in a previous publication.9 In this set-up a Waters Acquity UPC2 instrument was coupled to a Varian VNMRS spectrometer operating at 600 MHz (14.1 T). The fraction of interest is first selected after separation by SFC, concentrated in-line and transported to the middle of the NMR detector for analysis. At first the chromatography run is optimised and the timing of the eluting fraction is determined by looking at the UV or MS signals, which are part of the SFC setup. In the following runs, the fraction of interest is selected by switching a valve at the correct time, letting the sample and mobile phase into a purged 150 μL sample loop. When the valve switches back, the sample is inserted into a purged flowline at atmospheric pressure, causing the sample to expand to atmospheric pressure. The pressure drop causes the mobile phase, CO2, to evaporate and the compound of interest to stay behind on the walls of the tube. This process of peak selection and expansion can be repeated multiple times to collect more sample on the inside walls of the tube. After the fraction is selected, a water flow will start filling the PEEK tubing with an inner diameter of 0.254 mm, flowing at a rate of 0.1 mL min−1 towards the NMR probe. After the tubing is completely filled with water, a plug of strong solvent, in this case 15 μL of CDCl3 (Cambridge Isotope Laboratories, 99.8% deuterated + 0.05% v/v TMS), is introduced into the water flow to elute the sample. This plug flows towards the middle of the NMR stripline detector, at which point the flow is stopped by another switching valve. Stopping the flow enables the acquisition of multiple scans to improve the signal-to-noise ratio. After the experiment, the valve returns to its original position and the sample flows from the NMR probe to the waste.2.2. Instruments and data processing
For NMR detection of the sample, a home-built stripline probe, optimised for SFC-NMR, was used. This accommodates a capillary with an outer diameter of 700 μm and an inner diameter of 500 μm and has an active detection volume of ∼1.6 μL.9 All spectra were recorded using an acquisition time of 1 s and a relaxation delay of 6 s. The SFC-NMR spectra were recorded overnight in 1200 blocks of 8 scans, taking a total time of 18.5 h each. For the reference spectrum of the unseparated sample, a 1![[thin space (1/6-em)]](https://www.rsc.org/images/entities/char_2009.gif) :5 mixture of transmission fluid in CDCl3 was injected directly into the choloroform loop and transported to the NMR probe in a water flow. 100 blocks of 8 scans were recorded, taking a total time of 1.5 h. All spectra were recorded with a receiver bandwidth of 8 kHz. The spectra were processed using ssNake.10 The different blocks of spectra were aligned using the maximum of the TMS peak and summed to correct for the magnet drift. The spectra were then referenced to the TMS peak at 0 ppm, and baseline corrected.
:5 mixture of transmission fluid in CDCl3 was injected directly into the choloroform loop and transported to the NMR probe in a water flow. 100 blocks of 8 scans were recorded, taking a total time of 1.5 h. All spectra were recorded with a receiver bandwidth of 8 kHz. The spectra were processed using ssNake.10 The different blocks of spectra were aligned using the maximum of the TMS peak and summed to correct for the magnet drift. The spectra were then referenced to the TMS peak at 0 ppm, and baseline corrected.
2.3. SFC chromatography
The test sample was a commercially available transmission fluid with a mineral base oil and an additive package of unknown composition. For the separation of this sample, a 100 mm × 3.0 mm Acquity UPC2 Torus 2-PIC (1.7 μm particle size) packed column (Waters) was used at a backpressure of 120 bar, a flow rate of 1.5 mL min−1, and a temperature of 50 °C. A mobile phase gradient of 0% methanol (BioSolve, SFC grade) in CO2 (Linde Gas Benelux, 2.7) until 2 min, 0% to 3% methanol from 2 min to 5 min and 5% methanol in CO2 until 10 min was used to separate the sample. For each separation, 5 μL of a 1:5 mixture of transmission fluid in n-hexane (AnalaR NORMAPUR, VWR chemicals) was injected onto the SFC column. UV chromatograms were recorded at a wavelength range of 200 nm to 300 nm. For MS detection, a Waters QDa MS detector was used. The flow is split before the backpressure regulator, and a make-up flow of methanol with ammonia was used for the MS, at a flow rate of 0.5 mL min−1. The MS detector was used in positive ionisation mode (ESI+), with a probe temperature of 600 °C, a capillary voltage of 0.8 kV and a cone voltage of 15 V.
3. Results and discussion
To study the additives in the transmission fluid sample, the sample was separated by SFC. The chromatograms of the separation are shown in Fig. 1. The mass spectrometry (ESI+ and ESI−) and the UV traces are all shown, since not all compounds are UV active or ionisable for MS detection. In the ESI,† the chromatogram of the solvent without sample, a blank, is also provided. | ||
| Fig. 1 (a) Mass spectrometry (ESI+ and ESI−) and UV (projection of 2D data) chromatograms of the SFC separation of transmission fluid. The intensities were scaled. (b) 2D mass spectrometry data, showing the mass eluting from the column at a certain time during the separation. The positive ionisation trace (ESI+), also shown in the top figure, is shown in the figure for comparison to the 1D data. | ||
As can be seen from the chromatograms, a clear separation of the compounds was achieved, except for the co-eluting masses in the first peak at 1 min. From 1.5 min to 2.9 min a series of compounds with a mass difference of 56 m/z is eluting. From 3.1 min to 6.2 min another series of compounds is eluting, clustered in groups of three compounds with a mass difference of 14 m/z within the group. This probably corresponds to similar compounds with an additional –CH2 group in an alkyl chain each time. These compounds were not UV active. Finally, by using a more polar mobile phase composition at the end of the chromatogram, five compounds are eluting with a mass difference of 28 m/z, probably corresponding to two extra –CH2 groups. It is good to note that in the first two minutes, pure CO2 is used as the mobile phase. After these 2 min, an increasing amount of methanol is mixed in with the CO2. Roughly speaking, more polar compounds will tend to elute towards the end and non-polar compounds more at the beginning.
In this work we have focussed on the first part of the chromatogram, where three peaks with a mass difference of 56 m/z are eluting. We have chosen to focus on these fractions, since they were UV active and showed up in the mass spectrometer, leading to a maximum amount of data from different sources to be able to determine the molecular structures of these compounds. In the mass spectrometry data, these fractions, eluting between 1.5 min to 2.9 min, have masses of 282, 338 and 394 respectively in positive ionisation mode (mass spectra of each fraction are provided in the ESI†) and 280, 336 and 392 in negative ionisation mode. The molecular masses of these compounds are therefore 281, 337 and 393. These odd molecular masses often indicate the presence of an odd number of nitrogen atoms in the structure. The mass steps of 56 m/z between the compounds could be due to the addition of a tert-butyl group. The UV measurements indicate UV absorption maxima at 276 nm, 278 nm and 280 nm for these three compounds respectively (data supplied in the ESI†). Absorption around this wavelength does not give a definite answer on a specific structural element in the molecule.
Since it is difficult to get the molecular structure purely from this MS and UV data, we have analysed the sample with SFC-1H NMR/MS. For the analyses, each of the peaks were collected from the chromatograph, by opening a loop at the correct time. The fraction was then (partially) collected in that loop and switched to a different part of the system where the sample can expand. The mobile phase, CO2, expands into a gas and leaves the system, whereas the sample sticks to the tubing walls. This process was repeated 15 times, to collect enough sample for NMR analysis. The sample was then dissolved into a small plug of deuterated chloroform, which flowed towards the NMR detector. The plug was stopped at the center of the NMR detector and analysed by 1H NMR. This process was repeated for all three of the peaks of interest. The resulting three SFC-1H NMR spectra, zoomed in on the aromatic region (a) and on the alkyl region (b) of the spectra, are shown in Fig. 2. The full spectra can be found in the ESI.†
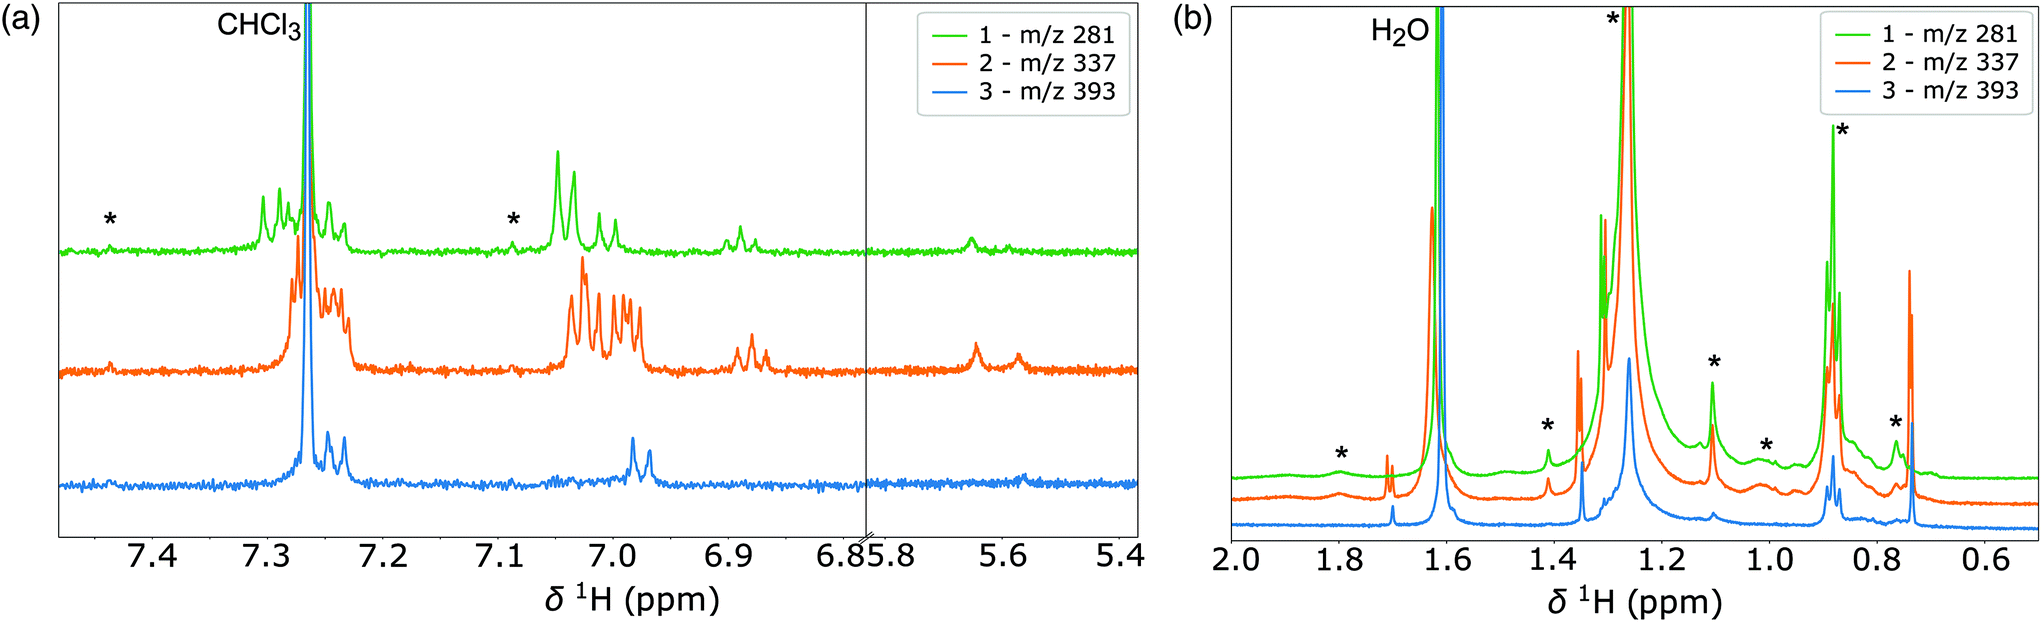 | ||
| Fig. 2 SFC-1H NMR spectra of three selected fractions in transmission fluid, zoomed in on the aromatic region (a) and on the alkyl region (b). The *-symbols indicate peaks that do not originate from the compounds of interest, that come from impurities or 13C satellite peaks. | ||
From the spectra it is evident that the compounds of interest are aromatic, since peaks are present in the region from 6.8 ppm to 7.4 ppm. The peaks around 5.6 ppm are broader, probably corresponding to an –OH or –NH group in the molecule. In the alkyl region, from 0.7 ppm to 1.8 ppm, many peaks are observed. Some peaks, marked with a *-symbol are present in all three samples and are probably due to an impurity. When the same experiment is repeated, but without injecting any sample in the SFC, the peaks are not observed, leading to the conclusion that these peaks originated from the full, unseparated sample. Possibly some of the base oil, that is not ionisable for MS detection nor UV active, is co-eluting with the compounds of interest. These fractions are ignored in the further structural identification of the compounds. We will focus on the unique peaks in the spectra for each compound in order to obtain the molecular structure. These are the aromatic peaks, the broad peak around 5.6 ppm and the peaks at 0.74 ppm (not present for m/z 281), 1.31 ppm (not present for m/z 393), 1.35 ppm (not present for m/z 281) and 1.7 ppm (not present for m/z 281).
In order to deduce the molecular structures of the three compounds, we started with the simplest spectrum, namely the third spectrum from the compound with a molecular mass of 393. From the odd mass, we already deduced that an odd number of nitrogen atoms are probably present in the molecule. Combined with the broad peak at 5.6 ppm, this could indicate the presence of a –NH group in the molecule. If we assume the aromatic signals originate from a benzene ring, the two aromatic doublets at 6.98 ppm and 7.24 ppm indicate a para substituted ring. The remaining signals in the alkyl region are at 0.73 ppm, 1.35 ppm and 1.70 ppm with an integral ratio of 9:6:2 respectively. As mentioned before, the mass difference of 56 between the compounds might correspond to the loss of a tert-butyl group. This group should therefore be an endgroup in the molecular structure. Since this mass difference is present multiple times, in the heaviest molecule of m/z 393, multiple butyl groups or a chain of coupled butyl groups could be present. Two coupled butyl groups, a tert-octyl group, would give an integral ratio of 9:6:2 for the different protons, which corresponds to the integral ratio observed in the spectrum for the three peaks in the alkyl region. The structure we are looking for could therefore be a combination of para substituted benzene ring with an –NH and a tert-octyl group. However, these elements do not add up to a mass of 393. We therefore return to the NMR spectrum. Looking at the other peak integrals we roughly observe a ratio of 18:12:4:1:4:4 for all peaks going from right to left in the spectrum (0.73 ppm, 1.35 ppm, 1.70 ppm, 5.6 ppm (broad), 6.98 ppm (doublet) and 7.24 ppm (doublet)). For one proton in the broad peak (–NH?) we therefore have four protons for each doublet. This corresponds to two equal para substituted benzene rings. This also corresponds to two equal tert-octyl groups. The proposed structure for the third peak is therefore a –NH group bridging two para substituted benzene rings, both with an tert-octyl group attached to the ring. The mass of this molecule, 4,4′-bis(1,1,3,3-tetramethylbutyl)diphenylamine, is 393.6 g mol−1 and corresponds to the MS data. The structure of compound 3, 4,4′-bis(1,1,3,3-tetramethylbutyl)diphenylamine, is displayed in Fig. 3. This molecule has been reported before as an antioxidant in synthetic base oils for gas turbine engines.11 Alkylated diphenylamines are one of the most important classes of antioxidants. The amine group in the structure can react with radicals by donating the hydrogen atom to stabilise the transmission fluid. The alkyl tails make the pure additive, or the polar reaction product after oxidation, soluble in the transmission fluid or oil.12
 | ||
| Fig. 3 Structure of compound 3 with m/z 393 in the transmission fluid: 4,4′-bis(1,1,3,3-tetramethylbutyl)diphenylamine, derived from the SFC-1H NMR spectrum. The *-symbols indicate impurities. | ||
Now that the structure of the third SFC fraction was unravelled, it is easier to obtain the structures of the other two compound. Since we know that compound 2 is lighter by 56 mass units and that compound 1 is another 56 mass units lighter than compound 3 and since they elute right after each other during chromatography, their structures must be similar, with the loss of one or two tert-butyl groups. However, since the spectra, especially the aromatic region, look different in their multiplet structure, the compounds are not fully symmetrical, otherwise two doublets would again be observed in the spectrum of fraction number 1. Furthermore, looking at the region of the –NH peak in the spectrum, around 5.6 ppm, two peaks can be observed in the spectra of fraction 1 and 2. Also some peak doubling in the alkyl region is observed. This leads to the conclusion that at least two compounds with the same mass are present simultaneously in both spectra and are thus co-eluting during SFC.
Looking at the aromatic region in the NMR spectrum of fraction 1, the same two doublets with equal intensities can be recognised as in spectrum 3, only slightly shifted. One of the compounds in spectrum 1 is therefore probably the same as the symmetric compound 3, minus a tert-butyl group on each side, since it is 112 mass units lighter than compound 3. The second compound in spectrum 1 must be asymmetric. A typical resonance is the triplet on the right hand side of the aromatic region, at 6.89 ppm. This triplet occurs when both tert-butyl side groups are on the same ring and the other ring is unsubstituted. Using Advanced Chemistry Development, Inc. (ACD/Labs) spectral prediction software,13 we determined the most likely structure for the second compound in the first spectrum. Since theoretical predictions do not always match the experimental data perfectly, especially in the case of chemical shift predictions, this structure is not the definitive structure, only the most plausible one.
In the NMR spectrum of fraction 2, doubling of the –NH peak is observed as well, so two compounds must be present. These compounds are 56 mass units lighter than compound 3, so only one tert-butyl group less on one side of the molecule. This makes the molecule asymmetric, so the two doublets will not be observed in the aromatic region even if the two sidegroups are at the same trans-substituted positions on the aromatic ring. However, with spectral prediction software, the spectrum for compound 3 minus one tert-butyl group was simulated, and seemed to match a part of the spectrum. The other compound in spectrum 2 again shows the typical triplet on the right side of the aromatic region. Here, from spectral prediction, two different structures are plausible. The proposed structures for the compounds in fractions 1 and 2 are shown in Fig. 4. The spectral predictions for each proposed molecule are shown in the ESI.†
 | ||
| Fig. 4 Proposed molecular structures of the compounds in spectrum 1 with m/z 281 and in spectrum 2 with m/z 337. | ||
Although the sidegroups of these molecules are in different positions and the masses are slightly different, this does not influence their anti-oxidative function. In composing the additive packages, the purity of these compounds is often not very important. A mix of similar structures with the same function, in this case alkylated diphenylamines, is therefore not uncommon in lubricants. Our SFC-NMR method was successful in determining these structures from the pure transmission fluid and can also be used to determine other additives in lubricants, as long as their concentrations are high enough. In order to get a good NMR spectrum, the concentration of the compound of interest should be in the millimolar range, or even lower, depending on the amount of times the fraction can be selected (if the fraction is selected 10 times, the concentration for NMR analysis will be 10 times higher). How often the sample can be selected depends on sample availability and time constraints for the analysis. If enough sample is available, going to a semi-preparative scale SFC separation might be a good alternative. This will decrease the time needed for sample separation and selection, since less chromatographic runs are needed to select the same amount of sample.
4. Conclusion
In this work, we have shown that additives in complex transmission fluids can be separated within 10 minutes by using supercritical fluid chromatography. SFC-1H NMR/MS was then used as a novel analysis method to structurally identify the different additives in transmission fluids. In the transmission fluid that was studied, several alkylated diphenylamines were identified by first separating the mixture into fractions with SFC and directly analysing each fraction in-line with microfluidic NMR spectroscopy. These alkylated diphenylamines are one of the most important classes of antioxidants, which make sure that transmission fluids can be used over a longer period of time. SFC-NMR can therefore be used to study ageing of these fluids, by analysing used transmission fluids in the same way as was done for the fresh sample. By comparing the molecular structures of additives in samples before and after use, more understanding can be gained on the exact function of the additives during use. This will help in formulating better additives to prolong the lifetime of lubricants and with that to prevent the breakdown of engines. Being a rather generic analytical method SFC-1H NMR/MS can be used to unravel complex mixtures in different fields of research as well. The sensitivity of the NMR measurement can, however, be a bottleneck when a large number of molecules need to be identified. We think this can be mitigated in the near future by bringing hyperpolarization into the equation, allowing the analysis to be performed on a single fraction. Implementing nuclear hyperpolarization in a microfluidic context is currently a lively area of research.14,15Conflicts of interest
There are no conflicts to declare.Acknowledgements
This research received funding from the Netherlands Organisation for Scientific Research (NWO) in the framework of Technology Area COAST (053.21.115). The authors thank Leonard Kieckebusch (Shell Global Solutions (Germany) GmbH) for providing the sample, Bas van Meerten (Radboud University), Ruud Aspers (Radboud University), Wim Genuit (Shell Global Solutions (The Netherlands) GmbH), Peter Schoenmakers (University of Amsterdam), Ad Hagenaars (Waters) and Ulrich Braumann (Bruker, Germany) for discussions and support and Hans Janssen (Radboud University) for technical support.References
- E. George, S. Rajesh and F. David, Fuels and lubricants handbook: technology, properties, performance, and testing, 2003, pp. 1363–1403 Search PubMed.
- H. Henderson, M. Fefer and A. Legzdins, Prepr. – Am. Chem. Soc., Div. Pet. Chem., 1999, 44, 284–287 CAS.
- B. K. Sharma and A. J. Stipanovic, Thermochim. Acta, 2003, 402, 1–18 CrossRef CAS.
- J. C. O. Santos, I. M. G. dos Santos, A. G. Souza, E. V. Sobrinho, V. J. Fernandes Jr. and A. J. N. Silva, Fuel, 2004, 83, 2393–2399 CrossRef CAS.
- M. Ballari, F. Bonetto and E. Anoardo, J. Phys. D: Appl. Phys., 2005, 38, 3746 CrossRef CAS.
- E. Lesellier and C. West, J. Chromatogr., A, 2015, 1382, 2–46 CrossRef CAS PubMed.
- F. H. M. van Zelst, S. G. J. van Meerten, P. J. M. van Bentum and A. P. M. Kentgens, Anal. Chem., 2018, 90, 10457–10464 CrossRef CAS PubMed.
- F. H. M. van Zelst, S. G. J. van Meerten and A. P. M. Kentgens, Faraday Discuss., 2019, 218, 219–232 RSC.
- S. van Meerten, F. van Zelst, K. Tijssen and A. Kentgens, Anal. Chem., 2020, 92, 13010–13016 CrossRef CAS PubMed.
- S. van Meerten, W. Franssen and A. Kentgens, J. Magn. Reson., 2019, 301, 56–66 CrossRef CAS PubMed.
- M. Bernabei, R. Seclì and G. Bocchinfuso, J. Microcolumn Sep., 2000, 12, 585–592 CrossRef CAS.
- L. R. Rudnick, Lubricant additives: chemistry and applications, CRC press, 2009 Search PubMed.
- Advanced Chemistry Development Inc., Toronto, Canada, ACD/C + H Predictors and DB, version 2019.1.2, https://www.acdlabs.com Search PubMed.
- N. Abhankyar and V. Szalai, J. Phys. Chem. B, 2021, 125, 5171–5190 CrossRef PubMed.
- J. Eills, W. Hale and M. Utz, Prog. Nucl. Magn. Reson. Spectrosc., 2022, 128, 44–69 CrossRef CAS PubMed.
- D. W. Johnson, Applications of Mass Spectrometric Techniques to the Analysis of Fuels and Lubricants, in Mass Spectrometry, ed. M. Aliofkhazraei, IntechOpen, London, 2017, ch. 7, DOI:10.5772/intechopen.68592.
Footnote |
| † Electronic supplementary information (ESI) available. See DOI: https://doi.org/10.1039/d2an00323f |
| This journal is © The Royal Society of Chemistry 2022 |