
 Open Access Article
 This Open Access Article is licensed under a
 Creative Commons Attribution 3.0 Unported Licence
Miniaturised broth microdilution for simplified antibiotic susceptibility testing of Gram negative clinical isolates using microcapillary devices†
Sarah H.
Needs
 a,
Natnaree
Saiprom
b,
Zara
Rafaque
c,
Wajiha
Imtiaz
d,
Narisara
Chantratita
b,
Chakkaphan
Runcharoen
b,
Jeeranan
Thammachote
e,
Suthatip
Anun
e,
Sharon J.
Peacock
f,
Partha
Ray
gi,
Simon
Andrews
d and
Alexander D.
Edwards
*ah
a,
Natnaree
Saiprom
b,
Zara
Rafaque
c,
Wajiha
Imtiaz
d,
Narisara
Chantratita
b,
Chakkaphan
Runcharoen
b,
Jeeranan
Thammachote
e,
Suthatip
Anun
e,
Sharon J.
Peacock
f,
Partha
Ray
gi,
Simon
Andrews
d and
Alexander D.
Edwards
*ah
aSchool of Pharmacy, University of Reading, RG6 6DX, UK. E-mail: a.d.edwards@reading.ac.uk
bDepartment of Microbiology and Immunology, Faculty of Tropical Medicine, Mahidol University, Thailand
cDepartment of Microbiology, Faculty of Health Sciences, Hazara University, Mansehra, Pakistan
dSchool of Biological Sciences, University of Reading, RG6 6DX, UK
eDivision of Clinical Microbiology, Medical Technology Department, Bhuddhasothon Hospital, Chachoengsao, Thailand
fDepartment of Medicine, University of Cambridge, UK
gThe Nature Conservancy, Virginia, USA
hCFT Ltd, Daux Road, Billingshurst, RH14 9SJ, UK
iSchool of Agriculture Policy and Development, University of Reading, UK
First published on 8th July 2022
Abstract
Antibiotic resistance is a major global challenge. Although microfluidic antibiotic susceptibility tests (AST) offer great potential for rapid and portable testing to inform correct antibiotic selection, the impact of miniaturisation on broth microdilution (BMD) is not fully understood. We developed a 10-plex microcapillary based broth microdilution using resazurin as a colorimetric indicator for bacterial growth. Each capillary had a 1 microlitre capillary volume, 100 times smaller than microplate broth microdilution. The microcapillary BMD was compared to an in-house standard microplate AST and commercial Vitek 2 system. When tested with 25 uropathogenic isolates (20 Escherichia coli and 5 Klebsiella pneumoniae) and 2 reference E. coli, these devices gave 96.1% (441/459 isolate/antibiotic combinations) categorical agreement, across 17 therapeutically beneficial antibiotics, compared to in-house microplate BMD with resazurin. A further 99 (50 E. coli and 49 K. pneumoniae) clinical isolates were tested against 10 antibiotics and showed 92.3% categorical agreement (914/990 isolate/antibiotic combinations) compared to the Vitek 2 measurements. These microcapillary tests showed excellent analytical agreement with existing AST methods. Furthermore, the small size and simple colour change can be recorded using a smartphone camera or it is feasible to follow growth kinetics using very simple, low-cost readers. The test strips used here are produced in large batches, allowing hundreds of multiplex tests to be made and tested rapidly. Demonstrating performance of miniaturised broth microdilution with clinical isolates paves the way for wider use of microfluidic AST.
1 Introduction
Improved diagnostic technology such as microfluidics is widely acknowledged to be essential to combat antimicrobial resistance (AMR).1 Standard culture based antibiotic susceptibility tests take around 2–3 days until result, meaning current primary care and hospital treatment protocols must rely on empirical antibiotic administration at first presentation.2,3 Resistance to some antibiotics for the treatment of common infections, such as urinary tract infections, can be as high as >80% outside organisation for economic co-operation and development (OECD) countries4 which limits the use of many common antibiotics, and reduces effectiveness of empirical prescribing. During pregnancy, the need for safe and effective drugs is increased, while nitrofurantoin remains first choice, amoxicillin is only recommended if the susceptibility is known due to resistance rates above 50% in some demographics.5For antibiotics with resistance rates >20% empiric treatment is unsuitable.3 This leads to consequences for the patient (infection may not be controlled if pathogen is resistant), the clinician (limited treatment choices) and the public (emergence and spread of AMR and subsequent drug-resistant infections).
Several emerging strain-characterisation technologies to determine AST have been developed to the point of large scale uptake into central microbiology laboratories.6 Many labs are now using mass spectroscopy for identification of clinically important microbes by peptide mass fingerprinting to replace traditional analytical microbiology techniques.7,8 Nucleic acid tests (NAT) such as PCR can detect specific AMR genes, allowing rapid identification of known resistance markers, but do not always reliably predict phenotypic antibiotic susceptibility and can only detect target sequences – as these targets change, tests will need regular updating informed by phenotypic–genotypic surveillance programs.9
Phenotypic AST, including the current gold standard methods10–12 of broth microdilution (BMD) performed in a microtitre plate (MTP) and disc diffusion assays performed on agar plates, demonstrate antibiotic suitability by direct phenotypic identification of which antibiotics achieve bactericidal or bacteriostatic effects (i.e. susceptible), vs. which isolates grow in the presence of antibiotic (i.e. resistant).
Microfluidic technologies offer several advantages, especially in point-of-care applications, including portability and rapid result times. Recently many examples of microfluidic analytical microbiology devices illustrate the potential for AST miniaturisation.13–18 A “millifluidic” system made from simple fluorinated ethylene–propylene (FEP) tubing illustrated that analysis of AST can be miniaturised using microdroplets allowing parallel analysis of large populations of individual cells.19 Whilst this microdroplet system offers improved resolution in quantitative AST20 pure cultures from overnight plating and complex instrumentation are still required. Multi-chamber devices can distribute bacterial samples into chambers loaded with antibiotics,15,16,21–23 or cells can be observed in microfluidic systems that generate antibiotic gradients.24,25 Microfluidic culture can be combined with digital microscopy and image analysis to allow direct observation of the effects of antibiotics on cell behaviour or growth.22,26–28
With the introduction of microtitre plates, broth dilution was adapted from macro – micro, with volumes scaled down from 10 mL to 0.1 mL, 100× smaller volume, it was found MIC for broth microdilution method were often higher.29 The impact of miniaturisation on classical antibiotic susceptibility testing (AST) methods must therefore be fully understood and extensive equivalency testing is required before microfluidics can be widely adopted. Incubation time and inoculum size are critical parameters in AST and deviation from standardised methods can lead to errors in categorical agreement compared to the gold standard.30–32 It is therefore important to understand how both of these may affect any new AST devices or methods, however there are limited data in the literature exploring how these parameters affect microfluidic analytical microbiology.
Shorter incubation times of 6–8 h have been explored for disc diffusion assays.33–36 While categorical agreement differed depending on antibiotic/bacteria tested, overall agreement was generally >80% and it was concluded this approach was useful as a preliminary result to base urgent clinical decisions on.34 Disc diffusion assays of 11![[thin space (1/6-em)]](https://www.rsc.org/images/entities/char_2009.gif) 123 Enterobacterales/antibiotic combinations incubated for 6 h found sharper, more defined areas of inhibition with categorical agreement of 89.8% and major errors and very major errors below 4%; after 8 h the categorical agreement rose to 98.5%. The most common errors came from strains categorised as intermediate;36 for such strains where the inhibitory concentration for antimicrobial is close to the breakpoint for scoring resistance vs. susceptibility, there is always greater uncertainty in AST, even with gold standard methods.
123 Enterobacterales/antibiotic combinations incubated for 6 h found sharper, more defined areas of inhibition with categorical agreement of 89.8% and major errors and very major errors below 4%; after 8 h the categorical agreement rose to 98.5%. The most common errors came from strains categorised as intermediate;36 for such strains where the inhibitory concentration for antimicrobial is close to the breakpoint for scoring resistance vs. susceptibility, there is always greater uncertainty in AST, even with gold standard methods.
The inoculum cell density is likewise an important factor when measuring MIC, and an increased starting inoculum can increase the observed MIC for a number of reasons. This well-known phenomenon is termed the inoculum effect (IE), and varying the starting bacterial cell density can influence inhibition of growth by many antimicrobials; hence guidelines for broth microdilution define acceptable ranges for inoculum density. Estimating and adjusting cell density therefore remains an essential but laborious step for many functional microbiology methods.
For commercial uptake of novel AST devices these must demonstrate accuracy, affordability and the ability to integrate into current workflows.31 In this study, miniaturised broth microdilution was performed in parallel in microfluidic devices and microplates, reducing the sample volume from 100 μL to 1 μL using Gram-negative clinical isolates. We evaluate here for the first time a miniaturised system for analytical microbiology that uses a fluoropolymer microcapillary film (MCF) that contains a parallel array of ten microcapillaries. The MCF is manufactured in long reels by melt-extrusion and cut to size to make large batches of the multiplex test strips,37–40 allowing us to make and test hundreds of very low-cost test devices. These devices incorporate a hydrophilic polymer coating to modify the internal walls of the capillaries allowing sample uptake by capillary action. Using readily available equipment, samples can be loaded easily by dipping the test strips into the well of a 96-well plate with the sample drawn up into the 10 capillaries by capillary action allowing a single well to be expanded into a 10-plex AST and output the same result format as conventional AST. Here we present the first full demonstration of MIC measurement and antibiotic susceptibility testing for a range of antibiotics in clinically relevant isolates. We explore in detail the impact of inoculum cell density on microfluidic broth microdilution and assess the kinetics of antibiotic susceptibility testing in a convenient miniaturised format, to understand the accuracy of miniaturised AST and how to use microfluidics to speed up analytical microbiology.
2 Material and methods
2.1 Bacterial isolates
Reference strain E. coli 25922 was purchased from ATCC and was used as a quality control. E. coli 13352 was purchased from NCTC.The 20 uropathogenic E. coli (UPEC) and 5 K. pneumoniae strains tested at the University of Reading, UK, were collected at a tertiary care hospital of Pakistan from community acquired UTI patients41,42 under a study that was approved by the Ethical Review Board (ERB) of the Pakistan Institute of Medical Sciences. UPEC were identified using standard microbiological and biochemical tests as described before.43
The bacterial collection tested in Bangkok, Thailand, consisted of 50 ESBL-positive E. coli and 49 K. pneumoniae isolated between 2014 and 2015. Clinical isolates were from positive samples processed by the diagnostic microbiology laboratory at Bhuddhasothorn hospital, Chachoengsao province, eastern Thailand between December 2014 and April 2015. Only one isolate per patient was included and the source of the isolate is shown in S1 Dataset.† Bacterial isolates were initially identified and susceptibility testing performed using Standard Operating Procedures supplied by the Department of Medical Science, Ministry of Public Heath, Thailand and Clinical and Laboratory Standards Institute (CLSI) guidelines (M100-S24 and M100-S25), respectively. Species was subsequently confirmed using matrix-assisted laser desorption/ionization time-of-flight mass spectrometry (MALDI-TOF MS; Biotyper version 3.1, Bruker Daltonics, Coventry, UK). Antimicrobial susceptibility testing was repeated using the N206 card on the Vitek 2 instrument (bioMérieux, Marcy l’Étoile, France) calibrated against EUCAST breakpoints as described in.44
2.2 Preparation of antibiotic loaded microcapillary test strips
MCF of 1 to 5 m lengths were given an internal hydrophilic coating by incubation with a 5 mg mL−1 solution of polyvinyl alcohol (PVOH) in water (MW 146000–186000, >99% hydrolysed, Sigma-Aldrich, UK) at room temperature for 2 h.45,46 Coated strips were washed with 5 ml of PBS with 0.5% Tween 20 (Sigma-Aldrich, UK) to remove residual PVOH, and dried on a vacuum manifold for 20 minutes per metre using a SLS Lab Basics Mini Vacuum Pump with PTFE Coated Diaphragm (Scientific Laboratory Supplies, UK).
Ciprofloxacin, cefoxitin, trimethoprim, meropenem, ertapenem, ceftazidime, clavulanic acid, ofloxacin, sulfamethoxazole, gentamicin, amikacin, fosfomycin and amoxicillin were purchased from Sigma Aldrich. Nitrofurantoin and Cephalexin were from purchased from Fischer Scientific. For Amoxicillin-clavulanic acid testing, clavulanic acid was fixed at 2 mg L−1. For co-trimoxazole, a ratio of 1:19 trimethoprim:sulfamethoxazole and MIC displayed as the trimethoprim concentration. For fosfomycin, glucose-6-phosphate was added to the antibiotic solution at 25 mg L−1. Serial dilutions of antibiotics diluted in sterilised milliQ water were injected using a 30-gauge needle into individual capillaries in up to 1.5 m long strips of MCF. The MCF strip was cut to 17 mm individual test strips and frozen overnight at −80 °C. Test strips were freeze-dried for >4 h on an Edwards Modulyo freeze drier. Test strips were vacuum packed and stored at −20 °C until use.
2.3 Microplate broth microdilution
Isolates were cultured on LB agar and 3–5 individual colonies were inoculated into Cation adjusted Mueller-Hinton broth (MHB) and grown for 4–6 h until visibly turbid. The suspension was diluted to 0.5 McFarland equivalent corresponding to approximately 1–2 × 10⁸ CFU per mL. The culture was diluted 1:150 in MHB to give 106 CFU per mL suspension and finally 50 μL was added to 50 μL of antibiotic solutions in a microplate to give a 1:2 dilution to give a final suspension of bacteria around 5 × 10⁵ CFU per mL in two-fold dilutions of antibiotic. For BMD including resazurin, dye was added to a final concentration of 0.25 mg mL−1. Plates were incubated at 37 °C overnight. MIC measurements were measured in duplicate (Fig. S1†). The MIC was recorded as the lowest concentration of antibiotic that did not show resazurin conversion or turbidity. For tests that varied within duplicate measurements, the highest MIC was recorded. A growth control (no antibiotic) and a sterile control (MHB only) was included for all isolates.
2.4 Microcapillary broth microdilution
Individual 17 mm test strips were clipped into 3D printed holders, able to hold up to 12 test strips. For MIC tests in MCF strips, bacterial inocula were prepared either by direct colony suspension or by growth method. Samples compared to the Vitek2 system were prepared by direct colony suspension. Isolates were cultured overnight on Columbia media and colonies suspended directly in saline and visually adjusted to 0.5 McFarland standard. Samples were diluted 1:150 in MHB and 100 μL was added to 100 μL of 0.5 mg mL−1 resazurin in a microplate. For isolates compared to the in-house microplate method, bacteria inoculum was prepared as before for standard growth preparation at a final concentration of 5 × 10⁵ CFU per mL and mixed in a 96 well plate with a final concentration of 0.25 mg mL−1 resazurin in a total volume of 200 μL. The test strips were dipped into each well. Once all capillaries were filled (approximately 3 seconds) end covers filled with silicone grease were placed on each end to stop sample evaporation (Fig. 1a). Samples were incubated overnight (20 ± 4 h) at 37 °C and color change monitored using an in-house automated raspberry pi camera imaging system.47 MIC measurements were taken in duplicate with two wells used for each measurement (Fig. S1†). The MIC was recorded as the lowest concentration of antibiotic that did not show resazurin conversion or turbidity. For tests that varied in duplicate measurements, the highest MIC was recorded. A growth control (no antibiotic) capillary was included for all test strips. A number of tests were used for inoculum check by culturing dilutions overnight on non-specific media including LB agar and Columbia agar.
 | ||
| Fig. 1 (a) Schematic of the microcapillary BMD workflow. Bacteria is diluted and mixed with resazurin and seeded in a 96 well plate. A holder containing 12 individual test strips is dipped into the samples. (b) Resazurin based colour scoring, growth is scored based on a colour change from blue to pink. The MIC is measured based on the lowest concentration in which growth is inhibited (c) Comparison between standard BMD and microcapillary BMD. The Figure was partly generated using Servier Medical Art, provided by Servier, licensed under a Creative Commons Attribution 3.0 unported license. | ||
For microcapillary BMD experiments using a higher inoculum density, CFU per mL was calculated using a spot plating protocol. Briefly, 10 μL of serially diluted culture were taken from the microtitre wells and plated on both LB agar and the Gram-negative selective media, MacConkey agar to determine cell count and ensure no contamination with other organisms. Plates were incubated overnight at 37 °C.
2.5 Data recording and analysis
Two recordings of the test strips were made. A single endpoint was recorded by colorimetric measurement after overnight incubation at 37 °C using a smartphone camera (iPhone 6s) or digital camera (Canon Powershot S120). A wide range of different quality digital cameras have been shown to be equally effective for recording microcapillary bioassay results.48,49The strips were placed on an even white light illumination screen. Isolates were scored susceptible or resistant based on EUCAST v11.0 breakpoint values in Table S1.†For time-lapse imaging, resazurin conversion was recorded every 15 minutes using the POLIR robot,47 with 3280 × 2464 resolution images taken with a Raspberry Pi v2 camera. MatLab scripts were used to analyse time-lapse image series of bacterial growth in MCF, and the code can be accessed here: https://gitlab.com/sneeds/code-repository. Briefly, color images were split into red, blue and green (RGB) channels and the red channel analysed for absorbance as described elsewhere.47,50 Time to resazurin conversion was calculated at which half the starting absorbance in the red channel was reached.
3 Results and discussion
3.1 Broth microdilution in microcapillary test strips accurately determines MIC for uropathogenic E. coli
The microcapillary BMD method conducts AST in dip-and-test microcapillary film (MCF) strips, with each test strip containing 10 different conditions (9 antibiotic concentrations plus no antibiotic control) in 1 μL samples, reducing the test volume by 100-fold from microplates (Fig. 1). To understand if miniaturisation affects BMD performance, we validated this microcapillary BMD AST, by comparing to a standard microplate BMD with resazurin. Growth was scored based on the colour change of resazurin from blue to pink. Although full growth kinetics were recorded, we initially focussed on an overnight endpoint readout. Microplate BMD and microcapillary BMD were performed in parallel, testing a panel of 17 antibiotics against an E. coli quality control (QC) strain, an E. coli reference strain, 20 UPEC isolates and 5 K. pneumoniae isolates.Isolates were cultured using the growth method and diluted to a standard inoculum cell density of 5 × 10⁵ CFU per mL in MHB, as per EUCAST guidelines, with a final resazurin concentration of 0.25 mg mL−1 in both microplates and MCF test strips. Overnight colorimetric endpoint images were taken to score growth/no growth and determine MIC (Fig. 2 and S1 Dataset†).
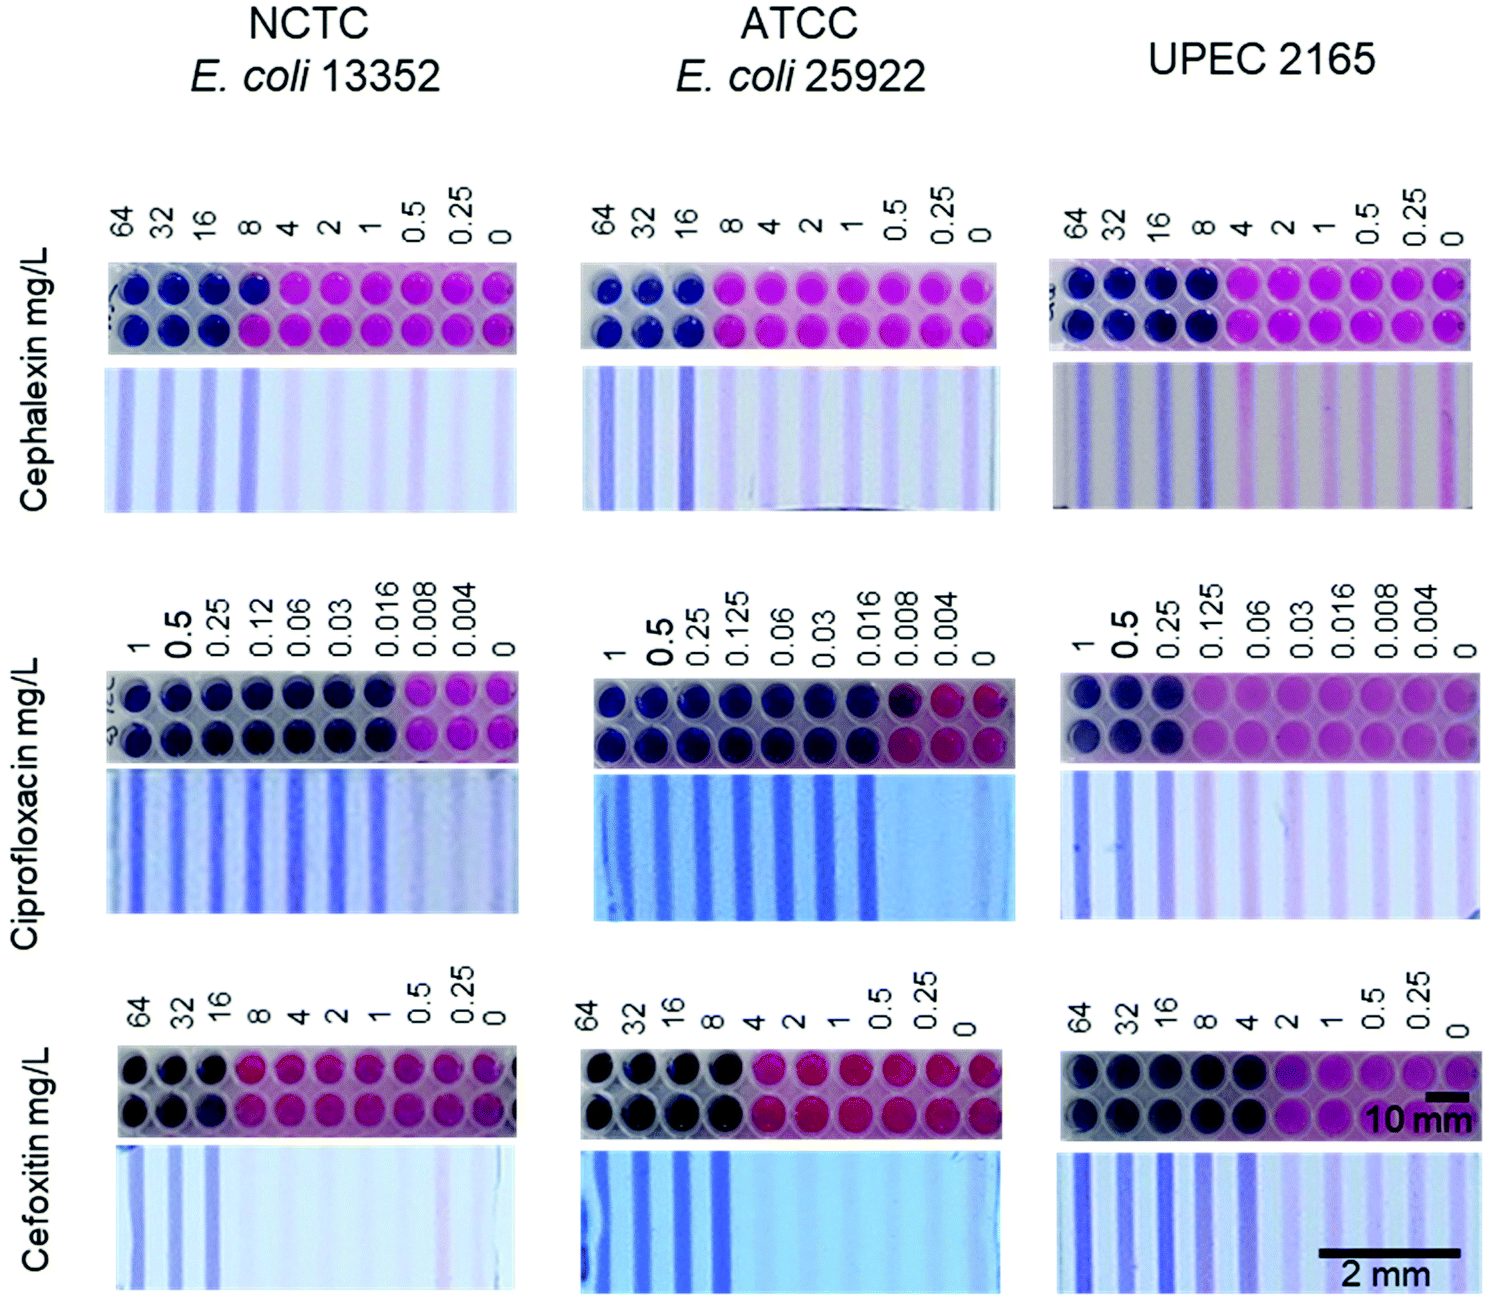 | ||
| Fig. 2 Agreement between microwell broth microdilution and microcapillary film MIC. Representative images showing MIC determination of two reference strains, E. coli 25922 and E. coli 13352 and urinary pathogen E. coli isolate 2165. MIC in 96 well plate and microcapillary film test. | ||
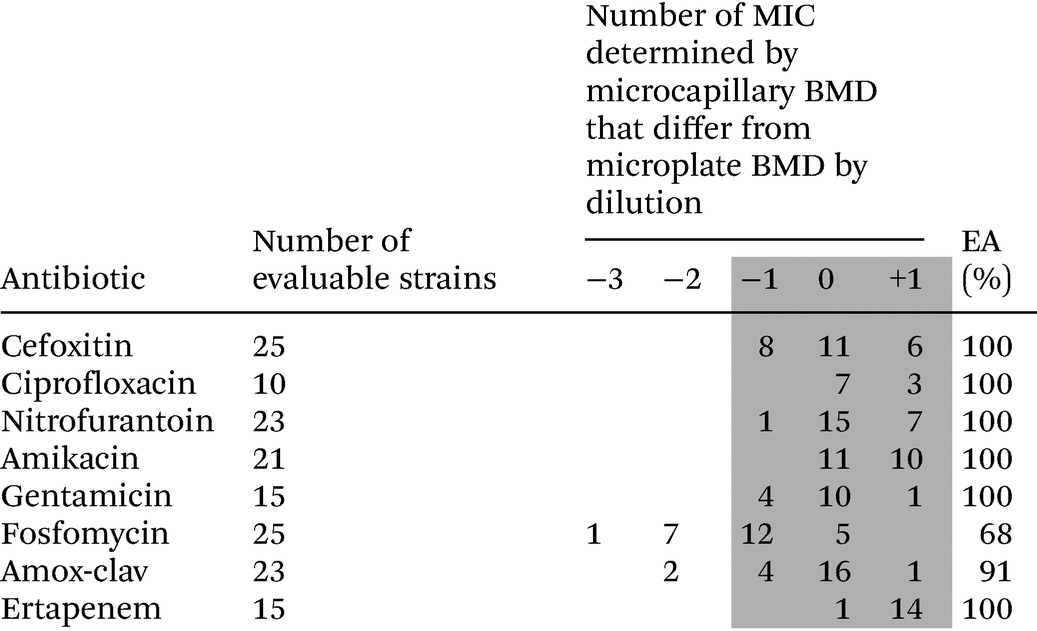
All MIC measured by microplate BMD and microcapillary BMD were within the acceptable MIC range according to EUCAST QC Table v 11.0 for the QC strain, E. coli 25922. Essential agreement (EA) defined by variation of only ±1log2 dilution of antibiotic compared to the reference and were scored for isolates with an MIC within the tested range (Table 1). Cefoxitin, ciprofloxacin, nitrofurantoin, amikacin, gentamicin, and ertapenem showed 100% essential agreement (grey shaded area). Whereas, fosfomycin and amoxicillin-clavulanic acid showed greater variation, this may be due to uneven distribution and dissolution of two components into the capillaries, fosfomycin is measured with glucose-6-phosphate and amoxicillin is measured with clavulanic acid.
|
Categorical agreement was achieved when isolates were scored as susceptible or resistant at the EUCAST breakpoint values shown in Table S1† by both methods. There was a 96% (441/459 isolate/antibiotic combinations) categorical agreement across all antibiotics tested and 100% categorical agreement for all isolates tested against trimethoprim, cephalexin, amoxicillin, fosfomycin, amoxicillin-clavulanic acid, ofloxacin, cefotaxime and ceftazidime (Table 2). Minor errors were classified if one method scored intermediate while the other test scored resistant or susceptible. Major errors were categorised based on false resistance in which the isolate was tested susceptible based on the gold standard microplate BMD but resistant using microcapillary BMD. Very major errors were categorised based on false susceptibility in which the isolate was tested resistant based on microplate BMD but susceptible using microcapillary BMD. False susceptibility is a very major error as it can relate to patient harm, i.e. treating a patient with an ineffective antibiotic. The microcapillary BMD had 2% (9/459) major errors (false resistance) compared to microplate BMD and 2% (9/459) very major errors (false susceptibility) compared to microplate BMD.
| Antibiotic | Prevalence of resistance (%) | Categorical agreement (%) | Minor error (%) | Major error (%) | Very major error (%) |
|---|---|---|---|---|---|
| Minor errors indicate either test returning an intermediate result and the other test returning S/R category. Major errors indicate microplate BMD, S; microcapillary BMD, R. Very major errors indicate microplate BMD, R; microcapillary BMD, S. | |||||
| Trimethoprim | 85% (23/27) | 100% (27/27) | 0 | 0 | 0 |
| Cephalexin | 86% (19/27) | 100% (27/27) | 0 | 0 | 0 |
| Amoxicillin | 95% (26/27) | 100% (27/27) | 0 | 0 | 0 |
| Nitrofurantoin | 4% (1/27) | 96% (26/27) | 0 | 0 | 4% (1/27) |
| Ciprofloxacin | 81% (22/27) | 96% (26/27) | 0 | 4% (1/27) | 0 |
| Amikacin | 30% (8/27) | 89% (24/27) | 0 | 11% (3/27) | 0 |
| Cefoxitin | 66% (18/27) | 85% (23/27) | 0 | 4% (1/27) | 11% (3/27) |
| Gentamicin | 74% (20/27) | 78% (24/27) | 0 | 0 | 11% (3/27) |
| Fosfomycin | 4% (1/27) | 100% (27/27) | 0 | 0 | 0 |
| Cefuroxime | 89% (24/27) | 96% (26/27) | 0 | 0 | 4% (1/27) |
| Amox-clav | 78% (21/27) | 100% (27/27) | 0 | 0 | 0 |
| Ofloxacin | 89% (24/27) | 100% (27/27) | 0 | 0 | 0 |
| Cefotaxime | 88% (21/27) | 100% (27/27) | 0 | 0 | 0 |
| Ceftazidime | 88% (21/27) | 100% (27/27) | 0 | 0 | 0 |
| Co-trimoxazole | 84% (21/27) | 96% (26/27) | 4% (1/27) | 0 | 0 |
| Meropenem | 7% (2/27) | 96% (26/27) | 4% (1/27) | 0 | 0 |
| Ertapenem | 11% (3/27) | 89% (24/27) | 0 | 11% (3/27) | 0 |
However, all major errors and very major errors that occurred, the MIC determined by microcapillary BMD was within ±1log2 fold change of the breakpoint and the MIC determined by microplate BMD (Dataset S1†), indicating the breakpoint value is close to the threshold for inhibition. In this situation the variability in resistance/susceptibility scoring is known to increase significantly, leading to higher uncertainty in AST results even with gold standard methods.51 For example, amikacin, cefoxitin and gentamicin with the lowest categorical agreement, 89, 85 and 78% respectively, but maintain 100% essential agreement (EA) defined by variation of only ±1log2 dilution of antibiotic compared to the reference (Table 1).
Overall, we conclude that microcapillary BMD performs well and that the miniaturisation of broth microdilution from microplate wells (100 μL) down to microcapillaries (1 μL) with the addition of resazurin has little if any impact on MIC determination and scoring for antibiotic resistance.
3.2 Time-resolved growth analysis in microcapillary test strips allows earlier endpoint MIC giving accurate antibiotic susceptibility within 6 h
Previously we established that even at low cell densities, E. coli growth can be detected within 7 h and at the inoculum recommended for AST within approximately 3–5 h48 (Fig. S2†). MIC were measured and susceptibility/resistance scored for microcapillary BMD after 6 h incubation, and results compared to overnight microplate BMD results (Table S3†).Overall categorical agreement remained high at 90% (412/459 isolate/antibiotic combinations). For antibiotics in which the MIC was near the breakpoint, very major errors increased to 9% (41/459) of cases. However, all of the errors identified had an MIC within ±1log2 dilution of the reference overnight microplate BMD measurement.
Kinetics of growth was clearly influenced more by some but not other antibiotics, depending on susceptibility/resistant status and antibiotic mode of action. Many antibiotics tested, including cefoxitin and ciprofloxacin (Fig. 3a–c) showed very similar MIC results at 6 and 16 h varying by only one doubling dilution of antibiotic (Dataset S1†). Isolates categorised as resistant for the majority of cases showed indistinguishable growth kinetics in the presence of antibiotics (Fig. 3d and Fig. S3†). This is less clear for nitrofurantoin, in which all isolates were categorised as susceptible by microcapillary BMD and showed a distinct delay in growth kinetics in the presence of antibiotic below the MIC (Fig. 3e and Fig. S4†). Shorter incubation times may be less suitable for high resolution quantitation of MIC, and may be more accurate for some antibiotics than others, however overall accuracy of microcapillary BMD for scoring resistance vs. susceptibility remained high even with a 6 h endpoint readout.
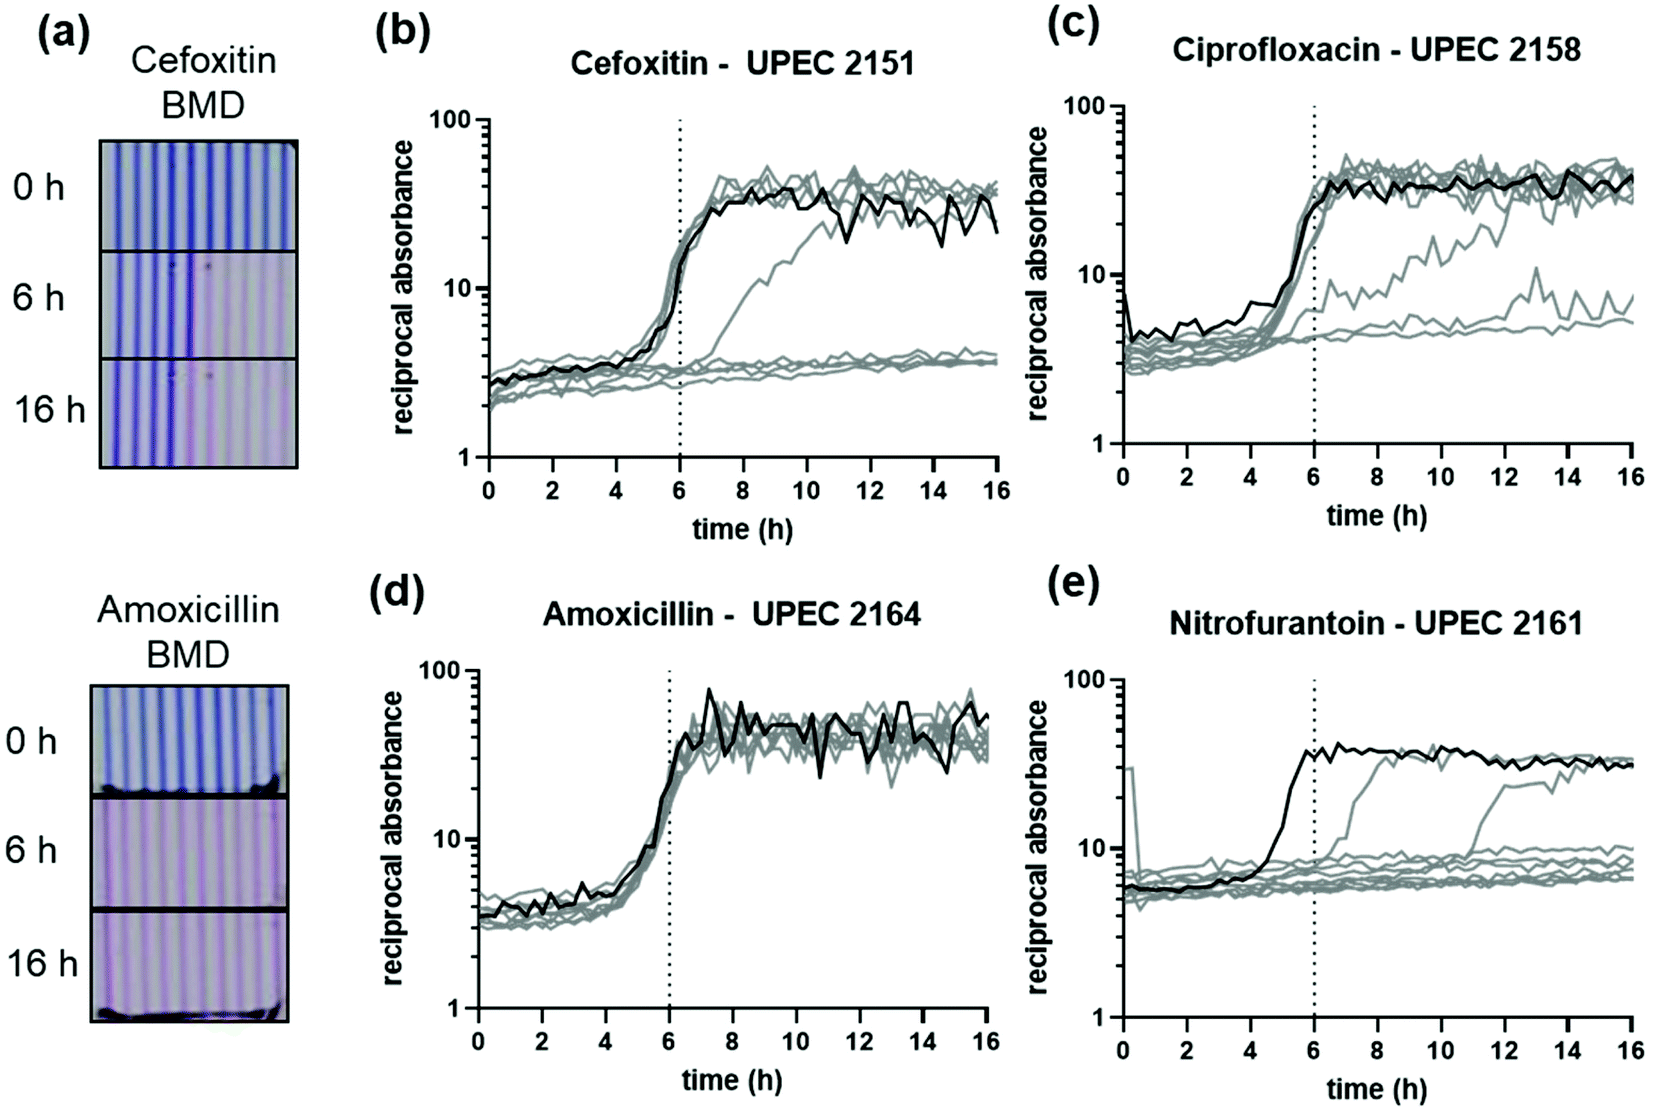 | ||
| Fig. 3 Microcapillary BMD with a fixed inoculum density growth kinetics in the presence of antibiotics. (a) Representative images of MIC at 0, 6 and 16 h. Cefoxitin and Amoxicillin BMD starts at 64 mg L−1 followed by serial two-fold dilutions. (b) and (c) UPEC 2151 for cefoxitin and UPEC 2158 ciprofloxacin recorded MIC is within ±1 doubling dilution of antibiotic. (d) Growth of amoxicillin resistant UPEC 2164 is identical at all antibiotic concentrations of amoxicillin. (e) Nitrofurantoin shows the greatest amount of delayed growth. UPEC 2161 only observes a positive growth control at 6 h, indicated an MIC ≤2 mg L−1 compared to an endpoint MIC of 8 mg L−1. Growth curves indicate reciprocal absorbance for resazurin measured every 15 minutes. Black line indicates growth control in capillaries with no antibiotic present. | ||
In six cases (1% of cases), all for E. coli 13352, AST was not determinable due to no growth detected at 6 h in the no antibiotic control (Dataset S1†) and were classified as no agreement (Table S3†) although AST was valid after overnight incubation. Since this error only occurred for a single bacteria and experiments were performed on different days, it is likely this is due to individual differences of the specific isolate and that some species and isolates will need monitoring longer (Fig. S2†).
3.3 Microcapillary BMD gives accurate results compared to commercial Vitek 2 automated BMD
The microcapillary tests were further evaluated against a commercial automated AST system, the Vitek 2. The microcapillary tests were adapted for qualitative AST, measuring just 1–4 dilutions of antibiotic around the breakpoint to categorise isolates as susceptible or resistant (S/R). This allowed a single microcapillary test strip to determine S/R for multiple antibiotics. The Vitek 2 AST measures susceptibility based on turbidimetry which is monitored over regular time intervals. A total of 99 Gram-negative isolates (50 E. coli and 49 K. pnuemoniae) from patient samples with resistance profiles from the Vitek 2 were screened using the microcapillary BMD and endpoint measurements taken after 6 h and overnight incubation (Table 3). The microcapillary BMD method still showed high level of categorical agreement compared to the Vitek 2 system with 92.3% (914/990 isolate/antibiotic combinations) and 90.4% (895/990 isolate/antibiotic combinations) categorical agreement at 6 and 20 h incubation respectively. Earlier time points increased the number of very major errors, false susceptibility, for nearly every antibiotic tested.| Organism/incubation time | Antibiotic | Prevalence of resistancea (%) | Categorical agreement (%) | Minor error (%) | Major error (%) | Very major error (%) |
|---|---|---|---|---|---|---|
| a Determined by Vitek 2. Minor errors indicate either test returning an intermediate result and the other test returning S/R category. Major errors indicate microplate BMD, S; microcapillary BMD, R. Very major errors indicate microplate BMD, R; microcapillary BMD, S. | ||||||
| 50 E. coli and 49 K. pneumoniae/20 ± 4 h | Cefotaxime | 95% (94/99) | 97% (96/99) | 1% (1/99) | 2% (2/99) | 0 |
| Ceftazidime | 74% (73/99) | 93% (92/99) | 5% (5/99) | 2% (2/99) | 0 | |
| Meropenem | 5% (5/99) | 88% (87/99) | 9% (9/99) | 1% (1/99) | 2% (2/99) | |
| Amikacin | 7% (7/99) | 94% (93/99) | 2% (2/99) | 3% (3/99) | 1% (1/99) | |
| Amox-clav | 66% (65/99) | 88% (87/99) | 0 | 9% (9/99) | 3% (3/99) | |
| Cefuroxime | 96% (95/99) | 99% (98/99) | 0 | 1% (1/99) | 0 | |
| Cefoxitin | 14% (14/99) | 87% (86/99) | 12% (12/99) | 1% (1/99) | 0 | |
| Ciprofloxacin | 68% (67/99) | 93% (92/99) | 5% (5/99) | 2% (2/99) | 0 | |
| Gentamicin | 64% (63/99) | 91% (90/99) | 6% (6/99) | 0 | 3% (3/99) | |
| Trimethoprim | 75% (74/99) | 94% (93/99) | 1% (1/99) | 4% (4/99) | 1% (1/99) | |
| TOTAL (20 h) | 92.3% (914/990) | 4.1% (41/990) | 2.8% (28/990) | 0.7% (7/990) | ||
| 50 E. coli and 49 K. pneumoniae/6 h | Cefotaxime | 95% (94/99) | 96% (95/99) | 2% (2/99) | 2% (2/99) | 0 |
| Ceftazidime | 74% (73/99) | 92% (91/99) | 5% (5/99) | 2% (2/99) | 1% (1/99) | |
| Meropenem | 5% (5/99) | 93% (92/99) | 3% (3/99) | 0 | 4% (4/99) | |
| Amikacin | 7% (7/99) | 94% (93/99) | 2% (2/99) | 0 | 4% (4/99) | |
| Amox-clav | 66% (65/99) | 79% (78/99) | 0 | 2% (2/99) | 19% (19/99) | |
| Cefuroxime | 96% (95/99) | 97% (96/99) | 0 | 1% (1/99) | 2% (2/99) | |
| Cefoxitin | 14% (14/99) | 80% (79/99) | 19% (19/99) | 0 | 1% (1/99) | |
| Ciprofloxacin | 68% (67/99) | 84% (83/99) | 11% (11/99) | 0 | 5% (5/99) | |
| Gentamicin | 64% (63/99) | 93% (92/99) | 3% (3/99) | 0 | 4% (4/99) | |
| Trimethoprim | 75% (74/99) | 97% (96/99) | 0 | 1% (1/99) | 2% (2/99) | |
| TOTAL (6 h) | 90.4% (895/990) | 4.5% (45/990) | 0.8% (8/990) | 3.8% (38/990) | ||
Previously, microcapillary BMD was compared with matched microplate BMD, so inoculum, media and antibiotic stocks were the same, and thereby we expected much higher agreement under these conditions than compared to a commercial system.
3.4 Effect of inoculum density on microfluidic MIC determination
Broth microdilution is known to be significantly affected by the initial inoculum density, and in the development of new methodologies it is vital to identify how sensitive results are to variables such as inoculum cell density. Studies of inoculum density is vital for new testing strategies including direct testing from clinical and environmental sources where the exact number of bacteria may be unknown.35Here, we focussed on understanding how starting cell density affects microcapillary BMD performance, and if IE reduces accuracy for both MIC quantitation and AST scoring, as it does for conventional microplate methods. Microcapillary BMD test strips were dipped into serial 10-fold dilutions of each bacterial isolate, starting with 107 CFU per mL (Fig. 4). Inoculum densities 100× above the EUCAST recommended resulted in growth at antibiotic concentrations significantly above the MIC, giving false resistance scores for E. coli 25922 and UPEC 2165 for ciprofloxacin and cefalexin and in UPEC 2165 for nitrofurantoin (Fig. 4b). Inoculum densities below the EUCAST recommended density gave MIC measurements within the ±1log2 fold acceptable range. The ability to detect growth of very low viable cell numbers – ideally down to a single colony forming unit – may be critical for some analytical and clinical applications. We previously identified the limit of detection of a 1 μL microcapillary test strip to be in the order of 5 × 10³ CFU per mL; at this concentration 99% of capillaries are predicted to contain at least 1 bacteria every test, allowing MIC measurement.48 The initial inoculum density correlates to the speed of detecting resazurin conversion, as early growth at low density does not convert enough dye to influence the capillary color, thus lower densities take longer before growth can be detected.48
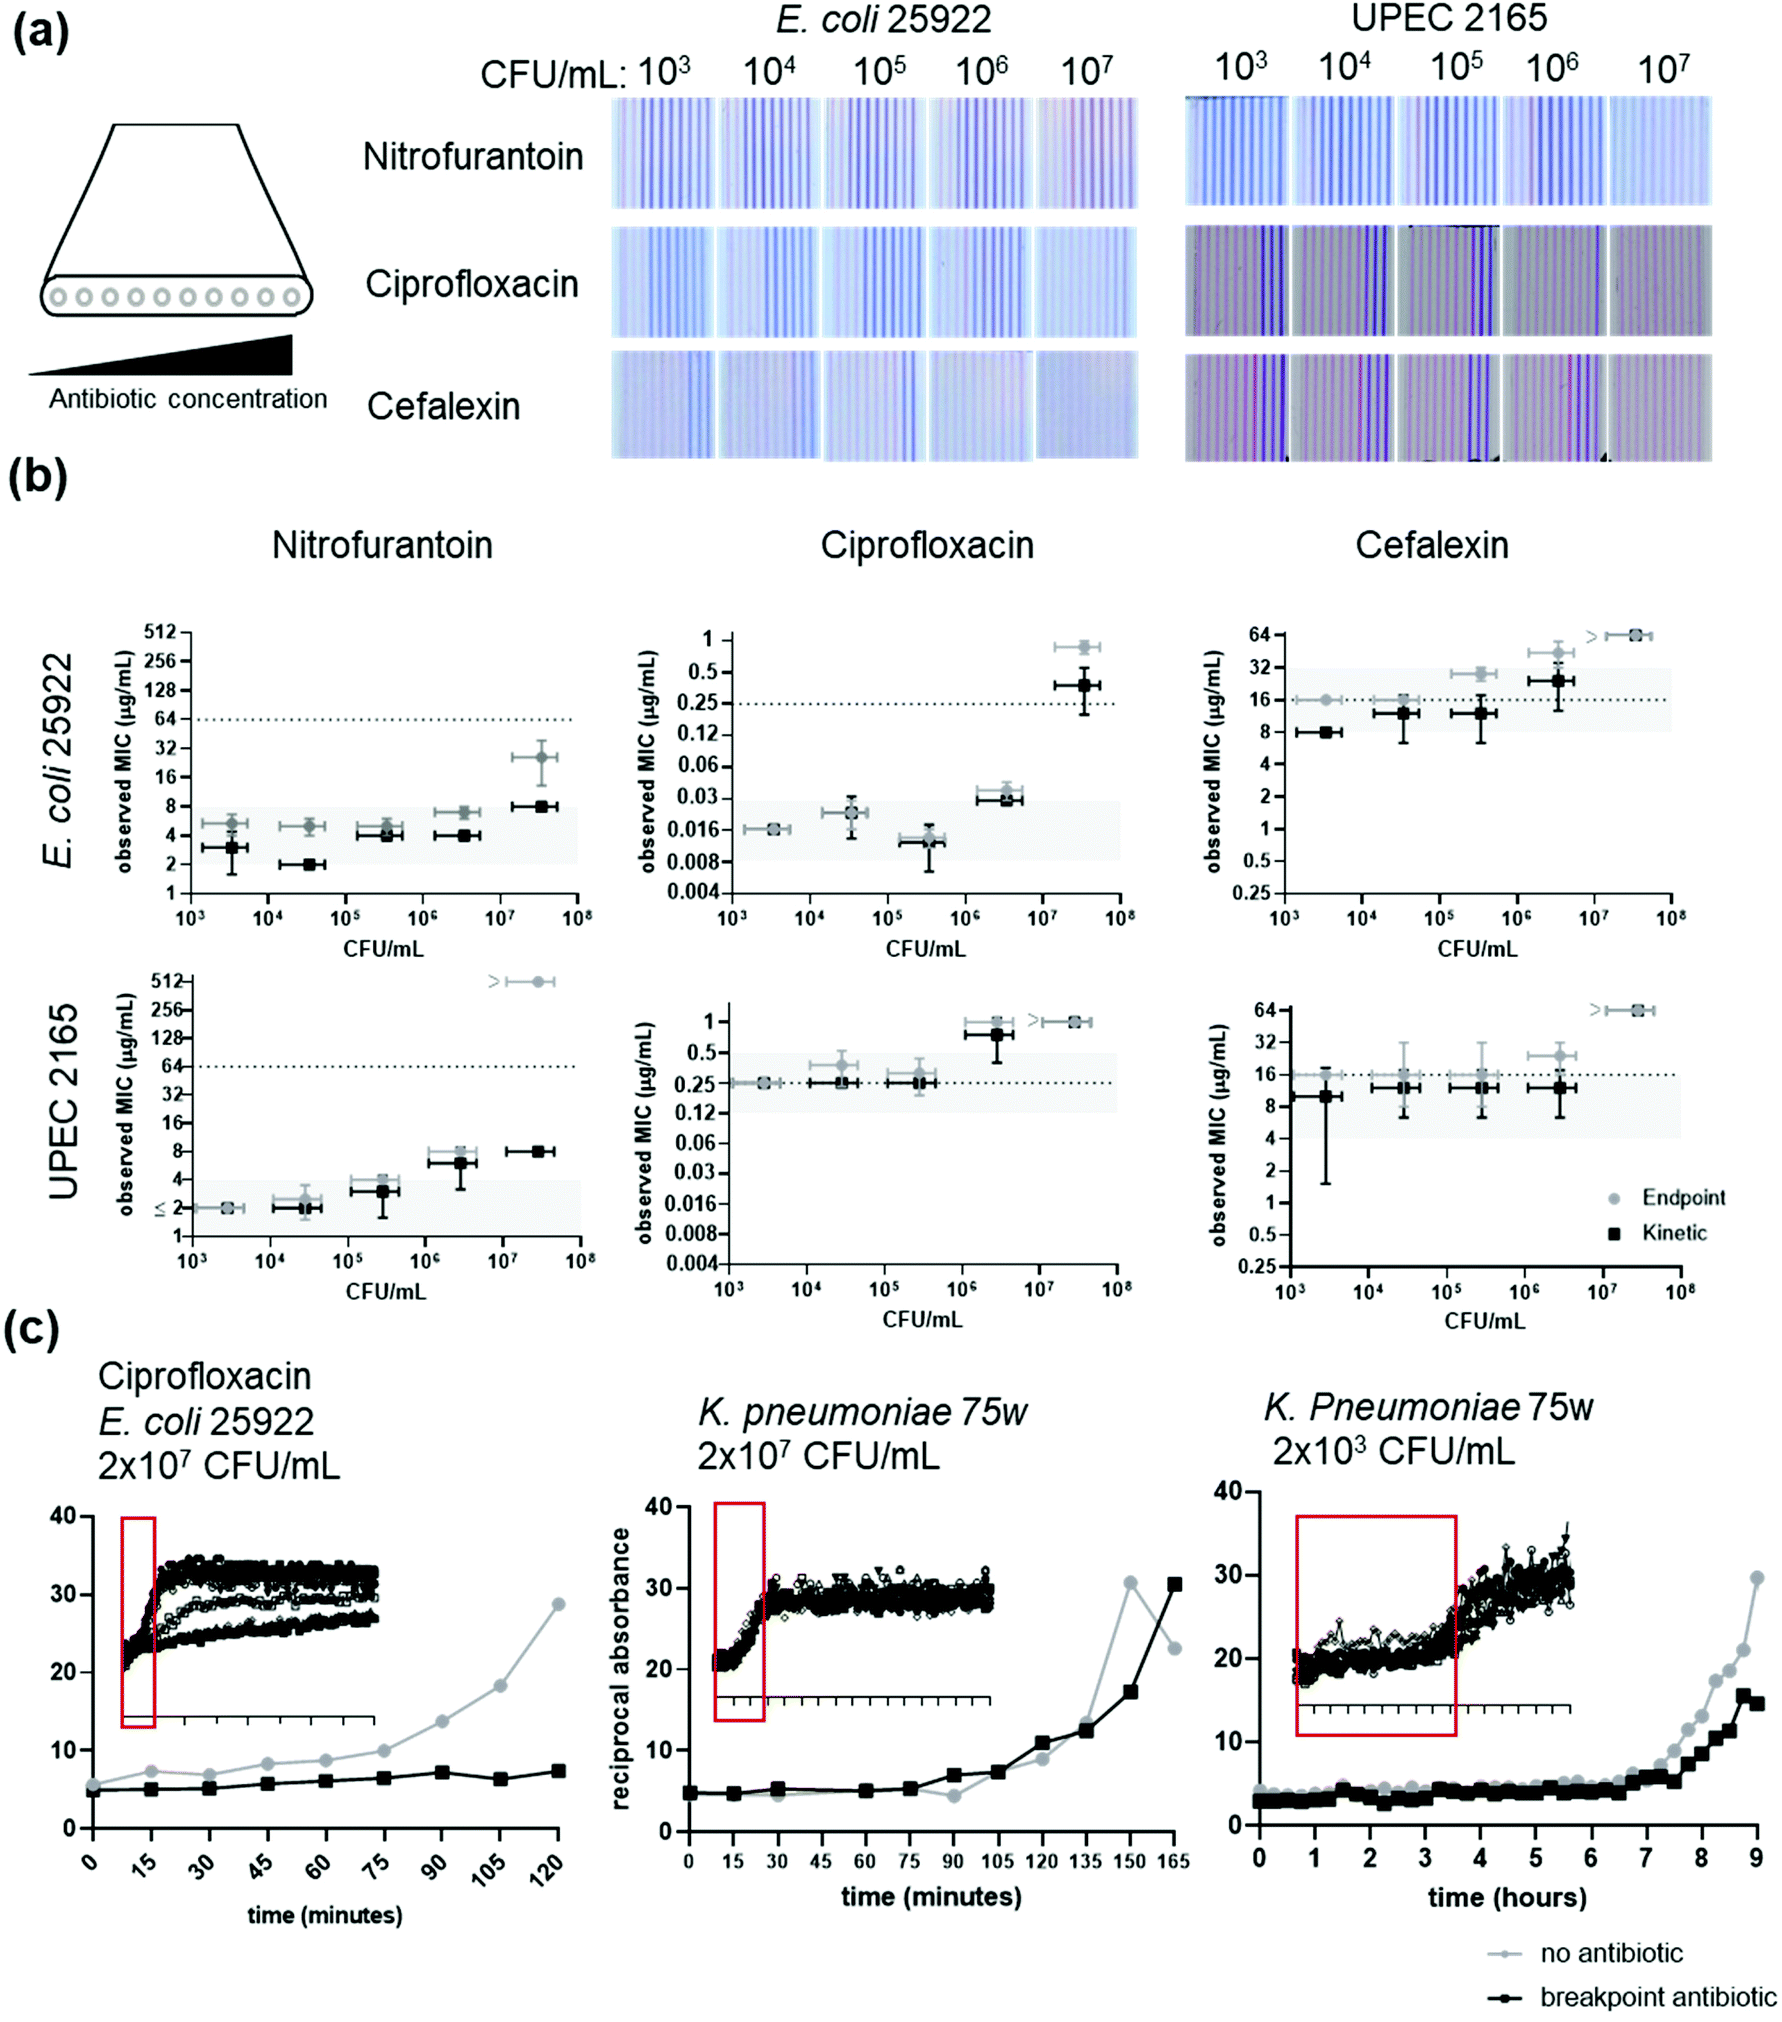 | ||
| Fig. 4 Effect of inoculum density on MIC. (a) Schematic showing antibiotic concentration is highest in capillary 10. Capillary 1 contains no antibtioc and acts as a growth control. Representative images of capillary test strips at various incoculum density ranging from 103–107 CFU per mL. (b) MIC observed at different inoculum density. Data indicates average of duplicate capillaries for two independent experiments. Vertical error bars indicate ± SEM and horizontal error bars indicate ± SD for inoclum density determiend by overnight agar plating. (c) Growth kinetics of E. coli 25922 and isolate 75w with ciprofloxacin. Inset graph indicates full MIC growth curve over 16 h. Data points indicate average of duplicate capillaries. | ||
Time-lapse imaging has been used for other phenotypic AST microdevices to determine delayed growth in the presence of antibiotics compared to a growth control for rapid determination of susceptibility.15,17,52–54 The use of miniaturised colorimetric BMD tests combined with kinetic data collection offers further opportunity to gain detailed insight into bacterial response to antimicrobial agents, for example through detection of differential growth kinetics indicating susceptibility, providing an earlier time to result, which can be accurate as seen with earlier time reads at 6 h.
We further explored the use of time-lapse imaging and growth differential on AST performed with varying inoculum density to determine if even earlier time to results could be achieved accurately. An MIC was calculated based on differential growth kinetics, susceptibility was defined as 1 h delayed growth compared to the growth control, for different inoculum densities (Fig. 4b). While the EUCAST recommended inoculum density and below results were consistent with overnight incubation, delayed growth in the presence of antibiotics was seen in higher cell densities, around 106 CFU per mL (Fig. 4b). However, MIC results at the highest inoculum densities, over 107 CFU per mL were still unreliable and an MIC could not be determined for cephalexin and ciprofloxacin.
Clearly, deviations from the recommended inoculum density affect the accuracy of the AST result in microcapillary BMD as would be expected even in standard broth microdilution. However, this preliminary work does have implications for other microfluidic assays and novel assays for rapid/direct AST for clinical applications. Higher inoculum densities convert resazurin much faster than lower densities and increases the MIC or shows false resistance. While false resistance is undesirable, this causes less harm to the patient than a false susceptible score. However, depending on the antibiotic, if at high inoculum densities, a delay in growth is observed for an antibiotic this could confidently indicate susceptibility (Fig. 4c). The accuracy of this method varies depending on the antibiotic, and as with even gold standard methods, if the MIC of isolates is close to breakpoint concentrations, categorical agreement of AST is less reliable.
4. Conclusion
Overall, by measuring growth with large panels of antibiotic combined with a set of E. coli and K. pneumoniae strains with a range of susceptibilities, we observed that microfluidic broth microdilution performs very similarly to microplate broth microdilution performed in house in the presence of resazurin and commercial automated AST systems without resazurin. This indicated resazurin present at the beginning of the assay did not interfere with AST results (Table S2†). While agreement between the methods was very close (Tables 1 and 2), the conditions where different results were obtained represented samples with marginal MIC where variability in AST is known to be highest.We observed the IE, that is well characterised for microplate measurements, also affects microfluidic broth microdilution (Fig. 4), with implications for direct testing methods where bacterial inoculum density may be unknown or difficult to control. As might be expected, faster results can be obtained with earlier growth readouts, yet some trade-off is apparent between speed and accuracy. Nevertheless, even with 6 h endpoint (Table 3), accuracy remained excellent for some antibiotics and overall was 90%.
In this study only E. coli and K. pneumoniae isolates were tested. Further evaluation on a greater number of different species is necessary to determine the tests use. For example, urinary tract infections are mostly caused by Gram-negative bacteria, and predominantly E. coli, in which this test has been shown to be accurate. However, infections resulting from more diverse causative agents including Gram-positive bacteria will need further evaluation.
Whilst overnight plating to obtain individual colony isolates, plus cell density adjustment prior to testing is still required, the microcapillary BMD method is a simplified AST method, whilst remaining compatible with conventional microtitre plate format found in most laboratories for sample preparation. The size of the test allows in-house time-lapse imaging systems to easily capture multiple tests at low cost and increased test number for the same incubator space compared to microplate BMD and disc diffusion. Microcapillary BMD method increases the number of isolates screened in a single 96 well plate; one standard microplate BMD can test around 6 isolates in duplicate with 6 concentrations of a single antibiotic, the microcapillary BMD can test 96 isolates, with a single isolate per well. Each microcapillary BMD test strip provides 9 antibiotic conditions plus a growth control, and each well can be dipped with multiple test strips for replicates or other antibiotic test strips.
The microcapillary BMD can provide categorical susceptibility/resistance scoring at time points within 6 h based on differential growth. While further investigation is needed for validation with a greater variety of bacteria, in the samples tested here, kinetic analysis can provide a faster prediction of S/R categorisation at and above the recommended inoculum density. However, isolates with an MIC within two-fold dilution of the breakpoint may show decreased accuracy of results.
Author contributions
SHN: conceptualisation, data curation, formal analysis, investigation, methodology, project administration, software, visualization, writing – original draft, writing – review & editing. WI: resources, writing – review & editing. ZR: resources, writing – review & editing. SA: resources, writing – review & editing. PR: writing – review & editing. JT: resources. SA: resources. SP: resources, writing – review and editing. NS: investigation, writing – review and editing. NC: investigation, resources, writing – review and editing. CR: resources, writing – review and editing. ADE: conceptualisation, funding acquisition, methodology, project administration, supervision, writing – original draft, writing – review & editing.Ethical approval
The collection of urinary pathogenic E. coli from a tertiary care hospital of Pakistan from community acquired UTI patients and was approved by Ethical Review Board (ERB) of Pakistan Institute of Medical Sciences.Conflicts of interest
ADE is one of the inventors of patent application protecting aspects of the novel microfluidic devices tested in this study and is a director and shareholder in Capillary Film Technology Ltd, a company holding a commercial license to this patent application: WO2016012778 “Capillary assay device with internal hydrophilic coating” AD Edwards, NM Reis.Acknowledgements
This research was supported by the EPSRC (EP/R022410/1 and EP/W52468/1) and Higher Education Commission, Pakistan (Pin Number: 2BM2–093) and Commonwealth Scholarship Commission (CSC Ref# PKCN-2017–215).References
- D. Trevas, A. M. Caliendo, K. Hanson, J. Levy and C. C. Ginocchio, Infectious Diseases Society of A. Diagnostic Tests Can Stem the Threat of Antimicrobial Resistance: Infectious Disease Professionals Can Help. Clinical Infectious Diseases, 2020 Search PubMed.
- L. Grigoryan, B. W. Trautner and K. Gupta, Diagnosis and management of urinary tract infections in the outpatient setting: a review, J. Am. Med. Assoc., 2014, 312(16), 1677–1684 CrossRef PubMed.
- M. C. O'Grady, L. Barry, G. D. Corcoran, C. Hooton, R. D. Sleator and B. Lucey, Empirical treatment of urinary tract infections: how rational are our guidelines?, J. Antimicrob. Chemother., 2019, 74(1), 214–217 Search PubMed.
- A. Bryce, A. D. Hay, I. F. Lane, H. V. Thornton, M. Wootton and C. Costelloe, Global prevalence of antibiotic resistance in paediatric urinary tract infections caused by Escherichia coli and association with routine use of antibiotics in primary care: systematic review and meta-analysis, BMJ, 2016, 352, i939 CrossRef PubMed.
- V. Watts, B. Brown, M. Ahmed, A. Charlett, C. Chew-Graham and P. Cleary, et al., Routine laboratory surveillance of antimicrobial resistance in community-acquired urinary tract infections adequately informs prescribing policy in England, JAC Antimicrob. Resist., 2020, 2(2), dlaa022 CrossRef PubMed.
- M. R. Pulido, M. García-Quintanilla, R. Martín-Peña, J. M. Cisneros and M. J. McConnell, Progress on the development of rapid methods for antimicrobial susceptibility testing, J. Antimicrob. Chemother., 2013, 68(12), 2710–2717 CrossRef CAS PubMed.
- J. P. Lavigne, P. Espinal, C. Dunyach-Remy, N. Messad, A. Pantel and A. Sotto, Mass spectrometry: a revolution in clinical microbiology?, Clin. Chem. Lab. Med., 2013, 51(2), 257–270 CrossRef CAS PubMed.
- W. Florio, L. Baldeschi, C. Rizzato, A. Tavanti, E. Ghelardi and A. Lupetti, Detection of Antibiotic-Resistance by MALDI-TOF Mass Spectrometry: An Expanding Area, Front. Cell. Infect. Microbiol., 2020, 10, 616 Search PubMed.
- S. H. Needs, S. I. Donmez, S. P. Bull, C. McQuaid, H. M. I. Osborn and A. D. Edwards, Challenges in Microfluidic and Point-of-Care Phenotypic Antimicrobial Resistance Tests, Front. Mech. Eng., 2020, 6, 73 CrossRef.
- J. M. Andrews, BSAC standardized disc susceptibility testing method, J. Antimicrob. Chemother., 2001, 48(Suppl 1), 43–57 CAS.
- J. M. Andrews, BSAC standardized disc susceptibility testing method (version 4), J. Antimicrob. Chemother., 2005, 56(1), 60–76 CrossRef CAS PubMed.
- J. H. Jorgensen and J. D. Turnidge, Susceptibility Test Methods: Dilution and Disk Diffusion Methods, Man. Clin. Microbiol., 2015, 1253–1273 Search PubMed.
- S. C. Kim, S. Cestellos-Blanco, K. Inoue and R. N. Zare, Miniaturized Antimicrobial Susceptibility Test by Combining Concentration Gradient Generation and Rapid Cell Culturing, Antibiotics, 2015, 4(4), 455–466 CrossRef PubMed.
- F. Wu and C. Dekker, Nanofabricated structures and microfluidic devices for bacteria: from techniques to biology, Chem. Soc. Rev., 2016, 45(2), 268–280 RSC.
- J. Avesar, D. Rosenfeld, M. Truman-Rosentsvit, T. Ben-Arye, Y. Geffen and M. Bercovici, et al., Rapid phenotypic antimicrobial susceptibility testing using nanoliter arrays, Proc. Natl. Acad. Sci. U. S. A., 2017, 114(29), E5787 CrossRef CAS PubMed.
- M. Azizi, M. Zaferani, B. Dogan, S. Zhang, K. W. Simpson and A. Abbaspourrad, Nanoliter-Sized Microchamber/Microarray Microfluidic Platform for Antibiotic Susceptibility Testing, Anal. Chem., 2018, 90(24), 14137–14144 CrossRef CAS PubMed.
- W. Kang, S. Sarkar, Z. S. Lin, S. McKenney and T. Konry, Ultrafast Parallelized Microfluidic Platform for Antimicrobial Susceptibility Testing of Gram positive and Negative Bacteria, Anal. Chem., 2019, 91(9), 6242–6249 CrossRef CAS PubMed.
- P. Zhang, A. M. Kaushik, K. E. Mach, K. Hsieh, J. C. Liao and T.-H. Wang, Facile syringe filter-enabled bacteria separation, enrichment, and buffer exchange for clinical isolation-free digital detection and characterization of bacterial pathogens in urine, Analyst, 2021, 146(8), 2475–2483 RSC.
- L. Baraban, F. Bertholle, M. L. Salverda, N. Bremond, P. Panizza and J. Baudry, et al., Millifluidic droplet analyser for microbiology, Lab Chip, 2011, 11(23), 4057–4062 RSC.
- L. Jiang, L. Boitard, P. Broyer, A. C. Chareire, P. Bourne-Branchu and P. Mahé, et al., Digital antimicrobial susceptibility testing using the MilliDrop technology, Eur. J. Clin. Microbiol. Infect. Dis., 2016, 35(3), 415–422 CrossRef CAS PubMed.
- N. J. Cira, J. Y. Ho, M. E. Dueck and D. B. Weibel, A self-loading microfluidic device for determining the minimum inhibitory concentration of antibiotics, Lab Chip, 2012, 12(6), 1052–1059 RSC.
- Y. Matsumoto, S. Sakakihara, A. Grushnikov, K. Kikuchi, H. Noji and A. Yamaguchi, et al., A Microfluidic Channel Method for Rapid Drug-Susceptibility Testing of Pseudomonas aeruginosa, PLoS One, 2016, 11(2), e0148797 CrossRef PubMed.
- P. J. W. He, I. N. Katis, A. J. U. Kumar, C. A. Bryant, C. W. Keevil and B. K. Somani, et al., Laser-patterned paper-based sensors for rapid point-of-care detection and antibiotic-resistance testing of bacterial infections, Biosens. Bioelectron., 2020, 152, 112008 CrossRef CAS PubMed.
- S. Kim, F. Masum, J.-K. Kim, H. J. Chung and J. S. Jeon, On-chip phenotypic investigation of combinatory antibiotic effects by generating orthogonal concentration gradients, Lab Chip, 2019, 19(6), 959–973 RSC.
- B. Li, Y. Qiu, A. Glidle, D. McIlvenna, Q. Luo and J. Cooper, et al., Gradient Microfluidics Enables Rapid Bacterial Growth Inhibition Testing, Anal. Chem., 2014, 86(6), 3131–3137 CrossRef CAS PubMed.
- J. Choi, Y.-G. Jung, J. Kim, S. Kim, Y. Jung and H. Na, et al., Rapid antibiotic susceptibility testing by tracking single cell growth in a microfluidic agarose channel system, Lab Chip, 2013, 13(2), 280–287 RSC.
- Ö. Baltekin, A. Boucharin, E. Tano, D. I. Andersson and J. Elf, Antibiotic susceptibility testing in less than 30 min using direct single-cell imaging, Proc. Natl. Acad. Sci. U. S. A., 2017, 114(34), 9170 CrossRef PubMed.
- P. Wistrand-Yuen, C. Malmberg, N. Fatsis-Kavalopoulos, M. Lübke, T. Tängdén and J. Kreuger, A Multiplex Fluidic Chip for Rapid Phenotypic Antibiotic Susceptibility Testing, mBio, 2020, 11(1), e03109–e03119 CrossRef CAS PubMed.
- A. Espinel-Ingroff, T. M. Kerkering, P. R. Goldson and S. Shadomy, Comparison study of broth macrodilution and microdilution antifungal susceptibility tests, J. Clin. Microbiol., 1991, 29(6), 1089–1094 CrossRef CAS PubMed.
- M. Hombach, F. P. Maurer, T. Pfiffner, E. C. Böttger and R. Furrer, Standardization of Operator-Dependent Variables Affecting Precision and Accuracy of the Disk Diffusion Method for Antibiotic Susceptibility Testing, J. Clin. Microbiol., 2015, 53(12), 3864–3869 CrossRef PubMed.
- E. A. Idelevich and K. Becker, How to accelerate antimicrobial susceptibility testing, Clin. Microbiol. Infect., 2019, 25(11), 1347–1355 CrossRef CAS PubMed.
- K. P. Smith and J. E. Kirby, The Inoculum Effect in the Era of Multidrug Resistance: Minor Differences in Inoculum Have Dramatic Effect on MIC Determination, Antimicrob. Agents Chemother., 2018, 62(8), e00433–e00418 CrossRef CAS PubMed.
- M. Hombach, M. Jetter, P. M. Keller, N. Blöchliger, N. Kolesnik-Goldmann and E. C. Böttger, Rapid detection of ESBL, carbapenemases, MRSA and other important resistance phenotypes within 6–8 h by automated disc diffusion antibiotic susceptibility testing, J. Antimicrob. Chemother., 2017, 72(11), 3063–3069 CrossRef CAS PubMed.
- I. Fröding, M. Vondracek and C. G. Giske, Rapid EUCAST disc diffusion testing of MDR Escherichia coli and Klebsiella pneumoniae: inhibition zones for extended-spectrum cephalosporins can be reliably read after 6 h of incubation, J. Antimicrob. Chemother., 2017, 72(4), 1094–1102 Search PubMed.
- S. Chandrasekaran, A. Abbott, S. Campeau, B. L. Zimmer, M. Weinstein and L. Thrupp, et al., Direct-from-Blood-Culture Disk Diffusion To Determine Antimicrobial Susceptibility of Gram-negative Bacteria: Preliminary Report from the Clinical and Laboratory Standards Institute Methods Development and Standardization Working Group, J. Clin. Microbiol., 2018, 56(3), e01678–e01617 CrossRef CAS PubMed.
- S. Mancini, K. Röthlin, E. Bodendoerfer, S. Herren, N. Kolesnik-Goldmann and P. Courvalin, et al., Tentative breakpoints and areas of technical uncertainty for early reading automated disc diffusion for Enterobacterales, J. Antimicrob. Chemother., 2020, 75(6), 1495–1505 CrossRef CAS PubMed.
- A. I. Barbosa, P. Gehlot, K. Sidapra, A. D. Edwards and N. M. Reis, Portable smartphone quantitation of prostate specific antigen (PSA) in a fluoropolymer microfluidic device, Biosens. Bioelectron., 2015, 70, 5–14 CrossRef CAS PubMed.
- A. P. Castanheira, A. I. Barbosa, A. D. Edwards and N. M. Reis, Multiplexed femtomolar quantitation of human cytokines in a fluoropolymer microcapillary film, Analyst, 2015, 140(16), 5609–5618 RSC.
- A. I. Barbosa, A. P. Castanheira, A. D. Edwards and N. M. Reis, A lab-in-a-briefcase for rapid prostate specific antigen (PSA) screening from whole blood, Lab Chip, 2014, 14(16), 2918–2928 RSC.
- A. D. Edwards, N. M. Reis, N. K. Slater and M. R. Mackley, A simple device for multiplex ELISA made from melt-extruded plastic microcapillary film, Lab Chip, 2011, 11(24), 4267–4273 RSC.
- Z. Rafaque, J. I. Dasti and S. C. Andrews, Draft genome sequence of a multidrug-resistant CTX-M-15 β-lactamase-producing uropathogenic Escherichia coli isolate (ST131-O25b-H30) from Pakistan exhibiting high potential virulence, J. Global Antimicrob. Resist, 2018, 15, 164–165 CrossRef PubMed.
- Z. Rafaque, J. I. Dasti and S. C. Andrews, Draft genome sequence of a uropathogenic Escherichia coli isolate (ST38 O1:H15) from Pakistan, an emerging multidrug-resistant sequence type with a high virulence profile, New Microbes New Infect., 2019, 27, 1–2 CrossRef CAS PubMed.
- I. Ali, Z. Rafaque, I. Ahmed, F. Tariq, S. E. Graham and E. Salzman, et al., Phylogeny, sequence-typing and virulence profile of uropathogenic Escherichia coli (UPEC) strains from Pakistan, BMC Infect. Dis., 2019, 19(1), 620 CrossRef PubMed.
- C. Runcharoen, K. E. Raven, S. Reuter, T. Kallonen, S. Paksanont and J. Thammachote, et al., Whole genome sequencing of ESBL-producing Escherichia coli isolated from patients, farm waste and canals in Thailand, Genome Med., 2017, 9(1), 81 CrossRef PubMed.
- J. Pivetal, F. Pereira, A. I. Barbosa, A. P. Castanheira, N. M. Reis and A. D. Edwards, Covalent immobilisation of antibodies in Teflon-FEP microfluidic devices for sensitive quantification of clinically relevant protein biomarkers, Analyst, 2017, 142, 959–968 RSC.
- N. M. Reis, J. Pivetal, A. L. Loo-Zazueta, J. M. S. Barros and A. D. Edwards, Lab on a stick: multi-analyte cellular assays in a microfluidic dipstick, Lab Chip, 2016, 16(15), 2891–2899 RSC.
- S. H. Needs, T. T. Diep, S. P. Bull, A. Lindley-Decaire, P. Ray and A. D. Edwards, Exploiting open source 3D printer architecture for laboratory robotics to automate high-throughput time-lapse imaging for analytical microbiology, PLoS One, 2019, 14(11), e0224878 CrossRef CAS PubMed.
- S. H. Needs, H. M. I. Osborn and A. D. Edwards, Counting bacteria in microfluidic devices: Smartphone compatible ‘dip-and-test’ viable cell quantitation using resazurin amplified detection in microliter capillary arrays, J. Microbiol. Methods, 2021, 106199 CrossRef CAS PubMed.
- S. M. Jégouic, I. M. Jones and A. D. Edwards, Affordable mobile microfluidic diagnostics: minimum requirements for smartphones and digital imaging for colorimetric and fluorometric anti-dengue and anti-SARS-CoV-2 antibody detection [version 1; peer review: 1 approved], Wellcome Open Res., 2021, 6(57) DOI:10.12688/wellcomeopenres.16628.1.
- S. H. Needs, D. Sİ and A. D. Edwards, Direct microfluidic antibiotic resistance testing in urine with smartphone capture: significant variation in sample matrix interference between individual human urine samples, RSC Adv., 2021, 11(60), 38258–38263 RSC.
- G. V. Doern and S.M: Brecher, The Clinical Predictive Value (or Lack Thereof) of the Results of In Vitro Antimicrobial Susceptibility Tests, J. Clin. Microbiol., 2011, 49(9 Suppl), S11–S4 Search PubMed.
- J. F. Busche, S. Moller, M. Stehr and A. Dietzel, Cross-Flow Filtration of Escherichia coli at a Nanofluidic Gap for Fast Immobilization and Antibiotic Susceptibility Testing, Micromachines, 2019, 10, 691 CrossRef PubMed.
- H. Sun, C. W. Chan, Y. Wang, X. Yao, X. Mu and X. Lu, et al., Reliable and reusable whole polypropylene plastic microfluidic devices for a rapid, low-cost antimicrobial susceptibility test, Lab Chip, 2019, 19(17), 2915–2924 RSC.
- M. Osaid, Y.-S. Chen, C.-H. Wang, A. Sinha, W.-B. Lee and P. Gopinathan, et al., A multiplexed nanoliter array-based microfluidic platform for quick, automatic antimicrobial susceptibility testing, Lab Chip, 2021, 21, 2223–2231 RSC.
Footnote |
| † Electronic supplementary information (ESI) available. See DOI: https://doi.org/10.1039/d2an00305h |
| This journal is © The Royal Society of Chemistry 2022 |