
 Open Access Article
 This Open Access Article is licensed under a
 Creative Commons Attribution 3.0 Unported Licence
Fourier transformation liquid chromatography: increasing sensitivity by a factor of 50
Markus
Matz†
 a,
Carlo
Botha†
a,
Timo
Beskers
b and
Manfred
Wilhelm
*a
a,
Carlo
Botha†
a,
Timo
Beskers
b and
Manfred
Wilhelm
*a
aKarlsruhe Institute of Technology (KIT), Institute for Chemical Technology and Polymer Chemistry, Engesserstraße 18, 76131 Karlsruhe, Germany. E-mail: manfred.wilhelm@kit.edu
bPSS Polymer Standards Service GmbH, In der Dalheimer Wiese 5, 55023 Mainz, Germany
First published on 24th February 2022
Abstract
Methods that increase sensitivity are a constant topic in research. To increase the sensitivity for high-performance liquid chromatography (HPLC) a continuous injection method with a sinusoidal analyte concentration profile was developed. The sinusoidal analyte concentration profile is obtained by a sinusoidal variation of the relative volume contents between two solvent reservoirs, one containing a pure solvent and the other an analyte stock solution prepared with the same solvent. Discrete Fourier transformation enables the analyte-specific phase angle shift to be calculated from the chromatograms. The proposed method is established and evaluated for size exclusion chromatography (SEC). Accordingly, the phase angle shift is used for molecular weight determination by establishing a molecular weight calibration using different narrowly distributed polystyrene (PS) calibration standards. In a comparison with conventional SEC, the Signal-to-Noise ratio (S/N), normalized to the square root of the time of the evaluated data set, increases by a factor of approximately 50.
Introduction
One of the most widely used analytical separation techniques is high-performance liquid chromatography (HPLC).1 Consequently, HPLC method development for increasing sensitivity and selectivity is the subject of ongoing research.2–8 A commonly used measure of the sensitivity in HPLC is the Signal-to-Noise ratio (S/N) of a chromatogram, which can be defined as the maximum intensity of the analyte peak (i.e. signal) divided by the standard deviation of a peak-free region (i.e. noise).1 Options to increase the S/N depend on the method used. Some examples include: (1) increasing the amount of analyte by including pre-concentration steps or by enlarging the injection loop volume;4,5 (2) derivatizing the analyte before detection;5,6 (3) optimizing chromatographic conditions;3 (4) implementing post-acquisition suitable data processing methods;3 and (5) using a more sensitive detector.7A less investigated way to increase the S/N is to modify the sample injection procedure. In 1962, Reilley et al.2 discussed theoretical injection profiles in gas chromatography as a possible alternative to the conventional injection method (i.e. single injection). Two suggested injection profiles, proposed by Reilley et al., are multiple (single) injections and a continuous sinusoidal “injection”. In subsequent publications, both methods have been further investigated.8–19 Methods with multiple random injections have been applied to liquid and gas chromatography where the chromatogram is evaluated using cross-correlation or Hadamard transformation to increase the S/N and for process control.8–10,14–18 However, continuous sinusoidal “injections” have only been established in rare cases for gas chromatography for process control purposes.11–13 To date, none of these modified injection methods have been used extensively or fully developed. This is probably mostly attributed to the more complex data processing compared to the conventional injection method (i.e. single injections) and to the fact that current chromatographic issues can already be answered using the conventional injection method.9
The application of numerical transformation methods like Fourier- and Hadamard transformation to increase sensitivity and selectivity is already described for several methods, e.g. for nuclear magnetic resonance (NMR) spectroscopy, mass spectrometry, and electrophoresis.20–25 To date, however, Fourier transformation has not been applied to liquid chromatography (LC).
In this work, a sinusoidal “injection” was developed and applied to LC specifically in size exclusion mode, named Fourier transformation size exclusion chromatography (FT-SEC). A schematic of the difference between conventional SEC and FT-SEC is depicted in Fig. 1.19 Please be aware that the injection in conventional LC can be approximated as a delta function in the time domain, which is the respective Fourier pair of a sinusoid in the frequency domain.26 For the FT-SEC method, the time and frequency domains are inverted, i.e. a sinusoidal excitation signal is present in the time domain which corresponds to a delta peak in the frequency domain. The phase angle of the delta peak in the frequency domain provides information about the analyte specific retention time.
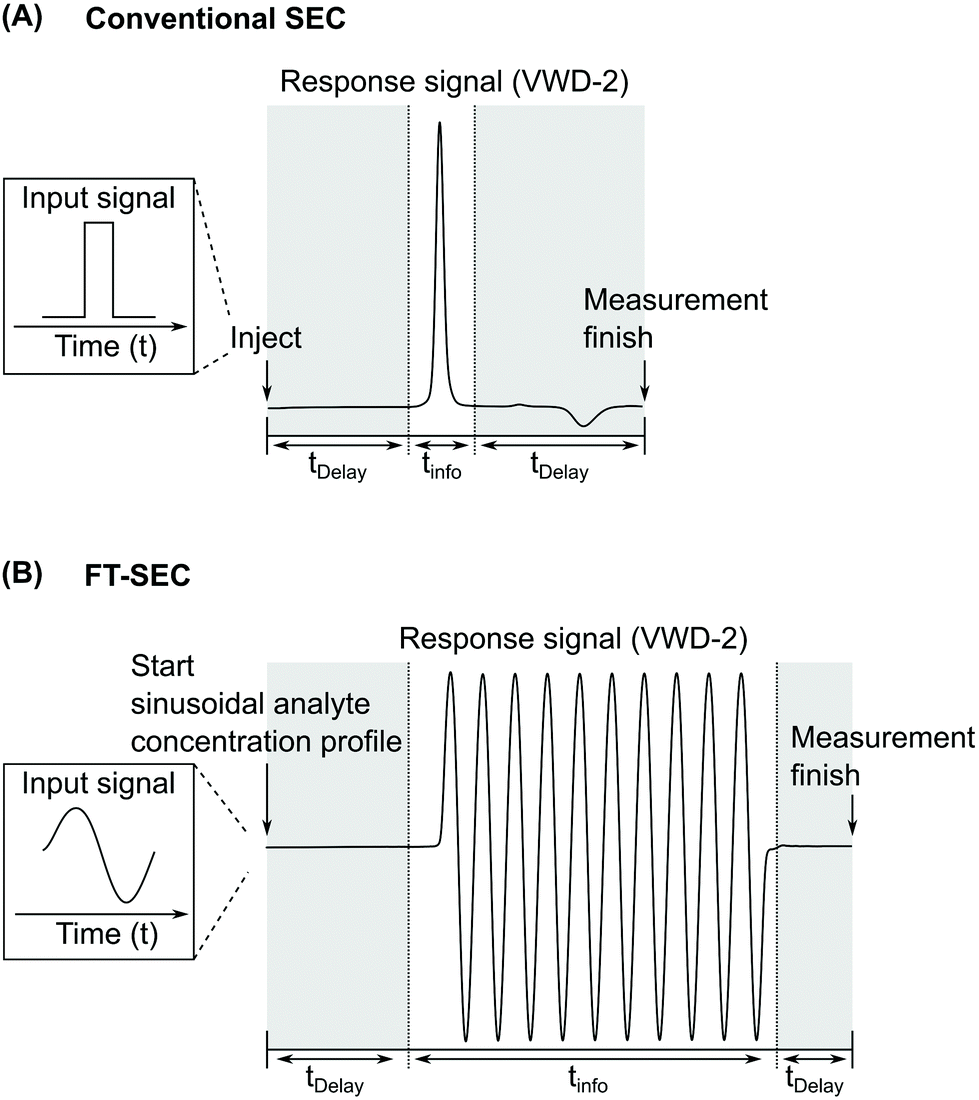 | ||
| Fig. 1 Comparison between the chromatograms of VWD-2 (see Fig. 2) of (A) conventional SEC (single injection) and (B) Fourier transformation SEC (FT-SEC, continuous sinusoidal “injection” by applying a sinusoidal analyte concentration profile).19 The elution phases are subdivided into regions of delay times, tDelay, and information time, tinfo. To compare the efficiency of both methods, the percentage ratio between the information time and the total measurement time (i.e. the sum of delay times and info time) can be used, which is referred to as duty cycle. For (A) the duty cycle is around 17% and for (B) 63%. | ||
SEC was chosen because of its isocratic nature, well-defined separation range, and relative to other LC techniques, simple separation mechanism, making it the ideal starting point for experimental developments. However, the continuous sinusoidal “injection” should theoretically be applicable for certain LC methods, e.g. reversed phase HPLC and normal phase HPLC. This will be subject of future investigations. The method was established using polystyrene (PS) calibration standards with different molecular weights at peak maximum and narrow molecular weight dispersity. The sinusoidal “injection” is realized by using a solvent gradient capable quaternary pump which sinusoidally changes the relative volume contents between two solvent reservoirs. One solvent reservoir contains the pure solvent and the other a stock solution of the sample to be analyzed prepared with the same solvent. As a result, a sinusoidal concentration profile of the sample is continuously introduced into the system. Similar to this sinusoidal excitation signal before the column, the detector after the column has a time-delayed sinusoidal response signal, instead of the common response of resolved and broadened peaks. The discrete Fourier transformation (DFT) of the sinusoidal chromatograms decomposes the chromatograms into their frequency components. Each frequency component is characterized by a magnitude and a phase angle. The frequency component equals the excitation frequency of the sinusoidal analyte concentration profile is used for sample evaluation. The phase angle shift between the excitation and the response signal correlates to the retention time in a conventional LC experiment and, therefore, to molecular weight in SEC. The FT-SEC method is expected to have higher sensitivity than the conventional SEC method for the following two reasons: (1) in FT-SEC, as the sample is continuously introduced into the system, more analyte is measured within the same time. (2) The random noise is equally distributed over all data points in both, the time domain and the frequency domain. The number of complex data points in the frequency domain is equal to the number of real data points in the time domain and depends on the acquisition time and the sampling rate.27 However, only one data point in the frequency domain with known location is of importance for the proposed experimental evaluation. This argument can be seen in analogy to the benefit of “lock in amplifiers” in electronic devices.
The phase angle shifts between the excitation and response signals are expected to differ according to the molecular weight of the different PS standards and these phase angle shifts are used for establishing a molecular weight calibration. After establishing a calibration for FT-SEC, mixtures of PS standards were measured and the problem of the superposition of signals was studied. The method was optimized by investigating the effect of the period of the sinusoidal analyte concentration profile on the S/N. Finally, a sensitivity comparison between the developed FT-SEC method and conventional SEC was conducted.
Realization of the FT-SEC method
The system set-up is depicted in Fig. 2 and consisted of a quaternary pump, two variable UV/VIS wavelength detectors (VWD-1 and VWD-2) installed in front of (VWD-1) and behind an SEC column (VWD-2). The quaternary pump and the VWDs were connected to a universal data center (UDC). The UDC was modified with a manual injection trigger for starting the FT-SEC measurement. The solvent reservoir composition table in the quaternary pump interface was programmed to vary sinusoidally the composition between two solvent reservoirs, one solvent reservoir contained an analyte stock solution (PS + THF) and the other pure solvent (THF) as shown in Fig. 3. The solvent reservoir composition table was split into 100 equidistant time steps of 3.6° phase angle increment, which was the maximum possible number of time steps of the used quaternary pump. For each time step, the relative volume contents of the solvent reservoirs were adjusted to align with two sinusoidal curves shifted by 180° to each other. Between each consecutive time step, the quaternary pump changes the relative volume contents with a constant rate so that the obtained relative volume content profiles approximate a sinusoid. In the enlarged window of Fig. 3 the relative volume content profile of the solvent reservoir containing THF + PS is shown to highlight the constant rate of relative volume content change between two consecutive time steps (visualized as a straight line between two time steps). For the best approximation of a sinusoid, the highest number of time steps available in the solvent reservoir composition table of the quaternary pump interface should be used. The solvent reservoir composition profile used in this work started always at relative volume contents of 50%. However, different starting relative volume contents are possible. The magnitude of a sinusoid is the same in time as well as in frequency domain. Therefore, to obtain the highest sensitivity, the relative volume content of the analyte stock solution was varied from 0% to 100%. Because of the approximated sinusoidal change of the relative volume content of the analyte stock solution, an analyte concentration profile with a similar shape is obtained prior to the column. Accordingly, the period of the solvent reservoir composition profile in Fig. 3 is equal to the period of the resulting analyte concentration profile. The period was pre-set based on the separation range of the column as discussed in section “Molecular weight calibration”. For an FT-SEC measurement, the solvent reservoir composition profile was repeated by the quaternary pump for a predefined number of times (oscillations). The minimum number of oscillations is discussed in the following sections. In this work 5–12 oscillations were typically used. The VWD-1 records the excitation signal before the column and the VWD-2 the response signal behind the column where the length of the sinusoidal chromatograms depends on the number of oscillations. Subsequently, the phase angle shift between both chromatograms was determined using Fourier transformation. In the consecutive two sections, the chromatographic fundamentals and the data processing procedure of the sinusoidal chromatograms are explained in more detail. | ||
| Fig. 2 System set-up for FT-SEC, consisting of a quaternary pump, two variable wavelength detectors (VWD), one in front of (VWD-1) and one behind (VWD-2) the column. A universal data center (UDC) was equipped with an injection trigger for starting the FT-SEC measurement. For evaluation of an FT-LC measurement, the phase angle shift between the sinusoidal detector response from VWD-2 to VWD-1 was determined. | ||
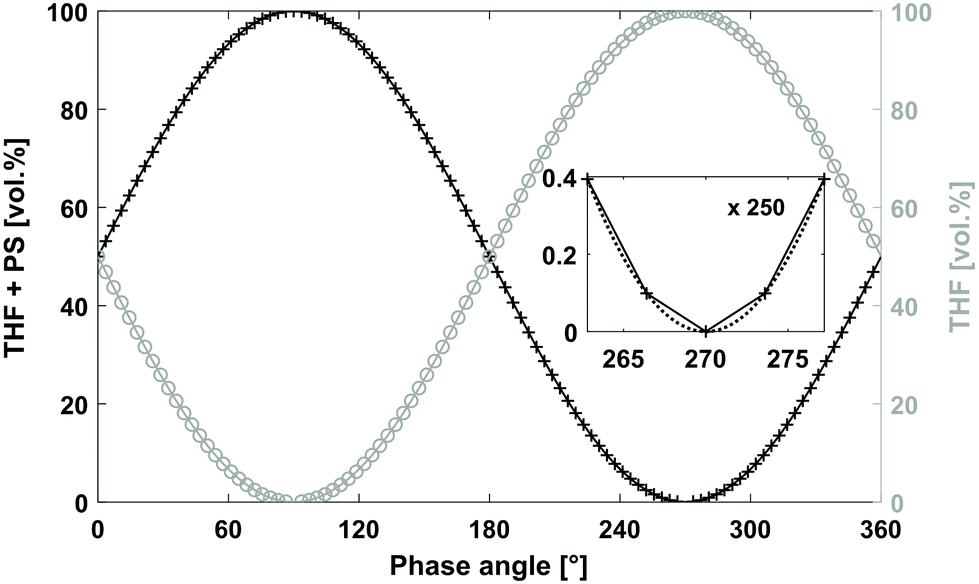 | ||
| Fig. 3 Relative volume content profiles used for sinusoidal “injection”. The relative volume content profiles were split in 100 equidistant time steps, i.e. 3.6° phase angle increment per time step. The black “+” mark the programmed relative volume content per time step for the solvent reservoir containing THF + PS and the grey “○” for the solvent reservoir containing THF. Between consecutive time steps, the quaternary pump changes the relative volume content with a constant rate according to the programmed relative volume contents to approximate a sinusoid. The inset shows the deviation from the obtained solvent ratio profile of THF + PS (straight line) from an ideal sinusoid (dotted line). The time required for a complete phase cycle of 360° is the period (T). Similar to the relative volume content profile of THF + PS, a PS concentration profile is obtained, which serves as excitation signal for FT-SEC. The sum of both relative volume content profiles has a constant volume flux. | ||
Chromatographic and Fourier-related considerations
The driving forces for separation in HPLC can be mainly enthalpic or entropic. In ideal SEC the separation is based on entropic forces as a partial steric exclusion mechanism is dominant.7 The extent of the partial steric exclusion is described by the distribution coefficient, Kd,SEC (−), given by7 | (1) |
The distribution coefficient affects the respective retention volume, VR (mL), according to28
| VR = Vdead + Vi + Vp·Kd,SEC, | (2) |
As the flow rate, ![[v with combining dot above]](https://www.rsc.org/images/entities/i_char_0076_0307.gif) (mL min−1), is predefined, the average retention time, tR (min), can be derived from the retention volume, VR (mL), by7
(mL min−1), is predefined, the average retention time, tR (min), can be derived from the retention volume, VR (mL), by7
 | (3) |
For consistency throughout this work, the time unit of seconds is used instead of minutes, although the latter is more common in HPLC. With this choice, the time domain data units are consistent with the frequency domain unit of 1/s (Hz), as it is the most commonly used unit.
In FT-SEC, the time-shifted elution of the sinusoidal chromatograms results in a phase angle shift, Δφ (°), of
 | (4) |
Accordingly, a reference chromatogram is always required, to which the phase angle shift of the response chromatogram is determined. The reference chromatogram can be (1) the sinusoidal excitation signal recorded before the column, (2) the sinusoidal excitation signal measured without a column, or (3) the response signal of a reference analyte measured after the column. While option (1) records the reference and response chromatogram simultaneously, option (2) and (3) record the reference chromatogram with a separate measurement. Accordingly, option (1) requires the use of a second detector, whereas for option (2) and (3) only one detector is sufficient. In option (1), the reference chromatogram and the response chromatogram originate from the same sinusoidal analyte concentration profile. Therefore, alterations of the sinusoidal analyte concentration profile due to flow instabilities, gradient mixing inaccuracies, and pressure fluctuations originating from pump pulsation affect the reference and response chromatogram similarly. Thus, with option (1), compared to option (2) and (3), the phase angle shift should be determinable more precisely. Consequently, option (1) is used in this work.
The phase angles of the sinusoidal chromatograms were determined using a discrete Fourier transformation (DFT) algorithm of MATLAB which can process an arbitrary number of time data points using29
 | (5) |
The complex spectral component equals the excitation frequency of the sinusoidal analyte concentration profile, ν0 (Hz), is evaluated. The phase angle, φ (rad), and the magnitude, M (−), were determined according to eqn (6) and (7)![[thin space (1/6-em)]](https://www.rsc.org/images/entities/char_2009.gif) 30 and the corresponding phase angle shift, Δφ (rad), using eqn (8)
30 and the corresponding phase angle shift, Δφ (rad), using eqn (8)
 | (6) |
 | (7) |
| Δφ(ν0) = φVWD-1(ν0) − φVWD-2(ν0), | (8) |
In the following paragraphs, some remarks on the experimental implementation of the FT-SEC method are listed. (1) Similar to conventional SEC, analytes are only separable as long as their hydrodynamic volume is covered by the separation range of the column. (2) It has to be ensured that all analytes have different retention times and that the period, T, is longer than the retention time difference between the first and the last eluting analyte species.12 Otherwise, it would be possible that two different analytes could have the same phase angle shift and would, therefore, not be differentiable. (3) For quantitative FT-SEC measurements, it is recommended to analyze concentrations below the upper limit of linear detector response. If the concentration of the upper limit of linear detector response is exceeded, with increasing analyte concentration the response factor of the detector decreases until it remains constant.7 Therefore, the signal increase per unit mass is decreasing making precise quantitative measurements more challenging. In an FT-SEC measurement of a sample, concentrated higher than the upper limit of linear detector response, an attenuated sinusoidal chromatogram would be obtained where the maxima are attenuated while the minima have the full deflection. However, the phase angle of such a chromatogram will not be affected as the attenuation of the sinusoid does not affect the elution time.
Besides these chromatographic considerations, the data processing of the sinusoidal chromatograms was treated with special care. As the S/N determined in Fourier space will be used to evaluate the sensitivity of the method, it is desirable to reduce the noise level as much as possible to obtain the best S/N. Ideally, only random noise is contained in the noise region. However, two causes have been identified which lead to additional frequency components in the noise region of the Fourier transformed data, which should be avoided. Firstly, flat chromatogram sections which correspond to the delay time sections of the sinusoidal chromatogram in Fig. 1(B), should be cut off because the DFT requires an infinite amount of spectral components for the reconstruction of flat baseline parts.26 Secondly, the time domain data which is to be Fourier transformed should be perfectly periodic as shown in Fig. 4. This is because the DFT algorithm assumes the data are a fraction of a periodic signal extending from − to + infinity, thus, it repeats over the time domain data. Due to this procedure non-periodical data would lead to a step function in the time domain prior to Fourier transformation. Step functions in the time domain result in additional sin(ω·t0)/ω terms in the frequency domain (i.e. sinc artifacts).26 With respect to the chromatographic implementation this implies that a dynamic steady state inside the column should first be reached so that e.g. the first periods might be omitted prior to FT analysis.
 | ||
| Fig. 4 Normalized raw data of a 0.25 g L−1 PS-100 kg mol−1 sample (see Table 1) for illustrating the data processing. The FT-SEC measurement was performed with a period of 900 s and 10 oscillations at a flow rate of 1 mL min−1 (= 1/60 mL s−1). In (A) the reference chromatogram, recorded with VWD-1, and in (B) the response chromatogram, recorded with VWD-2, is shown. The middle sinusoidal chromatogram sections (black sections) were cut at the vertical dashed lines followed by Fourier transformation. In Fig. 5 the Fourier spectra of both cut sections are shown. | ||
The spectral resolution, Δν (Hz), in Fourier space is the multiplicative inverse of the acquisition time, taq (s), of the time domain data with26
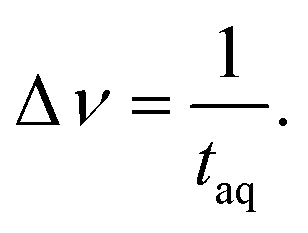 | (9) |
To resolve the excitation frequency, ν0, the spectral resolution must be less than or equal to half of the excitation frequency. Therefore, the acquisition time of the time domain data which is to be Fourier transformed has to be at least double the duration of the period, T (s), i.e.
 | (10) |
Furthermore, the sampling rate of the ADC limits the maximum detectable frequency referred to as the Nyquist frequency.26 The Nyquist frequency, νNyq (Hz), is the frequency equal to half the data sampling rate, sr (Hz), or the multiplicative inverse of twice the dwell time, tdw (s). Consequently, to detect the excitation frequency, ν0, it must be less than the Nyquist frequency, as shown in eqn (11)26
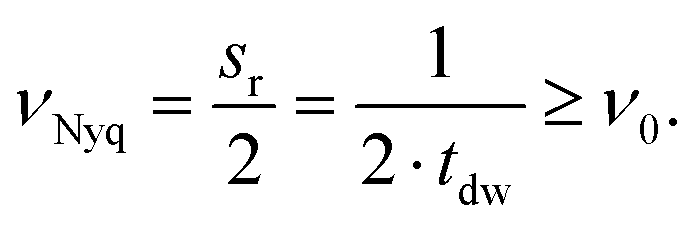 | (11) |
Materials and methods
Chemicals
The polystyrene (PS) calibration standards used for calibration were received from PSS (Polymer Standards Service GmbH, Mainz, Germany) with the specifications summarized in Table 1. For conventional SEC and FT-SEC measurements, PS stock solutions were prepared using tetrahydrofuran (THF, Fisher Scientific GmbH, Schwerte, Germany) stabilized with 0.025% butylated hydroxytoluene (BHT) as mobile phase.| Name | M p [kg mol−1] | M n [kg mol−1] | M w [kg mol−1] | Đ [−] |
|---|---|---|---|---|
| PS-851 | 851 | 764 | 827 | 1.08 |
| PS-526 | 526 | 502 | 524 | 1.04 |
| PS-100 | 100 | 92.0 | 96.0 | 1.04 |
| PS-17.6 | 17.6 | 17.3 | 16.9 | 1.03 |
| PS-4.70 | 4.70 | 4.60 | 4.73 | 1.03 |
| PS-0.682 | 0.682 | 0.707 | 0.641 | 1.10 |
Instrumentation
The measurements were performed on an analytical linear M styrene–divinylbenzene (SDV) column (dimensions: 300 × 8 mm i.d., particle size: 5 μm) from PSS with a separation range of 0.100–1000 kg mol−1.The column was thermally isolated inside a temperature-regulated column compartment (TCC 6500, PSS, Mainz, Germany) at 26.5 °C. A SECcurity2 quaternary pump (PSS, Mainz, Germany) with an integrated in-line degasser was used. All the measurements described were executed at a volumetric flow rate of 1 mL min−1. The VWDs used were SECcurity (VWD-1) and SECcurity2 (VWD-2) from PSS (Mainz, Germany). The UV wavelength of both detectors was set to λ = 260 nm except for the measurements for the sensitivity comparison, here λ = 236 nm was used. The reason for its use is explained in the respective section. To retain the possibility of performing conventional injections, a Rheodyne® manual injection valve 7725i with a V = 100 μL injection loop was placed between VWD-1 and column (see Fig. 2). The universal data center 810 (UDC) from PSS (Mainz, Germany) was equipped with a 24 kbit analog-to-digital converter (ADC) which digitized the detector signals using a sampling rate of 1 Hz. Instrumentation control and data collection were achieved using the WinGPC software (version 8.32, Build 8844, PSS, Mainz, Germany).
FT-SEC data processing
For data processing, MATLAB (version 2021a) was used. As already discussed, for maximum S/N, a periodic section of the sinusoidal chromatogram was cut as shown in Fig. 4 and used for Fourier transformation. The cut was executed based on the following criteria: (1) to retain information about the phase angle shift, the chromatograms from VWD-1 and VWD-2 of the same measurement were cut at the same data points; (2) the sinusoidal chromatogram sections were cut so that the sinusoid beginning and end matched, ensuring a periodic signal; and (3) due to the transition to the baseline and the system equilibration time the first cycle of the response chromatogram, see Fig. 4(B), was discarded.Results and discussion
Definition of S/N in Fourier space
For the evaluation of an FT-SEC measurement, the frequency component in the Fourier spectrum equals the excitation frequency, i.e. the frequency of the sinusoidal PS concentration profile, was used. An expression for sensitivity is the S/N, which for the FT-SEC method is defined as the magnitude of the excitation frequency component, M(ν0) (−), divided by the standard deviation of a region without information. The S/N definition is exemplified in Fig. 5 using the Fourier spectra of the sinusoidal chromatogram sections shown in Fig. 4. | ||
| Fig. 5 Normalized magnitude spectra of the sinusoidal chromatogram sections highlighted in black in Fig. 4. The S/N in Fourier space was calculated as the magnitude of the excitation frequency, M(ν0), divided by the standard deviation of the last 20% of the spectrum. In the inset, higher harmonics are visible for the reference (VWD-1) and response signal (VWD-2) spectra. Possible origins for these are discussed in the text. | ||
For the calculation of the noise, the standard deviation of the range 0.4–0.5 Hz was used, i.e. the last 20% of the spectrum. Although the noise region was arbitrarily chosen, it was found that this region was for all measurements mostly stable and without obvious signals making it a suitable choice, to allow for further optimization. Comparing the noise levels of both spectra reveals that VWD-1 has a S/N ≈ 10−6 and VWD-2 a S/N ≈ 10−5, which might be attributed to another signal amplification factor of the detectors.
In the enlarged window of Fig. 5, besides the excitation frequency (ν0), higher harmonics at 2·ν0, 3·ν0, 4·ν0, etc. are visible in both spectra. The magnitudes of the higher harmonics were for the c = 0.25 g L−1 measurement below 1% and decrease, as expected, towards higher frequencies. The higher harmonics were found to result from light absorptive dissolved air components in the mobile phase due to irregularly degassing31 and could be reduced by a factor of 35 by applying triple degassing instead of single degassing. The in-line degasser has a separate degassing line for each solvent reservoir. Due to the sinusoidal variation of the relative volume contents of two solvent reservoirs, shown in Fig. 3, the linear velocities within each degasser line change sinusoidally and consequently also the residence time of a volume fraction inside the degasser line. As the degasser always removes a certain amount of gas per unit time, the different residence times in the degasser result in changing residual gas contents, provided that the gas contents of the two solvent reservoirs are high enough not to be completely removed at the shortest residence time. Assuming an ideal case where (1) the amount of gas removed per unit time, referred to as degasser efficiency hereinafter, is independent of the linear velocity within the degasser line; (2) the degasser efficiency is the same for both degasser lines; (3) the gas concentration inside the solvent reservoirs are the same; and (4) the gas concentration after degassing is high enough that the absorption is above the detection limits of the UV/VIS detectors. In such an ideal case, after degassing, each degasser line will have a detector signal similar to the relative volume content profiles shown in Fig. 3. However, it is more likely (1) that the degasser efficiency changes as a function of the gas concentration which is dependent on the linear velocity (i.e. residence time inside the degasser), (2) that the degasser efficiency is different between the degasser lines as the distance to the vacuum pump and the porosity of the membrane could differ, (3) that the solvent reservoirs have different concentrations of dissolved gas, and, especially for low linear velocities, (4) that the gas concentration falls below the detection limits of the UV/VIS detector. Consequently, each degasser line will have a unique modified sinusoidal concentration profile of residual gas. Because of the consecutive mixing of both degasser lines, both modified sinusoidal concentration profiles will superpose, resulting in a concentration profile of dissolved gas with an unpredictable distorted sinusoidal pattern. However, as the absorbance originating from the residual gas is low compared to the absorbance obtained from the PS concentration profile of a c = 0.25 g L−1 PS stock solution, in Fig. 4 no distortions are apparent. However, when reducing the PS concentration lower than c = 0.05 g L−1, alterations of the sinusoidal chromatograms become visible.
Additional sources that contribute to the higher harmonics can be (1) pressure variations due to pump pulsation, and (2) deviations of the PS concentration profile from an ideal sinusoid because the excitation signal obtained from Fig. 3 is only an approximation of a sinusoid, but also because of additional instrumental inaccuracies such as inaccurate switching valve system or inhomogeneous mixing within the mixing chamber.
Molecular weight calibration
In conventional SEC, a calibration relation is generated by correlating the molecular weight at peak maximum with the corresponding retention time or retention volume and fitting with a polynomial function.32 An analog calibration for FT-SEC would be the correlation of the molecular weight with the corresponding phase angle shift between the reference and response chromatogram. The polymer standards used for calibration, however, are not truly monodisperse but narrow disperse, i.e. a composition of molecules with slightly different molecular weights. Reilley et al.2 predicted that a mixture of different analytes analyzed via sinusoidal “injection” will form a superposition of the components with the same frequency if a detector is used that can generate only a single intensity as a function of time and no time-dependent spectrum for further decomposition. According to the superposition principle, the magnitude, M (−), and phase angle, φ (rad), of the mixture (Mix) are the sum of the magnitudes and phase angles of the individual sinusoids “j”, weighted by the interference and the intensity,30i.e.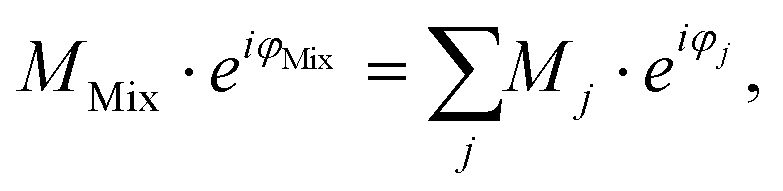 | (12) |
The intensity of the VWD signal is proportional to the number of monomers in the flow cell. On a per unit mole basis, the higher the molecular weight of a polymer, the higher the detector signal. Accordingly, the higher the molecular weight the more the polymer fraction is weighted in the superposition. As each polymer fraction is weighted by the molecular weight, it is assumed that the molecular weight corresponding to ΔφMix is the weight average molecular weight (Mw). However, the superposition and consequently φMix is not only affected by the molecular weight of each fraction but also by the interference of these, i.e. the phase angle difference between the polymer fractions. Therefore, deviations from the weight average molecular weight are expected, where the deviation depends on the molecular weight dispersity index (Đ) of a polymer sample.
Because the molecular weight of the polymer sample analyzed via FT-SEC should corresponds most closely to the Mw, the calibration for FT-SEC is established using the Mw of the different PS standards, given in Table 1, to get the highest accuracy possible in molecular weight analysis. To better compare the calibrations of conventional SEC with FT-SEC, the calibration for conventional SEC is also established using the Mw. For establishing the calibrations for both methods, c = 0.25 g L−1 stock solutions of the PS standards summarized in Table 1 were used. The concentration was chosen as a compromise of three criteria: (1) the concentration had to be within the upper limit of linear detector response; (2) a high-intensity PS signal was desired to minimize the fraction of light absorptive residual gas components, noise effects, detector drift, and baseline instabilities; and (3) to keep column overloading effects low. See section “Sensitivity comparison at column overloading limit” for further discussion of the column overloading limits. For an FT-SEC measurement the period of the sinusoidal PS concentration profile was T = 900 s and was repeated 10 times. The period was chosen to cover the retention time of the last eluting PS-0.682 kg mol−1 standard to avoid elution outside the first 360° cycle. The chromatograms of the FT-SEC measurement of PS-100 kg mol−1 used for calibration are shown in Fig. 4 and the respective Fourier spectra in Fig. 5. The calibrations for conventional SEC (via retention time) and FT-SEC (via phase angle shift) are shown in Fig. 6.
 | ||
| Fig. 6 Comparison of a conventional (using retention time, tR) and FT-SEC calibration (using phase angle shift, Δφ). Since the chromatographic dead volume is larger for FT-SEC (see text), the FT-SEC calibration is shifted to longer elution times by 4.2°, which corresponds to 10.5 s or 0.18 mL. For direct comparison of the calibrations, the delay time was subtracted for the FT-SEC calibration and fitted, where x = Δφ − 4.2°. The FT-SEC calibration has a slightly different shape compared to the conventional SEC calibration. Possible reasons for these observations are discussed in the text. | ||
For fitting the data, third-order polynomials were used. Both calibrations resemble a similar shape, with the FT-SEC calibration shifted to longer elution times. For FT-SEC, a time-delayed elution was expected as the retention time is measured relative to the reference chromatogram, recorded with VWD-1, and not, like in conventional SEC, relative to the injection valve. The elution time delay between the calibrations of FT-SEC and conventional SEC corresponds to a phase angle shift of 4.2°, which is according to eqn (4) and (3), for a period of T = 900 s, equivalent to 10.5 s or 0.18 mL additional volume. This volume corresponds to the additional chromatographic dead volume, i.e. the volume of VWD-1 after detection, as well as the tubing volume from VWD-1 to the injection valve. For a better comparison of both calibrations, the FT-SEC calibration was shifted by 4.2° to shorter elution times which is also shown in Fig. 6. Only small deviations in the shape of the calibration curves are observable. These deviations are at first surprising as the time which the analyte requires to pass the column should be the same for both methods. Therefore, the third-order polynomials should be shifted in the elution time or phase angle shift axis due to different chromatographic dead volumes, however, the shape should be similar. It is assumed that several factors contribute to this observation. One reason for this is probably a modification of the phase angle shift of the analyte by the light adsorptive residual gas components which remain in the mobile phase after degassing (discussed in section “Definition of S/N in Fourier space”). In conventional SEC, dissolved gas components elute typically at the total permeation limit and result into system peaks at the end of the chromatogram.33 Therefore, in FT-SEC the dissolved gas will have also a specific phase angle shift and will also modify the phase angle shift of the analyzed PS.
Another possible cause is analyte-specific asymmetric band broadening effects in the chromatographic system between VWD-1 and VWD-2 which modifies the sinusoid and, as a result, also the respective phase angle shift. The asymmetric band broadening effects cause skewed normal distributed (Gaussian) peak shapes which in conventional SEC is visible as e.g. tailing of the peak. Tailing affects the peak symmetry, but normally not the localization of the peak maximum in conventional SEC.34 Therefore, as the retention time in conventional SEC is determined at the peak maximum, the retention time is not affected by the asymmetric band broadening effects. However, in FT-SEC, if the sinusoidal excitation signal is convoluted with a similar skewed normal distributed function, a sinusoidal chromatogram with a modified phase angle will be obtained. The asymmetric band broadening effects should be a function of the flow rate, the analyte properties (i.e. molecular weight, chemistry, dispersity index, and concentration), the period, and the solvent used. However, the slight deviation of the fit functions is not yet fully understood, thus, a more in-depth investigation is needed.
FT-SEC analysis of analyte mixtures
The FT-SEC analysis with a detector that only displays a single intensity as a function of time of an analyte mixture will result in a superposed sinusoid of a single frequency, which is equal to the excitation frequency of the sinusoidal analyte concentration profile. A superposition of two analytes, “1” and “2”, is predictable according to eqn (13) and (14):30 | (13) |
 | (14) |
However, ΔφMix and MMix are only predictable if the phase angle shifts and the magnitude ratios between the mixture components remain the same during the measurement. If the asymmetric band broadening effects, discussed in the section above, change for example due to a changed analyte concentration or the presence of an additional analyte, the phase angle shifts of mixture components will change, thus, a precise prediction of ΔφMix and MMix will not be possible. To illustrate the effect of the superposition and to investigate if the asymmetric band broadening effects change, mixtures consisting of two PS calibration standards with equal concentrations were prepared.
For the preparation of the mixtures, c = 0.25 g L−1 PS stock solutions were mixed 50:50 (vol/vol%). Two mixtures were prepared, (1) Mix-1 with the highest possible relative phase angle shift difference between the PS standards and (2) Mix-2 with the lowest possible relative phase angle shift difference. Consequently, Mix-1 consisted of PS-851 kg mol−1 and PS-0.682 kg mol−1 and Mix-2 of PS-851 kg mol−1 and PS-526 kg mol−1, each with a concentration of c = 0.125 g L−1. The experimental phase angle shifts and the magnitudes of the pure c = 0.25 g L−1 PS stock solutions are listed in Table 2. For calculation of the phase angle shifts and magnitudes of the respective mixtures, the magnitudes of the PS standards in Table 2 need to be divided by two to obtain the magnitudes corresponding to a concentration of c = 0.125 g L−1. The calculated and experimentally determined values of both mixtures are also listed in Table 2. In Fig. 7, the chromatograms of the pure c = 0.25 g L−1 PS-851 kg mol−1 and PS-0.682 kg mol−1 stock solutions as well as Mix-1 are shown.
 | ||
| Fig. 7 Chromatograms of pure PS calibration standards and the respective mixture (Mix-1, see Table 2). The chromatograms are normalized to the PS-851 kg mol−1 measurement. The chromatogram of the mixture represents a superposition of the two pure PS calibration standards. | ||
:50 (vol/vol%) mixtures (Mixexp), normalized to PS-851 kg mol−1. Furthermore, the Δφ and the normalized magnitudes of the mixtures were theoretically predicted (Mixtheo) using eqn (13) and (14). Mix-1 is composed of PS-851 kg mol−1 and PS-0.682 kg mol−1 and Mix-2 of PS-851 kg mol−1 and PS-526 kg mol−1
| Sample | Δφ [°] | Rel. magnitude [−] |
|---|---|---|
| a The magnitude is lower because the UV inactive alkane end group reflects approx. 8% weight percentage of the standard. | ||
| PS-851 kg mol−1 | 154.1 | 1.000 |
| PS-526 kg mol−1 | 160.2 | 0.9636 |
| PS-0.682 kg mol−1 | 248.6 | 0.9374a |
| Mix-1theo | 199.3 | 0.6576 |
| Mix-1exp | 199.9 | 0.6599 |
| Mix-2theo | 157.1 | 0.9804 |
| Mix-2exp | 157.1 | 0.9669 |
Fig. 7 shows, that the chromatogram of Mix-1 is a weighted superposition of the single chromatograms of PS-851 kg mol−1 and PS-0.682 kg mol−1. This result is confirmed by comparing the predicted phase angle shifts and magnitudes of the mixtures with the experimental data in Table 2. The maximum deviation between predicted and experimentally determined phase angle shifts was found for Mix-1 with 199.3°–199.9° = 0.6°, which is according to eqn (4) equivalent to a time shift of Δt = 1.5 s. Furthermore, the maximum deviation of the predicted to the experimentally determined magnitude was determined for Mix-2 to be 0.9804–0.9669 = 0.0135 which is a deviation of 1.4% from the predicted magnitude. Therefore, the experimental phase angle shifts and magnitudes fit the predicted values very well.
UV/VIS detectors like the VWDs used in this work but also the differential refractive index detector only display a single signal as a function of time, thus, a differentiation between the analytes is not possible. For such a superposed sinusoidal detector signal, the magnitude of the chromatogram of the mixture is attenuated, and consequently, the S/N in Fourier space is reduced. One can imagine a mixture where two analytes with equal magnitude having a relative phase angle shift to each other of 180° under the experimental conditions. In such a case, the magnitude will completely disappear and a flat baseline at a constant value would be obtained, like a destructive interference of waves. To overcome this phenomenon, e.g. a longer excitation period, T, would be needed. The Fourier transformation of a constant baseline would only display a zero-frequency peak, which reflects the mean absorbance of the chromatogram. Although no information can be obtained from the midsections of such a chromatogram, the first maximum of the first eluting analyte and the last minimum of the later eluting analyte would not be affected and could give hints on the mixture composition in such a case.
For chemically different analytes, the mixture components would be separate measurable by using detectors with an increased chemically selectivity, like NMR or IR spectrometer. These detectors provide via a further spectroscopic dimension the resolution which would allow the concentration and phase angle shifts of analytes to be determined independently.3,35 However, a mixture with two or more chemically identical components will also not be decomposable by using an NMR or IR spectrometer. To potentially decompose a superposition of N chemically identical monodisperse components with different elution times, 2·N action points, i.e. different superpositions, should be measured.2 Action points could be (a) the number of frequencies in a multi-frequent excitation signal, (b) additional detectors during the separation which can be realized by a series of alternating columns and detectors, or (c) the repeated measurement of the same sample under different elution-time-affecting conditions (i.e. different flow rates, column lengths or packing materials, etc.). The mixture should then be resolvable by a linear combination of the action points.2 While this method should be capable to resolve mixtures of identical monodisperse components, this will not be the case for mixtures of molecular weight disperse polymer samples. The phase angle under the specific experimental conditions of a polymer sample also depends on its molecular weight dispersity (see section “Molecular weight calibration”). Therefore, to resolve a mixture of different polymer samples, the respective phase angle shifts need to be determined beforehand.
If information about the molecular weight dispersity of a polymer sample is desired, three options are conceivable. The first option would require the measurement of 2·N action points, where N is the number of individual molecular weights species. The second and third option are based on the evaluation of the magnitude of VWD-2 relative to a reference magnitude. Potential reference magnitudes for such comparisons could be either the magnitude of VWD-1 of the same measurement or the magnitude of VWD-2 of a repeated measurement with the same sample but a different period. The magnitude of a superposition depends on the concentrations of the components and their phase angle difference to each other, as described in eqn (14). As each molecular weight fraction within a polymer sample has a specific phase angle shift, the broader the molecular weight distribution, the broader the phase angle distribution, and, thus, the stronger is the attenuation of the magnitude of the superposed sinusoid. While option (1) is hard to realize as this would require a vast amount of measured action points option (2) and (3) are practically more feasible.
Liquid chromatographic methods are used for the characterization of analyte mixtures. By separating the analytes, it is possible to distinguish between them. In conventional SEC, to evaluate the analyte-specific information, baseline separated peaks are desired. Accordingly, the retention time differences of the analytes must be large enough so that the peaks do not overlap. In FT-SEC, there is no separation in the sense of distinguishable analyte bands as the analytes are mixed before as well as behind the column. Therefore, the requirement of baseline separated peaks does not exist in FT-SEC. The characterization of analyte mixtures with FT-SEC is possible as long as the retention time differences of the components are larger than the instrumental and methodological uncertainty. Those parameters have not been determined yet, however, it is assumed that the required minimum retention time difference is lower for the FT-SEC. This preliminary assessment is based on the comparison of the accuracy of the mixtures’ phase angle shift prediction (see Table 2) with the peak width (full width) of a conventional SEC chromatogram. While the phase angle shift could be predicted to be within an accuracy of 0.6° (= 1.5 s), the full width of a peak is on the order of one minute, which according to eqn (4) corresponds to about 24°. Accordingly, analyte mixtures with components that have small retention time differences, so that they can no longer be correctly evaluated with conventional SEC, could possibly still be evaluated with FT-SEC. Furthermore, in FT-SEC the measurement time could potentially be reduced by increasing the flow rate or by shortening the column length which would decrease the retention times. This is related to a higher duty cycle of the column used (see Fig. 1).
Effect of the applied period, T, on S/N
Different FT-SEC measurements with periods, T, of T = 60, 300, 600, 900, 1300, and 3600 s were performed in duplicate, each with 12 oscillations at a flow rate of 1 mL min−1. For each measurement series, a c = 0.1 g L−1 PS-100 kg mol−1 stock solution was prepared. From each chromatogram recorded by VWD-2, a section of 10 oscillations was cut from the mid-range and used for Fourier transformation. Accordingly, the acquisition time of the cut sections ranged from 600 to 36000 s. The S/N were normalized twice; (1) to the square root of the acquisition time ( ,
,  ) of the cut sections; and subsequently (2) to the highest (S/N)/
  within one measurement series. Both data sets were averaged and the Range (1/
  ) was determined for each period according to
| Range = xmax − xmin, | (15) |
 of the two data points per measured period, respectively.
The results are shown in Fig. 8. In Fig. 8 the normalized (S/N)/  increases towards longer periods and reaches a plateau. Theoretically the (S/N)/
  should be independent of the period as the S/N scales proportionally to
  .26 Thus, when normalizing the S/N to
  , the (S/N)/
  should be constant. The decrease in (S/N)/
  toward shorter periods can be explained by the decreasing magnitudes of the sinusoids towards shorter periods (data not shown) as the magnitudes are equal in time and frequency domain. The decrease of the magnitudes towards shorter periods is assumed to be caused by superposition of the different molecular weight fraction of the polymer sample and due to mixing of adjacent volume units inside dead volumes of the chromatographic system (e.g. volume in the mixing chamber, the pump, the tubing and flow cells) which will be summarized under the term band broadening effects.34 Due to the band broadening effects, adjacent volume units are mixed, which broadens the sinusoidal analyte concentration profile and leads to reduced or increased analyte concentration at the maxima and minima, respectively. Consequently, the magnitude of the fluctuation of the broadened sinusoidal analyte concertation profile is reduced. The shorter the period, the higher the analyte concentration difference per unit volume. Assuming the broadening affects the same volume range, the shorter periods the more the sinusoidal analyte concentration profile is broadened and, thus, the more the magnitude is reduced. However, with increasing period, less of the sinusoidal analyte concentration profile is affected and similarly also the magnitude. If the period is long enough so that the extremums of the sinusoidal analyte concentration profile is no longer affected by the band broadening effects, the magnitude remains constant regardless of the period.
 | ||
Fig. 8 Effect of the period, T (s), on the S/N normalized to the square root of the acquisition time ( , ,  ). Two measurement series were executed each with a fresh prepared PS stock solution. The (S/N)/ ). Two measurement series were executed each with a fresh prepared PS stock solution. The (S/N)/  increases with longer periods towards a plateau. A fit function was derived as described in the text, where y is the (S/N)/ increases with longer periods towards a plateau. A fit function was derived as described in the text, where y is the (S/N)/  . The critical period, Tcrit, at which the (S/N)/ . The critical period, Tcrit, at which the (S/N)/  is significantly reduced from the plateau, was determined by subtracting three times the standard deviation of the Range/2 (σ(Range/2)) from the asymptote. The reduction in (S/N)/ is significantly reduced from the plateau, was determined by subtracting three times the standard deviation of the Range/2 (σ(Range/2)) from the asymptote. The reduction in (S/N)/  towards shorter periods is assumed to be caused by broadening of the sinusoidal excitation signal due to band broadening effects. towards shorter periods is assumed to be caused by broadening of the sinusoidal excitation signal due to band broadening effects. | ||
Based on this assumption, a semi-empirical fit function is suggested. The broadening affected volume can be visualized as a volume (box) within the chromatographic system where homogenous mixing occurs. The broadening of the sinusoidal analyte concentration profile can then be described as the convolution of the sinusoidal analyte concentration profile with this box, assumed as a rectangular signal as a function of time for volume flux. According to the convolution theorem,26 a convolution of two functions in the time domain is equal to a multiplication of the Fourier transformed functions. This way, a potential fit eqn (16) is derived:
 | (16) |
 .
.
As visible in Fig. 8, the proposed fit function describes the data sufficiently well as reflected by the R-value = 0.9935. From this fit, the maximum (S/N)/  (i.e. the asymptote) of 0.97/
  was derived under usage of L'Hôpital's rule.36 Consecutively, it was determined at which period the (S/N)/
  is significantly decreased from 0.97/
  . For calculation, three times the standard deviation of the Range/2 was subtracted from 0.97/
  resulting in 0.94/
  . For this purpose, a David test37 was carried out beforehand to confirm that the Range/2 shows no deviation from a Gaussian distribution, i.e. to show that the scattering of the data is independent of the period. In Fig. 8 this threshold value of 0.94/
  is indicated with a horizontal dashed line, which cuts the asymptotic fit at the critical period, Tcrit ≈ 300 s. Therefore, a sufficiently long period should be selected for FT-SEC to make the effect of chromatographic broadening of the sinusoidal concentration profile negligible.
Sensitivity comparison at column overloading limit
To compare the sensitivity of FT-SEC with that of conventional SEC, the column overloading limit was determined for both methods. In conventional SEC, with increasing analyzed concentration at constant injection loop volume, the peak will broaden, eventually with the formation of peak shape distortions, and the retention time will increase due to column overloading effects.32 Therefore, the increase in dispersity index (Đ) or the decrease in molecular weight with increasing injected concentration can be evaluated to determine the column overloading limit. In the current implementation of FT-SEC, the molecular weight can be determined indirectly by means of the phase angle shift calibration. The column overloading limit was defined as the concentration at which the molecular weight is more than 10% lower than the molecular weight analyzed at low concentration. In preliminary experiments, the upper limit of the linear detector response λ = 260 nm of c = 1.00 g L−1 for both VWDs at was found to be exceeded in subsequent experiments. Therefore, the measured wavelength was changed to λ = 236 nm where PS has a lower extinction coefficient. The upper limit of linear detector response at λ = 236 nm was 3.60 g L−1. For the following experiments, an in-house synthesized PS standard with a weight average molecular weight (Mw) of 75.5 kg mol−1 (PS-75.5 kg mol−1) and a low dispersity index (Đ = 1.02) was used. Concentrations of (1) 0.25 g L−1, (2) 1.00 g L−1, (3) 1.75 g L−1, (4) 2.50 g L−1, (5) 3.00 g L−1, (6) 3.40 g L−1, and (7) 3.60 g L−1 were analyzed via both methods, and (8) 4.00 g L−1 was additionally analyzed for the conventional SEC method which was above the upper limit of linear detector response (ignoring dilution inside the chromatographic system) but this does not affect the location of the peak maximum. For conventional SEC, a 100 μL injection loop was used. For an FT-SEC measurement, the period was T = 900 s and repeated five times, of which three oscillations were used for evaluation. The flow rate was 1 mL min−1 for both methods. The respective Mw were determined using the calibrations established in section “Molecular weight calibration”. The results are shown in Fig. 9. Both data sets were fitted with an inverted exponential function shown in eqn (17): | (17) |
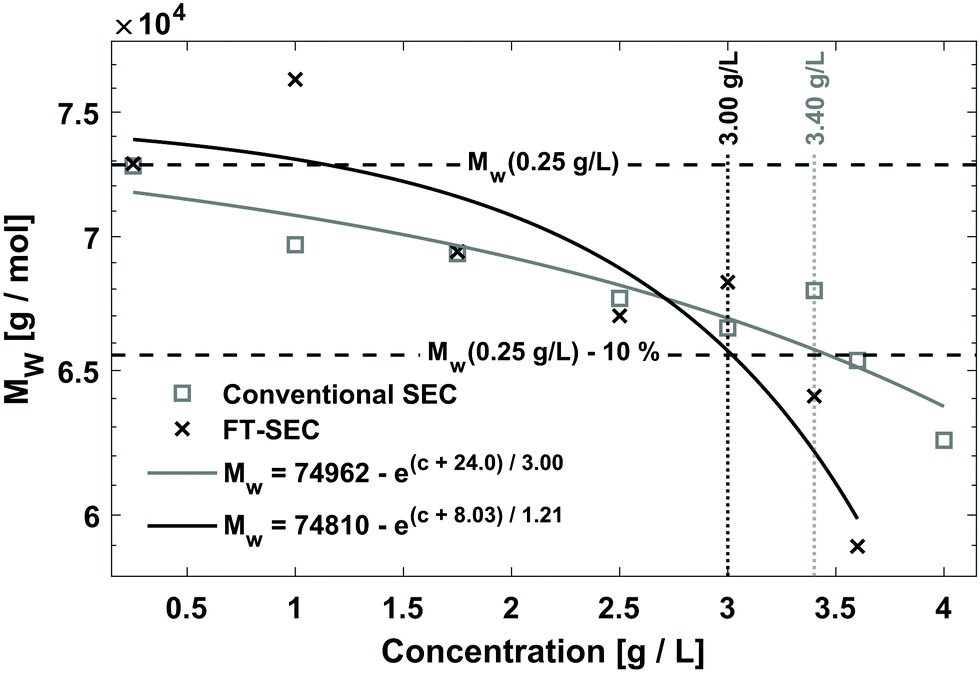 | ||
| Fig. 9 Determination of the column overloading limit by FT-SEC and conventional SEC method. The weight average molecular weights (Mw, g mol−1) as a function of the concentration (c, g L−1) are shown. For FT-SEC, a period of 900 s was used. For conventional SEC a 100 μL injection loop was used. A deviation of 10% relative to the Mw of the c = 0.25 g L−1 measurement was used as the threshold value. The column overloading limit for the FT-SEC is c = 3.00 g L−1 and for the conventional SEC c = 3.40 g L−1. It is assumed that the difference is due to the different dilution of the excitation signals. | ||
The determined Mw of the c = 0.25 g L−1 PS-75.5 kg mol−1 stock solution was used as a reference because it is assumed that only minor column overloading phenomena occur at this concentration and the percentage fraction of light absorption caused by residual dissolved gas components (discussed in previous sections) is small. The fit equations cut the threshold value of Mw(0.25 g L−1) − 10% for the FT-SEC at c = 3.00 g L−1 and for the conventional SEC at c = 3.40 g L−1. This shows that the conventional SEC method allows the analysis of slightly higher concentrated samples before column overloading.
For each measurement, the dilution factor, DF (−), at the signal maximum in VWD-2 were determined for both methods, i.e. for the maximum of the sinusoidal response chromatogram and for the maximum of the peak, using
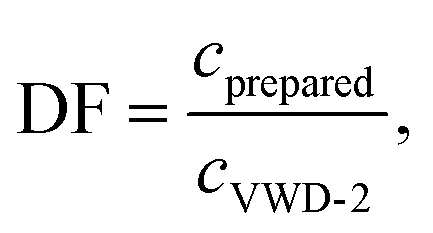 | (18) |
The dilution factor for the FT-SEC was on average 1, showing that at a period of 900 s the maximum of a sinusoid is only marginally diluted during a measurement. This confirms the hypothesis stated in the previous section that the dilution of a sinusoidal analyte concentration profile is marginal if a period of 300 s is exceeded. For the conventional SEC the dilution factor was on average 3, showing a significant dilution of the excitation signal during the measurement. However, the column overloading limits of c = 3.40 g L−1 for conventional SEC and of c = 3.00 g L−1 for FT-SEC differ by a factor less than 3. This discrepancy is probably because the maximum sample concentrations of the excitation signals directly after introduction into the chromatographic system are closer between both methods and consequently the extent of the column overloading phenomena.
Consecutively the S/N was determined for both methods for the measurements up to the column overloading limit. Accordingly, for FT-SEC, the S/N was determined for the 0.25 g L−1, 1.00 g L−1, 1.75 g L−1, 2.50 g L−1, and 3.00 g L−1 measurements, whereas for conventional SEC, the 3.40 g L−1 measurement was additionally evaluated. The S/N for conventional SEC was determined as the height of the analyte peak divided by the standard deviation of a peak-free region between 120 and 180 s. For both methods, the mass of analyzed PS, m(PS) (mg), was computed for conventional SEC using eqn (19) and for FT-SEC using eqn (20):
| m(PS)conv. = Vloop·c(PS); | (19) |
 | (20) |
![[small nu, Greek, dot above]](https://www.rsc.org/images/entities/i_char_e154.gif) the flow rate (mL min−1) and c(PS) the PS concentration (g L−1). The factor of 60 (s min−1) in the denominator of eqn (20) is for the conversion from minutes to seconds and the factor of 2 in the denominator of eqn (20) reflects that half of the flux is with the PS stock solution and half with the pure THF. The used acquisition time for a conventional SEC measurement was taq = 780 s and for a FT-SEC measurement, taq = 3·900 s = 2700 s. The m(PS) and the corresponding S/N were both normalized to the respective acquisition times by division by the square root of the acquisition time (
the flow rate (mL min−1) and c(PS) the PS concentration (g L−1). The factor of 60 (s min−1) in the denominator of eqn (20) is for the conversion from minutes to seconds and the factor of 2 in the denominator of eqn (20) reflects that half of the flux is with the PS stock solution and half with the pure THF. The used acquisition time for a conventional SEC measurement was taq = 780 s and for a FT-SEC measurement, taq = 3·900 s = 2700 s. The m(PS) and the corresponding S/N were both normalized to the respective acquisition times by division by the square root of the acquisition time ( ,
,  ). The results are presented in Fig. 10.
 | ||
Fig. 10 Sensitivity comparison of the FT-SEC with conventional SEC. Depicted are the S/N as a function of the mass of analyzed PS (m(PS)), both normalized to the square root of the acquisition time ( ). The data points correspond to the measurements of the concentrations below the column overloading limits shown in Fig. 9. In the fit functions, y is the S/N/ ). The data points correspond to the measurements of the concentrations below the column overloading limits shown in Fig. 9. In the fit functions, y is the S/N/  and x is m(PS)/ and x is m(PS)/  . At a concentration corresponding to the respective column overloading limit shown in Fig. 9, the FT-SEC method has an S/N higher by a factor of 50 compared to conventional SEC. . At a concentration corresponding to the respective column overloading limit shown in Fig. 9, the FT-SEC method has an S/N higher by a factor of 50 compared to conventional SEC. | ||
In Fig. 10, power-law fits of the type
| y = A·xB, | (21) |
 , x is the m(PS)/
  , and A is the responsiveness of the method. The variable B should be B = 1.0 in case of a linear relationship which was expected for both data sets because the concentrations were below the upper limit of linear detector response.
For FT-SEC, B = 0.969, which better approximates the linear correlation than that of conventional SEC with B = 0.843. The deviations from B = 1.000 are probably due to dilution errors, baseline fluctuations, and baseline drifts at low concentrations which leads to a scattering of the data points. Although the slight scattering, both data sets are well represented by the fit functions confirmed by the R-values of R-value = 0.9933 for conventional SEC and R-value = 0.9924 for FT-SEC.
To assess the sensitivity of a method the responsiveness as well as the reachable (S/N)/  must be considered. The responsiveness for conventional SEC of A = 1350 is similar to the responsiveness for FT-SEC with A = 1345. Although the responsiveness for both methods are similar the (S/N)/
  are throughout higher for FT-SEC. For comparison of the reachable (S/N)/
  the measurements just below column overloading are used. Accordingly, for the c = 3.00 g L−1 FT-SEC measurement (S/N)/
  = 1766/
  and for the c = 3.40 g L−1 conventional SEC measurement (S/N)/
  = 33/
= 33/  , which is roughly a factor 50 lower. The higher (S/N)/
  for the FT-SEC is because of the continuous analyte introduction into the system leading to a higher duty cycle of the column compared to conventional SEC where the sample is injected as a narrow analyte band into the system. Consequently, for the same analyzed concentration a substantially greater amount of m(PS)/
  is analyzed. As the signal intensity increases linearly with m(PS)/
  , as shown in Fig. 10, a higher (S/N)/
  is gained.
Due to the linear increase of (S/N)/  with m(PS)/
  , one could imagine that the (S/N)/
  for conventional SEC can be increased by a factor of five by using a 500 μL instead of a 100 μL injection loop. However, increasing the injection loop volume broadens the peaks which in turn would lead to a reduced responsiveness. Therefore, the real (S/N)/
  increase would in such a case be assumingly less than a factor of five.
Despite normalizing the S/N and m(PS) to  , it is difficult to compare the two methods because the sample introduction into the chromatographic system is fundamentally different. While the conventional SEC method has a lower sensitivity the FT-SEC method requires longer measurement time. The longer measurement time result from the fact that the analytes experience in the column the same partial steric exclusion mechanism for both methods, but the FT-SEC method requires a minimum of 2 oscillations to be evaluable after Fourier transformation (see section “Chromatographic and Fourier-related consideration”). Although the longer measurement time initially appears disadvantageous, this is also an advantage of the FT-SEC method. Because of the steady-state character of the FT-SEC method, the data acquisition can be extended as desired. By using the Fourier transformation, the acquired oscillations are averaged, which increases the S/N proportional to
  .26 Consequently, the S/N can be increased by just extending the acquisition time which could be especially advantageous for low concentrated samples or for LC detectors with low sensitivity, e.g. NMR or IR.
Conclusion
The proof of principle of the sinusoidal “injection” in liquid chromatography and the related Fourier analysis of the sinusoidal detector trace was established and demonstrated for SEC. This method is named Fourier transformation size exclusion chromatography (FT-SEC). The sinusoidal “injection” was achieved, by periodic repetition of a manually programmed solvent reservoir composition profile (see Fig. 3). Two solvent reservoirs have been used, one containing the pure solvent and the other an analyte stock solution prepared with the same solvent. At constant volume flux, the relative volume content of the analyte stock solution is varied sinusoidally resulting in a sinusoidal analyte concentration profile as a function of time, which is the excitation signal. Two UV/VIS detectors are used which record the excitation signal before and the response signal after the column. The phase angle shift between both chromatograms is determined using Fourier transformation. For molecular weight analysis, the phase angle shifts of PS calibration standards were used for calibration. Due to the superposition principle, the obtained molecular weight for a polymer sample corresponds assumingly to a modified weight average molecular weight (Mw), affected by the magnitude and phase angle shift difference between the single components. In a direct comparison with the molecular weight calibration of conventional SEC, it was shown, that both calibrations have a similar shape, with slight deviations present. It is assumed that the shape difference is due to, despite applied degassing, residual light-absorbing dissolved gases as well as asymmetric band broadening effects that modify the phase angles of the sinusoidal chromatograms. By analysis of different mixtures of each two PS standards, it was shown that a superposition is formed, of which the magnitude and the phase angle shift were predictable using the magnitude and phase angle shifts of the individual components. This proves that the phase angle shifts of the PS standards are the same for the pure and mixed state, showing that the extent of the partial steric exclusion of an analyte remains constant also in mixed state. To decompose a superposed detector signal obtained from a mixture with chemically different analytes, the use of a detector with additional spectral resolution, e.g. IR or NMR, is recommended.In a measurement series with different periods, it was shown that the S/N per square root unit time reaches a plateau for the presented set-up using periods of >300 s. For shorter periods the system band broadening effects broaden the sinusoidal excitation signal leading to a decreased magnitude and, thus, to a reduced S/N in Fourier space.
In a sensitivity comparison between the FT-SEC and the conventional SEC method, it was revealed, that the FT-SEC method allows approximately a factor 50 higher in S/N, normalized to the square root of the acquisition time, at the column overloading limits for the presented measurements and set-up. This is related to a higher duty cycle of the column. Factors which affect the S/N in FT-SEC are: (1) the magnitude of the excitation signal, (2) the period duration in combination with the dead volume of the set-up, (3) the superposition of detector signals of different analytes and, in the case of SEC, also of different molecular weight fractions due to molecular weight dispersity, and (4) the acquisition time.
The higher sensitivity and the advantage that the S/N increases proportionally to the square root of the acquisition time illustrates the potential of this technique for the analysis of low concentrated samples or the usage of low sensitivity detectors, like an NMR. Therefore, in forthcoming work, the focus will be on employing the FT-SEC method to SEC hyphenated with spectroscopic methods as a potential technique for enhancing the S/N when using e.g. benchtop NMR spectrometers or SEC-IR combinations.3,35
Conflicts of interest
There are no conflicts to declare.Acknowledgements
The authors thank Dr Matthias Heck for providing synthesized polystyrene standard, Dr Jonas Keller for the fruitful deliberations, Dr Michael Pollard for valuable comments, and would also like to thank the AiF for funding in the project AiF iGF 19925N. We acknowledge support by the KIT-Publication Fund of the Karlsruhe Institute of Technology.Notes and references
- D. Harvey, Modern analytical chemistry, McGraw-Hill, Boston, 2000 Search PubMed.
- C. N. Reilley, G. P. Hildebrand and J. W. Ashley, Gas Chromatographic Response as a Function of Sample Input Profile, Anal. Chem., 1962, 34, 1198–1213 CrossRef CAS.
- C. Botha, J. Höpfner, B. Mayerhöfer and M. Wilhelm, On-line SEC-MR-NMR hyphenation: optimization of sensitivity and selectivity on a 62 MHz benchtop NMR spectrometer, Polym. Chem., 2019, 10, 2230–2246 RSC.
- B. L. Karger, M. Martin and G. Guiochon, Role of column parameters and injection volume on detection limits in liquid chromatography, Anal. Chem., 1974, 46, 1640–1647 CrossRef CAS.
- R. W. Frei, Pre-concentration and chemical derivatization techniques in HPLC, Methodol. Surv. Biochem., 1978, 7, 243–255 CAS.
- N. Kishikawa, Derivatization Techniques for Chromatographic Analysis, Anal. Sci., 2018, 34, 1109–1110 CrossRef CAS PubMed.
- D. A. Skoog, F. J. Holler and S. R. Crouch, Principles of instrumental analysis, Cengage Learning, Boston, MA, 7th edn., 2018 Search PubMed.
- C. Mars and H. C. Smit, Sample introduction in correlation liquid chromatography Application, properties and working conditions for a novel injection system, Anal. Chim. Acta, 1990, 228, 193–208 CrossRef CAS.
- J. B. Phillips and M. F. Burke, Cross-Correlation Chromatography Applied to Gas-Solid Adsorption Studies, J. Chromatogr. Sci., 1976, 14, 495–497 CrossRef CAS.
- A. F. Siegle, S. Pallmann and O. Trapp, Significant sensitivity enhancement in Hadamard transform high-performance liquid chromatography by application of long modulation sequences constructed from lower order sequences, J. Chromatogr. A, 2018, 1575, 34–39 CrossRef CAS PubMed.
- D. Obst, Verfahren zur kontinuierlichen gaschromatographischen Analyse unter Anwendung der Phasenmodulation, J. Chromatogr., 1968, 32, 8–16 CrossRef CAS.
- S. Hiratsuka and A. Ichikawa, A New Method of Continuous Gas Chromatography, Bull. Chem. Soc. Jpn., 1967, 40, 2303–2307 CrossRef CAS.
- D. E. Carter and G. L. Esterson, Continuous Gas Chromatography of Multicomponent Hydrocarbon Mixtures, Ind. Eng. Chem. Fundam., 1970, 9, 661–666 CrossRef CAS.
- A. F. Siegle and O. Trapp, Improving the signal-to-noise ratio in gel permeation chromatography by Hadamard encoding, J. Chromatogr. A, 2016, 1448, 93–97 CrossRef CAS PubMed.
- M. R. Wunsch, R. Lehnig and O. Trapp, Online Continuous Trace Process Analytics Using Multiplexing Gas Chromatography, Anal. Chem., 2017, 89, 4038–4045 CrossRef CAS PubMed.
- A. F. Siegle and O. Trapp, Implementation of Hadamard encoding for rapid multisample analysis in liquid chromatography, J. Sep. Sci., 2015, 38, 3839–3844 CrossRef CAS PubMed.
- A. F. Siegle and O. Trapp, Hyphenation of Hadamard Encoded Multiplexing Liquid Chromatography and Circular Dichroism Detection to Improve the Signal-to-Noise Ratio in Chiral Analysis, Anal. Chem., 2015, 87, 11932–11934 CrossRef CAS PubMed.
- A. F. Siegle and O. Trapp, Development of a straightforward and robust technique to implement hadamard encoded multiplexing to high-performance liquid chromatography, Anal. Chem., 2014, 86, 10828–10833 CrossRef CAS PubMed.
- C. B. Botha, Method Development of New Chemically Sensitive Detectors for Size Exclusion Chromatography, 2021 Search PubMed.
- T. D. W. Claridge, High-resolution NMR techniques in organic chemistry, Elsevier, Amsterdam, London, 2nd edn, 2009 Search PubMed.
- Ē. Kupče, K. R. Mote, A. Webb, P. K. Madhu and T. D. W. Claridge, Multiplexing experiments in NMR and multi-nuclear MRI, Prog. Nucl. Magn. Reson. Spectrosc., 2021, 124–125, 1–56 CrossRef PubMed.
- A. Brock, N. Rodriguez and R. N. Zare, Hadamard Transform Time-of-Flight Mass Spectrometry, Anal. Chem., 1998, 70, 3735–3741 CrossRef CAS.
- J. A. Castoro and C. L. Wilkins, Ultrahigh resolution matrix-assisted laser desorption/ionization of small proteins by Fourier transform mass spectrometry, Anal. Chem., 1993, 65, 2621–2627 CrossRef CAS PubMed.
- S. Pallmann, A. F. Siegle, J. Šteflová and O. Trapp, Direct Hadamard Transform Capillary Zone Electrophoresis without Instrumental Modifications, Anal. Chem., 2018, 90, 8445–8453 CrossRef CAS PubMed.
- P. B. Allen, B. R. Doepker and D. T. Chiu, Fourier transform capillary electrophoresis with laminar-flow gated pressure injection, Anal. Chem., 2007, 79, 6807–6815 CrossRef CAS PubMed.
- K. Schmidt-Rohr and H. W. Spiess, Multidimensional solid-state NMR and polymers, Acad. Press, London, 1994 Search PubMed.
- D. van Dusschoten and M. Wilhelm, Increased torque transducer sensitivity via oversampling, Rheol. Acta, 2001, 40, 395–399 CrossRef CAS.
- L. K. Kostanski, D. M. Keller and A. E. Hamielec, Size-exclusion chromatography-a review of calibration methodologies, J. Biochem. Biophys. Methods, 2004, 58, 159–186 CrossRef CAS PubMed.
- M. Frigo and S. G. Johnson, The Design and Implementation of FFTW3, Proc. IEEE, 2005, 93, 216–231 Search PubMed.
- F. L. Pedrotti, L. M. Pedrotti and L. S. Pedrotti, Introduction to Optics, Cambridge University Press, 2019 Search PubMed.
- S. R. Bakalyar, M. Bradley and R. Honganen, The role of dissolved gases in high -performance liquid chromatography, J. Chromatogr., A, 1978, 158, 277–293 CrossRef CAS.
- Handbook of size exclusion chromatography and related techniques, ed. C. Wu, Marcel Dekker, New York, 2nd edn, 2004, vol. 91 Search PubMed.
- D. Alliet, Analysis of the negative peaks in gel permeation chromatography, J. Polym. Sci., Part A-1: Polym. Chem., 1967, 5, 1783–1787 CrossRef CAS.
- S.-T. Popovici, W. T. Kok and P. J. Schoenmakers, Band broadening in size-exclusion chromatography of polydisperse samples, J. Chromatogr. A, 2004, 1060, 237–252 CrossRef CAS PubMed.
- T. F. Beskers, T. Hofe and M. Wilhelm, Development of a chemically sensitive online SEC detector based on FTIR spectroscopy, Polym. Chem., 2015, 6, 128–142 RSC.
- A. E. Taylor, L'Hospital's Rule, Am. Math. Mon., 1952, 59, 20–24 CrossRef.
- H. A. David, H. O. Hartley and E. S. Pearson, The Distribution of the Ratio, in a Single Normal Sample, of Range to Standard deviation, Biometrika, 1954, 41, 482–493 CrossRef.
Footnote |
| † This publication has shared first authorship between Markus Matz and Carlo Botha. |
| This journal is © The Royal Society of Chemistry 2022 |