 Open Access Article
One-step microwave synthesis of red-emissive carbon dots for cell imaging in extreme acidity and light emitting diodes†
Xiaojie Chang,
Guizhi Zhao,
Chang Liu,
Xueshi Wang,
Ahmed Mohammed Ali Abdulkhaleq,
Jie Zhang* and
Xibin Zhou *
*
College of Pharmacy, Jinzhou Medical University, Jinzhou, Liaoning 121001, P. R. China. E-mail: dawei492@jzmu.edu.cn
First published on 30th September 2022
Abstract
Red emissive carbon dots (R-CDs) have received great attention in biological fields due to their deep tissue penetrability, great bioimaging capability, low interference from auto-fluorescence, and potential for optoelectronic applications. Herein, excitation-independent, highly acid-sensitive R-CDs were successfully obtained via one-step microwave treatment of o-phenylenediamine (o-PD) and phosphoric acid and carefully purified by column chromatography. The relationship between the fluorescence emission and surface groups of the R-CDs was studied in detail using XPS, NMR, and fluorescence spectroscopy, and the different mechanisms of action of the R-CDs and acid in H2O and ethanol were determined. The excellent anti-interference ability and biocompatibility of the R-CDs were confirmed, and the probes were successfully used for imaging A549 and Escherichia coli (E. coli) cells in extreme acidity. Finally, based on their relatively high quantum yield and long wavelength emission, the application potential of the R-CDs in the fabrication of red light-emitting diodes (LEDs) was investigated.
1. Introduction
Fluorescent carbon dots (CDs), an emerging carbon-based fluorescent material, have attracted continuous attention. Owing to their superior properties of high photostability, easy surface functionalization, good biocompatibility, low toxicity, and facile synthesis, CDs have good application prospects in various fields, including chemical sensing, medical diagnosis, drug delivery, bio-imaging, catalysis, and optoelectronic devices.1–5 There are a variety of approaches to prepare CDs, such as hydrothermal, solvothermal, ultrasound treatment, and microwave methods. With the advantages of simple equipment, short reaction time, and low cost, the microwave route has attracted increasing interest for synthesizing CDs.6–9However, most CDs emit blue or green light with shorter wavelengths;10–13 red- and near-infrared (NIR)-emissive CDs, which are essential for biomedical applications and optoelectronic device fabrication, are scarce. To date, some strategies toward red- or NIR-emissive CDs have been developed. For instance, Gao et al. reported a one-pot hydrothermal method to synthesize red-emissive CDs, which were successfully used in bioimaging and biosensing.14 Liu et al. prepared red-emissive B, N, S-co-doped carbon dots that showed an emission peak at 600 nm with a quantum yield (QY) of 5.44% via a hydrothermal treatment.15 Huang et al. obtained red CDs with strong fluorescence emission at 615 nm using a solvothermal method.16 These CDs had a time-consuming formation process and low quantum yield, which restrict their further application. Therefore, it is still a great challenge to prepare red-emissive CDs (R-CDs) with simple operation, short reaction time, and high yield.
pH is well known to be an important physiological parameter in biological processes, and pH homeostasis plays a crucial role in maintaining the normal morphology and function of living organisms.17,18 Abnormal pH values are often associated with common diseases including cancer19,20 and Alzheimer's disease,21 among others. Furthermore, the average extracellular pH of some tumor cells is slightly lower than that of normal tissue cells.22 The measurement of pH variation in living cells is of great significance for better understanding cellular functions as well as for providing crucial assistance for the early diagnosis of many diseases.23,24 Thus, various methods and techniques for intracellular pH sensing have been developed, and in particular, CD-based fluorometry has attracted attention in pH measurement owing to its advantages of high selectivity, rapid response, operational simplicity, and non-invasiveness.25,26
Recently, R-CD-based fluorescent pH probes have been developed for the accurate measurement of pH for bio-analysis in vitro and in vivo. Guo et al. prepared red-emissive lithium-ion-functionalized CDs that showed high optical sensitivity within the pH range of 1.0–4.5 and were applied to pH sensing.27 Sun et al. developed red-emitting CDs with an NIR fluorescence peak of up to 620 nm via microwave synthesis using p-phenylenediamine as the carbon source. The CDs have a pH-dependent response that covers the pH range from 5.0 to 10.0 and were used to image pH values and ferric ions in Escherichia coli (E. coli).28 Ye et al. fabricated a two-photon (emission peaks at 640/690 nm) fluorescent pH probe that exhibited a pH-sensitive response in the range of 1.0–9.0 and was applied to the imaging and biosensing of pH variation in living cells, tissues and zebrafish.29 Most of the known fluorescent pH probes that have been exploited are suitable for responding to near-neutral or weak acidic conditions in biological systems. There are relatively few fluorescent probes for detecting pH in strongly acidic conditions (pH < 4). Generally, it is difficult for the majority of living organisms to survive in extreme acid conditions. However, there are a large number of microorganisms including acidophiles and Helicobacter pylori that can live in such difficult conditions.30,31 Moreover, some common enteric pathogens such as E. coli and Salmonella species have evolved to adapt to the highly acidic environments of human and animal stomachs, and produce life-threatening infections.32 Additionally, in some eukaryotic cells, acidic organelles and vesicles play key roles in secretory and endocytic pathways. Maintaining an acidic pH within these individual organelles and vesicles is critical; otherwise, they may lose function, leading to diseases.33 From a medical treatment and diagnosis point of view, it is necessary and meaningful to develop novel fluorescent probes for monitoring the intracellular pH in extremely acidic conditions.
Recently, the preparation of CDs using o-phenylenediamine (o-PD) as a carbon source has attracted the attention of many researchers;34–43 o-PD can not only dope the CDs with nitrogen atoms to improve their optical properties but also modify the CD surface with amino groups, enabling CDs to detect pH, identify substances, etc.44,45 However, to the best of our knowledge, there have been no reports on the direct microwave-method preparation of R-CDs using o-PD as a carbon source to detect extremely low pH values by fluorescence enhancement.
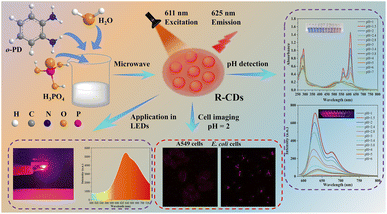
In this work, we employed o-PD as the carbon source to synthesize NIR-emissive CDs directly using a facile microwave method (Scheme 1). The as-prepared R-CDs showed excitation-independent emission peaks in different solvents. The effect of acidity on the R-CDs was investigated in detail. The obtained R-CDs selectively, visually and accurately detected pH in conditions of extreme acidity. Their response mechanism is discussed. In view of their outstanding optical properties, the R-CDs can be successfully applied to cellular imaging at extremely acid pH in vitro and to constructing red light-emitting diodes (LEDs).
2. Experimental
2.1 Reagents and materials
Dimethyl sulfoxide (DMSO), o-phenylenediamine (o-PD), 2,3-diaminophenazine (DAP), trifluoroacetic acid (TFA), N,N-dimethylformamide (DMF), triethylamine (TEA), various inorganic salts, amino acids and glucose were purchased from Shanghai Aladdin Biochemical Technology Co., Ltd. Phosphoric acid (H3PO4), sulfuric acid (H2SO4), acetonitrile, ethyl acetate, acetone, acetic acid and ethanol were obtained from Tianjin Heowns Biochemical Technology Co., Ltd. RPMI-1640 culture medium, fetal bovine serum (FBS), and the antibiotic agents were purchased from Hangzhou Sijiqing Bioengineering Materials Co., Ltd. Trypsin (0.25%) solution and Dulbecco's phosphate buffered saline (PBS) were purchased from Hyclone Biochemical Products Co., Ltd. A549 cancer cells were purchased from the Shanghai Cell Bank of Chinese Academy of Science (Shanghai, China). Escherichia coli (E. coli) ATCC 25922 was a gift from the First Affiliated Hospital of Jinzhou Medical University. All reagents used in this work were obtained from commercial suppliers and used without further purification. Deionized (DI) water was used throughout all the experiments.2.2 Instruments
Fourier transform infrared (FT-IR) spectra were obtained using an IRAffinity-1 (Japan). UV-vis absorption spectra were recorded on a Cary 50 (Varian Company, USA). All fluorescence spectra were recorded using a Cary 300 fluorescence spectrometer (Varian Company, USA). The morphology and size of the prepared R-CDs were determined using transmission electron microscopy (TEM, Talos F200X, USA FEI). X-ray photoelectron spectroscopy (XPS) was conducted using a Kratos Axis Ultra DLD (Kratos, UK). X-ray diffraction patterns were obtained using an X-ray powder diffractometer (XRD, D-8, Bruker-axs, Germany). Zeta potential, particle size, and size distribution were measured using a Zetasizer Nano ZS90 (Malvern, Britain). Time-correlated single-photon counting (TCSPC) data was obtained using a Harp 300 system (Picoquant). The absolute quantum yields were determined with a Fluoromax-4 (HORIBA, USA). 1H-NMR spectra of the R-CDs were recorded using a nuclear magnetic resonance (NMR) spectrometer (technologies plus-400 Mr, Agilent company, USA); the solvents were d6-DMSO and CD3OD, and the internal standard was tetramethylsilane (TMS). The high-performance liquid chromatography (HPLC) device used was a Shimadzu 15C equipped with a UV detector (flow rate: 1 mL min−1, mobile phase: 17% acetonitrile, 83% 0.1% TFA in H2O, column: Agilent XDB-C18, 250 mm × 4.6 mm, 5 μm, column temperature: 24 °C, determination wavelength: 440 nm). A global digital pH meter (FE20K, Mettler-Toledo Company, Switzerland) was used to measure the pH values of the solutions. Cellular fluorescence images were captured with a Leica TCS SP5 confocal laser scanning microscope.2.3 Preparation of R-CDs
The R-CDs were prepared by a microwave method. Briefly, 0.5 mL H2O was mixed with 0.3 mL phosphoric acid in a beaker. 50 mg of o-PD was dissolved in the above mixed solvent under ultrasonication, after which 1.2 mL of phosphoric acid was added and mixed well. The solution was heated in a microwave at medium (50%) power for 7 min. The beaker was cooled to room temperature naturally. Precipitation appeared after the solution was neutralized with sodium hydroxide solution, and the crude CD product was then obtained by centrifugation. The obtained dark blue product was actually a mixture of CDs with impurities, which could be carefully separated via silica column chromatography. A mixture of methylene chloride, methanol, and DMF was used as the eluent. After removing the solvent, a dark purple solid was obtained.2.4 Preparation of various solutions and measurements of spectra
PBS buffer solution (100 mM) and ethanol solutions with different acidities were prepared. Various metal ions (NaCl, KCl, AlCl3, Zn(OAC)2, FeCl2, FeCl3, MgCl2, CuCl2, CaCl2, AgNO3, Pb(NO3)2, NaBr, KI, and NaCO3, 100 μM) and amino acids (glutamic acid (Glu), aspartic acid (Asp), arginine (Arg), cysteine (Cys), DL-homocysteine (Hcy), histidine (His), lysine (Lys), serine (Ser), tryptophan (Trp), threonine (Thr), phenylalanine (Phe), and glucose, 100 μM) were prepared in different pH PBS solutions. 20 μL of the R-CD stock solution (1 mg mL−1) was added to the above solution, and the fluorescence and UV-vis spectra were then measured; each experiment was repeated three times.2.5 MTT assay and cell imaging
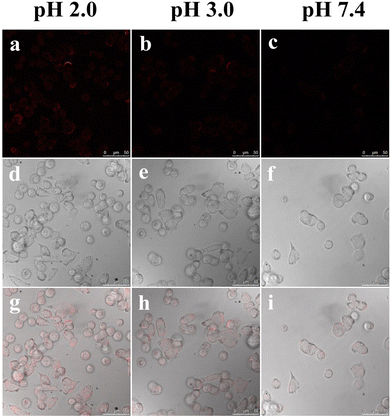
For cell imaging, the cells were seeded on six-well plates, which were placed in an incubator at 37 °C with 5% CO2 for 24 h. The medium was removed by gentle rinsing with sterile PBS (pH 7.4) three times. 10 μg mL−1 R-CD solutions in PBS (pH 2.0, 3.0, and 7.4) were freshly prepared, added to each plate, and mixed carefully. After 5 min of incubation, the residual R-CDs were removed by gentle rinsing with PBS (pH 2.0, 3.0, and 7.4) three times. The fluorescence images were collected with a confocal laser scanning microscope red channel.
2.6 Construction of LED devices
In total, 100 mg of polyvinylpyrrolidone (PVP, MW = 10![[thin space (1/6-em)]](https://www.rsc.org/images/entities/char_2009.gif) 000) was dissolved in 10 mL ethanol. Then, 1.5 mg R-CDs was dissolved in 1 mL ethanol, and this solution was then added to the above PVP solution under magnetic stirring. After the solution was sonicated for 30 min, it was placed in an oven and dried at 40 °C for 24 h. The obtained R-CD/PVP block was ground to obtain near-infrared luminescent phosphors. The powder was mixed with commercial silicone (A) and curing agent (B) (A/B = 4/1) and then degassed under vacuum. The gel was then coated on 382 nm LED chips and cured at 110 °C for 1 h to construct red LEDs.
000) was dissolved in 10 mL ethanol. Then, 1.5 mg R-CDs was dissolved in 1 mL ethanol, and this solution was then added to the above PVP solution under magnetic stirring. After the solution was sonicated for 30 min, it was placed in an oven and dried at 40 °C for 24 h. The obtained R-CD/PVP block was ground to obtain near-infrared luminescent phosphors. The powder was mixed with commercial silicone (A) and curing agent (B) (A/B = 4/1) and then degassed under vacuum. The gel was then coated on 382 nm LED chips and cured at 110 °C for 1 h to construct red LEDs.
3. Results and discussion
3.1 Characterization of R-CDs
The R-CDs were prepared via a microwave method using o-PD as the raw material by adding H3PO4, and then purified by silica column chromatography using a mixture of methylene chloride, methanol, and DMF as the eluent; the yield of purified R-CDs was 17%. Transmission electron microscopy (TEM) was performed to characterize the synthesized R-CDs. The diameter of the R-CDs in Fig. 1a was measured using the software Nano Measurer, and the corresponding size distribution histogram is shown in Fig. 1b. The results demonstrated that the diameters of the as-prepared R-CDs ranged from 2.03 to 4.71 nm, with an average diameter of 2.97 nm. The HRTEM image (inset in Fig. 1a) clearly exhibited a parallel lattice fringe with a spacing of 0.31 nm, which was in good agreement with the (002) lattice plane of graphitic carbon.46,47 The X-ray diffraction (XRD) patterns of the R-CDs (Fig. 1c) showed one broad diffraction peak centered at 2θ = 26° and 9 peaks with a high signal/noise (S/N) ratio. The peak at a 2θ value of around 26° was indexed to the (002) lattice spacing of graphite, indicating that the R-CDs have a graphite-like structure.48 The high S/N ratio of the peaks indicated that the R-CDs had good crystallinity.42,49–51 This result indicated that the spacing between carbon dots was not random, but presumably determined by ordered stacking or linking between carbon dots.38 Similar XRD patterns have also been observed in metal–organic frameworks (MOFs).52 | ||
| Fig. 1 TEM and HRTEM (inset) images (a), particle size distribution graph (b), and XRD pattern (c) of the R-CDs. | ||
The surface functional groups of the R-CDs were identified from the Fourier transform infrared spectroscopy (FT-IR) spectrum. As shown in Fig. 2a, the broad absorption bands at 3106–3480 cm−1 were attributed to the stretching vibrations of O–H and N–H.53 The bands at 1405–1684 cm−1 are the characteristic absorptions of C![[double bond, length as m-dash]](https://www.rsc.org/images/entities/char_e001.gif) C, C
C, C![[double bond, length as m-dash]](https://www.rsc.org/images/entities/char_e001.gif) N, and C
N, and C![[double bond, length as m-dash]](https://www.rsc.org/images/entities/char_e001.gif) O.34 The absorption bands at 1356–1790 cm−1 correspond to the stretching vibrations of C–N.54 In addition, the stretching vibrations of P
O.34 The absorption bands at 1356–1790 cm−1 correspond to the stretching vibrations of C–N.54 In addition, the stretching vibrations of P![[double bond, length as m-dash]](https://www.rsc.org/images/entities/char_e001.gif) O are located at 884–1032 cm−1.55
O are located at 884–1032 cm−1.55
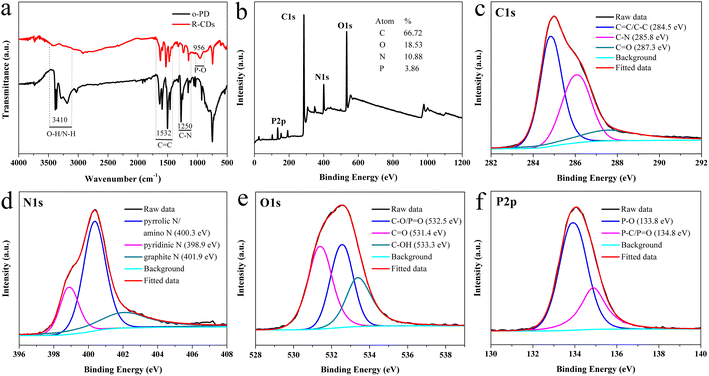 | ||
| Fig. 2 FT-IR spectra of o-PD and R-CDs (a). XPS survey (b) spectrum of the R-CDs. High-resolution C 1s (c), N 1s (d), O 1s (e) and P 2p (f) XPS spectra of the R-CDs. | ||
To further determine the elemental composition and valence states of the R-CDs, full-range X-ray photoelectron spectroscopy (XPS, Fig. 2b) demonstrated the presence of C 1s (285.5 eV), N 1s (400.3 eV), O 1s (532.4 eV), and P 2p (134.3 eV), respectively. Additionally, compositional analysis showed the presence of the elements carbon (66.72%), oxygen (18.53%), nitrogen (10.88%), and phosphorus (3.86%).
The high-resolution C 1s XPS spectrum in Fig. 2c showed three peaks located at 284.5, 285.8, and 287.3 eV, which correspond to C![[double bond, length as m-dash]](https://www.rsc.org/images/entities/char_e001.gif) C/C–C (graphitic carbon, 46.93%), C–N (sp3 carbon, 36.39%), and C
C/C–C (graphitic carbon, 46.93%), C–N (sp3 carbon, 36.39%), and C![[double bond, length as m-dash]](https://www.rsc.org/images/entities/char_e001.gif) O (carbonyl carbon, 16.67%), respectively.56 The N 1s spectrum (Fig. 2d) could be divided into three peaks. Those at 398.9 and 401.9 eV were assigned to pyridinic N (20.76%) and graphitic N (36.31%).57 The peak near 400.3 eV is often assigned to pyrrolic N.57–59 We thought that the surface of the R-CDs should also contain amino groups. The XPS spectrum of the 2,3-diaminophenazine standard was measured (Fig. S1†), and the N 1s spectrum of 2,3-diaminophenazine exhibited two peaks at 399.2 and 400.2 eV, which could be assigned to pyridinic N and amino N, respectively. The position of the amino N peak almost overlapped with the position of pyrrolic N reported in the literature.58 Thus, we assigned the peak at 400.3 eV in Fig. 2d to pyrrolic N and amino N (52.93%). The O 1s spectrum (Fig. 2e) contained three peaks at 532.5, 531.4, and 533.3 eV associated with C–O/P
O (carbonyl carbon, 16.67%), respectively.56 The N 1s spectrum (Fig. 2d) could be divided into three peaks. Those at 398.9 and 401.9 eV were assigned to pyridinic N (20.76%) and graphitic N (36.31%).57 The peak near 400.3 eV is often assigned to pyrrolic N.57–59 We thought that the surface of the R-CDs should also contain amino groups. The XPS spectrum of the 2,3-diaminophenazine standard was measured (Fig. S1†), and the N 1s spectrum of 2,3-diaminophenazine exhibited two peaks at 399.2 and 400.2 eV, which could be assigned to pyridinic N and amino N, respectively. The position of the amino N peak almost overlapped with the position of pyrrolic N reported in the literature.58 Thus, we assigned the peak at 400.3 eV in Fig. 2d to pyrrolic N and amino N (52.93%). The O 1s spectrum (Fig. 2e) contained three peaks at 532.5, 531.4, and 533.3 eV associated with C–O/P![[double bond, length as m-dash]](https://www.rsc.org/images/entities/char_e001.gif) O (35.11%), C
O (35.11%), C![[double bond, length as m-dash]](https://www.rsc.org/images/entities/char_e001.gif) O (38.86%), and C–OH (26.03%) bonds, respectively.60–62 The P 2p peaks at 133.8 and 134.8 eV (Fig. 2f) indicated that P mainly existed in the form of P–O (69.37%) and P–C/P
O (38.86%), and C–OH (26.03%) bonds, respectively.60–62 The P 2p peaks at 133.8 and 134.8 eV (Fig. 2f) indicated that P mainly existed in the form of P–O (69.37%) and P–C/P![[double bond, length as m-dash]](https://www.rsc.org/images/entities/char_e001.gif) O (30.63%) bonds,63 which confirmed the successful doping of phosphorus in the carbon dots. The results from the XPS data were in good accordance with those of the FT-IR analysis. All these characterization data and analyses confirmed the successful incorporation of phosphorus and nitrogen into the R-CDs and provided convincing evidence of the exact surface states and composition of the R-CDs.
O (30.63%) bonds,63 which confirmed the successful doping of phosphorus in the carbon dots. The results from the XPS data were in good accordance with those of the FT-IR analysis. All these characterization data and analyses confirmed the successful incorporation of phosphorus and nitrogen into the R-CDs and provided convincing evidence of the exact surface states and composition of the R-CDs.
Moreover, to determine their functional groups and structure, the R-CDs were investigated using 1H-NMR spectroscopy. The 1H-NMR spectra are shown in Fig. S2.† In the 1H-NMR spectrum of 2,3-diaminophenazine, the signals in the 6.8–8.0 ppm region were assigned to the hydrogens on the aromatic ring. The peak at 6.3 (in d6-DMSO) was attributed to the amino hydrogen, which was consistent with the data shown in the literature.40 When CD3OD was used as the solvent, the hydrogen in the amino group could exchange with deuterium ions, resulting in the disappearance of the peak in the 1H-NMR spectrum. In the 1H-NMR spectrum of the R-CDs, the signals in the 9.5–10.0 ppm region were assigned to the hydrogen on the hydroxyl group, which was consistent with the XPS results; the spectral peaks with chemical shifts between 6.8 and 8.0 could be assigned to hydrogens on aromatic rings, indicating that the R-CDs contained aromatic ring structures. The peak at 6.5 could be assigned to amino hydrogen, and the disappearance of this peak in the 1H-NMR spectrum (in CD3OD) further indicated the presence of amino N groups in the R-CDs.
3.2 Optical properties of R-CDs and fluorescence response of R-CDs toward acidity
![[double bond, length as m-dash]](https://www.rsc.org/images/entities/char_e001.gif) C) and the defect state n–π* transition of the oxygen-containing functional groups C
C) and the defect state n–π* transition of the oxygen-containing functional groups C![[double bond, length as m-dash]](https://www.rsc.org/images/entities/char_e001.gif) O.53,64,65 In the visible region, wide absorption bands from 500–650 nm and 450–600 nm were observed, which could be attributed to the n–π* transitions of the aromatic sp2 system containing C
O.53,64,65 In the visible region, wide absorption bands from 500–650 nm and 450–600 nm were observed, which could be attributed to the n–π* transitions of the aromatic sp2 system containing C![[double bond, length as m-dash]](https://www.rsc.org/images/entities/char_e001.gif) O and C
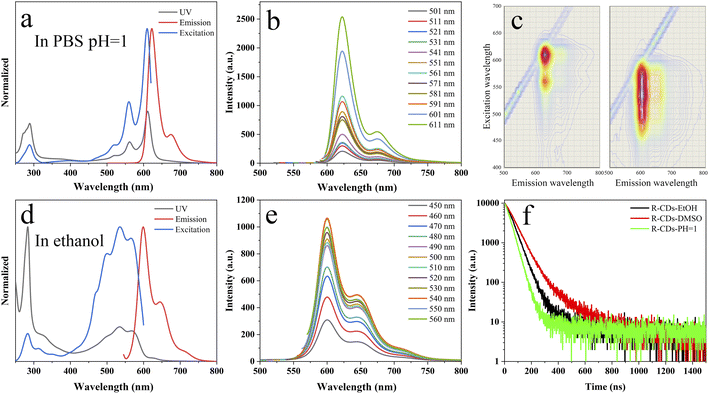
O and C![[double bond, length as m-dash]](https://www.rsc.org/images/entities/char_e001.gif) N bonds66 or its large conjugated structure in the carbon core.38 The peak at 450–600 nm (Fig. 3a and d) was closely fit to the maximum excitation peak, which indicated that the emission peak at 624 nm in PBS (pH = 1) and that at 598 nm in ethanol originated from the absorption of 450–600 nm light. These results also indicated that the fluorescence of the R-CDs in solution mainly originated from the carbon core rather than the surface functional groups,38 which was consistent with what was reported in the literature.41
N bonds66 or its large conjugated structure in the carbon core.38 The peak at 450–600 nm (Fig. 3a and d) was closely fit to the maximum excitation peak, which indicated that the emission peak at 624 nm in PBS (pH = 1) and that at 598 nm in ethanol originated from the absorption of 450–600 nm light. These results also indicated that the fluorescence of the R-CDs in solution mainly originated from the carbon core rather than the surface functional groups,38 which was consistent with what was reported in the literature.41
The R-CDs exhibited excitation-independent fluorescence behavior under different excitation wavelengths in PBS (pH = 1) and ethanol (Fig. 3b and e). Although the fluorescence intensity varied, the peak position barely changed upon variation of the excitation wavelength. The maximum emission wavelength of R-CDs was 624 nm in PBS (pH = 1), while it was 598 nm in ethanol; thus, the maximum emission wavelength was red-shifted. The difference in the peak positions of the R-CDs in PBS and ethanol may be attributed to the interaction between the solvent or protons with R-CDs. It has been reported that excitation-independence and solvent-dependence indicates that the emission of CDs is controlled by molecular state.67–70 The results suggest that the emission of the R-CDs in this work was controlled by molecular state rather than surface states (Fig. 3a–e).
To further understand the fluorescence properties of the R-CDs, their time-resolved fluorescence spectra were measured. The fluorescence decay curve of the R-CDs was fitted using a mono-exponential decay with a lifetime of 2.52 ns, 3.37 ns, and 1.79 ns in ethanol, DMSO, and PBS (pH = 1) (Fig. 3f). Their relatively low fluorescence lifetimes in ethanol and water could be attributed to nonradiative transitions caused by hydrogen bonding between the solvent and R-CDs. Moreover, the absolute fluorescence quantum yield (QY) of the R-CDs (Fig. S3†) was determined to be 12.4% (in ethanol), 18.9% (in DMSO), and 13.0% (in PBS with pH = 1) under their optimal excitation wavelength. The QYs of the majority of reported red-emissive CDs have ranged from 2–8%;71 therefore, the R-CDs in this work have potential for biological applications.
In addition, the stability of the R-CDs was evaluated in a high-concentration salt solution and under continuous UV irradiation. As shown in Fig. S4,† changing the ionic strength had no obvious effect on the fluorescence intensity of the R-CDs when they were dispersed in different concentrations of NaCl (0–1.0 mol L−1). This finding suggests that the as-synthesized R-CDs obtained by this method can be used in various salt solutions, such as buffer solutions, as well as their application potential in biology. After being irradiated with a UV lamp for 30 min, the CDs in PBS (pH = 1) still retained 96% of their original fluorescence intensity (Fig. S5†), demonstrating the excellent stability of the R-CDs.
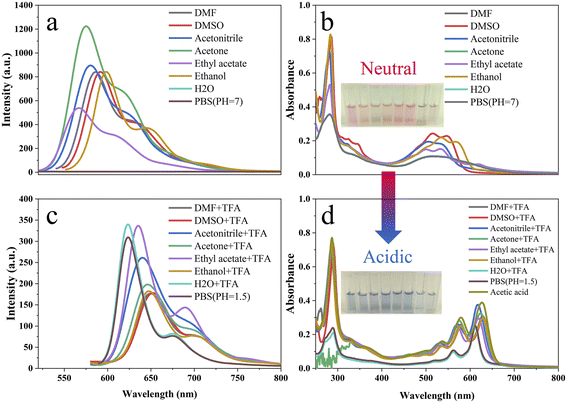
It has been reported that the fluorescence spectrum of red emissive carbon dots synthesized by o-PD changes under acidic conditions. The mechanism of fluorescence change was attributed to protonation or energy level changes. However, the effects of acid concentration and acid intensity on the UV-vis and fluorescence spectra in different solvents, especially organic solvents, have not been investigated in detail. In this work, the acid-dependent behavior of the R-CDs was investigated in detail to further study the mechanism of the reaction of R-CDs with acid. The effect of protonation on the UV and fluorescence spectra of the R-CDs in PBS and ethanol was investigated (Fig. 5). The UV-vis absorption at 285, 560, and 611 nm (Fig. 5a) and the fluorescence intensity at 630 nm (Fig. 5c) gradually increased with decreasing pH in PBS solution. The inset of Fig. 5a shows the color gradient of the solution from pink under neutral conditions to blue-violet under acidic conditions. With increasing concentration of TFA, a new absorption peak appeared at 625 nm and gradually increased in the ethanol solution (Fig. 5b). The fluorescence emission peak at 600 nm decreased with the addition of TFA (Fig. 5d), and when the concentration of TFA reached 2.7 × 10⁻⁴ mol L−1, the emission peak at 600 nm completely disappeared. This may be attributed to the protonation, which affected the energy transition pathway of the R-CDs.72 However, the fluorescence spectra (Fig. 5c and d) exhibited different trends with the addition of acid, so the effect of protonation on the energy conversion pathway mechanism of the R-CDs may be different. This issue will be discussed in detail in Section 3.2.3. Fig. S7† displays the sigmoidal fitting of the pH-dependent UV-vis absorbance and fluorescence intensity; the pKa values were 2.55 (Fig. S7a†) and 2.72 (Fig. S7c†). Fig. S7† clearly shows that the R-CDs are very sensitive to pH changes in the range of 1.5–3.5 in PBS, and it also indicates that the R-CDs are very sensitive to the concentration of TFA in the range of 5 × 10⁻⁵–1.5 × 10⁻⁴ mol L−1 in ethanol. To facilitate similar work to conduct a comparative analysis by future researchers, we also have calculated the “pKa” of the R-CDs in ethanol when TFA was used as the added acid. In analogy to the method for the calculation of pH in water, due to the complexity of the ionization of acids in an organic solvent, we used −log[conc. of TFA] directly instead of −log[conc. of H+] to calculate the “pKa”, and the resulting values were 7.71 and 6.34 based on the results shown in Fig. 5b and d.
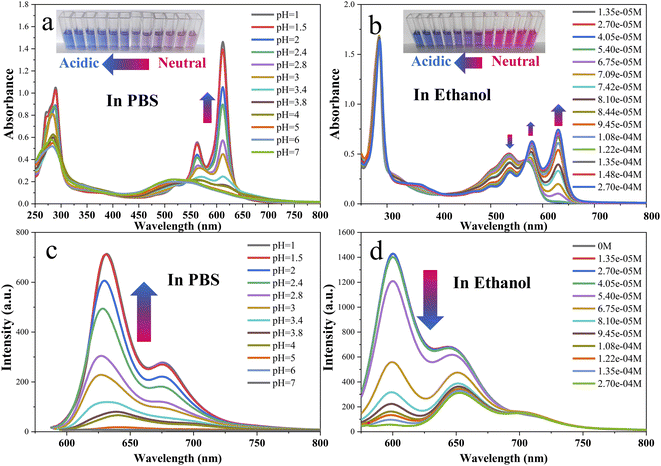 | ||
| Fig. 5 UV-vis and fluorescence emission spectra of the R-CDs (11 μg mL−1) in buffer solutions of different pH (a and c) and in ethanol with different concentrations of TFA (b and d). λex = 570 nm. | ||
We investigated the effect of lower concentrations of acid (TFA, 0–2.7 × 10⁻⁴ mol L−1) on the UV-vis absorption and fluorescence spectra of the R-CDs in ethanol (Fig. 5b and d). Furthermore, to investigate the mechanism of the reaction of the R-CDs with acid, we investigated the effects of higher concentrations of TFA and more acidic acids (H2SO4) on the UV-vis and fluorescence spectra of the R-CDs in ethanol. After the concentration of TFA reached 1.48 × 10⁻⁴ mol L−1, the UV-vis and fluorescence spectra of the R-CDs in ethanol did not change even with further adding TFA to a total concentration of 5.75 × 10⁻² mol L−1; when 0–1.12 × 10⁻⁴ mol L−1 H2SO4 was gradually added to an ethanol solution of R-CDs, the trends in the UV-vis and fluorescence spectra were similar to those observed when adding TFA (Fig. S8,† 5b and d and S8a–d†). It is worth mentioning that in the above processes of adding TFA or sulfuric acid to the system, the fluorescence emission peak of the R-CDs at 600 nm was gradually quenched, while the emission peak at 650 nm was not affected. However, after the emission peak at 600 nm was quenched, higher concentrations of H2SO4 (>9.38 × 10⁻⁴ mol L−1) gradually converted the emission peak at 650 nm to 630 nm, and it was continuously enhanced with increasing acidity. Fluorescence experiments with different excitation wavelengths for the R-CDs in the presence of H2SO4 or TFA were performed, and the results are shown in Fig. S9.† The results indicate that the fluorescence emission was excitation independent.
To explain the fluorescence and UV-vis differences of the R-CDs at higher concentrations of TFA and H2SO4 (Fig. S8c and g†), and to further explore the mechanism of the reaction of the R-CDs with acid, the experiments described below were designed and performed.
Based on the above experimental results, the mechanism of the reaction of the R-CDs with acid was proposed (Scheme 2). The surface of the neutral R-CDs may contain both stronger basic groups and weaker basic groups, corresponding to the fluorescence emission peaks at 600 nm and 650 nm, respectively, and the fluorescence emission can be quenched by H2O. The stronger basic groups can be protonated first under slightly acidic conditions, quenching the 600 nm emission. The weaker basic groups can only be protonated under stronger acidic conditions, which converts the 650 nm emission to 630 nm emission, which exhibits strong fluorescence emission both in organic solvents and in PBS/H2O. This mechanism can be used to reasonably explain the different trends in Fig. 5c and d upon the addition of acid, as well as the different trends (Fig. S8c and g†) at higher concentrations of TFA and H2SO4, which are the issues we raised in the above discussion. Since the fluorescence at 600 nm is quenched by H2O, only enhancement of the fluorescence emission at 630 nm is shown with the addition of acid (Fig. 5c). The fluorescence at 600 nm in ethanol can be gradually quenched with the addition of acid (Fig. 5d). Since the pKa of H2SO4 (pKa = −3) is stronger than that of TFA (pKa = 0.23), it is speculated that H2SO4 exhibited stronger acidity in ethanol and can further protonate the weakly basic nitrogen atom in the R-CDs in the process with the further addition of H2SO4 (Fig. S8c and g†), thereby further changing the UV-vis and fluorescence spectra of the R-CDs.
 | ||
| Scheme 2 Proposed mechanism of the change in the fluorescence emission of the R-CDs under acidic conditions. | ||
Moreover, the following experiment was performed to investigate the groups with different basicities on the surface of the R-CDs to support the above mechanism. Different types of nitrogen atoms have different pKa values (Table S1†). The pKa of the nitrogen atom varies based on its chemical environment. It has been reported that o-PD can generate 2,3-diaminophenazine and 2-amino-3-hydroxyphenazine during the synthesis of CDs.36,40 We speculated that the groups with different basicity on the surface of the R-CDs may be similar to 2,3-diaminophenazine, such as amino groups, pyrazine groups, etc. To confirm this, a thin-layer chromatography (TLC) experiment was performed to investigate the products during microwave reaction for 1 min and 4 min (Fig. S11†). After the microwave reaction for 1 min, the product still contained a large amount of the raw material o-PD (c1), but only a small amount of 2,3-diaminophenazine (c2) and a very small amount of R-CDs were produced. After 4 min of microwave reaction, the 2,3-diaminophenazine in the product had disappeared, and the relative content of the R-CDs had increased. The formation of 2,3-diaminophenazine was further demonstrated by HPLC; these results are also shown in Fig. S11.† The above results indicated that in the process of synthesizing the R-CDs, o-PD was first condensed to generate 2,3-diaminophenazine and other compounds. As the reaction progressed, 2,3-diaminophenazine further underwent condensation and generated R-CDs, along with other by-products. The TLC results were combined with those of IR, XPS and 1H-NMR, which suggested that amino and pyrazine groups (pyridine nitrogens) existed on the structure of the R-CDs and afforded different basic groups on the surface of the R-CDs. We suspect that the “stronger basic groups” may be amino groups, while the “weaker basic groups” may be pyridine nitrogens on the surface of the R-CDs. The literature36 suggests that “the fluorophore products of precursor conversion are viable determinants of the desired luminescence properties of carbon dots”. Therefore, the fluorescence response of DAP to H2SO4 or TFA in ethanol was investigated to help in understanding the fluorescence response of the R-CDs to acid, and the results are shown in the Fig. S12.† Fig. S12† shows that the addition of H2SO4 (0–9.63 × 10⁻⁸ M) and TFA (0–1.57 × 10⁻⁶ M) can quench the fluorescence of DAP at 538 nm, which is similar to the results for the R-CDs in Fig. 5 and S8.† Therefore, we speculate that “the stronger basic groups” of the R-CDs should be amino groups. The continued addition of H2SO4 (9.63 × 10⁻⁸ M–3.32 × 10⁻⁵ M) or TFA (1.57 × 10⁻⁶–1.57 × 10⁻⁴ M) to the DAP ethanol solution had little effect on the change in fluorescence. This may be due to the gap between the basicity of the normal amino group (pKa ∼4.5) and the phenazine group (pKa ∼0.6). When the concentration of H2SO4 reached 3.32 × 10⁻⁵ M or that of TFA reached 1.57 × 10⁻⁴ M, the fluorescence of the DAP solution began to undergo a second-stage quenching, probably due to the phenazine group starting to be protonated at higher concentrations of acid. Similarly, the second-stage fluorescence change of the R-CDs occurred when the concentration of H2SO4 reached 9.38 × 10⁻⁴ M (Fig. S8g†). Therefore, we speculate that the “weaker basic groups” in the R-CDs should be pyridine nitrogens with a similar structure to phenazine. However, possibly due to coupling with the carbon nucleus or other reasons, the basicity of the pyridine nitrogens in the R-CDs is further weakened, and they can only be protonated by a stronger acid ([H2SO4] > 9.38 × 10⁻⁴ M). Additionally, possibly due to the different chemical environment of the pyridine nitrogen, the R-CDs showed a fluorescence enhancement at 630 nm in response to acid, while DAP showed a further quenching of fluorescence at 540 nm.
3.3 Imaging of living cells in extreme acidity
It was thus crucial to evaluate the cytotoxicity of the R-CDs to living cells using the MTT assay (see ESI†). As depicted in Fig. S15,† over 82% cell viability was observed after the incubation of A549 cells with the R-CDs at different concentrations (1, 5, 10, 20, and 50 μg mL−1) for 24 h. Thus, the results confirmed the negligible cytotoxicity of the R-CDs, and they could potentially be used for the intracellular imaging of living cells.
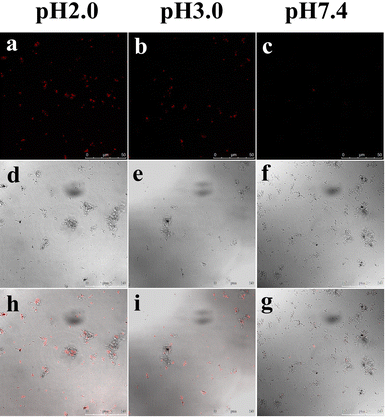
The unique optical properties of the R-CDs, especially for the measurement of extreme acidity, prompted us to apply them for monitoring pH changes in living bacteria samples. We employed E. coli cells, which can survive under extremely acidic conditions, as a model organism. To simulate an extremely acidic environment, buffer solutions with pH 2.0, 3.0, and 7.4 were employed to incubate E. coli cells. As shown in Fig. 9, the E. coli cells exhibited bright red fluorescence emission after being incubated with the R-CDs at pH 2.0, which was recorded with the assistance of a confocal laser scanning microscope (Fig. 9a). When the extracellular pH was increased to 3.0, the fluorescence intensity of E. coli was very faint (Fig. 9b), and no obvious fluorescence was observed when the pH was increased to 7.4 (Fig. 9c). The results demonstrated that the R-CDs can be applied for bioimaging under extreme acidity conditions and monitoring pH fluctuations in E. coli cells. We believe that the as-synthesized pH-sensitive R-CDs have potential application prospects in noninvasive monitoring and imaging in other biological systems.
3.4 Application of R-CDs in the field of optoelectronics
To further expand the application range of the R-CDs, we also investigated the potential of the R-CDs in manufacturing red-emitting LEDs (Fig. 10). The phosphors were prepared by dispersing the R-CDs in polyvinylpyrrolidone (PVP). The device was fabricated by mixing the phosphors and silicones, and then coating the gel-like mixture onto the light-emitting chip and curing it. As shown in Fig. 10a and b, the emission range of the prepared red-emitting LEDs was from 580 to 730 nm, and the LED exhibited an emission spectrum with CIE color coordinates of (0.58, 0.41). These results demonstrated that red phosphors prepared from the R-CDs have the potential to make practical lighting devices.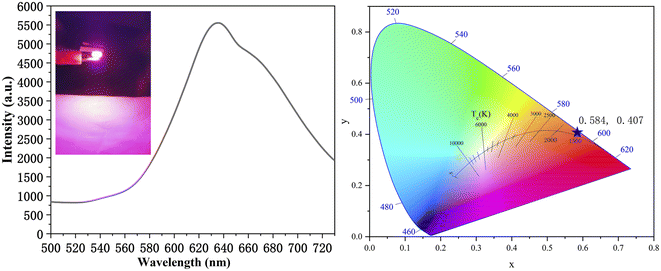 | ||
| Fig. 10 Fluorescence spectrum of the red LED excited by a 382 nm chip (a). Color coordinates of the LED emission spectrum (b). | ||
4. Conclusions
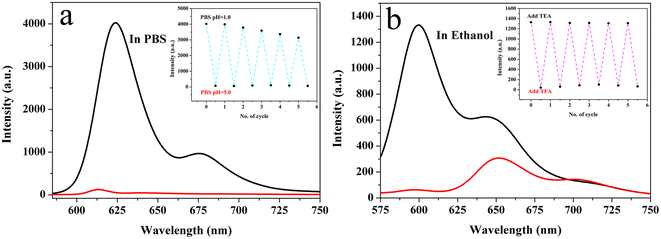
In summary, using o-PD as the raw material in the presence of phosphoric acid, R-CDs were synthesized by a microwave method for the first time. The resulting R-CDs exhibited excitation independence, acid sensitivity, and high quantum yields. The UV-vis and fluorescence emission of the R-CDs in water and in organic solvent (ethanol) exhibited different response behaviors to acids. The relationship between the fluorescence emission and surface groups of the R-CDs was studied in detail using XPS, 1H-NMR, fluorescence spectroscopy, and TLC. The results showed that the surface of the R-CDs in the neutral state had stronger basic groups responsible for the 600 nm emission and weaker basic groups responsible for the 650 nm emission. In ethanol, a relatively low concentration of acid could protonate the stronger basic groups, causing the quenching of the 600 nm fluorescence emission. In contrast, the weaker basic groups with 650 nm emission could only be protonated under strong acid conditions and were converted to emitting at 630 nm. In water, the 600 and 650 nm emissions of the R-CDs were quenched, and the fluorescence emission at 630 nm was activated and enhanced only at pH < 5. In water, the R-CDs had a pH detection range of 1–5 and a pKa of 2.55 (derived from fluorescence experiments). With their merits of high sensitivity, high selectivity, excellent stability, and good reversibility, the prepared R-CD-based fluorescent pH probes were successfully applied to monitor intracellular pH changes in A549 cancer cells and E. coli cells. The R-CDs showed better cell-imaging ability at relatively lower pH (pH < 3). Finally, based on their excitation independence, high quantum yield (18.9% in DMSO), and long wavelength emission, red LEDs were successfully fabricated using phosphors prepared from the R-CDs as a raw material, which showed the potential of the R-CDs for the fabrication of red LEDs. R-CDs are expected to be a promising candidate for real-time tracking of pH changes under extremely acidic conditions in the biomedical and biological fields, as well as in the field of LED manufacturing.Conflicts of interest
There are no conflicts to declare.Acknowledgements
This work was financially supported by the Liaoning Revitalization Talents Program (XLYC2007140), the National Natural Science Foundation of China (21405069), Excellent Talents program of Liaoning Provincial Universities (LJQ2015068) and Natural Science Foundation of Liaoning Province (201602339).References
- F. Yan, Y. Zou, M. Wang, L. Dai and L. Chen, Prog. Chem., 2014, 26, 61–74 CAS.
- R. Zhang and W. Chen, Biosens. Bioelectron., 2013, 55, 83–90 CrossRef PubMed.
- J. Zhang, H. Jia, W. Liu, J. Wang and D. Fang, Dyes Pigm., 2021, 193, 109554 CrossRef CAS.
- S. Karthik, B. Saha, S. K. Ghosh and N. Singh, Chem. Commun., 2013, 49, 10471–10473 RSC.
- L. H. Mao, W. Q. Tang, Z. Y. Deng, S. S. Liu, C. F. Wang and S. Chen, Ind. Eng. Chem. Res., 2014, 53, 6417–6425 CrossRef CAS.
- Q. Wang, H. Zheng, Y. Long, L. Zhang, G. Mei and W. Bai, Carbon, 2011, 49, 3134–3140 CrossRef CAS.
- S. S. Wang, W. Q. Mi, H. Zhu and F. H. Wang, Spectrosc. Spect. Anal., 2012, 32, 2710–2713 CAS.
- K. Jiang, Y. H. Wang, X. L. Gao, C. Z. Cai and H. W. Lin, Angew. Chem., Int. Ed., 2018, 57, 6216–6220 CrossRef CAS PubMed.
- N. Q. Gong, H. Wang, S. Li, Y. L. Deng, X. A. Chen, L. Ye and W. Gu, Langmuir, 2014, 30, 10933–10939 CrossRef CAS PubMed.
- X. Hao, S. Dai, J. Wang and Z. Fang, Luminescence, 2021, 36, 721–732 CrossRef CAS PubMed.
- W. U. Khan, L. Qin, A. Alam, P. Zhou and Y. Wang, ACS Appl. Bio Mater., 2021, 4, 5786–5796 CrossRef CAS PubMed.
- H. Diao, T. Li, R. Zhang, Y. Kang, W. Liu, Y. Cui, S. Wei, N. Wang, L. Li and H. Wang, Spectrochim. Acta, Part A, 2018, 200, 226–234 CrossRef CAS PubMed.
- S. Liu, N. Zhao, Z. Cheng and H. Liu, Nanoscale, 2015, 7, 6836–6842 RSC.
- W. Gao, H. Song, X. Wang, X. Liu, X. Pang, Y. Zhou, B. Gao and X. Peng, ACS Appl. Mater. Interfaces, 2018, 10, 1147–1154 CrossRef CAS PubMed.
- Y. Liu, W. Duan, W. Song, J. Liu, C. Ren, J. Wu, D. Liu and H. Chen, ACS Appl. Mater. Interfaces, 2017, 9, 12663–12672 CrossRef CAS PubMed.
- J. Huang, Y. He, Z. Zhang, B. Lei and W. Wu, J. Lumin., 2019, 215, 116640 CrossRef CAS.
- H. Sze and S. Chanroj, Plant Physiol., 2018, 177, 875–895 CrossRef CAS PubMed.
- J. K. Pittman, Front. Plant Sci., 2012, 3, 11 Search PubMed.
- Y. Liu, K. A. White and D. L. Barber, Front. Oncol., 2020, 10, 1401 CrossRef PubMed.
- K. A. White, K. Kisor and D. L. Barber, Cancer Metastasis Rev., 2019, 38, 17–24 CrossRef CAS PubMed.
- Y. Decker, E. Nemeth, R. Schomburg, A. Chemla, L. Fulop, M. D. Menger, Y. Liu and K. Fassbender, Neurobiol. Aging, 2021, 101, 40–49 CrossRef CAS PubMed.
- G. Hao, Z. P. Xu and L. Li, RSC Adv., 2018, 8, 22182–22192 RSC.
- Y. Wen, N. Jing, F. Huo and C. Yin, Analyst, 2021, 146, 7450–7463 RSC.
- Z. P. She, Y. Tian, Y. S. Xia, J. Jie, Y. Li and C. Y. Li, Dyes Pigm., 2020, 179, 108402 CrossRef CAS.
- Y. Chen, Anal. Biochem., 2021, 612, 113900 CrossRef CAS.
- Y. Liu, Y. Wang, L. Zhao and B. Xu, J. Fluoresc., 2022, 32, 227–233 CrossRef CAS PubMed.
- Z. Guo, R. Pan, J. Cheng, L. Zhang, W. Cao and T. He, Appl. Phys. A: Mater. Sci. Process., 2020, 126, 160 CrossRef CAS.
- Y. Sun, X. Wang, C. Wang, D. Tong, Q. Wu, K. Jiang, Y. Jiang, C. Wang and M. Yang, Microchim. Acta, 2018, 185, 83 CrossRef PubMed.
- X. Ye, Y. Xiang, Q. Wang, Z. Li and Z. Liu, Small, 2019, 15, 1901673 CrossRef CAS.
- L. J. Rothschild and R. L. Mancinelli, Nature, 2001, 409, 1092–1101 CrossRef CAS.
- L. Qiao, J. Wang, M. Zheng and Z. Xie, Anal. Methods, 2018, 10, 1863–1869 RSC.
- J. L. Tan, T. T. Yang, Y. Liu, X. Zhang, S. J. Cheng, H. Zuo and H. He, Luminescence, 2016, 31, 865–870 CrossRef CAS PubMed.
- M. Futai, T. Oka, G. H. Sun-Wada, Y. Moriyama and Y. Wada, J. Exp. Biol., 2000, 203, 107–116 CrossRef CAS PubMed.
- Y. Zhang, Y. Wu, J. Wang, Y. Hu, W. Fang, J. Dang, Y. Wu, X. Li, H. Zhao and Z. Li, ACS Sustainable Chem. Eng., 2020, 8, 16979–16989 CrossRef CAS.
- X. Wang, X. Teng, X. Sun, W. Pan and J. Wang, Spectrochim. Acta, Part A, 2022, 267, 120547 CrossRef CAS PubMed.
- Q. Zhang, R. Wang, B. Feng, X. Zhong and K. Ostrikov, Nat. Commun., 2021, 12, 6856 CrossRef CAS PubMed.
- J. C. Jin, Y. Yu, R. Yan, S. L. Cai, X. Y. Zhang, F. L. Jiang and Y. Liu, ACS Appl. Bio Mater., 2021, 4, 4973–4981 CrossRef CAS PubMed.
- Y. Xian and K. Li, Adv. Mater., 2022, 34, 2201031 CrossRef CAS PubMed.
- C. Ji, Q. Han, Y. Zhou, J. Wu, W. Shi, L. Gao, R. M. Leblanc and Z. Peng, Carbon, 2022, 192, 198–208 CrossRef CAS.
- L. Cao, M. Zan, F. Chen, X. Kou, Y. Liu, P. Wang, Q. Mei, Z. Hou, W. F. Dong and L. Li, Carbon, 2022, 194, 42–51 CrossRef CAS.
- B. Wang, Z. Wei, L. Sui, J. Yu, B. Zhang, X. Wang, S. Feng, H. Song, X. Yong, Y. Tian, B. Yang and S. Lu, Light: Sci. Appl., 2022, 11, 172 CrossRef CAS PubMed.
- K. J. Mintz, E. K. Cilingir, G. Nagaro, S. Paudyal, Y. Zhou, D. Khadka, S. Huang, R. M. Graham and R. M. Leblanc, Bioconjugate Chem., 2022, 33, 226–237 CrossRef CAS PubMed.
- L. Song, Y. Cui, C. Zhang, Z. Hu and X. Liu, RSC Adv., 2016, 6, 17704–17712 RSC.
- N. Parvin and T. K. Mandal, Microchim. Acta, 2017, 184, 1117–1125 CrossRef CAS.
- V. B. Kumar, R. Kumar, O. Friedman, Y. Golan, A. Gedanken and O. Shefi, ChemistrySelect, 2019, 4, 4222–4232 CrossRef CAS.
- L. Tang, R. Ji, X. Cao, J. Lin, H. Jiang, X. Li, K. S. Teng, C. M. Luk, S. Zeng and J. Hao, ACS Nano, 2012, 6, 5102–5110 CrossRef CAS PubMed.
- R. Bao, Z. Chen, Z. Zhao, X. Sun, J. Zhang, L. Hou and C. Yuan, Nanomaterials, 2018, 8, 386 CrossRef PubMed.
- X. Miao, X. Yan, D. Qu, D. Li, F. F. Tao and Z. Sun, ACS Appl. Mater. Interfaces, 2017, 9, 18549–18556 CrossRef CAS PubMed.
- T. Feng, Q. Zeng, S. Lu, X. Yan, J. Liu, S. Tao, M. Yang and B. Yang, ACS Photonics, 2018, 5, 502–510 CrossRef CAS.
- J. Liu, D. Li, K. Zhang, M. Yang, H. Sun and B. Yang, Small, 2018, 14, 1703919 CrossRef PubMed.
- K. J. Mintz, M. Bartoli, M. Rovere, Y. Zhou, S. D. Hettiarachchi, S. Paudyal, J. Chen, J. B. Domena, P. Y. Liyanage, R. Sampson, D. Khadka, R. R. Pandey, S. Huang, C. C. Chusuei, A. Tagliaferro and R. M. Leblanc, Carbon, 2021, 173, 433–447 CrossRef CAS.
- E. Proietti, F. Jaouen, M. Lefèvre, N. Larouche, J. Tian, J. Herranz and J.-P. Dodelet, Nat. Commun., 2011, 2, 416 CrossRef PubMed.
- W. Song, W. Duan, Y. Liu, Z. Ye, Y. Chen, H. Chen, S. Qi, J. Wu, D. Liu, L. Xiao, C. Ren and X. Chen, Anal. Chem., 2017, 89, 13626–13633 CrossRef CAS PubMed.
- X. Yang, F. Cui, R. Ren, J. Sun, J. Ji, F. Pi, Y. Zhang and X. Sun, ACS Omega, 2019, 4, 12575–12583 CrossRef CAS PubMed.
- B. Wu, X. Shi, W. Han, T. Wang, C. Wang and L. Jiang, RSC Adv., 2018, 8, 31793–31802 RSC.
- C. Zhao, X. Wang, L. Wu, W. Wu, Y. Zheng, L. Lin, S. Weng and X. Lin, Colloids Surf., B, 2019, 179, 17–27 CrossRef CAS.
- C. C. Ke, Y. C. Yang and W. L. Tseng, Part. Part. Syst. Charact., 2016, 33, 132–139 CrossRef CAS.
- D. Zhao, X. Liu, C. Wei, Y. Qu, X. Xiao and H. Cheng, RSC Adv., 2019, 9, 29533–29540 RSC.
- M. Vedamalai, A. P. Periasamy, C. W. Wang, Y. T. Tseng, L. C. Ho, C. C. Shih and H. T. Chang, Nanoscale, 2014, 6, 13119–13125 RSC.
- Y. Song, C. Zhu, J. Song, H. Li, D. Du and Y. Lin, ACS Appl. Mater. Interfaces, 2017, 9, 7399–7405 CrossRef CAS PubMed.
- X. W. Hua, Y. W. Bao, J. Zeng and F. G. Wu, ACS Appl. Mater. Interfaces, 2019, 11, 32647–32658 CrossRef CAS PubMed.
- S. Pawar, S. Kaja and A. Nag, ACS Omega, 2020, 5, 8362–8372 CrossRef CAS PubMed.
- S. Han, X. Chen, Y. Hu and L. Han, Dyes Pigm., 2021, 187, 109090 CrossRef CAS.
- X. Jia, J. Li and E. Wang, Nanoscale, 2012, 4, 5572–5575 RSC.
- S. Lu, L. Sui, J. Liu, S. Zhu, A. Chen, M. Jin and B. Yang, Adv. Mater., 2017, 29, 1603443 CrossRef PubMed.
- X. Miao, D. Qu, D. Yang, B. Nie, Y. Zhao, H. Fan and Z. Sun, Adv. Mater., 2018, 30, 1704740 CrossRef.
- H. Wang, C. Sun, X. Chen, Y. Zhang, V. L. Colvin, Q. Rice, J. Seo, S. Feng, S. Wang and W. W. Yu, Nanoscale, 2017, 9, 1909–1915 RSC.
- S. Wu, W. Li, Y. Sun, X. Zhang, J. Zhuang, H. Hu, B. Lei, C. Hu and Y. Liu, J. Colloid Interface Sci., 2019, 555, 607–614 CrossRef CAS PubMed.
- S. Zhu, Q. Meng, L. Wang, J. Zhang, Y. Song, H. Jin, K. Zhang, H. Sun, H. Wang and B. Yang, Angew. Chem., Int. Ed., 2013, 52, 3953–3957 CrossRef CAS PubMed.
- A. Kundu, B. Park, J. Oh, K. V. Sankar, C. Ray, W. S. Kim and S. C. Jun, Carbon, 2020, 156, 110–118 CrossRef CAS.
- J. Wang, Y. Zhu and L. Wang, Chem. Rec., 2019, 19, 2083–2094 CrossRef CAS.
- C. Xia, M. Cao, J. Xia, G. Zhou, D. Jiang, D. Zhang, J. Wang and H. Li, J. Mater. Chem. C, 2019, 7, 2563–2569 RSC.
- X. Ye, Y. Xiang, Q. Wang, Z. Li and Z. Liu, Small, 2019, 15, 1901673 CrossRef CAS.
Footnote |
| † Electronic supplementary information (ESI) available. See https://doi.org/10.1039/d2ra04026c |
| This journal is © The Royal Society of Chemistry 2022 |

