
 Open Access Article
 This Open Access Article is licensed under a
 Creative Commons Attribution 3.0 Unported Licence
Bioprinting-based automated deposition of single cancer cell spheroids into oxygen sensor microelectrode wells
Johannes
Dornhof†
 a,
Viktoria
Zieger†
b,
Jochen
Kieninger
a,
Daniel
Frejek
c,
Roland
Zengerle
bc,
Gerald A.
Urban
a,
Sabrina
Kartmann
bc and
Andreas
Weltin
*a
a,
Viktoria
Zieger†
b,
Jochen
Kieninger
a,
Daniel
Frejek
c,
Roland
Zengerle
bc,
Gerald A.
Urban
a,
Sabrina
Kartmann
bc and
Andreas
Weltin
*a
aLaboratory for Sensors, IMTEK – Department of Microsystems Engineering, University of Freiburg, Freiburg, Germany. E-mail: weltin@imtek.de
bLaboratory for MEMS Applications, IMTEK – Department of Microsystems Engineering, University of Freiburg, Freiburg, Germany
cHahn-Schickard, Freiburg, Germany
First published on 10th October 2022
Abstract
Three-dimensional (3D) cell agglomerates, such as microtissues, organoids, and spheroids, become increasingly relevant in biomedicine. They can provide in vitro models that recapitulate functions of the original tissue in the body and have applications in cancer research. For example, they are widely used in organ-on-chip systems. Microsensors can provide essential real-time information on cell metabolism as well as the reliability and quality of culture conditions. The combination of sensors and 3D cell cultures, especially single spheroids, is challenging in terms of reproducible formation, manipulation, and access to spheroids, precise positioning near sensors, and high cell-to-volume ratios to obtain meaningful biosignals in the most parallel approach possible. To overcome this challenge, we combined state-of-the-art bioprinting techniques to automatically print tumour spheroids directly into microwells of a chip-based electrochemical oxygen sensor array. We demonstrated highly accurate and reproducible spheroid formation (diameter of approx. 200 μm) and a spheroid deposition precision of 25 μm within a volume of 22 nl per droplet. Microstructures and hydrogel-coated microwells allowed the placement of single MCF-7 breast cancer spheroids close to the sensor electrodes. The microelectrode wells were sealed for oxygen measurements within a 55 nl volume for fast concentration changes. Accurate and stable amperometric oxygen sensor performance was demonstrated from atmospheric to anoxic regions. Cellular respiration rates from single tumour spheroids in the range of 450–850 fmol min−1 were determined, and alterations of cell metabolism upon drug exposure were shown. Our results uniquely combine bioprinting with 3D cell culture monitoring and demonstrate the much-needed effort for facilitation, parallelization, sensor integration, and drug delivery in 3D cell culture and organ-on-chip experiments. The workflow has a high degree of automation and potential for scalability. In order to achieve greater flexibility in the automation of spheroid formation and trapping, we employed a method based on drop-on-demand liquid handling systems, instead of the typical on-chip approach commonly used in microfluidics. Its relevance ranges from fundamental metabolic research over standardization of cell culture experiments and toxicological studies, to personalized medicine, e.g. patient-specific chemotherapy.
1 Introduction
Microtissues, organoids, and spheroids are three dimensional (3D) cell agglomerates that can replicate specific functions of organs or tissues in a cell culture model. They are becoming increasingly attractive both from their vast application perspective in cell biology and biomedicine and regarding the increasing number of microsystems and microfluidic lab-on-chip devices that utilize them. Microsensors can deliver essential information on cell metabolism and culture conditions continuously and in situ. Integrating microsensors, as well as microsystems and microfluidics in general, into 3D cell cultures, presents time- and resource-consuming challenges: general microfluidic handling, reliable cell culturing to generate consistent microtissues, confinement or trapping to isolate and manipulate them, and, in our case, getting them close enough to a sensor in order to obtain meaningful biosignals. Therefore, we introduce a bioprinting approach based on drop-on-demand printing1 that offers a high degree of automation and flexibility for liquid, drug, and cell handling, in order to print spheroids or any 3D cell culture directly onto a sensor chip and into oxygen microsensor wells.Potential therapeutics for the treatment of diseases like cancer are currently mostly tested on animal models or two-dimensional (2D) cell monolayers of the respective cancer type before being tested on humans. However, after successfully passing these preclinical trials, only a minimal portion of them will ever be used to treat a patient2 as the majority of candidates have proven ineffective or have adverse effects. The reason for that is an inadequate representation of the actual situation in the affected tissue or organ. Especially in 2D cell cultures, cells lack intercellular interaction and physiological concentration gradients of solute metabolites, signalling molecules, and other growth-determining factors.3 Cells growing into 3D spherical networks, overcome these limitations and begin to gradually replace such traditional models. For cancerous tissue in particular, 3D cell cultures have shown a higher resistance to chemotherapeutic agents and significantly better replication of the in vivo situation compared to 2D equivalent.4
Scaffold-based spheroids can form spontaneously within matrix-based cultures from single cell-level embedded into an artificial extracellular matrix (ECM). Such an approach leads to a heterogeneous culture with a rather broad size distribution.5 Additionally, the choice of ECM hydrogel significantly determines the properties of the culture,6e.g. with regard to the availability of metabolites, and can vary greatly, so that comparability between experiments with different ECMs and their standardization can be insufficient. In addition, there are scaffold-free approaches where several individual cells in suspension typically aggregate and form a compact spherical cell network either in ultra-low attachment plates, hanging droplets, microfluidic devices, rotating bioreactors, microwells, or by magnetic manipulation.7 In contrast to conventional ECM-based methods, such a forced formation of spheroids results in a shorter forming time with improved homogeneity and is therefore highly suited for high-throughput evaluations.
Besides the precise formation of spheroids, an accurate assessment of the cell state is essential for a reliable analysis of properties or reactions of the cells. Established methods include optical observation in combination with staining techniques. These can be applied to analyse a variety of different biological markers with a high selectivity and throughput. However, many of the commonly used staining dyes interact with the cells and are only suitable for an end-point analysis making continuous measurements of changes in cell characteristics extremely challenging. By introducing microsensors into the microenvironment of the cells, such changes can be recorded in real-time with a high spatiotemporal resolution.8 In particular, respiration rates are key indicator for cell viability and changes in cellular metabolism. Consequently, sensor-based measurements of dissolved molecules involved in the cell metabolism, can be used as indicating parameters for pharmacodynamics of active compounds and metabolic transformations.
Therefore, mostly electrochemical and optical microsensors were integrated into platforms for cultivation of 2D9–19 and matrix-based 3D17,20–24 cultures. However, most microsystems lack scalability, and more efforts toward high-throughput measurements are required.16 For more detailed analyses of metabolites and the biochemical microenvironment, the access to single spheroids is desirable, including a high cell to media volume ratio, which is challenging due to the small size of the microtissues. Thus, electrochemical electrodes were integrated into hanging droplet systems for a highly precise measurement of the lactate production25 and glucose consumption25,26 of single microtissues. Measuring the oxygen consumption, on the other hand, is highly challenging in such open systems. Bavli et al.27 successfully integrated oxygen-sensing microbeads into single spheroids, which is an invasive approach and therefore not ideal in situations where no interaction between measurement element and cells is desired. Optical analysis systems, in which the oxygen content of single spheroid cultures can be measured, e.g. the Seahorse XFe96 Analyzer,28 are based on optical sensors with embedded fluorophores. However, their non-linear transfer function reduces the accuracy at low oxygen concentrations, in contrast to electrochemical sensors.
Other non-invasive approaches to measure the dissolved oxygen concentration in the microenvironment of single spheroids can be categorized into needle-type probes and chip-based devices.29 Needle-type microsensor probes30–32 consist of an electrode tip and can be used to measure the local oxygen concentration within a spheroid or at certain distances to its surface to profile the environment and obtain a dependency of concentration and position. Since they require a continuous re-positioning, they are less suitable for simultaneous evaluations of many spheroids in parallel. Chip-based approaches33–35 incorporate microsensors into the culture volume, such as microfluidic structures or microwells, and are more suitable to monitor the overall microenvironment in high-throughput.
Controlling the precise positioning of cell aggregates opens new perspectives for the microsensor-based assessment of the sample. Bioprinting has proven to be a powerful technology to control the spatial arrangement of cells in 2D or 3D. Whereas most approaches use bioinks with cell suspension,36–39 the printing of 3D cell aggregates, such as spheroids or organoids, is less common and increases the complexity. However, many current problems, such as the use of physiologically relevant 3D in vitro models, the handling of patient-derived microtissues or the generation of complex tissue models, show the high need for controlled processing and positioning of 3D cell aggregates.1,36,40,41 Recently, Chen, et al.40 reported a bioprinting approach in which microtissues are precisely deposited in droplets generated using acoustic waves. However, the complexity of the experimental setup and the small reservoir volume limit a robust and standardized automation for large-scale single spheroid deposition. Other approaches rely on pick-and-place, such as the method reported by Heo, et al.41 and Ayan, et al.,42 which used a glass capillary to lift single spheroids out of a reservoir with an applied negative pressure. Since the lifting pressure is strongly dependent on the spheroid size and the used medium, and since strong local forces act on the spheroids for a short time, the generalization of the method is difficult. In contrast, drop-on-demand (DoD) methods where the droplets are dispensed via a microvalve (spheroOne® Cellenion SASU, France) or by mechanical deformation of an elastic tube1 have proven to be compatible with a large range of different samples and offer a simplified implementation.
In this work, we have combined for the first time an advanced 3D bioprinting process1 for deposition of spheroids or arbitrary 3D cell culture models, with a microsensor platform with embedded amperometric oxygen sensor electrodes. Here, breast cancer spheroids were automatically deposited via DoD directly into microsensor wells of nanoliter-range volumes, bringing sensor and microtissue in close contact. In this paper, the spheroid formation and deposition using bioprinting techniques are discussed. Electrochemical oxygen sensors allowed the precise and reproducible determination of single spheroid metabolic rates, including changes upon cancer drug exposure. Our approach explores advanced and automated microtissue manipulation together with the integration of sensors in 3D cell culture, towards more efficient and parallelized procedures, e.g. in drug screening.
2 Concept: bioprinting of spheroids onto microsensors
For successful access to the oxygen consumption and metabolism of bioprinted single spheroids via microsensors, numerous boundary conditions must be fulfilled: (i) sensor and spheroid must be brought into close proximity to each other in a controlled manner; (ii) remain in that position for hours to ensure a reliable sensor result and (iii) have approximately the same size in the micrometre-range; (iv) the culture volume must be below microlitre-range for single spheroids30 to guarantee a measurable concentration change; (v) the volume in which measurements are taken must be sealable from the external environment to prevent an undesired influx of additional oxygen and (vi) long-term stability of the sensor within the complex measurement electrolyte must be ensured over the whole experiment. At the same time, the platform has to be compatible with the DoD bioprinting process.The electrochemical sensor platform consists of a glass chip with an array of nine circular (Ø 200 μm) platinum microelectrodes on its surface, fabricated on a wafer-level9 (Fig. 1b). Dedicated microwells (Ø 500 μm) patterned with permanent epoxy-based photoresist confine single spheroids at the electrodes and allow the real-time acquisition of the oxygen concentration directly within their microenvironment for monitoring both, culture conditions and cellular respiration. Breast cancer spheroids are cultured outside the platform and individually printed by DoD directly into the microelectrode wells, using a bioprinting technique1 developed at the Laboratory for MEMS Applications (Fig. 1a and b). The bioprinting accomplishes the otherwise demanding and time-consuming tasks of trapping and precisely positioning spheroids in small volumes and close to the sensor electrodes. Its high degree of automation allows parallelization and offers flexibility as well as powerful liquid handling options, e.g. for drug delivery. Spheroid integrity and viability are maintained without the use of artificial ECM, allowing reproducible measurement of metabolic changes in response to external stimuli over several hours and simple isolation of the microtissues for further analyses.
 | ||
| Fig. 1 Single spheroid deposition set-up and oxygen-sensing microwells. (a) Scheme of the bioprinting process: spheroids, homogeneously distributed in a reservoir, are transferred fully automatically into microwells with embedded oxygen sensors by means of a droplet dispenser. All components are software-controlled. (b) PipeJet® nanodispenser with the protruding capillary nozzle above the sensor glass chip with microwell array and electrode layout. (c) Cross-sectional view of one oxygen sensor well showing all relevant components and materials of the system. | ||
Oxygen sensor microelectrodes are located at the bottom of the microwells. The electrodes and the entire bottom of the microwell are coated with a poly(2-hydroxyethyl methacrylate) (pHEMA)-based hydrogel membrane, which serves as a diffusion limitation for the oxygen measurement and a spacer between the spheroid and the electrode surface (Fig. 1c). The hydrogel's cell repellent properties prevent cell adhesion and spheroid disintegration. It is important that the concave shape of the hydrogel layer ensures a centred position of the settling spheroid, approximately 25 μm above the microelectrode. A platinum counter electrode and two silver/silver chloride reference electrodes are embedded into the chip surface for electrochemical measurements in a 3-electrode configuration.
To limit the available oxygen during respiration measurements, the microelectrode wells are covered in regular intervals with a glass slide ensuring a small measurement volume around the spheroid of just 55 nl. The confinement of the single spheroid in such a low volume leads to a metabolite concentration change within minutes, resulting in meaningful drug screening results after several hours. Such a non-invasive and label-free approach facilitates an accurate and simple evaluation of metabolic activity during exposure to stimuli and medication, as exemplified on basis of a metabolism-altering drug. This unique combination of precise micromanipulation of individual cancer spheroids and oxygen monitoring within their microenvironment offers the possibility of fully automated high-throughput evaluation of drug screenings as a perspective with regard to, for example, personalized chemotherapy.
3 Methods
3.1 Sensor platform fabrication
Fabrication of the measurement platform started with the processing of the sensor glass chips on a 500 μm thick 4 inch Pyrex borosilicate glass wafer. The wafer was first coated with 500 nm silicon nitride by plasma enhanced physical vapour deposition (PECVD). On top of this insulating layer, a 1.4 μm thick film of the image reversal resist AZ 5214E (Clariant, Switzerland) was spin-coated and patterned through a chromium mask by UV light exposure using the mask aligner MA6B (Süss MicroTec, Germany). 50 nm titanium, 100 nm platinum, and 20 nm titanium were subsequently evaporated and structured in a lift-off process, whereby the titanium layers promoted adhesion of the electrode material platinum. In a second PECVD step, the whole wafer surface was covered with an insulation stack of 800 nm silicon nitride and 200 nm silicon oxide. The insulation was partly opened by reactive ion etching (RIE) to uncover the electrodes and contact pads using a previously patterned mask of the positive resist AZ 1518 (Clariant, Switzerland).Electrode rims and the walls of the microelectrode wells (Fig. 1b and c) were formed by patterning the permanent epoxy resist SU-8 3000 (Kayaku Advanced Materials, USA) in a two-mask photolithography process. Rim structures around reference, counter, and working electrodes were created by a first 40 μm thick layer of SU-8 3025 through spin-coating, soft-baking, exposure to 360 mJ cm−2 UV light and a post-exposure baking step. Subsequently, three consecutive layers of SU-8 3050, each 80 μm thick, were spin-coated. Each layer was soft-baked for 5 min at 65 °C and 25 min at 95 °C. In all baking steps, temperature was continuously increased and decreased at 2 °C min−1 to minimize delamination of the resist caused by thermal stress. The final 280 μm thick SU-8 layer stack was exposed to 1000 mJ cm−2 UV light through an additional chromium mask and post-exposure baked at 65 °C for 5 h to pattern the circular microelectrode wells. Structures were developed in 1-methoxy-2-propanol acetate (Sigma-Aldrich, USA) for 75 min and hard-baked for 3 h at 150 °C.
For silver/silver chloride reference electrode fabrication, a 10 μm thick silver layer was deposited by electroplating onto the bare platinum at −16 mA cm−2 for 10 min in Arguna S solution (Umicore Galvanotechnik, Germany) and partly converted to silver chloride in 0.1 M KCl solution at 1.6 mA cm−2 for 20 min. After wafer-dicing, 21 chips per wafer were obtained and flip-chip bonded onto a custom-made printed circuit board (PCB) with the electrically conductive adhesive Polytec EC 242 (Polytec PT, Germany) and cured at 100 °C for 20 min to electrically connect the electrodes via a plug-in connector with the potentiostat. The glass chip was additionally bonded to the PCB by underfilling the biocompatible epoxy-based adhesive Epo-Tek 302-3M (Epoxy Technology, USA) with subsequent curing at room temperature for 24 h in order to seal the electrical connections against cell culture medium.
Reference and working electrodes were coated with a hydrogel membrane composed of pHEMA by manual dispensing of approximately 2 nl into the electrode rims under a stereomicroscope and subsequent curing under UV light. A detailed description of the hydrogel precursor composition can be found elsewhere.19 A volume of 20 nl of the same hydrogel was dispensed into the cavity between electrode rim and the wall of the microelectrode well (Fig. 1c) and was subsequently UV-cured. Thus, the entire bottom of the microelectrode well, including the oxygen sensor, was covered with a hydrogel membrane on which the spheroid is placed before measurement.
3.2 Cell culture and spheroid formation
MCF-7 human breast cancer cells (cell line obtained from BIOSS Centre for Biological Signalling Studies, Freiburg, Germany) were cultured in Dulbecco's modified Eagle medium (DMEM), high glucose, GlutaMAX Supplement, pyruvate (Thermo Fisher Scientific, USA) supplemented with 10% fetal bovine serum (FBS, Thermo Fisher Scientific, USA) and 1% penicillin/streptomycin (Thermo Fisher Scientific, USA). Harvested cells were resuspended in 3D Tumorsphere Medium XF (PromoCell, Germany), also supplemented with 10% FBS and 1% penicillin/streptomycin, with a concentration of 3.2 × 10⁴ cells per ml, unless stated otherwise.Cancer cell spheroids were generated via hanging-drop method, which is based on the deposition of cell suspension drops by a non-contact dispenser on a target plate. The plate with arrays of drops is rotated 180 degrees and incubated at 37 °C, 95% air humidity and 5% CO2. Due to gravitational forces, cells accumulate in the lowest point of the drops and form dense 3D cell aggregates due to cell–cell contacts. For this study, an automated non-contact liquid dispenser (I.DOT, DISPENDIX, Germany) was used to produce arrays of 2 μl drops. In brief, cell suspension was filled into the source wells of a dispensing plate (S.100 S, DISPENDIX, Germany). Each source well is equipped with a nozzle at the bottom. The desired drop volume of cell suspension was then dispensed by positive pressure in a 384 micro well plate format array into the lid of a one-well plate (Kisker Biotech, Germany). The lid was then placed on top of the bottom part, which was filled with phosphate buffered saline (PBS) to prevent evaporation of the drops. The plates with the hanging drop arrays remained in the incubator for four days. After this time, spheroids had formed with a diameter of 199 μm ± 46 μm and were harvested by rinsing the plate lid with PBS. Spheroids were collected in a 15 ml tube and centrifuged at 200 g for 5 min. The supernatant was carefully removed, and the spheroids were resuspended in Tumorsphere Medium at a concentration of 1000 spheroids per ml.
Cell viability of the spheroids was determined with a Live/Dead assay following the manufacturer's protocol (LIVE/DEAD™ Viability/Cytotoxicity Kit, for mammalian cells, Thermo Fisher, USA). Briefly summarized, the spheroids were incubated for 30 minutes at room temperature in a 2 μM calcein-AM and 6 μM ethidium homodimer-1 PBS solution. Fluorescent images were acquired with excitation wavelengths of 470 nm and 555 nm with an Observer Z1 microscope (Carl Zeiss, Germany). A 2D cross-sectional image of each spheroid was recorded from three independently conducted examinations. The green color channel showed the calcein-AM signal of living cells and the red color channel showed the fluorescent signal of dead cells due to ethidium homodimer-1 staining of ruptured cell membranes. Viability was calculated as the ratio of the number of living cells and the number of total counted cells per spheroid.
3.3 Bioprinting of single spheroids into microelectrode wells
Single spheroid printing into the microelectrode wells was achieved with an in-house built platform for automated single spheroid deposition which is schematically shown in Fig. 1a and b. The method was based on the concept by Gutzweiler and Kartmann et al.1 A 15 ml tube containing the spheroid suspension was placed into the platform and a thin polyimide capillary with an inner diameter of 250 μm (Zeus Industrial Products, USA) was inserted into the reservoir with one end and clamped into a non-contact nano-droplet dispenser (PipeJet® nanodispenser, Biofluidix, Germany) with the other end. The periodical movement of the PipeJet's piezo stack actuator caused a squeezing of the tube, which resulted in drops being dispensed. Capillary forces refilled the tube with spheroid suspension from the reservoir after every droplet ejection. A uniform distribution of spheroids in the reservoir and the associated continuous transport of spheroids to the dispenser was maintained by gently pumping the reservoir volume up and down every 5 s at 0.5 ml s−1 using a syringe pump.The volume of the dispensed droplets was determined via computer-based image processing.43,44 For this purpose, images of free-flying droplets were acquired with a CMOS camera (nozzle camera, IDS UI-3280CP-M-GL R2, IDS Imaging Development Systems, Germany). Background subtraction of these images was performed, and the drop contour was determined. Then, each pixel row of the drop was treated as a cylinder and the volume of each cylinder stack was summed to estimate the total volume of the droplet.
A motorized xy-stage (Motorized XY aperture stage, 100 mm × 120 mm travel, Zaber Technologies, Canada), on which the target substrate was loaded, controlled the impact position of the droplet. The center coordinates of the impact position were determined by detecting a test drop with a CMOS camera (print position camera, U3-3890CP-M-GL Rev.2, IDS Imaging Development Systems, Germany) and computer-based image processing. For the subsequent spheroid deposition, these coordinates were used as reference printing position.
To enable single spheroid printing, the nozzle region close to the orifice of the capillary protruding the PipeJet was illuminated with a strip LED and observed with the nozzle camera. As soon as a single spheroid was detected in the nozzle region and was to be ejected with the next drop, the motorized xy-stage moved to the microelectrode well at the previously determined reference printing position. The successful drop placement in the well was verified with the print position camera. Two additional drops without spheroids were added to entirely fill the volume of the wells.
3.4 Electrochemical oxygen measurements
The multi-channel potentiostat MultiPalmSens4 (Palmsens, The Netherlands) was used for electrochemical measurements in all experiments and electrically connected to the respective working electrodes, on-chip reference, and counter electrode for simultaneous read-out of multiple sensor electrodes. Before oxygen measurements, which were performed at 37 °C, all sensor electrodes were electrochemically cleaned by performing 100 anodic/cathodic potential cycles at 0.7 VAg/AgCl and −0.4 VAg/AgCl, respectively. A combined chronoamperometric/active potentiometric protocol was used to measure the dissolved oxygen concentration. The chronoamperometric part consisted of the consecutive application of (1) 0.7 VAg/AgCl for 1 s, (2) −0.4 VAg/AgCl for 1 s, (3) −0.3 VAg/AgCl for 3 s. It was followed by an open-circuit phase for 25 s or 55 s for active potentiometric measurement,45 as well as to minimize electrode on-time in which oxygen is consumed (4 s at negative potential), which amounts 13.3% and 6.7% of the total time, respectively. Unless otherwise stated, sensor currents were recorded at an acquisition rate of 4 Hz, and the mean current value of the penultimate 500 ms during the final cathodic pulse (3) was used for amperometric data evaluation. Potentiometric values were taken 20 s after the end of the chronoamperometric measurement.Sensor calibration was performed in 0.1 M PBS and cell culture medium by changing the ratio of air and nitrogen within the electrolyte by means of the gas mixing station GMix41 (Hitec-Zang, Germany). Microelectrode wells were covered with a glass slide in order to isolate their inner volume and to prevent gas exchange with the surrounding electrolyte, as required for respiration measurements. An oxygen concentration of 186.5 μM was assumed for both, PBS and cell culture medium, at atmospheric oxygen conditions.
For cell-related experiments, the spheroids were first printed into the microelectrode wells using the method mentioned above, followed by pipetting 0.5 ml cell culture medium onto the glass sensor chip so that a bubble-free wetting of all electrodes and microelectrode wells was ensured. Excessive convection during filling was avoided to maintain integrity of the spheroids within the microelectrode wells. To determine respiration rates during the oxygen measurement, the microelectrode wells were periodically opened and closed for 10 minutes, respectively. Oxygen sensors were calibrated after the measurements by performing a one-point calibration and taking the signal at air saturation as reference. Antimycin A (Sigma Aldrich, USA) was used for drug exposure experiments.
3.5 Data presentation and statistical analysis
The box plots shown extend from first to third quartile of the data, the median is shown as centre line. The whiskers extend from the edges of each box to the last data point in the 1.5× interquartile range and outliers are shown as circles. The heights of bars in bar plots correspond to the mean values of the data with error bars as ± standard deviation (s.d.). Mean values are stated with ± s.d.Statistical assessment was based on the two-sided t-test if not otherwise stated, whereas normal distribution was tested with the D'Agostino–Pearson test for normality. p-Values ≥ 0.05 were considered not being significant while significant p-values were categorized as *p < 0.05, **p < 0.01 and ***p < 0.001.
4 Results and discussion
4.1 Accuracy and precision of the printing position
Verification of sufficient accuracy and precision of the bioprinting process to provide pinpoint spheroid deposition into the microelectrode well was investigated with a NBS 1952 Resolution Test Target Slide (Thorlabs, USA) used for calibrating the camera. For this purpose, the impact position of an ejected drop was first determined and subsequently used as a reference position. The target cross of the NBS slide was then positioned at these reference coordinates with the motorized xy-stage. Drop impact position reproducibility (precision) and deviation from target (accuracy) were determined by dispensing individual drops of either pure PBS or PBS containing a single spheroid. Images of the resulting drop position were captured with the calibrated print position camera. The center of the impact position was determined with OpenCV Library and Python programming, and the deviation of the drop center to the target cross was identified (Fig. 2a). The mean distance to the target of 30 individual pure PBS drops was 7.2 μm ± 3.3 μm, the mean distance of 23 individual PBS drops containing a single spheroid was 25 μm ± 13 μm. With regard to the target position, a printing accuracy and precision of pure PBS droplets of 2.0 μm ± 3.6 μm and 3.2 μm ± 4.2 μm in x and y direction was achieved, respectively. For PBS drops containing a single spheroid, the printing accuracy and precision in x direction was −3 μm ± 22 μm and in y direction −10 μm ± 13 μm. A rough analysis of the spheroid size in printed droplets using ImageJ showed no correlation between the spheroid diameter and the droplet deflection. In addition, the volume and the largest horizontal expansion of the droplet just above the sensor well of 19 free-flying PBS drops and of 19 free-flying PBS drops with a spheroid were determined with the nozzle camera43 (Fig. 2b). At its widest point, the PBS drop diameter was 334.1 μm ± 6.4 μm with a total volume of 22.22 nl ± 0.22 nl. Interestingly, the mean diameter of drops containing a spheroid of 342.9 μm ± 9.8 μm and the mean volume of 22.15 nl ± 0.28 nl did not differ significantly from pure PBS drops. We assume that the slightly poorer accuracy and precision of the printing process for drops with spheroids are caused by varying spheroid position in the capillary just before the drop is ejected, the drop inhomogeneity as well as the slightly different weight, varying density and viscosity due to the biological cell material the drop contained. The largest horizontal expansion of the free-flying drop shortly before it enters the microelectrode well was a relevant indicator to assess if the accuracy and precision of the bioprinting process was sufficient for spheroid deposition into the well. If the droplet impact position was too far from the center of the microelectrode well, the droplet would hit the well edges and potentially stick to it, possibly resulting in the spheroid not being positioned within the well. With the ascertained maximum droplet expansion, the distance of a perfectly centered free-flying drop to the border of the microelectrode well would be 82.95 μm ± 3.2 μm for a pure PBS drop and 78.6 μm ± 4.9 μm for a PBS drop containing one spheroid, respectively. Regarding this matter, the previously determined deviation of the impact position of the drops to the target was small compared to this margin. Therefore, the successful, highly precise deposition of single spheroids into sensor wells could be achieved and is exemplarily shown in Fig. 2c.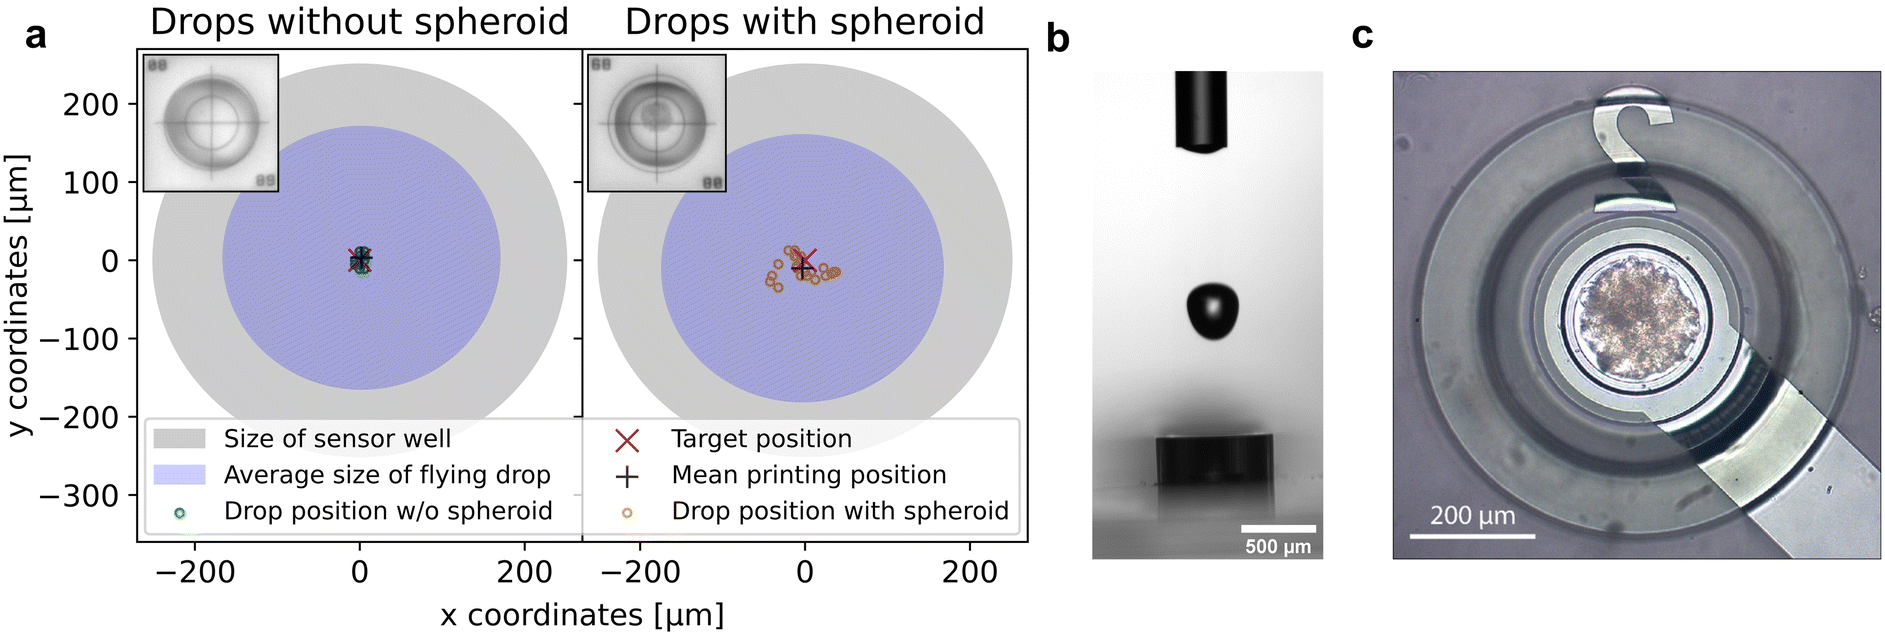 | ||
| Fig. 2 Accuracy and precision of the impact position regarding single spheroid deposition. (a) Impact position of individually printed drops (nw/o spheroid = 30, nwith spheroid = 23) in relation to an initially determined reference printing position (red cross). The mean impact position is displayed by the black cross. The insets show exemplary drops of pure PBS or of PBS containing a spheroid positioned on the NBS 1952 resolution test target slide (crosshair of the slide has a length and width of 610 μm). For clarity, the largest mean diameter of a free-flying droplet just above the sensor well is shown in blue and the size of the sensor well is shown in grey. (b) Side view of a PBS drop ejected from the nozzle and falling into the sensor well. (c) Exemplary image of a spheroid successfully deposited into a sensor well. | ||
4.2 Automated single spheroid deposition
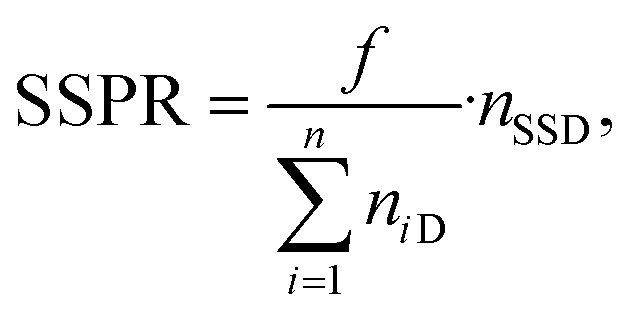
To automatically deposit single spheroids into the microelectrode wells, we used an in-house developed spheroid-printing algorithm based on Gutzweiler, et al.1 The nozzle region close to the orifice of the capillary where the droplets were ejected was optically monitored with the nozzle camera system. Passing spheroids were detected and tracked. The algorithm was able to predict how many spheroids would be contained in the next ejected droplet to make a decision on where to deposit it. Dispensed droplets can be categorized into single-spheroid droplets (SSD) containing exactly one spheroid, multi-spheroid droplets (MSD) containing more than one spheroid and zero-spheroid droplets (ZSD) containing no spheroids.In order to quantify the single-spheroid printing rate (SSPR), the system was set to eject droplets into 30 different wells of a 96 micro well plate until a droplet with at least one spheroid was dispensed. The experiment was repeated three times. Afterwards, the number of spheroids in each well was counted with a 4× microscope. The SSPR was calculated according to:
 | (1) |
| Reservoir concentration [spheroids per ml] | SSPR [min−1] |
|
PAA [%] |
|---|---|---|---|
| 300 | 1.9 ± 0.6 | 88.9 ± 1.9 | 93.3 ± 3.3 |
| 1000 | 6.1 ± 1.5 | 88.9 ± 3.8 | 93.3 ± 3.3 |
| 2000 | 15.2 ± 6.9 | 81.1 ± 3.8 | 86.7 ± 8.8 |
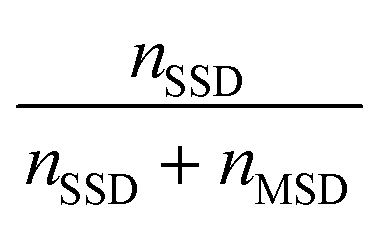
Next, the printing algorithm accuracy (PAA) was analysed. The PAA describes the accuracy of the software algorithm in determining the number of spheroids ejected with the last drop. Accurately detecting which spheroids were ejected depends on both the spheroid detection in the capillary and the tracking algorithm. In order to assess the PAA, the spheroid counts per well extracted from the software were compared with the counted spheroids under the microscope. The PAA for different spheroid concentrations in the reservoir can be found in Table 1 and was determined as:
 | (2) |
A concentration of 1000 spheroids per ml has proven to be an advantageous spheroid concentration in the reservoir. The high accuracy with which the spheroids were detected and automatically deposited, as well as the high probability that the drops contained no more than one spheroid, guaranteed a low-loss and reliable single spheroid deposition process with sufficient efficiency. For the oxygen measurement, only SSDs were deposited into the microelectrode wells. Empty droplets or droplets containing more than one spheroid were printed into a collection container.
4.3 Spheroid vitality and integrity after deposition
During the bioprinting process, the spheroids were subject to different possible stress factors, namely gentle mixing, aspiration, and transport through a thin capillary, ejection, and impact on a target. To rule out that the spheroid processing had negative effects on the sample and therefore producing misleading sensor signals, the cell viability and the integrity of the cell aggregates were examined.Cell viability of 58 processed spheroids was analyzed and compared to 50 harvested, but unprocessed spheroids as control (Fig. 3a and b) in three independent samples. In total, the viability analysis was carried out with 1478 cells of the control sample and 1773 cells of the processed sample. Fig. 3b shows that the mean viability of processed spheroids of 93.1% ± 5.8% did not differ significantly from the viability of the control sample of 93.9% ± 5.0%. This behavior was in accordance with the estimated shear stress due to sample mixing and bioprinting, which did not exceed 25 mPa and 60 mPa, respectively, and was therefore below or in the order of physiological relevant shear stress values.46
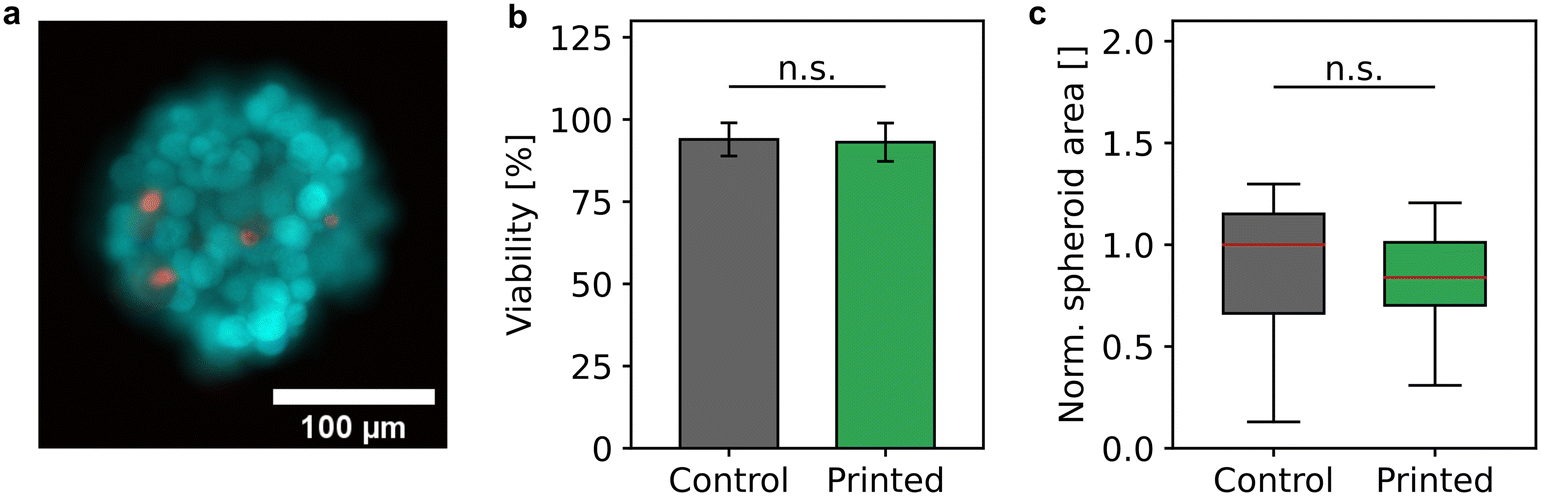 | ||
| Fig. 3 Influence of the bioprinting process on spheroid viability. (a) Representative live/dead staining of cells in a spheroid. Cyan-colorized cells were living, and red-colorized cells were dead. (b) Cell viability of unprocessed control spheroids and processed and bioprinted spheroids (NControl = 3, nControl = 50; NPrinted = 3, nPrinted = 58). (c) Spheroid area of unprocessed and processed spheroids normalized to the median of the unprocessed control sample (nControl = nPrinted = 50). P values ≥ 0.05 were considered not being significant (n.s.). | ||
In addition, the integrity was examined by determining the spheroid area before and after the bioprinting process. The contours of 50 spheroids each of the control and the processed sample were identified and the resulting area was normalized by the median of the control (Fig. 3c). The mean diameter of the unprocessed spheroids of 199 μm ± 46 μm did not differ significantly from the mean diameter of the bioprinted spheroids of 200 μm ± 26 μm indicating that spheroids remained intact after deposition.
4.4 Oxygen sensor characteristics
The dissolved oxygen concentration was measured using platinum-based amperometric microelectrodes at the microwells' bottom. Highly stable and reproducible sensor performance was achieved by applying an advanced chronoamperometric protocol, in which the platinum surface is first electrochemically cleaned by an anodic and cathodic potential pulse prior the actual oxygen measurement by its reduction at −0.3 VAg/AgCl. Transient current responses are shown for atmospheric and anoxic conditions in Fig. 4a. This method allows the oxygen reduction reaction to take place on a renewed platinum surface each time the measurement is performed, eliminating electrode fouling even in serum-containing electrolytes. Additionally, an electrode covering pHEMA-based hydrogel membrane was used to improve sensor long-term stability by preventing the settlement of blocking substances and a direct contact between spheroid and electrode surface. | ||
| Fig. 4 Oxygen sensor characteristics. (a) Transient current responses at an acquisition rate of 10 Hz during the execution of the chronoamperometric protocol used for oxygen measurement within anoxic and atmospheric oxygen concentrations in PBS. (b) Oxygen sensor signal during six calibration cycles in PBS, in which the dissolved oxygen concentration was varied by means of a gas-mixing station. (c) Oxygen calibration in cell culture medium and PBS, showing no significant difference in sensitivity. Error bars are s.d. (d) Comparison of the oxygen concentration within an open and closed microwell. While atmospheric conditions in an open microwell resulted in a constant sensor current, the current in a closed microwell decreased rapidly due to the exclusion of additional oxygen influx. | ||
Sensor calibration (Fig. 4b and c) was performed in the used cell culture medium and PBS with a high precision (relative error <2.5% across the whole measurement range) and a limit of detection of below 1 μM, based on three times the standard deviation of the blank signal. At −0.34 μA cm−2 μM−1, the sensor sensitivity was only slightly lower in cell culture medium than in PBS (−0.37 μA cm−2 μM−1). Moreover, we demonstrated in a prior work,24 that such oxygen sensors can be operated in cell culture medium over a period of one week without a measurable change in sensitivity. The sensor method allows a one-point calibration, as the sensor current is nearly zero under conditions without oxygen and increases linearly until an oxygen concentration at atmospheric conditions, eliminating time-consuming calibration measurements at various concentrations.
Since oxygen is consumed by the sensor electrodes and is only available to a limited extent within the closed low-volume microelectrode wells, minimizing oxygen uptake by the electrodes was intended. Therefore, compared to the previously reported chronoamperometric oxygen measurement protocols,9,13,18 pulse durations were reduced by 50% to a total sensor on-time of 4 s. In addition, the diffusion limiting pHEMA membrane lowered the oxygen flux to the electrode during sensor on-times, further limiting consumption.
Oxygen dissolves at the electrolyte surface and spreads within the liquid by diffusion and convection. In an uncovered microelectrode well, oxygen from the medium could reach the microelectrode well unhindered, resulting in a high steady-state current corresponding to an atmospheric oxygen concentration, as shown in Fig. 4d. Under these conditions, the sensor currents in PBS and cell culture medium were nearly the same, indicating that the same amount of oxygen dissolves in both liquids and consequently implying the same strength of the salting out effect. Once the volume in the well was sealed by a glass cover, additional influx of oxygen from the microelectrode wells' electrolyte-environment was drastically reduced. Thus, due to consumption by the electrode, the oxygen concentration began to decrease nearly linearly during the first 15 min. The concentration did not drop continuously to zero, as a small amount of oxygen still reached the inside due to a remaining gap between microelectrode well wall and cover. Instead, a concentration equilibrium established at approximately 50 μM. Since an ion flux in the electrolyte between working and counter electrode is required during the electrochemical measurement, a complete isolation of the inner volume from the electrolyte environment is impossible. Additionally, this would increase the resistance between the working and reference electrode, resulting in an undesired high potential drop. Therefore, a trade-off between gas tightness and ionic conductivity has to be found. However, since the measurements in the following did not exceed 10 minutes under closed conditions, and a nearly linear decrease in oxygen concentration was observed during this duration (Fig. 4d), it can be assumed that the amount of additional inflowing oxygen molecules is negligible for monitoring the oxygen uptake of single spheroids.
4.5 Monitoring the oxygen microenvironment of single spheroids
Fig. 5a compares the course of the oxygen concentration in a microelectrode well with an incorporated spheroid to the same microelectrode well without spheroid, before and after the addition of the aerobic metabolism-suppressing drug antimycin A. Oxygen concentration was measured continuously, once per minute. While the microelectrode well was open, the sensor currents showed a constant value that corresponded to the oxygen concentration at air saturation. In the case of the untreated spheroid, the oxygen concentration during open conditions was slightly below that atmospheric steady-state value of the blank, due to additional oxygen consumption of the spheroid. By covering the microelectrode well with a glass slide, the inner volume was isolated from its surrounding cell culture medium. This limited the amount of oxygen molecules in the well so that almost no additional oxygen could enter from the environment and solely the sensor electrode and the spheroid were responsible for a change in oxygen concentration. Due to the high cellular oxygen consumption of the untreated spheroid, the concentration decreased linearly and reached anoxic conditions after 8 minutes. After addition of 100 μM antimycin A, which stopped the aerobic metabolism of the spheroid by interrupting the mitochondrial respiratory chain,47 the decrease in oxygen was significantly reduced (by approx. 95%) and close to the course without spheroid. After 10 minutes, the glass slide was removed, resulting in an increase in sensor current as fresh cell culture medium could enter its inner volume and re-establish atmospheric conditions.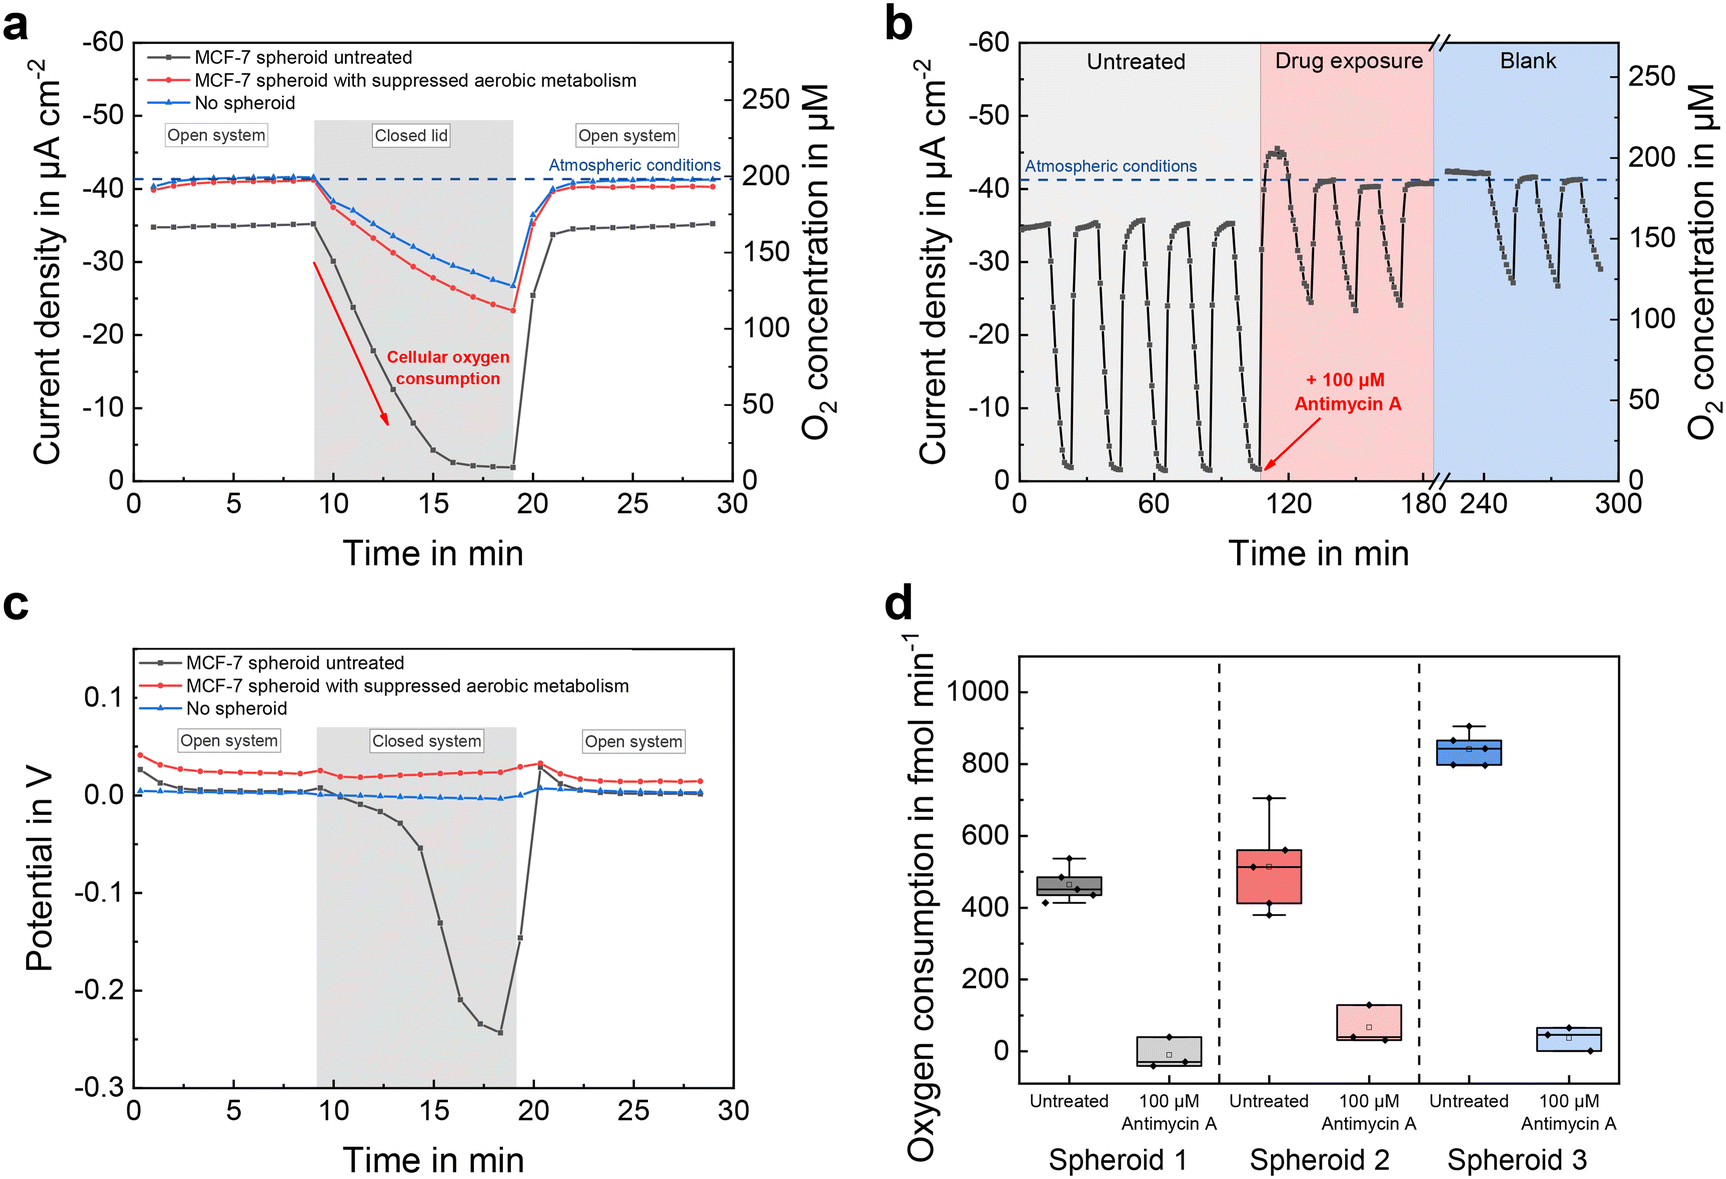 | ||
| Fig. 5 Oxygen monitoring and respiration of single MCF-7 spheroids. (a) Comparison of sensor currents during amperometric oxygen measurements with an untreated spheroid and after exposure to 100 μM antimycin A. In addition, the oxygen concentration course of a blank measurement without incorporated spheroid is shown. (b) Transient amperometric oxygen measurement in a typical long-term drug response experiment, in which the microwell is periodically covered with a glass slide. (c) Potentiometric sensor signals during OCP phases, showing a high stability of electrode potentials and a decreased equilibrium potential at low dissolved oxygen concentrations. (d) Oxygen consumption rates of three representative MCF-7 spheroids before and after the exposure to 100 μM antimycin A. The blank signal was subtracted for data evaluation. | ||
By periodically covering and opening the microelectrode wells every 10 minutes, a long-term measurement was recorded (Fig. 5b). The oxygen concentration temporarily exceeded the atmospheric baseline upon addition of the drug-containing medium, due to its lower temperature (room temperature vs. 37 °C) and consequently higher solubility of oxygen. Oxygen consumption rates could be estimated from the slopes of the decreasing sensor signals during closed conditions and are shown in Fig. 5d for three representative MCF-7 spheroids of approximately the same size (153 μm ± 8 μm, n = 3) before and after treatment, respectively. Subtraction of the blank signal eliminated the electrodes' influence on the oxygen concentration. Measured oxygen consumption rates for untreated MCF-7 spheroids at 450–850 fmol min−1 (Fig. 5d) were similar to those of previous studies,31,34,48–50 and were close to zero after antimycin A treatment. For each individual untreated spheroid, respiration rates could be measured with a high precision of 12% (n = 3 × 5) relative error. Since the deviation of one spheroid's average respiration rate was greater than the scatter within the measurements, we attribute this result to an actual increase in cellular respiration.
Besides oxygen reduction currents measured with the chronoamperometric method, electrode potentials were recorded throughout the open-circuit phases by active potentiometry. Fig. 5c shows the electrode potentials evaluated 20 s after the final cathodic pulse. At normoxic oxygen concentrations, the electrode potentials remained at a constant value, much more positive than the previously applied potential of −0.3 VAg/AgCl. That occurs because, in the presence of dissolved oxygen, the oxide-free platinum surface generated at −0.3 VAg/AgCl oxidizes to platinum oxide with the molecular oxygen reduction acting as the counter process in a local element at the working electrode. That leads to a higher pseudo-equilibrium potential after 20 s of open circuit.51 In the closed microelectrode well with untreated spheroids, the potential became more negative with decreasing oxygen concentration, because Pt oxidation happened to a lesser extent due to the lack of dissolved oxygen.
First, the active potentiometric measurements qualitatively confirmed the amperometric measurements using a different sensor principle. Second, due to the logarithmic transfer function of the potentiometric measurement, it has a higher sensitivity at low concentrations and therefore can still measure changes at the anoxic level, where the amperometric signal already is nearly constant. Third, the absence of a significant baseline potential drift of the electrodes during the measurements underlines the stability of the electrochemical cell and proper connection to the reference electrode when closing and opening the microelectrode well.
Overall, the electrochemical measurements demonstrated that electrochemical sensors can reproducibly and precisely measure dissolved oxygen concentrations online in microelectrode wells and enable determination of single tumour spheroid respiration rates within hours.
5 Conclusions
For the first time, we have demonstrated the combination of advanced DoD bioprinting techniques with chip-based microsensors, in order to print tumour spheroids directly into microsensor wells and measure single spheroid respiration rates. Using bioprinting to deposit 3D cell culture models into lab-on-a-chip sensor systems is a valuable step towards the much-needed facilitation, scale-up and parallelization in cell culture monitoring. Such efforts are desirable to reduce overall workload and increase the standardization and reliability of experiments in order to ultimately increase the adoption rate of microsystems and microsensors into higher throughput cell biology lab routines. Bioprinting offers a high degree of automation, ranging from spheroid formation, over spheroid printing to other liquid handling procedures that may be required, e.g. in drug screening or dose response measurements and can be flexibly adapted to the application. We have successfully demonstrated that bioprinting can deliver 3D cell culture models to microsensor electrodes with high spatial accuracy in the micrometre-range, with reproducible droplet volumes and a high cell viability not affected by the printing process. Off-chip spheroid generation and subsequent printing with direct measurement streamlines the workflow and allows fast access to the metabolism of fully developed spheroids. The automation solution of the bioprinting approach is compatible with a variety of different cell models and promises a potentially facile approach for co-integration of different cell types, as desired e.g. in complex tumour models or organs-on-chip. It also eliminates microfluidic structures and handling steps for spheroid deposition reducing the risk of cross-contamination by exchanging contaminated parts after every use. It meets the challenge of bringing spheroids reproducibly close to microsensors for successful low-volume, short distance measurements. The microstructures forming the electrode wells and the hydrogel coating further support the positioning of spheroids. Electrochemical oxygen microsensors allow the precise and reproducible monitoring of breast cancer spheroid respiration rates. Metabolic rates can be determined minutes after printing, and drug screening experiments can be accomplished within hours. In the future, the electrochemical sensor principle allows an easy co-integration with other sensors, such as enzymatic biosensors, e.g. for glucose and lactate, as well as reactive oxygen or nitrogen species for which microfluidic principles are less suitable due to the short diffusion length of the substances. Overall, the involved steps have a high potential for upscaling. The combination of such fully automated and highly capable spheroid manipulation and microsensor-based evaluation on a molecular level is a further milestone towards a more efficient 3D cell culture monitoring. Its relevance ranges from fundamental metabolic research, standardization of cell culture experiments, and toxicological studies to personalized medicine.Author contributions
Conceptualization: JD, VZ, JK, SK, AW; investigation: JD, VZ; software: DF; writing – original draft preparation: JD, VZ; writing – review & editing: JK, RZ, GU, SK, AW; visualization: JD, VZ, AW; supervision: JK, RZ, GU, SK, AW.Conflicts of interest
There are no conflicts to declare.Acknowledgements
We thank Tobias Lange for his assistance with cell culture. Partial funding by the German Federal Ministry of Education and Research, grant number 161L0235B, is gratefully acknowledged.References
- L. Gutzweiler, S. Kartmann, K. Troendle, L. Benning, G. Finkenzeller, R. Zengerle, P. Koltay, G. B. Stark and S. Zimmermann, Biofabrication, 2017, 9, 025027 CrossRef PubMed.
- V. Brancato, J. M. Oliveira, V. M. Correlo, R. L. Reis and S. C. Kundu, Biomaterials, 2020, 232, 119744 CrossRef CAS PubMed.
- B. Pinto, A. C. Henriques, P. M. A. Silva and H. Bousbaa, Pharmaceutics, 2020, 12, 1–38 CrossRef PubMed.
- L. A. Low, C. Mummery, B. R. Berridge, C. P. Austin and D. A. Tagle, Nat. Rev. Drug Discovery, 2021, 20, 345–361 CrossRef CAS PubMed.
- K. Moshksayan, N. Kashaninejad, M. E. Warkiani, J. G. Lock, H. Moghadas, B. Firoozabadi, M. S. Saidi and N. T. Nguyen, Sens. Actuators, B, 2018, 263, 151–176 CrossRef CAS.
- J. L. Leight, A. P. Drain and V. M. Weaver, Annu. Rev. Cancer Biol., 2017, 1, 313–334 CrossRef.
- D. Liu, S. Chen and M. Win Naing, Biotechnol. Bioeng., 2021, 118, 542–554 CrossRef CAS PubMed.
- J. Kieninger, A. Weltin, H. Flamm and G. A. Urban, Lab Chip, 2018, 18, 1274–1291 RSC.
- J. Marzioch, J. Kieninger, A. Weltin, H. Flamm, K. Aravindalochanan, J. A. Sandvik, E. O. Pettersen, Q. Peng and G. A. Urban, Lab Chip, 2018, 18, 3353–3360 RSC.
- A. Moya, M. Ortega-Ribera, X. Guimerà, E. Sowade, M. Zea, X. Illa, E. Ramon, R. Villa, J. Gracia-Sancho and G. Gabriel, Lab Chip, 2018, 18, 2023–2035 RSC.
- E. Tanumihardja, R. H. Slaats, A. D. Van Der Meer, R. Passier, W. Olthuis and A. Van Den Berg, ACS Sens., 2021, 6, 267–274 CrossRef CAS PubMed.
- W. Shang, C. Y. Chen, K. Lo, G. F. Payne and W. E. Bentley, Sens. Actuators, B, 2019, 295, 30–39 CrossRef CAS.
- A. Weltin, K. Slotwinski, J. Kieninger, I. Moser, G. Jobst, M. Wego, R. Ehret and G. A. Urban, Lab Chip, 2014, 14, 138–146 RSC.
- P. Wolf, M. Brischwein, R. Kleinhans, F. Demmel, T. Schwarzenberger, C. Pfister and B. Wolf, Biosens. Bioelectron., 2013, 50, 111–117 CrossRef CAS.
- P. Pellegrini, J. T. Serviss, T. Lundbäck, N. Bancaro, M. Mazurkiewicz, I. Kolosenko, D. Yu, M. Haraldsson, P. D'Arcy, S. Linder and A. De Milito, Cancer Cell Int., 2018, 18, 1–15 CrossRef.
- H. Azizgolshani, J. R. Coppeta, E. M. Vedula, E. E. Marr, B. P. Cain, R. J. Luu, M. P. Lech, S. H. Kann, T. J. Mulhern, V. Tandon, K. Tan, N. J. Haroutunian, P. Keegan, M. Rogers, A. L. Gard, K. B. Baldwin, J. C. de Souza, B. C. Hoefler, S. S. Bale, L. B. Kratchman, A. Zorn, A. Patterson, E. S. Kim, T. A. Petrie, E. L. Wiellette, C. Williams, B. C. Isenberg and J. L. Charest, Lab Chip, 2021, 21, 1454–1474 RSC.
- H. Zirath, M. Rothbauer, S. Spitz, B. Bachmann, C. Jordan, B. Müller, J. Ehgartner, E. Priglinger, S. Mühleder, H. Redl, W. Holnthoner, M. Harasek, T. Mayr and P. Ertl, Front. Physiol., 2018, 9, 815 CrossRef PubMed.
- J. Kieninger, K. Aravindalochanan, J. A. Sandvik, E. O. Pettersen and G. A. Urban, Cell Proliferation, 2014, 47, 180–188 CrossRef CAS PubMed.
- J. Kieninger, Y. Tamari, B. Enderle, G. Jobst, J. A. Sandvik, E. O. Pettersen and G. A. Urban, Biosensors, 2018, 8, 44 CrossRef PubMed.
- K. Domansky, W. Inman, J. Serdy, A. Dash, M. H. M. Lim and L. G. Griffith, Lab Chip, 2010, 10, 51–58 RSC.
- M. A. Ortega, X. Fernández-Garibay, A. G. Castaño, F. De Chiara, A. Hernández-Albors, J. Balaguer-Trias and J. Ramón-Azcón, Lab Chip, 2019, 19, 2568–2580 RSC.
- Y. S. Zhang, J. Aleman, S. R. Shin, T. Kilic, D. Kim, S. A. M. Shaegh, S. Massa, R. Riahi, S. Chae, N. Hu, H. Avci, W. Zhang, A. Silvestri, A. S. Nezhad, A. Manbohi, F. De Ferrari, A. Polini, G. Calzone, N. Shaikh, P. Alerasool, E. Budina, J. Kang, N. Bhise, J. Ribas, A. Pourmand, A. Skardal, T. Shupe, C. E. Bishop, M. R. Dokmeci, A. Atala and A. Khademhosseini, Proc. Natl. Acad. Sci. U. S. A., 2017, 114, E2293–E2302 CAS.
- S. Eggert, M. S. Gutbrod, G. Liebsch, R. Meier, C. Meinert and D. W. Hutmacher, ACS Sens., 2021, 6, 1248–1260 CrossRef CAS PubMed.
- J. Dornhof, J. Kieninger, H. Muralidharan, J. Maurer, G. A. Urban and A. Weltin, Lab Chip, 2022, 22, 225–239 RSC.
- P. M. Misun, J. Rothe, Y. R. F. Schmid, A. Hierlemann and O. Frey, Microsyst. Nanoeng., 2016, 2, 16022 CrossRef CAS PubMed.
- N. Rousset, R. L. Sandoval, M. M. Modena, A. Hierlemann and P. M. Misun, Microsyst. Nanoeng., 2022, 8, 14 CrossRef CAS PubMed.
- D. Bavli, S. Prill, E. Ezra, G. Levy, M. Cohen, M. Vinken, J. Vanfleteren, M. Jaeger and Y. Nahmias, Proc. Natl. Acad. Sci. U. S. A., 2016, 113, E2231–E2240 CrossRef CAS PubMed.
- S. Russell, J. Wojtkowiak, A. Neilson and R. J. Gillies, Sci. Rep., 2017, 7, 1–11 CrossRef CAS PubMed.
- K. Ino, M. Şen, H. Shiku and T. Matsue, Analyst, 2017, 142, 4343–4354 RSC.
- A. Weltin, S. Hammer, F. Noor, Y. Kaminski, J. Kieninger and G. A. Urban, Biosens. Bioelectron., 2017, 87, 941–948 CrossRef CAS PubMed.
- R. Mukomoto, Y. Nashimoto, T. Terai, T. Imaizumi, K. Hiramoto, K. Ino, R. Yokokawa, T. Miura and H. Shiku, Analyst, 2020, 145, 6342–6348 RSC.
- A. Sridhar, H. L. De Boer, A. Van Den Berg and S. Le Gac, PLoS One, 2014, 9, e93618 CrossRef PubMed.
- K. Ino, Y. Yamada, Y. Kanno, S. Imai, H. Shiku and T. Matsue, Sens. Actuators, B, 2016, 234, 201–208 CrossRef CAS.
- H. Kurosawa, H. Utsunomiya, N. Shiga, A. Takahashi, M. Ihara, M. Ishibashi, M. Nishimoto, Z. Watanabe, H. Abe, J. Kumagai, Y. Terada, H. Igarashi, T. Takahashi, A. Fukui, R. Suganuma, M. Tachibana and N. Yaegashi, Hum. Reprod., 2016, 31, 2321–2330 CrossRef PubMed.
- Y. Date, S. Takano, H. Shiku, K. Ino, T. Ito-Sasaki, M. Yokoo, H. Abe and T. Matsue, Biosens. Bioelectron., 2011, 30, 100–106 CrossRef CAS PubMed.
- Y. Xiang, K. Miller, J. Guan, W. Kiratitanaporn, M. Tang and S. Chen, Arch. Toxicol., 2022, 96, 691–710 CrossRef CAS PubMed.
- J. Zhang, E. Wehrle, M. Rubert and R. Müller, Int. J. Mol. Sci., 2021, 22, 3971 CrossRef CAS PubMed.
- K. Tröndle, L. Rizzo, R. Pichler, F. Koch, A. Itani, R. Zengerle, S. S. Lienkamp, P. Koltay and S. Zimmermann, Biofabrication, 2021, 13, 035019 CrossRef PubMed.
- R. H. Utama, L. Atapattu, A. P. O'Mahony, C. M. Fife, J. Baek, T. Allard, K. J. O'Mahony, J. C. C. Ribeiro, K. Gaus, M. Kavallaris and J. J. Gooding, iScience, 2020, 23, 101621 CrossRef CAS PubMed.
- H. Chen, Z. Wu, Z. Gong, Y. Xia, J. Li, L. Du, Y. Zhang, X. Gao, Z. Fan, H. Hu, Q. Qian, Z. Ding and S. Guo, Adv. Healthcare Mater., 2022, 11, 1–11 Search PubMed.
- D. N. Heo, B. Ayan, M. Dey, D. Banerjee, H. Wee, G. S. Lewis and I. T. Ozbolat, Biofabrication, 2021, 13, 015013 CrossRef CAS PubMed.
- B. Ayan, D. N. Heo, Z. Zhang, M. Dey, A. Povilianskas, C. Drapaca and I. T. Ozbolat, Sci. Adv., 2020, 6, 1–17 Search PubMed.
- D. Liang, T. G. Muniyogeshbabu, L. Tanguy, A. Ernst, R. Zengerle and P. Koltay, Proc. 1st Int. Conf. Micro Fluid. Handl. Syst., 2012, vol. c, pp. 95–98 Search PubMed.
- ISO 23783-2:2022, Automated liquid handling systems — Part 2: Measurement procedures for the determination of volumetric performance, 2022.
- P. Zimmermann, A. Weltin, G. A. Urban and J. Kieninger, Sensors, 2018, 18, 2404 CrossRef PubMed.
- U. L. Triantafillu, S. Park, N. L. Klaassen, A. D. Raddatz and Y. Kim, Int. J. Oncol., 2017, 50, 993–1001 CrossRef CAS PubMed.
- S. Tzung, K. M. Kim, G. Basañez, C. D. Giedt, J. Simon, J. Zimmerberg, K. Y. J. Zhang and D. M. Hockenbery, Nat. Cell Biol., 2001, 3, 183–191 CrossRef CAS PubMed.
- Y. Zhou, T. Arai, Y. Horiguchi, K. Ino, T. Matsue and H. Shiku, Anal. Biochem., 2013, 439, 187–193 CrossRef CAS PubMed.
- L. Jiang, A. A. Shestov, P. Swain, C. Yang, S. J. Parker, Q. A. Wang, L. S. Terada, N. D. Adams, M. T. McCabe, B. Pietrak, S. Schmidt, C. M. Metallo, B. P. Dranka, B. Schwartz and R. J. Deberardinis, Nature, 2016, 532, 255–258 CrossRef CAS PubMed.
- G. Campioni, V. Pasquale, S. Busti, G. Ducci, E. Sacco and M. Vanoni, Cell, 2022, 11, 1–22 CrossRef.
- A. Weltin and J. Kieninger, J. Neural Eng., 2021, 18, 052001 CrossRef PubMed.
Footnote |
| † Contributed equally. |
| This journal is © The Royal Society of Chemistry 2022 |