 Open Access Article
Creative Commons Attribution 3.0 Unported Licence
Effects of NiO addition on sintering and proton uptake of Ba(Zr,Ce,Y)O3−δ†
Yuanye
Huang‡
 ,
Rotraut
Merkle
 * and
Joachim
Maier

Max Planck Institute for Solid State Research, Heisenbergstraße 1, Stuttgart, 70569, Germany. E-mail: r.merkle@fkf.mpg.de
First published on 7th June 2021
Abstract
The effects of 0.125–2.0 wt% NiO added as a sintering aid for highly refractory Ba(Zr,Ce,Y)O3−δ proton conducting ceramics are investigated. The complex nature of the solid state reactive sintering method shows up in the phase evolution (quenched samples exhibit up to three different perovskite phases) and the densification kinetics. For ≥ 0.25 wt% NiO addition the characteristic changes in the sintering behavior indicate that a (Ba,Ni,Y)Ox transient liquid phase forms which simultaneously facilitates densification, grain growth, and homogeneous (Zr,Ce,Y) cation distribution (indicated by decreased microstrain). However, thermogravimetry shows a clear decrease of proton uptake and effective acceptor concentration with increasing amounts of NiO. This can be attributed to a withdrawal of Ba from the perovskite lattice, which decreases the effective acceptor concentration. A NiO content of 0.4–0.5 wt% is suggested as a balance between the benefits for phase formation and sintering, and its drawback for proton uptake.
1. Introduction
Fuel cells based on ceramic proton conducting electrolytes (protonic ceramic fuel cells, PCFCs) have several advantages over oxide conductor based solid oxide fuel cells (SOFCs) such as a higher electrolyte conductivity at intermediate temperatures (300–600 °C), and water formation at the cathode side which facilitates operation at high fuel utilization (see e.g. ref. 1–7). In addition, operation in electrolysis mode (directly producing dry compressed hydrogen) or catalytic membrane reactors becomes increasingly attractive.8–11 The basis for these applications is the availability of proton-conducting electrolytes in the form of planar or tubular membranes. Y-doped BaZrO3 (BZY) combines a high bulk proton conductivity with good chemical stability.2,12 However, its poor sinterability and blocking nature of the grain boundaries (GBs) have severely impeded its application (see e.g. ref. 12–15). Partial substitution of Zr by Ce improves both aspects, but too high ceria contents are detrimental for chemical stability against CO2 and H2O.12,16,17 The use of NiO as a sintering aid in a solid state reactive sintering approach (SSRS18–22) allows for improved densification and grain growth at decreased temperature (typically 1400–1550 °C) via formation of a transient (Ba,Ni,Y)Ox liquid phase. SSRS has been successfully applied for PCFCs (see e.g. ref. 5) and tubular reactors.10,11While other additives such as ZnO,19,23 CoO,19,24 and CuO19,25 also improve the sintering, NiO is preferred because it is present in PCFCs on the anode side anyway and – if not deliberately added to the electrolyte layer – diffuses in from the anode BZY–Ni mixture.7,26,27 Although SSRS with NiO tends to yield better bulk and grain boundary conductivities than the use of other sintering aids and procedures, NiO addition has also detrimental effects (see e.g. ref. 20, 21, 26 and 28–31). They are related to Ni-rich residues of the transient liquid phase which, in particular for high NiO addition, may lead to cracking and potentially even electronic short-circuits when the material is exposed to reducing conditions. In addition, the liquid phase formation may affect the cation composition of the grain interior, and thus proton uptake as well as bulk and GB conductivity. Specific temperature treatments have been suggested (see e.g. ref. 21, 28 and 29) to decrease these problems. It is obvious that a balance between improved sintering and decreased bulk conductivity must be found.
For this purpose, in the present work the effect of different amounts of NiO addition to Ba1.015Zr0.664Ce0.20Y0.136O3−δ and Ba1.015Zr0.63Ce0.20Y0.17O3−δ are investigated with respect to the sintering properties (densification and grain size as function of time and temperature) and bulk proton uptake (from which the effective acceptor concentration can be derived). Limiting the Ce substitution to 20 mol% keeps the material safely in the stability range versus CO2 and H2O, and a slight nominal Ba excess is used to compensate for potential BaO loss in the sintering. 1.0 wt% NiO is frequently used in literature,18–21 but occasionally also 0.5 wt% (ref. 32 and 33) and 2.0 wt% (ref. 18, 20 and 34) have been tested. The NiO addition is varied from 0.125 wt% to 1.0 wt% to identify the optimum NiO content, and 2.0 wt% NiO addition is used for investigating the liquid phase sintering mechanisms. A detailed investigation of bulk and GB conductivity will be reported separately.
2. Experimental
2.1 Sample preparation
Ba(Zr,Ce,Y)O3−δ (BZCY) samples were prepared by the SSRS method, in which NiO is added in excess to the Ba(Zr,Ce,Y)O3−δ cation stoichiometry. The nominal cation ratios of Ba![[thin space (1/6-em)]](https://www.rsc.org/images/entities/char_2009.gif) :
:![[thin space (1/6-em)]](https://www.rsc.org/images/entities/char_2009.gif) Zr
Zr![[thin space (1/6-em)]](https://www.rsc.org/images/entities/char_2009.gif) :
:![[thin space (1/6-em)]](https://www.rsc.org/images/entities/char_2009.gif) Ce
Ce![[thin space (1/6-em)]](https://www.rsc.org/images/entities/char_2009.gif) :
:![[thin space (1/6-em)]](https://www.rsc.org/images/entities/char_2009.gif) Y in the present work are 1.015
Y in the present work are 1.015![[thin space (1/6-em)]](https://www.rsc.org/images/entities/char_2009.gif) :
:![[thin space (1/6-em)]](https://www.rsc.org/images/entities/char_2009.gif) 0.664
0.664![[thin space (1/6-em)]](https://www.rsc.org/images/entities/char_2009.gif) :
:![[thin space (1/6-em)]](https://www.rsc.org/images/entities/char_2009.gif) 0.20
0.20![[thin space (1/6-em)]](https://www.rsc.org/images/entities/char_2009.gif) :
:![[thin space (1/6-em)]](https://www.rsc.org/images/entities/char_2009.gif) 0.136 and 1.015
0.136 and 1.015![[thin space (1/6-em)]](https://www.rsc.org/images/entities/char_2009.gif) :
:![[thin space (1/6-em)]](https://www.rsc.org/images/entities/char_2009.gif) 0.63
0.63![[thin space (1/6-em)]](https://www.rsc.org/images/entities/char_2009.gif) :
:![[thin space (1/6-em)]](https://www.rsc.org/images/entities/char_2009.gif) 0.20
0.20![[thin space (1/6-em)]](https://www.rsc.org/images/entities/char_2009.gif) :
:![[thin space (1/6-em)]](https://www.rsc.org/images/entities/char_2009.gif) 0.17. The respective amounts of BaCO3 (Alfa Aesar, 99.8%), CeO2 (Sigma Aldrich, 99.8%), ZrO2 (Tosoh TZ-0), Y2O3 (Alfa Aesar, 99.9%) and 0.125–2.0 wt% NiO (Alfa Aesar, 99%) were wet milled in isopropanol in a zirconia vessel with zirconia balls for 24 h (Fritsch Pulverisette 5). After drying, the powder was dry-ball-milled for 1 h (Friatec vibrating mill with a single large zirconia ball) to break agglomerates. SEM images of the powder showed a particle size about 0.5 μm after ball milling. According to XRD the milled powder still consisted of the initial phases (Fig. S4†), i.e., no mechanochemical reaction had occurred.
0.17. The respective amounts of BaCO3 (Alfa Aesar, 99.8%), CeO2 (Sigma Aldrich, 99.8%), ZrO2 (Tosoh TZ-0), Y2O3 (Alfa Aesar, 99.9%) and 0.125–2.0 wt% NiO (Alfa Aesar, 99%) were wet milled in isopropanol in a zirconia vessel with zirconia balls for 24 h (Fritsch Pulverisette 5). After drying, the powder was dry-ball-milled for 1 h (Friatec vibrating mill with a single large zirconia ball) to break agglomerates. SEM images of the powder showed a particle size about 0.5 μm after ball milling. According to XRD the milled powder still consisted of the initial phases (Fig. S4†), i.e., no mechanochemical reaction had occurred.
Isostatically pressed (200 MPa) green pellets of about 10 mm diameter and 5 mm thickness were embedded in sacrificial powder (BaZrO3 (Sigma Aldrich) with 10 wt% BaCO3). The samples were sintered in Y-stabilized zirconia crucibles at 1450–1550 °C with a heating and cooling rate of 200 K h−1 and soaking time of 1–16 h; some experiments (“fast sintering”) were carried out with a faster nominal heating and cooling rate of 600 K h−1 and shorter soaking time of 0.25 or 1 h. For quenching experiments, the samples were heated to the desired temperature with a rate of 600 K h−1, and after 10 min soaking time the crucible was vertically dragged out from the oven by an attached Pt wire.
SSRS of Ba1.015Zr0.63Ce0.20Y0.17O3−δ with different NiO addition was also investigated. It shows the same tendency as Ba1.015Zr0.664Ce0.20Y0.136O3−δ, as shown in Fig. S3.† Therefore, the discussion will focus on Ba1.015Zr0.664Ce0.20Y0.136O3−δ unless stated differently.
For comparison, some samples were sintered by spark plasma sintering (SPS). For these samples, powders having the perovskite structure were prepared by conventional solid state reaction from BaCO3, CeO2, ZrO2–Y2O3 (Tosoh TZ-10) without/with NiO by repeated dry ball milling and calcination (4 h at 1100 °C, followed by three times 8 h at 1300 °C). Densification by SPS (FCT Systeme, Frankenblick, Germany) was performed in graphite dies (ϕ = 20 mm) with a uniaxial pressure of 0.4 kbar and holding time of 5 min at 1450 °C (Ni-free BZCY), 1350 °C (1.0 at% Ni at B-site) and 1300 °C (4.0 at% Ni at B-site). These samples were post-annealed in Y-stabilized zirconia crucibles buried in sacrificial powder (BaZrO3 with 10 wt% BaCO3) for 4 h at 1500 °C (Ni-free), 1400 °C (Ni-containing), with a heating and cooling rate of 200 K h−1.
2.2 Characterization
The density of samples was calculated from weight and geometry, the theoretical density was calculated from X-ray diffraction (XRD) lattice constants and nominal composition. XRD was performed using Cu Kα radiation in Bragg–Brentano geometry (Panalytical Empyrean) on the sintered samples after manually grinding off the surface layer.To check the chemical composition, about 50 mg of ground powder from the sintered sample was dissolved into 3.0 vol% HCl solution in a microwave autoclave, and measured by inductively coupled plasma-optical emission spectrometry (ICP-OES, Spectro Ciros). The ICP-OES results are shown and discussed in Tables S1, S2 and Fig. S1.†
Scanning electron microscopy (SEM, ZEISS Merlin) was used to determine the mean grain size by the linear intercept method and the grain size distribution from the top-view images of the etched surface. The samples were chemically etched in 10 vol% aqueous HCl for 20 min. Some samples were thermally etched for 1 h at 50 K below their sintering temperature (or the annealing temperature for SPS samples) for better image quality.
The proton uptake was measured by thermogravimetry (TG, Netzsch STA 449) on sintered pellets crushed and sieved to a particle size ≤300 μm (typical sample weight ca. 500 mg). The samples were first heated in dry N2 (60 ml min−1) to 900 °C, then the atmosphere was switched to 17 mbar H2O in N2, the respective weight change yields the absolute water content at 900 °C. The samples were cooled with rates of 1 K min−1 down to 600 °C, 0.6 K min−1 down to 400 °C, 0.3 K min−1 down to 300 °C. For selected samples the reversibility was checked by heating again with the respective rate; the absence of hysteresis indicated that the hydration reaction had reached equilibrium. Buoyancy correction was performed using data recorded for an empty crucible.
Local element distribution and images of the quenched samples were investigated by transmission electron microscopy (TEM, ARM200CF TEM, JEOL, USA) equipped with electron energy loss spectroscopy (TEM-EELS). The instrument integrates spherical (Cs) aberrations of the condenser lenses and provides atomic resolution. TEM samples were mechanically ground and polished by MultiPrep wedge polisher (Allied High Tech Products, Inc., USA), after which a final ion-beam milling with low energy Ar ions (1 keV) was applied in a PIPS1 (Gatan, Inc., USA) at room temperature. Bright-field (BF) images were obtained with a resolution of 0.2 nm and high-angle annular dark-field (HAADF) with a resolution < 0.1 nm (electron scattered to angles 0–111 mrad).
3. Results and discussion
3.1 Sintering behavior
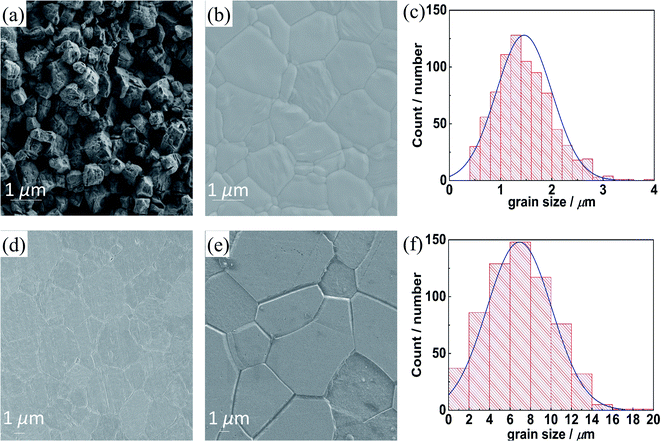
Acceptor-doped BaZrO3 materials are known to require drastic sintering conditions. Conventional sintering at 1500 °C without NiO addition yields low densities,20 a temperature of 1600 °C yields dense samples but the grain size remains ≤1 μm(ref. 35) despite a long soaking time of 24 h. In the SPS process for Ni-free samples, uniaxial pressure is applied at a temperature where plastic deformation of the grains becomes possible. This results in a high density of ≥95%, but the grain size remains close to that in the starting powder at about 0.5 μm (Fig. 1a). Even extended annealing of SPS samples at 1700 °C for 20 h does not lead to perceptible grain growth.36Depending on the added NiO amount, the situation differs strongly for the SSRS process. It is important to recognize that an addition of 1.0 wt% NiO corresponds to ≈4.0 at% Ni (relative to the B-site cations), which yields about 3–6 vol% of a transient liquid phase (assuming the melt consists of BaNiO2 or BaY2NiO5, see discussion below and in ref. 37). The beneficial effect of SSRS with NiO addition is illustrated in Fig. 1. For the SSRS sample with 0.25 wt% NiO, the grain size remains small ≈1 μm (this agrees with the results in ref. 38 for 0.2 wt% NiO). When a higher amount of 0.5 or 1.0 wt% NiO is used, the grains grow up to 2–6 μm. For the latter sample the grains actually develop the equilibrium hexagonal shape predicted by the Wulff construction. These results clearly demonstrate the effect of NiO addition in promoting BZCY grain growth and densification. While the average grain size of the sample with 1.0 wt% NiO addition is much larger than the one with 0.25 wt% NiO, the shape and width of the grain size distribution is similar (the average grain sizes from Fig. 1c and f are larger than those from intercept linear method because the size distribution was calculated from individual grain whose size was measured by the longest diagonal).
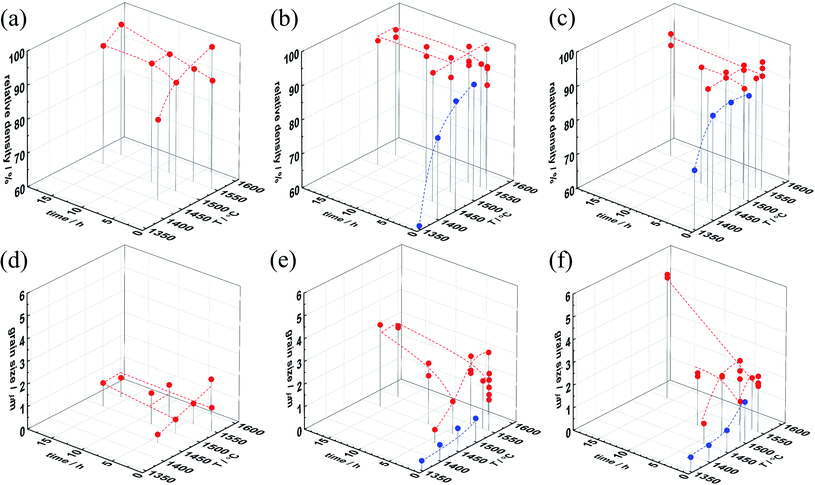
The relative density and grain size of samples with different NiO content are plotted in Fig. 2. For 0.25 wt% NiO or less, high sintering temperatures and long soaking times are required for full densification, but the grains remain small (≈1 μm). Fig. S2a† demonstrates similar behavior for 0.125 wt%. However, for ≥0.375 wt% NiO (Fig. 2b–f, S2b and d†), already lower sintering temperature and shorter soaking time results in densities ≥95% (similar to the trend for Ce-rich BaZr0.1Ce0.7Y0.2O3−δ (ref. 33)). In parallel to the densification the grains grow significantly. To access shorter soaking time, the heating and cooling rate was increased to 600 K h−1 for 0.5–1.0 wt% NiO (blue dots in Fig. 2). These data demonstrate that a high NiO content of 1.0 wt% yields a high density already at 1400 °C. These results show that dense samples can be obtained above 1400–1450 °C for 1.0–0.5 wt% NiO addition. However, in order to achieve pronounced grain growth (decreasing the number of low-conductive GBs), 1500–1550 °C and extended soaking times are necessary. The lattice parameters of the SSRS samples show no systematic dependence on the sintering conditions but a characteristic variation with NiO content, as discussed in Section 3.3.
Fig. 3 gives further insight into the dependence of the SSRS sintering process on the NiO content. When ≤0.25 wt% NiO is used, the densification process largely occurs without pronounced grain growth, the grain size remains below 1 μm (Fig. 3a). On the other hand, higher NiO contents ≥0.375 wt% NiO lead to grain growth in parallel to the densification. The maximum grain size that is achieved for 16 h at 1550 °C then increases with NiO addition, and exceeds 5 μm for 1.0 wt% NiO (Fig. 3b). The grain growth behavior indicates a qualitative difference in the SSRS sintering process between samples with low and high NiO addition, which is most probably related to the amount of transient liquid phase formed. Characteristic differences are also observed in the microstrain that is extracted from the XRD peak widths according to the Williamson–Hall method39 (Fig. 3c). This micro-strain is high for the Ni-free SPS sample as well as for the SSRS sample with 0.125 wt% NiO (independent of soaking time). The strain decreases strongly for 0.25 wt% NiO, and then remains negligible for higher NiO contents. This indicates that the ceramics with high NiO content have less local distortions/inhomogeneities (e.g. from inhomogeneous B-site cation distribution) within the crystallites.
The dependence of grain growth as well as microstrain on NiO addition indicates that a certain threshold value of liquid phase volume is required which is met at about 0.3 wt% NiO. Depending on the composition of the liquid phase (closer to BaNiO2 or to BaY2NiO5), 0.3 wt% NiO corresponds to 0.9–1.8 vol% of liquid phase. Owing to the moderate Y and NiO contents used in the present investigation, no direct traces of the solidified liquid phase were detected in XRD or SEM, neither in oven-cooled nor in the quenched samples of Section 3.2 (residues of BaY2NiO5 are typically found for Y- and Ni-rich compositions20,59). Nevertheless, the sintering behavior clearly indicates the presence of a transient liquid phase for NiO contents above 0.25 wt% (strongly increased densification and grain growth, decrease of microstrain). The higher the volume fraction of the liquid phase, which probably also dissolved some Zr4+, Ce4+ and thus supplies a fast diffusion path for all cations, the faster the densification and the larger the grain size.
So far, the advantages of NiO addition in SSRS can be summarized as follows: (i) improved densification, (ii) promoted grain growth, and (iii) decreased microstrain indicating more homogeneous cation distribution. These advantages become effective in SSRS of Ba1.015Zr0.664Ce0.20Y0.136O3−δ for NiO contents of at least 0.375 wt% NiO.
It is interesting to analyze the grain growth kinetics in more detail. Fig. 4 shows that the grain size follows the frequently observed grain growth relation:40
| Gn − G0n = kt | (1) |
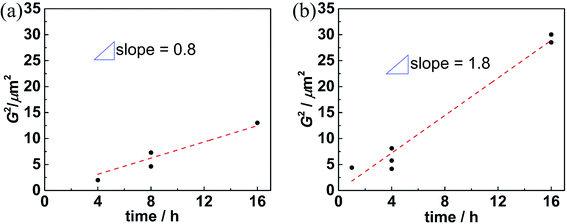 | ||
| Fig. 4 Squared grain size of SSRS samples plotted versus soaking time for (a) 0.5 wt% NiO at 1500 °C, (b) 1.0 wt% NiO at 1550 °C. | ||
In literature, systems are reported in which comparably small volume fractions of liquid phase suffice for effective sintering. Sintering of Al2O3 with a glassy liquid phase showed the strongest acceleration of densification at 1–5 vol% of the glassy phase.42 For Gd-doped ceria, an addition of 2 mol% CoO strongly increased the grain growth,43 however the liquid phase formation was not unambiguously proven. For sintering of BaTiO3, 1 wt% LiF liquid phase increased densification without grain growth, while 2–5 wt% LiF were required to increase also the grain size.44 The liquid phase fraction in the present investigation is in a comparable range and expected to increase with NiO content. Correspondingly, with a larger NiO addition the increased amount of liquid phase can wet a larger area of forming perovskite grains, and thus accelerate the overall grain growth and densification.
Fig. 5 shows the squared grain size at fixed soaking time as function of inverse temperature. The open symbols represent Ni-free samples from conventional sintering collected from literature. While the individual data have some scatter, the fitted activation energy of 3.7 eV agrees well to the activation energies of cation GB diffusion in BaZrO3 (3.7 eV for Zr, 3.0 eV for Ba,52,53 bulk activation energies amount to 4.5 eV for Zr, 4 eV for Ba). The activation energy increases to 5.3 eV for SSRS samples with 0.25 wt% NiO addition, and further increases to 6.2 eV with higher NiO content. At first glance it might appear surprising that the increased grain growth rates of these samples come together with an increased activation energy. However, one reason might be that the solubility of Ce and Zr in the (Ba,Ni,Y)Ox liquid phase could have a strong temperature dependence, and a higher Ce, Zr concentration in the melt will allow for faster perovskite phase reprecipitation. The practical consequence of this observation is that a moderate increase of sintering temperature could be more suitable for increasing grain growth than an increased NiO addition or soaking time. This observation is also relevant for the sintering of anode/electrolyte assemblies, where long soaking times are shown to be detrimental.63
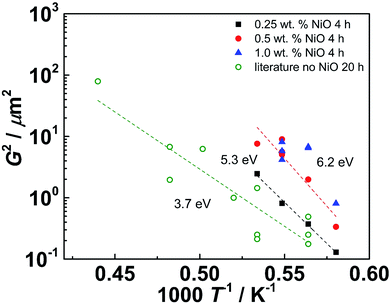 | ||
| Fig. 5 Squared grain size at fixed soaking time plotted as function of inverse temperature. Open symbols: conventionally sintered Ni-free Ba(Zr,Y)O3−δ samples with 5–20 at% Y, soaking time 20–24 h, data taken from literature.18,21,36,45–51 Solid symbols: SSRS BZCY samples with different NiO content from present investigation (20 at% Ce, 13.6 at% Y), soaking time 4 h. | ||
3.2 Phase evolution
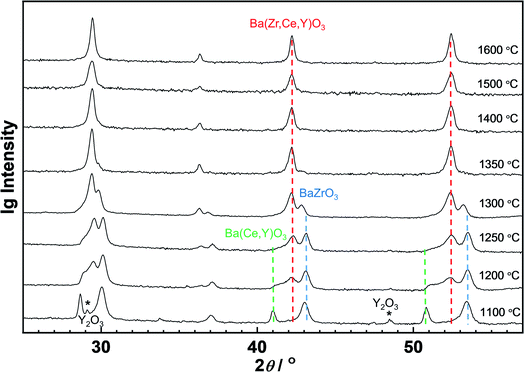
A specific feature of the solid state reactive sintering is that the final perovskite phase is not pre-formed in the starting powder. Either the components of the perovskite phase dissolve into the (Ba,Ni,Y)Ox liquid phase directly from the educts (BaCO3, Y2O3, CeO2, ZrO2), or small perovskite crystallites formed at the contacts between BaCO3 and (Y2O3, CeO2, ZrO2) grains will be available. They are expected to dissolve more easily than large BZCY crystallites (when the perovskite phase is formed in the preceding solid state reaction, and NiO added as a conventional sintering aid). Thus, the SSRS procedure for BZCY beneficially combines liquid-phase formation with facilitated dissolution of precursor phases. Quenching experiments were performed to further elucidate the SSRS mechanism. Fig. 6 shows the XRD pattern evolution for samples with 2.0 wt% NiO addition. At about 1000 °C (not shown), two perovskite phases start to form. At 1100 °C, only a small Y2O3 residue from the raw materials remains, which disappears above 1200 °C. One of the perovskite phases can be assigned to essentially undoped, almost Y-free BaZrO3 based on its lattice constant of 4.20 Å, which is very close to that of undoped BaZrO3 of 4.195 Å (using the dependence of the lattice parameter on Y concentration as reported e.g. in ref. 54 yields an estimated Y content of this phase of ∼3 mol%). The phase with the larger lattice constant corresponds to BZCY with a high Ce and Y content (cf. also Fig. 8). BaCeO3 is actually orthorhombic but this is hardly detectable for the present large peak width. Owing to the insensitivity of the BaCeO3 lattice parameter to Y substituting for Ce55 the Y content in this phase cannot be estimated. We conclude that this phase is largely Zr-free, as presence of Zr should strongly decrease the lattice constant. With increasing temperature, Ce and Y ions gradually dissolve in the transient liquid phase and distribute more homogeneously throughout the grains. At temperatures above 1350 °C, only one single perovskite BZCY phase is left.The behavior with a low NiO content of 0.125 wt% is shown in Fig. 7. The perovskite phases also start to form above 1000 °C, with some Y2O3 residue. In this sample even three perovskite phases (BaZrO3, (Ce,Y)-rich BZCY, and homogeneous BZCY) are present in an extended temperature range, and more than 1500 °C are required to reach a single homogeneous BZCY phase. Clearly, a low NiO content (low transient liquid phase volume) makes it more difficult to obtain a homogeneously distributed B site cation occupancy.
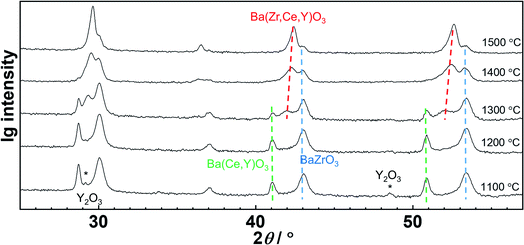 | ||
| Fig. 7 XRD patterns of BZCY with 0.125 wt% NiO addition sintered at different temperature for 10 min. | ||
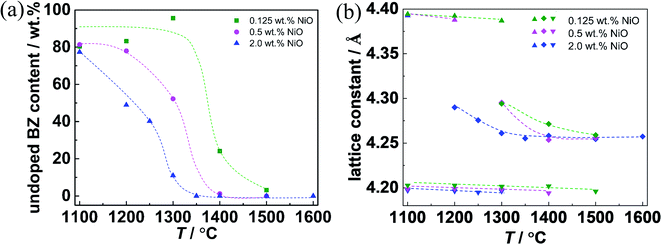
The content of undoped BZ and the lattice constants of the quenched samples are summarized in Fig. 8. For 2.0 wt% NiO, the undoped BZ phase fraction rapidly drops from ≈80% to lower values, and vanishes at 1350 °C. For 0.5 wt% NiO the same process is shifted to about 50 K higher temperatures. In contrast, for 0.125 wt% NiO the undoped BZ fraction remains almost unchanged up to 1300 °C, and a small fraction is still present after 10 min at 1500 °C. For all NiO contents, the lattice constant of the undoped BZ and the (Ce,Y)-rich BZCY phase remains unchanged. The lattice constant corresponding to the middle perovskite peak gradually approaches the value of the homogeneous BZCY phase of 4.26 Å at or above 1400 °C. Interestingly, for a given NiO content the (Ce,Y)-rich BZCY phase vanishes at lower T than the BZ phase, i.e. it seems to dissolve more easily in the transient liquid phase. The comparison for the different NiO contents shows that a higher liquid phase volume facilitates the cation transport, and the perovskite phase becomes uniform more easily.
For selected samples, the element distribution and possible remainders of the transient liquid phase were investigated by TEM-EELS. Fig. 9 shows the TEM-EELS mapping for the sample with 2.0 wt% NiO quenched from 1250 °C. There is a clear element inhomogeneity on a 100 nm length scale. While some grains show high Ce content, others are high in Ba and Zr (owing to the low Y concentration, the Y map is too noisy for any conclusions). This pronounced inhomogeneity agrees with the XRD results in Fig. 6 (presence of an undoped BZ and a Ce-rich BZCY perovskite phase at low temperature). Further TEM results are given in Fig. S7, S8† and ref. 56.
3.3 Proton uptake
So far it might seem that the higher the NiO addition is, the better are BZCY processing (lower sintering temperature) and properties (larger grains and improved cation homogeneity). However, a clear detrimental effect of sintering additives such as NiO, CuO, ZnO on the proton conductivity of Y-doped BaZrO3 has been shown e.g. in ref. 23, 26 and 29. For BaZr1−xYxO3, a systematic decrease of proton uptake with increasing NiO addition was found.35,57,58Fig. 10b shows that for the Ni-free sample the maximum proton uptake almost equals the nominal dopant concentration = 13.6 at% at 300 °C. This holds also for Ni-containing samples when Ni is incorporated as substitutional dopant on the B-site (i.e., BaZr1−x−yYxNiyO3), and is independent of the sintering method (SPS or conventional sintering). However, Fig. 10a demonstrates that when NiO is added in excess to the perovskite's cation composition (i.e., BaZr1−xYxO3 + yNiO) as typical for the SSRS process, the maximum proton uptake decreases. This decrease is the more severe the higher the NiO addition is, e.g. for 1 wt% NiO the proton uptake decreases by about one half (1 wt% NiO corresponds to ≈4.0 at% Ni on B site if fully incorporated into the perovskite lattice).
The mass action constant for the hydration reaction Khydrat is calculated according to:
 | (2) |
 | (3) |
 , where [A′] = [Y′Zr] is the nominal acceptor concentration. The SPS sample without Ni shows a linear Van't Hoff plot (Fig. S9†), which indicates its ideal hydration behavior. SPS samples with substitutional Ni on the B site exhibit a slight bending appearing only at comparably low temperatures (below 420 °C). However, SSRS samples with excess NiO exhibit strongly bent Van't Hoff plots (Fig. S10a†), corresponding to the fact that the maximum proton uptake is significantly lower than the nominal acceptor concentration (Fig. 10a). However, linear Van't Hoff plots can be obtained when a decreased effective dopant concentrations [A′eff] is applied (Fig. S10b,† details of [A′eff] determination are described there). The corresponding [A′eff] values are plotted in Fig. 10c. [A′eff] shows only a very slight decrease with increasing NiO content for samples with Ni on the B site, whereas it decreases strongly for SSRS samples with excess NiO. The decreased effective acceptor concentration can be attributed to the fact that the formation of a (Ba,Ni,Y)Ox liquid phase binds some BaO which is then unavailable for the perovskite's A site. It has been shown that Ba deficiency leads to a partial change of Y from being an acceptor on the B site to donor on the A site,59 which decreases the effective acceptor concentration. Such a process is in line with the decreased lattice constants of SSRS samples in Fig. 12 because of the smaller ion radius of Y3+ compared to Ba2+.
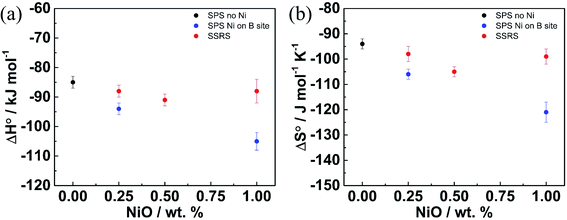
Fig. 11 shows the standard hydration enthalpies (ΔH0) and entropies (ΔS0) for samples without Ni, with Ni on B site, and with excess NiO as extracted from the linear Van't Hoff plots (using the [A′eff] values). The SSRS samples do not exhibit systematic changes of ΔH0 and ΔS0. In contrast, for samples with substitutional Ni on the B site ΔH0 and ΔS0 become more negative with increasing Ni content, which can possibly be ascribed to proton trapping at doubly negatively charged  defects. The strongly decreased proton uptake in SSRS samples with excess NiO arises mainly from the decreased effective acceptor dopant, rather than from modified thermodynamic parameters.
The NiO addition also influences the lattice constant, as shown in Fig. 12. For both BZY and BZCY, it decreases linearly with Ni content for substitutional Ni (smaller ion radius of Ni2+ compared to Zr4+), whereas it decreases more strongly for excess NiO (partial occupation of A site by Y3+). For BZCY the lattice constant drops significantly from 0 to 0.125 wt% NiO addition, and afterwards remains almost constant but with larger scatter. This might be related to a higher reactivity of Ce-rich perovskites with the forming (Ba,Y,Ni)Ox melt, and the fact that with three B site cations and a homogeneous site occupation it is more difficult to achieve a homogeneous composition, as discussed in Section 3.2.
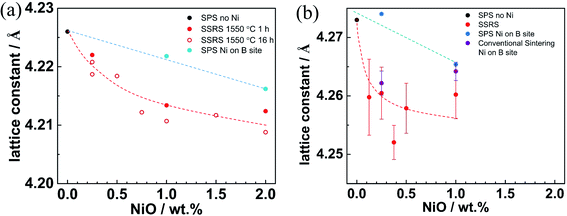 | ||
| Fig. 12 Lattice constant versus NiO addition for (a) BZY (data taken from ref. 35), (b) BZCY samples. | ||
The clear difference in the behavior of samples with excess Ni or substitutional Ni with respect to hydration and lattice parameters indicates that Ni in SSRS does not significantly occupy the perovskite's B site. Instead, Ni rather extracts Ba out of the perovskite lattice to form the transient (Ba,Y,Ni)Ox liquid phase during SSRS. A more detailed defect chemical discussion of this process is given in ref. 37.
3.4 Concluding discussion
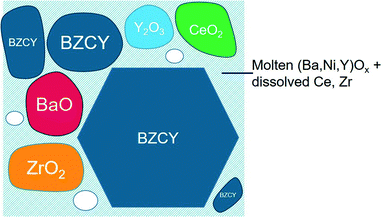
The possible sintering mechanism of SSRS as concluded from the former discussion is schematically shown in Fig. 13. Direct contact points of BaO with ZrO2 and CeO2 lead to the formation of Zr-rich and Ce-rich perovskite grains (Fig. 6–8). The key of SSRS sintering of highly refractory Ba(Zr,Ce,Y)O3 perovskites is the formation of a transient liquid phase, which allows for comparably fast cation transport which facilitates densification, grain growth, and homogenization of B site cation composition. It is rich in Ba, Ni and Y, and forms more easily when NiO is added to the mixture of BaO (from BaCO3), ZrO2, CeO2 and Y2O3 starting materials, than when NiO is added to an already formed BZCY perovskite phase. The melt has a solubility for Zr4+, Ce4+ (probably increasing with temperature) and thus allows for grain growth (Ostwald ripening) by a solution–reprecipitation mechanism. The final product are large BZCY grains with close to equilibrium shape.The transient liquid phase is formed at low temperature and is continuously consumed during the sintering with increasing temperature and time. BaNiO2 is thermally stable even above 1800 °C (it melts at about 1200 °C (ref. 60) but does not decompose into phases with different cation composition), while BaY2NiO5 was reported to decompose to Y2O3, BaO and NiO at 1500 °C.61 With increasing progress of the BZCY phase formation, the Ba is expected to be at least partially re-incorporated into the perovskite lattice.20 However, the decreased effective acceptor concentration as well as the decreased lattice constant suggest that the BZCY phase retains some Ba deficiency.
The thermodynamic data and the lattice constants of the SSRS samples (Fig. 10–12) clearly differ from samples with substitutional Ni on the B site. At the end of SSRS, Ni was detected in the GB regions.21,52 Both findings together indicate that most Ni remains close to the grain boundaries, and the re-incorporation of the liquid phase constituents into the perovskite lattice32 occurs only in part. Overall, SSRS is a complex process and the detailed nature of the transient liquid phase (Ba,Ni,Y)Ox remains to some degree elusive.
The liquid phase induced by NiO promotes cation transport and therefore results in much better densification, grain growth, and homogeneous perovskite phase at moderate temperature, which is beneficial for membrane fabrications. In full cells, the anode layer is usually composed of BZCY and 50–60 wt% NiO, providing an infinite source of Ni for the electrolyte layer. Ni can diffuse a few micrometers from the anode layer into the electrolyte layer62,63 even without NiO addition in the electrolyte, which can trigger SSRS. To have controlled conditions, it is advisable to deliberately add some NiO into the electrolyte.
However, too high NiO addition decreases the proton uptake (Fig. 10), and may lead to crack formation or electronic short-circuiting in reducing conditions. An increased Y dopant concentration may partially compensate the decreased effective acceptor dopant concentration and result in a higher proton uptake.56 Based on its effects on sintering behavior and proton uptake of the present Zr-rich composition, a NiO content of 0.4–0.5 wt% in the BZCY layer is recommended as a good compromise for BZCY membrane fabrication. For Ce-rich BaZr0.1Ce0.7Y0.2O3−δ, a similar NiO content has been recommended in ref. 33.
4. Summary
The solid state reactive sintering process using NiO for Ba(Zr,Ce,Y)O3 proton conductors was investigated in detail. The results strongly indicate that solid state reactive sintering proceeds via the formation of a (Ba,Ni,Y)Ox transient liquid phase, which facilitates homogeneous perovskite phase formation, ceramics densification, and grain growth (up to 6 μm with 1.0 wt% NiO addition) at temperatures of 1400–1500 °C, which are also feasible for the sintering of large-area membranes. Proton uptake measurements evidence a decrease of the effective acceptor concentration with increasing NiO addition, which is related to an incomplete re-incorporation of Ba into the perovskite. From the comprehensive analysis of the NiO effects on sintering behavior and proton uptake, an addition of 0.4–0.5 wt% is recommended as a good balance between advantageous and detrimental effects.Conflicts of interest
There are no conflicts to declare.Acknowledgements
We thank Helga Hoier for XRD measurements, Armin Sorg for SPS sintering and Barbara Baum for sample cutting. We thank Wilfried Sigle and Dan Zhou for TEM measurements and valuable discussions. This work was supported by BMBF project ProtOMem, 03SF0537C.References
- T. Norby, Solid State Ionics, 1999, 125, 1–11 CrossRef CAS.
- K. D. Kreuer, Annu. Rev. Mater. Res., 2003, 33, 333–359 CrossRef CAS.
- Y. Matsuzaki, Y. Tachikawa, T. Somekawa, T. Hatae, H. Matsumoto, S. Taniguchi and K. Sasaki, Sci. Rep., 2015, 5, 12640 CrossRef CAS PubMed.
- H. Zhu and R. J. Kee, J. Electrochem. Soc., 2017, 164, F1400–F1411 CrossRef CAS.
- C. Duan, J. Tong, M. Shang, S. Nikodemski, M. Sanders, S. Ricote, A. Almansoori and R. O'Hayre, Science, 2015, 349, 1321–1326 CrossRef CAS PubMed.
- S. Choi, C. J. Kucharczyk, Y. Liang, X. Zhang, I. Takeuchi, H.-I. Ji and S. M. Haile, Nat. Energy, 2018, 3, 202–210 CrossRef CAS.
- H. An, H.-W. Lee, B.-K. Kim, J.-W. Son, K. J. Yoon, H. Kim, D. Shin, H.-I. Ji and J.-H. Lee, Nat. Energy, 2018, 3, 870–875 CrossRef CAS.
- C. Duan, R. Kee, H. Zhu, N. Sullivan, L. Zhu, L. Bian, D. Jennings and R. O'Hayre, Nat. Energy, 2019, 4, 230–240 CrossRef CAS.
- S. Choi, T. C. Davenport and S. M. Haile, Energy Environ. Sci., 2019, 12, 206–215 RSC.
- S. H. Morejudo, R. Zanón, S. Escolástico, I. Yuste-Tirados, H. Malerød-Fjeld, P. K. Vestre, W. G. Coors, A. Martínez, T. Norby, J. M. Serra and C. Kjølseth, Science, 2016, 353, 563–566 CrossRef CAS PubMed.
- H. Malerød-Fjeld, D. Clark, I. Yuste-Tirados, R. Zanón, D. Catalán-Martinez, D. Beeaff, S. H. Morejudo, P. K. Vestre, T. Norby, R. Haugsrud, J. M. Serra and C. Kjølseth, Nat. Energy, 2017, 2, 923–931 CrossRef.
- K. D. Kreuer, Solid State Ionics, 1999, 125, 285–302 CrossRef CAS.
- S. M. Haile, D. L. West and J. Campbell, J. Mater. Res., 1998, 13, 1576–1595 CrossRef CAS.
- H. G. Bohn and T. Schober, J. Am. Ceram. Soc., 2004, 83, 768–772 CrossRef.
- M. Shirpour, R. Merkle, C. T. Lin and J. Maier, Phys. Chem. Chem. Phys., 2012, 14, 730–740 RSC.
- C. Zuo, S. Zha, M. Liu, M. Hatano and M. Uchiyama, Adv. Mater., 2006, 18, 3318–3320 CrossRef CAS.
- K. H. Ryu and S. M. Haile, Solid State Ionics, 1999, 125, 355–367 CrossRef CAS.
- J. Tong, D. Clark, M. Hoban and R. O'Hayre, Solid State Ionics, 2010, 181, 496–503 CrossRef CAS.
- S. Nikodemski, J. Tong and R. O'Hayre, Solid State Ionics, 2013, 253, 201–210 CrossRef CAS.
- J. Tong, D. Clark, L. Bernau, M. Sanders and R. O'Hayre, J. Mater. Chem., 2010, 20, 6333–6341 RSC.
- W. G. Coors, A. Manerbino, D. Martinefski and S. Ricote, in Perovskite Mater. - Synth. Characterisation, Prop. Appl., InTech, 2016 Search PubMed.
- D. A. Medvedev, A. A. Murashkina and A. K. Demin, Rev. J. Chem., 2015, 5, 193–214 CrossRef CAS.
- P. Babilo and S. M. Haile, J. Am. Ceram. Soc., 2005, 88, 2362–2368 CrossRef CAS.
- S. Ricote and N. Bonanos, Solid State Ionics, 2010, 181, 694–700 CrossRef CAS.
- M. Biswas, H. An, S. M. Choi, J. W. Son, J. H. Lee, B. K. Kim, H. W. Lee and K. J. Yoon, Ceram. Int., 2016, 42, 10476–10481 CrossRef CAS.
- D. Han, S. Uemura, C. Hiraiwa, M. Majima and T. Uda, ChemSusChem, 2018, 16, 1–13 Search PubMed.
- Y. Guo, Y. Lin, R. Ran and Z. Shao, J. Power Sources, 2009, 193, 400–407 CrossRef CAS.
- D. Han, J. Iihara, S. Uemura, K. Kazumi, C. Hiraiwa, M. Majima and T. Uda, J. Mater. Chem. A, 2016, 4, 10601–10608 RSC.
- N. Nasani, D. Pukazhselvan, A. V. Kovalevsky, A. L. Shaula and D. P. Fagg, J. Power Sources, 2017, 339, 93–102 CrossRef CAS.
- E. Kim, Y. Yamazaki, S. M. Haile and H.-I. Yoo, Solid State Ionics, 2015, 275, 23–28 CrossRef CAS.
- D. Ciria, M. Ben Hassine, M. Jiménez-Melendo, A. Iakovleva, P. Haghi-Ashtiani, V. Aubin and G. Dezanneau, J. Power Sources, 2016, 321, 226–232 CrossRef CAS.
- J. Tong, D. Clark, L. Bernau, A. Subramaniyan and R. O'Hayre, Solid State Ionics, 2010, 181, 1486–1498 CrossRef CAS.
- Z. Liu, X. Wang, M. Liu and J. Liu, Int. J. Hydrogen Energy, 2018, 43, 13501–13511 CrossRef CAS.
- D. Yun, J. Kim, S. J. Kim, J. H. Lee, J. N. Kim, H. Yoon, J. Yu, M. Kwak, H. Yoon, Y. Cho and C. Y. Yoo, Energies, 2018, 11, 3083 CrossRef CAS.
- P. Babilo, T. Uda and S. M. Haile, J. Mater. Res., 2007, 22, 1322–1330 CrossRef CAS.
- M. Shirpour, B. Rahmati, W. Sigle, P. A. van Aken, R. Merkle and J. Maier, J. Phys. Chem. C, 2012, 116, 2453–2461 CrossRef CAS.
- Y. Huang, R. Merkle and J. Maier, Solid State Ionics, 2020, 347, 115256 CrossRef CAS.
- M. Chen, D. Chen, K. Wang and Q. Xu, J. Alloys Compd., 2019, 781, 857–865 CrossRef CAS.
- G. K. Williamson and W. H. Hall, Acta Metall., 1953, 1, 22–31 CrossRef CAS.
- J. E. Burke and D. Turnbull, Prog. Met. Phys., 1952, 3, 220–292 CrossRef CAS.
- R. M. German, P. Suri and S. J. Park, J. Mater. Sci., 2009, 44, 1–39 CrossRef CAS.
- O.-H. Kwon and G. L. Messing, J. Am. Ceram. Soc., 1990, 73, 275–281 CrossRef CAS.
- E. Jud, C. B. Huwiler and L. J. Gauckler, J. Ceram. Soc. Jpn, 2006, 114, 963–969 CrossRef CAS.
- V. Pavlovic, B. Stojanovic, L. Zivkovic, G. Brankovic and M. Ristic, Ferroelectrics, 1996, 186, 165–168 CrossRef CAS.
- S. B. C. Duval, P. Holtappels, U. F. Vogt, U. Stimming and T. Graule, Fuel Cells, 2009, 9, 613–621 CrossRef CAS.
- S. B. C. Duval, P. Holtappels, U. F. Vogt, E. Pomjakushina, K. Conder, U. Stimming and T. Graule, Solid State Ionics, 2007, 178, 1437–1441 CrossRef CAS.
- Y. Yamazaki, R. Hernandez-Sanchez and S. M. Haile, Chem. Mater., 2009, 21, 2755–2762 CrossRef CAS.
- D. Han, N. Hatada and T. Uda, J. Am. Ceram. Soc., 2016, 99, 3745–3753 CrossRef CAS.
- F. Iguchi, C.-T. Chen, H. Yugami and S. Kim, J. Mater. Chem., 2011, 21, 16517–16523 RSC.
- F. Iguchi, N. Sata, T. Tsuri and H. Yugami, Solid State Ionics, 2007, 178, 691–695 CrossRef CAS.
- P. Babilo, PhD thesis, California Institute of Technology, 2007.
- R. Sažinas, I. Sakaguchi, M. A. Einarsrud and T. Grande, Inorganics, 2018, 6, 14 CrossRef.
- R. Sažinas, I. Sakaguchi, M. A. Einarsrud and T. Grande, AIP Adv., 2017, 7, 115024 CrossRef.
- K. D. Kreuer, S. Adams, W. Munch, A. Fuchs, U. Klock and J. Maier, Solid State Ionics, 2001, 145, 295–306 CrossRef CAS.
- L. Malavasi, H. J. Kim and T. Proffen, J. Appl. Phys., 2009, 105, 123519 CrossRef.
- Y. Huang, PhD thesis, University of Stuttgart, 2020.
- D. Han, K. Shinoda, S. Tsukimoto, H. Takeuchi, C. Hiraiwa, M. Majima and T. Uda, J. Mater. Chem. A, 2014, 2, 12552–12560 RSC.
- D. Han, K. Goto, M. Majima and T. Uda, ChemSusChem, 2021, 14, 614–623 CrossRef CAS PubMed.
- Y. Yamazaki, R. Hernandez-Sanchez and S. M. Haile, J. Mater. Chem., 2010, 20, 8158–8166 RSC.
- J. J. Lander, J. Am. Chem. Soc., 1951, 73, 2450–2452 CrossRef CAS.
- D. Han, Y. Otani, Y. Noda, T. Onishi, M. Majima and T. Uda, RSC Adv., 2016, 6, 19288–19297 RSC.
- H. Shimada, T. Yamaguchi, H. Sumi, Y. Yamaguchi, K. Nomura and Y. Fujishiro, Ceram. Int., 2018, 44, 3134–3140 CrossRef CAS.
- W. Deibert, M. E. Ivanova, Y. Huang, R. Merkle, J. Maier and W. A. Meulenberg, 2021 to be submitted.
Footnotes |
| † Electronic supplementary information (ESI) available. See DOI: 10.1039/d1ta02555d |
| ‡ Present address: Empa, Swiss Federal Laboratories for Materials Science and Technology, Überlandstraße 129, 8600, Dübendorf, Switzerland. |
| This journal is © The Royal Society of Chemistry 2021 |

