 Open Access Article
Creative Commons Attribution 3.0 Unported Licence
Small molecule based fluorescent chemosensors for imaging the microenvironment within specific cellular regions
Junling
Yin
b,
Ling
Huang
 a,
Luling
Wu
 c,
Jiangfeng
Li
a,
Tony D.
James
 *cd and
Weiying
Lin
 *a
*a
aGuangxi Key Laboratory of Electrochemical Energy Materials, Institute of Optical Materials and Chemical Biology, School of Chemistry and Chemical Engineering, Guangxi University, Nanning, Guangxi, 530004, People's Republic of China. E-mail: weiyinglin2013@163.com
bScience and Technology Innovation Center, Shandong First Medical University & Shandong Academy of Medical Sciences, Jinan 250000, Shandong, People's Republic of China
cDepartment of Chemistry, University of Bath, Bath, BA2 7AY, UK. E-mail: t.d.james@bath.ac.uk
dSchool of Chemistry and Chemical Engineering, Henan Normal University, Xinxiang 453007, People's Republic of China
First published on 22nd September 2021
Abstract
The microenvironment (local environment), including viscosity, temperature, polarity, hypoxia, and acidic-basic status (pH), plays indispensable roles in cellular processes. Significantly, organelles require an appropriate microenvironment to perform their specific physiological functions, and disruption of the microenvironmental homeostasis could lead to malfunctions of organelles, resulting in disorder and disease development. Consequently, monitoring the microenvironment within specific organelles is vital to understand organelle-related physiopathology. Over the past few years, many fluorescent probes have been developed to help reveal variations in the microenvironment within specific cellular regions. Given that a comprehensive understanding of the microenvironment in a particular cellular region is of great significance for further exploration of life events, a thorough summary of this topic is urgently required. However, there has not been a comprehensive and critical review published recently on small-molecule fluorescent chemosensors for the cellular microenvironment. With this review, we summarize the recent progress since 2015 towards small-molecule based fluorescent probes for imaging the microenvironment within specific cellular regions, including the mitochondria, lysosomes, lipid drops, endoplasmic reticulum, golgi, nucleus, cytoplasmic matrix and cell membrane. Further classifications at the suborganelle level, according to detection of microenvironmental factors by probes, including polarity, viscosity, temperature, pH and hypoxia, are presented. Notably, in each category, design principles, chemical synthesis, recognition mechanism, fluorescent signals, and bio-imaging applications are summarized and compared. In addition, the limitations of the current microenvironment-sensitive probes are analyzed and the prospects for future developments are outlined. In a nutshell, this review comprehensively summarizes and highlights recent progress towards small molecule based fluorescent probes for sensing and imaging the microenvironment within specific cellular regions since 2015. We anticipate that this summary will facilitate a deeper understanding of the topic and encourage research directed towards the development of probes for the detection of cellular microenvironments.
1. Introduction
The story of fluorescence originated with a report by Monardes in 1565, but scientists only understood that fluorescence originated from matter absorbing light energy and then re-emitting light of different wavelengths in the nineteenth century. In 1867, Goppelsroder achieved the quantitative detection of aluminium using the relationship between the fluorescence changes caused by the coordination of aluminium and mulberry pigment, which is the first example of fluorescence analysis.1 Subsequently, in 1880, Liebeman evaluated the relationship between fluorescence and structure, and provided empirical guidance enabling the synthesis and discovery of new fluorescent substances. In the 20th and 21st centuries, there has been an explosion of fluorescence analysis technology, during which many new breakthroughs in fluorescence instrumentation have been made. Over the years, fluorescence spectroscopy and time-resolved fluorescence have been used as tools for biochemistry and their application in biological sciences has significantly increased.2–6Current fluorescence-based imaging technology relies heavily on small molecule-based dyes because of their small size, easy chemical modification, excellent reproducibility and biocompatibility. The most widely developed organic small molecule based fluorescent dyes used include rhodamine, coumarin, fluorescein, anthocyanins, naphthalene amide, BODIPY and quinoline, which have been used for ion detection, enzyme analysis, cell imaging and other scientific applications.7–11 Moreover, according to the different approaches used for detection, several strategies have emerged for designing small molecular-based fluorescent probes including Intramolecular Charge Transfer (ICT), Förster/Fluorescence Resonance Energy Transfer (FRET), Twisted Intramolecular Charge Transfer (TICT), Through Bond Energy Transfer (TBET), Photoinduced Electron Transfer (Pet or PET), Excited State Intramolecular Proton Transfer (ESIPT) and the like.12–16 Owing to the advantages of non-invasiveness, high sensitivity, high spatial and temporal resolution, real-time, and in situ detection, fluorescence is now a leading methodology for cellular and molecular imaging, aimed at revealing the location and detection of intracellular molecules, even at the single-molecule level.
The microenvironment (local environment), including viscosity, polarity, acidic–basic status (pH), hypoxia, and temperature, is extremely important in controlling multiple biological processes. Firstly, viscosity is critical for diffusion-controlled processes and plays a pivotal role in diverse biological activities by governing transportation of nutrients and metabolic waste, signal transduction, and biomacromolecular interactions at the organism and cellular levels.17–19 Secondly, polarity, hydrophilicity/hydrophobicity, is a pivotal microenvironmental factor that participates in most cellular processes including enzyme-based catalysis, nascent protein maturation, activation of proteins and lipid composition.20–24 Thirdly, acid–base (pH) homeostasis is an essential factor for many processes such as proliferation, apoptosis and endocytosis etc.25,26 Fourthly, hypoxia, resulting from insufficient oxygen supply, is a pivotal characteristic of multiple illnesses, such as cardiac ischemia, solid tumors and inflammatory diseases.27,28 Last but not least, temperature determines many biological processes and most cellular events are performed at an optimum temperature, such as enzymatic reactions.29–31 Obviously, these factors collectively play vital roles in biological systems, and any abnormality can result in malfunctions and disease development. Hence, developing powerful tools to sense the microenvironment in living cells is urgently required.
Organelles are specialized structures within a cell, usually surrounded by their own lipid bilayers. However, intracellular micro-environments exhibit considerable heterogeneity at varying locations. For example, in typical mammalian cells, the pH is just 4.5 in lysosomes, while the mitochondrial pH is 8.0. In addition, the viscosity ranges from 1 to 2 cP in the aqueous phase of the cellular cytoplasm to above 100 cP in mitochondria. Note that organelles require an appropriate microenvironment to conduct their particular cellular functions, and disruption in the microenvironmental homeostasis could lead to malfunctions of organelles, resulting in disorder and leading to disease development. Towards that end, the monitoring of the microenvironment within definite subcellular organelles is important to help understand organelle-related physiopathology. Fluorescent sensors that can be targeted at specific intracellular regions are capable of reporting localized environmental bioinformation and revealing the contributions of the microenvironment to health and disease status. Hence, developing fluorescent probes for detecting the microenvironment within specific cellular regions has been extensively explored.
Over the past several years, interest in organelle-targetable fluorescent probes for the detection of the microenvironment has increased dramatically. Consequently, a variety of fluorescent sensors have been reported to track alternations in the microenvironment within specific cellular regions. To the best of our knowledge, there has not been any comprehensive and critical review published since 2015 on small molecule based fluorescent chemosensors for imaging the microenvironment within specific cellular regions. Prior to 2015, the Kim group reported a related review on this topic.32 In the review, the authors summarized macro-/micro-environment-sensitive chemosensing, and focused on summarizing and discussing the luminescence behaviour and structural characteristics for each probe. However, the strategies to write our review as well as the references covered are completely different. Notably, our review presents recent and important progress towards small molecule based fluorescent chemosensors for imaging the microenvironment within specific cellular regions since 2015. Since 2015, a few short reviews have mentioned microenvironmental fluorescent probes, but one review only summarized four examples related to the microenvironment,33 and the other reviews only highlighted solvatochromic dyes for polarity and viscosity.34–36 In addition, while Tang's group has summarized organelle-targeted chemosensors for sensing bioactive species,37 there has not been a comprehensive review for organelle-targetable fluorescent probes for microenvironmental detection. Considering the large number of research articles published in this area within recent years, we felt it was time to summarize the current state of the art for fluorescent probes that have been used to image the microenvironment within subcellular organelles.
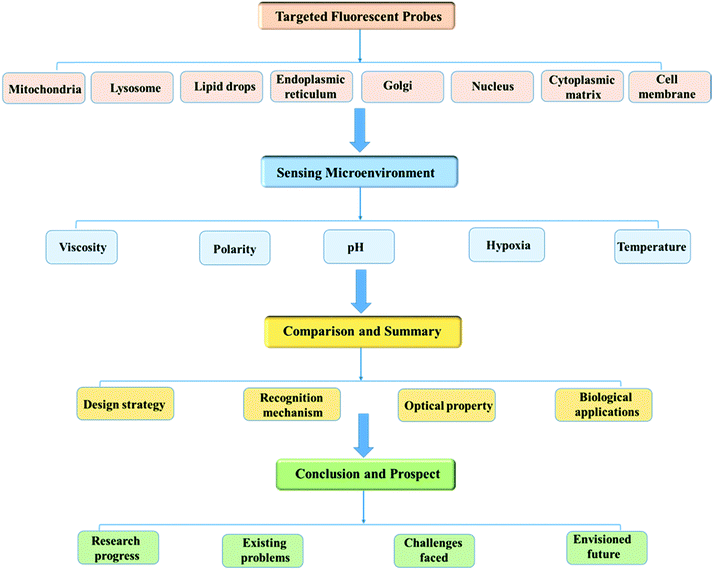
With this review we comprehensively highlight the recent progress in small molecule based fluorescent sensors for imaging the microenvironment within specific subcellular organelles. As shown in Fig. 1, in order to enhance understanding of the topic, this review will be presented according to the specific cellular regions stained by the probes, and in each suborganelle, the detection of microenvironmental factors by the probes is summarized. Moreover, each category contains a discussion of the important design strategies used, including the chemical synthesis, sensing mechanisms, fluorescent signals, and bio-imaging applications.
In summary, we describe the limitations of the current microenvironment-sensitive probes and the prospects for future development. We anticipate that this review will attract a general readership from the sensors, microenvironment detection, optical agent imaging, chemical biology, biology, and medical science communities.
2. Small-molecule fluorescent chemosensors for the mitochondrial microenvironment
2.1. The structure and function of mitochondria
Mitochondria are double-membrane-enclosed organelles found in most cells. Generally, the mitochondria are short rods or spheres with a diameter of about 0.5 to 10 μm. As the primary energy-producing chambers, mitochondria are important in diverse cellular events, such as adenosine triphosphate (ATP) production, and the apoptotic process of cell death.38–43 Besides providing energy, the mitochondria participate in a vast array of processes including cell differentiation, signalling, and apoptosis, and have the capacity to regulate cell growth and the cell cycle. Abnormality of the mitochondria can lead to various diseases,44–50 thus, monitoring the mitochondrial microenvironment has aroused great attention over recent years.2.2. Fluorescent chemosensors for mitochondrial viscosity
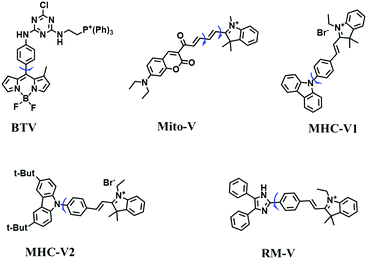
Mitochondrial viscosity is a salient feature reflecting the respiratory state and tricarboxylic cycles, the changes of which may greatly interfere with mitochondrial metabolism. Thus, it is important to precisely monitor changes in mitochondrial viscosity. The past few years have witnessed significant progress in the development of fluorescent sensors for sensing mitochondrial viscosity. In addition to the mitochondrial targeting group, such probes typically contain a fluorophore and a rotor. Generally, in lower viscosity media, molecular rotors can rotate relative to the fluorophore, which weakens the fluorescence or shortens the fluorescence lifetime. The rotation, by contrast, is inhibited in highly viscous media, thereby weakening non-radiative dissipation and markedly enhancing the fluorescence signals or the fluorescence lifetime. The general design concept and sensing mechanism of probes for mitochondrial viscosity are given in Fig. 2.In view of the urgency in detecting mitochondrial viscosity, various fluorophores have been used for developing probes able to detect mitochondrial viscosity. In 2016, the Chang group synthesized a boron-dipyrromethene (BODIPY)-based dye, BTV (Fig. 3).51 The reason for selecting BODIPY as the fluorophore was attributed to the high molar absorption coefficients and inertia to polarity and pH of the environment. In addition, the triphenylphosphonium moiety functioned as a mitochondria-targeting unit with the phenyl ring as the rotor. Due to the intramolecular rotation of the phenyl ring, BTV was sensitive to viscosity. As such, BTV presented an enhanced fluorescence signal toward increasing viscosity and could monitor mitochondrial viscosity changes in live cells through fluorescence lifetime imaging microscopy (FLIM). In 2019, the Lin group reported a Mito-V probe which was designed with a coumarin as the fluorophore and hemicyanine as a mitochondrial targeting group and rotor (Fig. 3).52Mito-V exhibited two-photon (TP) fluorescence and near infrared emission (NIR) properties. Interestingly, the Mito-V probe facilitated the monitoring of mitochondrial viscosity changes induced by various stimuli both in zebrafish and nude mice, respectively. This contribution provided a promising tool to monitor viscosity in complex biological systems. In addition, other probes such as MHC-V1, MHC-V2 and RM-V have also been developed for monitoring mitochondrial viscosity in living systems (Fig. 3).53,54 All these probes have an indole salt group as a targeting group and probes MHC-V1 and MHC-V2 have a carbazole as the fluorophore, while RM-V has an imidazole as the fluorophore. Note that while the original authors of these three probes claimed that the phenyl group was the rotor, we suspect that the indole salts may be another potential rotor to assist the probes in achieving an appropriate response to changes in viscosity. The structures of BTV, Mito-V, MHC-V1, MHC-V2 and RM-V are summarized in Fig. 3, in which the rotation position of each probe is indicated by a blue arrow.
Although many probes including commercial dyes have been widely explored for staining mitochondria, their applications have been limited due to numerous performance flaws. Firstly, the majority of them exhibited short absorption/excitation wavelengths ranging from 300–500 nm and such short wavelengths can damage living biological systems. Secondly, some probes exhibited poor water solubility, limiting their applicability in biological systems. Thirdly, several dyes were unable to perform for long periods under laser confocal microscopy due to high toxicity, low photostability and signal to noise (S/N) problems. Fourthly, many probes are dependent on membrane potential and produce inconsistent signals in the presence of a membrane potential uncoupler. Last but not least, many of the probes often require complex synthesis, which greatly hinders their modification. To overcome these issues, probes with improved performance have recently been developed.
In 2019, the Liu group reported an NIR probe NI-VIS where the quinoline moiety and the phenyl group are linked through a flexible-conjugated linker (Fig. 4A).55 The quaternary ammonium group not only facilitated water solubility, but also contributed to co-localization in the mitochondria. In low-viscosity media, the flexible linker could freely rotate and quench the fluorescence of the probe. As such, a 167-fold enhancement of fluorescence was observed as the viscosity changed from 1.0 cP to 999 cP. Importantly, NI-VIS not only exhibited a decrease of mitochondrial viscosity in starvation-induced mitophagy but could also monitor the viscosity changes in cirrhotic liver tissues (Fig. 4B). In addition, other NIR probes including RV-1 (655 nm),56TPSN (637 nm)57 and NV-1 (744 nm)58 with a rhodamine, triphenylamine and coumarin moiety as the fluorophore, respectively, have been developed for sensing mitochondrial viscosity variation by the Wang and Lin groups (Fig. 4C). For RV-1, the diethylamine cation was selected as the mitochondrial targeting group and an imidazole moiety as rotor; thus, the rotation of the imidazole group of the probe is responsible for viscosity detection. For TPSN, the benzothiazole salt unit was introduced for mitochondrial targeting owing to its positive charge. For NV-1, although the original authors attributed the probe response to viscosity to the free rotation of the C–N single bond between the diethylamino group and phenyl moiety of the coumarin, we expect that the rotation of the indole salts may also play an important role in sensing viscosity, and this idea needs to be further explored and verified by theoretical calculations. Note that, among these probes, RV-1 achieved a larger Stokes shift (82 nm) which is favourable for avoiding self-absorption. Given that these probes exhibit NIR emission, they have been successfully used for tracking mitochondrial viscosity changes in living systems.
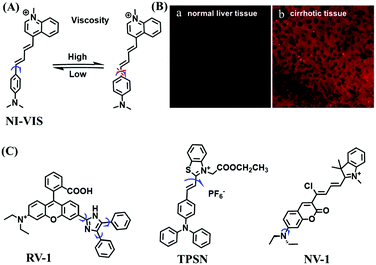 | ||
| Fig. 4 (A) Working principle of NI-VIS to viscosity. (B) Confocal imaging of (a) normal and (b) cirrhotic liver tissues stained with NI-VIS. Reproduced from ref. 56 with permission from the American Chemical Society, Copyright 2019. (C) Structures of the RV-1, TPSN and NV-1 probes. | ||
To improve water solubility, Tian and his colleagues in 2017, designed six pyridinium-based probes (NL1–3, PL1–3) (Fig. 5A) for sensing mitochondrial viscosity.59 In their design strategy, the pyridinium cation unit was selected as the targeting moiety owing to its high affinity for binding to mitochondria. The hydroxyl group was introduced to the phenylamine moiety to enhance the water solubility and the presence of equilibrium ions (anion, nitrate and hexafluorophosphate) also helps stabilize the molecules in the aqueous phase. In addition, different electron-donating substituents (such as methyl, ethyl, and ethoxy) were introduced to tune the TP absorption properties. Unfortunately, Tian et al. did not specify the rotor section but based on the previous analysis, the free rotation of the C–N single bond between the diethylamino group and phenyl moiety and free rotation of the pyridinium salt may be responsible for viscosity detection. Among these probes, NL1 could detect mitochondrial fission/fusion processes with the assistance of super-resolution microscopy. Subsequently, another water-soluble molecule MitoSN (Fig. 5B) was developed by Wang et al.60 In this structure, the introduction of the ethyl acetate group contributes to lipid solubility and biocompatibility. Note that the benzothiazole cation plays three roles: mitochondrial targeting, water-solubility and the rotor. With excellent solubility and low cytotoxicity, the probe MistoSN was used to sense the local viscosity and selectively stains the mitochondria of zebrafish.
 | ||
| Fig. 5 The molecular structures of (A) six water-soluble pyridinium derivatives and (B) the structure of MitoSN. | ||
High stability, low toxicity and high signal-to-noise ratio (SNR) are required for a chemosensor in order to achieve good imaging characteristics. Towards that goal, in 2016, a highly photostabile and ultrahigh SNR probe (TDHC) was developed by the Yoon group (Fig. 6A). The conjugation of the two rotatable indole salts to thiophene ensured a positive fluorescence response towards viscosity and TDHC was utilized for real-time monitoring of mitochondrial transport in primary cortical neurons.61 Unfortunately, TDHC failed in TP tissue imaging owing to the small TP absorption cross section value. Fortunately, in 2019, probe L with good tissue permeability, low toxicity and high photostability was designed for sensing the mitochondrial viscosity (Fig. 6B).62 The introduced diacetate moiety enhanced the lipid solubility of L and the indole salt not only increased the water solubility but also acted as a mitochondrial-targeting unit. Using L, Wang et al. was able to image fresh liver slices. Recently, another highly photostable probe SFC-Cy007 was designed by the Kim group (Fig. 6C).63SFC-Cy007 facilitated the sensing of ambient viscosity and exhibited enhanced emission at 697 nm. Utilizing SFC-Cy007, mitochondrial viscosity changes induced by monensin (Mon), nystatin (Nys) and lipopolysaccharide (LPS) were monitored. More importantly, the Kim group observed the viscosity distribution using SFC-Cy007 in deep regions of the hippocampus (Fig. 6D), providing a new tool for evaluating how the viscosity of the hippocampus correlates with episodic memory.
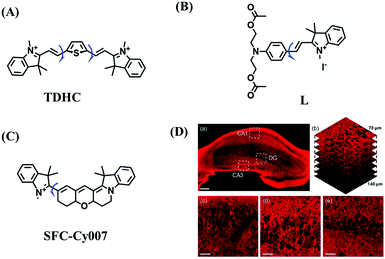 | ||
| Fig. 6 The structures of (A) TDHC, (B) L, and (C) SFC-Cy007. (D) Fluorescence imaging of hippocampus tissue stained with SFC-Cy007. Reproduced from ref. 63 with permission of Elsevier, copyright 2020. | ||
Other probes with improved performance have also been reported. For example, PFV, where the free rotation around the single bond between the indole derivative core and the double bond group contributed to viscosity detection was synthesized by Zhang and Jing et al.64 Experimental results demonstrated that PFV is not susceptible to interference from ROS/sulfur species at high concentrations (200 μM). In addition, the Ma group developed an efficient probe Mito-VP with long lifetime. Significantly, Mito-VP could detect viscosity changes during apoptosis, inflammation, hyperglycemia and antifungal medication.65
Based on the previous summary, we observed that most of the probes contain a positively charged unit that enables them to accumulate in mitochondria owing to attraction by the negative mitochondrial potential. However, mitochondrial targeting probes will diffuse away from abnormal mitochondria with reduced potential. To avoid membrane potential dependence, the Xiao group have developed a fixable BODIPY rotor Vis-A.66 In this structure, the probe not only possesses triphenylphosphonium but also contains a reactive aldehyde group that can form a stable covalent bond with the amino groups of mitochondrial proteins (Fig. 7A). When a mitochondrial potential decrease is induced by carbonylcyanide-m-chlorophenylhydrazone (CCCP), Vis-A continues emitting strong fluorescence in the mitochondria; however, Mito Tracker Deep Red completely disappeared (Fig. 7B), indicating that the Vis-A can immobilize in the mitochondria due to the aldehyde anchor. Moreover, the C–C bond between the BODIPY and the phenyl unit was restricted in high viscous media. For this reason, Vis-A was used for the FLIM imaging of mitochondrial viscosity changes stimulated by rotenone, a chemical affecting cell respiration by inhibiting the transfer of the electronic chain in mitochondria. Hence, this work provides a new strategy for mitochondrial immobilization.
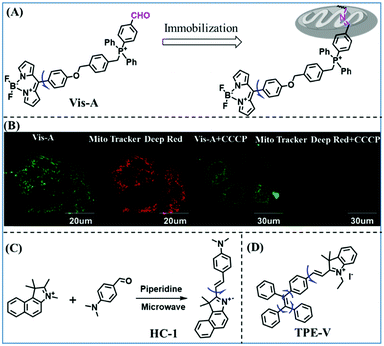 | ||
| Fig. 7 (A) Working principle of mitochondrial viscosity probe Vis-A; (B) Vis-A and Mito Tracker Deep Red imaging SMMC7721 cells with and without CCCP. Reproduced from ref. 66 with permission of the Royal Society of Chemistry, copyright 2017. (C) The synthetic route for HC-1; (D) the structure of TPE-V. | ||
While improved probes have been developed, they often require complex synthesis. Hence, probes that are easy to prepare are desirable. Accordingly, the Gulyani group reported a one-step synthesis of a red-emitting micro-viscosity probe HC-1 (Fig. 7C).67 In contrast to traditional viscosity response mechanisms of TICT, the probe monitored viscosity using a photo-isomerization based mechanism, and exhibited a ∼70 fold fluorescence enhancement from water to 100% glycerol at 610 nm. Remarkably, HC-1 could be used to stain the mitochondria of embryonic stem cells. This research provided novel information, which is pivotal for the maintenance of mitochondrial function and organization.
Traditional molecular rotors usually contain one rotor, which is less sensitive to viscosity. In order to develop probes ultrasensitive to environmental viscosity, the Lin group designed a probe (TPE-V) combining traditional molecular rotors with aggregation induced luminescence (AIE) dyes (Fig. 7D).68 Since AIE dyes possess more rotatable parts, TPE-V displayed ultrasensitivity towards viscosity (<15 cP) and a remarkable fluorescence enhancement (about 100-fold) at 650 nm on changing from water to 99 vol% glycerol. Importantly, TPE-V was used to detect mitochondrial viscosity changes in an inflammation cell model induced by LPS. This multi-rotor concept is promising for designing extraordinary functional fluorescent probes.
While the performance including water solubility, photostability, synthetic preparation, sensitivity and emission wavelength of traditional probes have been improved, the signals of most probes are influenced by external factors such as temperature, dye concentration, and instrument performance, leading to false positive results. Therefore, in 2018, in order to precisely detect changes in mitochondrial viscosity, a ratiometric sensor (TM-V) was developed by combining two fluorophores (Fig. 8A).69 One of the fluorescent dyes was inert to viscosity (green structure), serving as an internal signal reference, and the other was responsible for sensing viscosity (red structure). The probe displayed two separate emissive peaks at 477 and 609 nm, respectively, and the log (I609/I477) changed linearly with log (viscosity) (Fig. 8B). By virtue of probe TM-V, changes in mitochondrial viscosity of cells induced by ROS and nystatin (Nys) were quantitatively evaluated. In the same year, the Xu group developed a dual rotating site probe Qca-Cy2 for the ratiometric reporting of mitochondrial viscosity (Fig. 8C). The hybrid cyanine-carbazole platform of Qca-Cy2 facilitated an improved measurement of viscosity.70 Additionally, QCaz-Cy2 exhibited two emissive peaks at 385 (carbazole moiety) and 570 nm (large conjugate structure), respectively. Guided by this ratiometric fluorescence mode, the mitochondrial viscosity changes were quantitatively detected in cells (Fig. 8D) and in living tissues at depths of 50–130 μm (Fig. 8E).
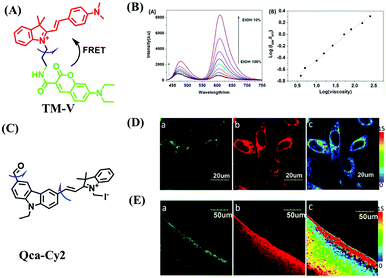 | ||
| Fig. 8 (A) The structure of the TM-V. (B) The fluorescence spectra of TM-V in different ethanol–glycerol solutions (left) and the linear plot between log (I609/I477) and log (viscosity) (right). (C) The structure of Qca-Cy2. (D) and (E) Images of cells and a rat liver slice loaded with Qca-Cy2 in (a) the blue channel, (b) the red channel and (c) the ratio image. (B) and (D and E) reproduced from ref. 69 and 70 with the permission of Elsevier, respectively, copyright 2018. | ||
Despite numerous probes for measuring mitochondrial viscosity, ascertaining the relationship between disorders and viscosity is still a major challenge owing to a lack of information available on complex physiological processes and multi-disease states in living animals. To disentangle many complicated biological relationships, probes for different pathology and physiology models have recently been developed. In 2019, the Lin group designed a fluorescence probe CBI-V for the measurement of mitochondrial viscosity in multidisease models.71 In the CBI-V structure, the carbazole moiety acted as the fluorophore and “indole salt” was responsible for the viscosity response and mitochondria localization (Fig. 9A). With the assistance of CBI-V, the imaging of viscosity in LPS-induced inflammation models of zebrafish and mice was performed. Moreover, using CBI-V, the Lin group imaged both normal and fatty livers and observed an increase in mitochondrial viscosity associated with fatty liver disease both on organs and in vivo (Fig. 9B and C). In the same year, another fluorescent sensor (EIMV) was developed by the same group for sensing viscosity changes in vivo. The imaging results indicated that drugs (Mon, Nys and LPS) treated and tumor-bearing mice exhibited brighter fluorescence than normal mice, indicating that the viscosity in vivo was increased in inflammatory lesions and carcinogenesis.72 In 2019, the Zhu group constructed a red probe NV by linking a naphthalimide and benzo[e]indolium through a C–C double bond to detect abnormal mitochondrial viscosity.73 To explore the relationship between cell viscosity and hyperglycemia, the Zhu group studied the blood of hyperglycemic and normal mice using NV and observed twice the fluorescence enhancement from the blood of hyperglycemic mice, demonstrating that the intracellular viscosity increased in hyperglycemic models. In addition, the Yang group developed BMVC for the real-time evaluation of mitophagy-specific viscosity dynamics in living cells74 and the Suhling group have developed two BODIPY-based probes (FMR-1 and FMR-2) to image mitochondrial membrane fluidity.75 These aforementioned studies not only revealed the relationship between mitochondrial viscosity and disorders but also advanced fundamental understanding of diseases related to mitochondrial viscosity.
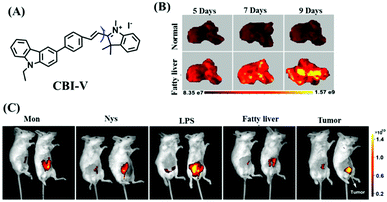 | ||
| Fig. 9 (A) The structure of CBI-V. (B) Fluorescence imaging of fatty livers at different times using CBI-V. (C) Fluorescence imaging of drug (Mon, Nys and LPS) treated, fatty liver and tumor-bearing mice. Reproduced from ref. 71 with permission from the American Chemical Society, Copyright 2019. | ||
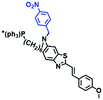
In addition to receptors for a single target, receptors capable of detecting two targets in biological systems have attracted significant interest recently. Using this strategy, several probes were developed for sensing mitochondrial viscosity and other biological small molecules. In 2017, the Lin group designed a dual-detection fluorescent sensor Mito-VH to sense mitochondrial viscosity and hydrogen peroxide (H2O2) using distinct fluorescence signals (Fig. 10A).76 In the structure, the free rotation of the phenyl ring rotor is responsible for viscosity related fluorescence changes and the boronate was used as a H2O2 recognition site. Mito-VH exhibited fluorescence enhancement at 607 nm from pure ethanol to 95% glycerol and hypsochromically shifted from 607 to 510 nm in the presence of H2O2. Notably, the probe exhibited a distinct emission peak shift of about 100 nm in the presence of viscosity and H2O2. With two channel imaging, Mito-VH was used to detect both changes in viscosity and endogenous H2O2 in the mitochondria at the cellular level. In addition, another TP fluorogenic probe Mito-LX was designed by Hao Li et al. for the simultaneous monitoring of mitochondrial viscosity and H2O2 using two signals.77 While the structure of Mito-LX is similar to that of Mito-VH, Mito-LX exhibits a longer wavelength response to viscosity changes (730 nm) and H2O2 levels (585 nm). Using Mito-LX, Hao Li et al. achieved dual-imaging of viscosity and H2O2 in live cells within deep tissues. Moreover, the imaging of dissected brains demonstrated that higher fluorescence was obtained in parkin null Drosophila brains than wild type Drosophila brains (Fig. 10B), indicating that higher levels of viscosity and H2O2 existed in Parkinson's diseased brains. This work discovered for the first time that the viscosity and the amounts of H2O2 are simultaneously increased in Parkinson's disease. In addition to the simultaneous detection of H2O2, simultaneous detection of viscosity and other substances has also been reported. For example, the Lu group designed a triphenylamine derivative TP-1Bz bearing one vinyl-linked N-methyl benzothiazole, for the dual imaging of viscosity and peroxynitrite (ONOO−) in mitochondria and the recognition mechanism is shown in Fig. 10C.78 In addition, other dual-response probes (Mito-VS and MBCB) designed for mitochondrial viscosity and sulphide have also been reported by different groups.79,80 These two probes exhibit the same recognition mechanism and the process for MBCB is shown in Fig. 10D. Note that with these two probes, HSO3− interrupted the π-conjugated system via a Michael-Addition reaction resulting in changes in the emitted fluorescence.
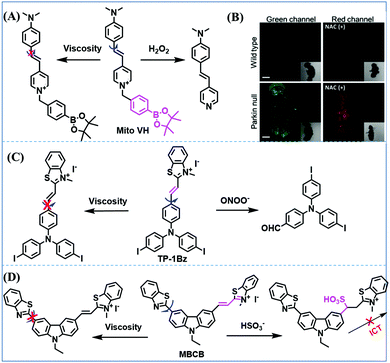 | ||
| Fig. 10 (A) The structure of Mito-VH. (B) Fluorescence images of wild type and parkin null Drosophila brains stained by Mito-LX in different channels. Reproduced from ref. 77 with permission of the Royal Society of Chemistry, copyright 2019. (C) The recognized mechanism of TP-1Bz for viscosity and ONOO−. (D) The recognized mechanism of MBCB for viscosity and SO2 derivatives. | ||
In order to help understand the progress made and remaining challenges for mitochondrial viscosity probes, the structures, properties and applications of viscosity-based probes described for mitochondrial viscosity are summarized and compared in Table 1. From Table 1, we can clearly observe that the existing small molecule fluorescent probes not only facilitate the monitoring of mitochondrial viscosity in complex pathological models but also facilitate the monitoring of mitochondrial viscosity and other bioactive small molecules. Moreover, two reference points were obtained by a comprehensive comparison of each sensor. From the perspective of probe structure, indole salt, benzothiazole salt and triphenyl phosphine are widely used as mitochondrial locators, and the active aldehyde group was introduced for the first time as a new mitochondrial targeting group to combine with mitochondrial proteins to achieve mitochondrial localization, thus effectively avoiding the disadvantages of traditional positive charge locators by mitochondrial membrane potential. In terms of biological applications, it is clear that mitochondrial abnormalities induced by Nys, Mon, LPS, glucose, rotenone, dexamethasone, phorbol myristate acetate and staurosporine have been extensively studied, but changes in mitochondrial viscosity in vivo are rarely reported. Therefore, future studies on mitochondrial viscosity should be focused in vivo and explore the relationships between abnormal mitochondrial viscosity and multi-disease models.
2.3. Fluorescent chemosensors for mitochondrial polarity
Mitochondrial polarity is a key feature in organelles and greatly influences cellular events. Currently, probes with D–π–A structure based on push-pull electron systems are the most widely used for biological polarity detection. The Tang group developed MCY-BF2 as the first NIR and ultrasensitive probe for detecting polarity, which contained a merocyanine unit with diverse lipophilic side chains and a difluoroboronate group (Fig. 11A).81 With MCY-BF2, the tertiary amine and difluoroboronate units act as electron donating and accepting units, respectively, producing a push–pull system. When the polarity increases, the MCY-BF2 displays a significant red shift and noticeable decrease in the fluorescence quantum yield. Utilizing MCY-BF2, Tang's team monitored the intrinsic polarity variations at different stages of growth in Caenorhabditis elegans (C. elegans) and revealed that the fluorescence at the embryonic development stage (EDS) is brighter than that at the young adult stage (YAS) (Fig. 11B). Importantly, they also quantified the dielectric constant (polarity parameter) as 7.20 ± 0.1 at EDS and 10.07 ± 0.29 at YAS. In 2015, Jiang et al. developed a ratiometric fluorescent sensor BOB for tracking mitochondrial polarity (Fig. 11C),82 where coumarin was chosen as the donor owing to its high quantum yield, large extinction coefficient and the benzothiazene group was used as an acceptor. The quaternary aromatic amino part improved water solubility and the benzyl group enables the probe to accumulate in the mitochondria. The diethylaminocoumarin moiety was responsible for the green fluorescence emission while the red emission comes from the enlarged conjugation and enhanced ICT from the diethylaminocoumarin unit conjugated with the hemicyanine group. Using ratiometric imaging, they discovered that the mitochondrial polarity in cancer cells is lower than that of normal cells. In 2017, Kaushik Pal and Apurba Lal Koner developed a 2,3-diketoindoline-based propeller-shaped solvatochromic fluorescent probe Mito-P1 for mitochondrial polarity (Fig. 11D).83 Unlike the previous mitochondrial polarity probes, Mito-P1 was not used for biological imaging. Instead, spectral scanning and linear unmixing techniques were used to reveal the increased mitochondrial polarity during apoptosis, and they interpreted this phenomenon was due to the production of reactive oxygen species in the process of apoptosis. In addition, the Ma group reported an NIR hydroxyl-hemicyanine dye HXPI-P (Fig. 11E) and tracked the decreased mitochondrial polarity under mitophagy.84 Unfortunately, although probes BOB, Mito-P1 and HXPI-P are used for the detection of mitochondrial polarity under complex physiological conditions, the original authors only achieved qualitative detection but not quantitative detection, which reduces the practical applicability of these probes.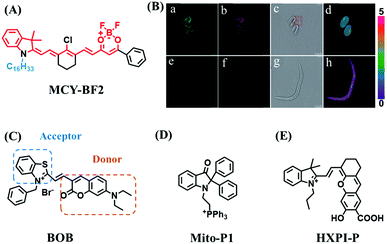 | ||
| Fig. 11 (A) Chemical structures of MCY-BF2. (B) Fluorescence imaging of the mitochondrial polarity in C. elegans at embryonic stage (a–d) and young adult stage (e–h) incubated with MCY-BF2. Reproduced from ref. 81 under a Creative Commons Attribution 3.0 Unported Licence, copyright 2016, the authors, published by the Royal Society of Chemistry. (C)–(E) The structures of BOB, Mito-P1 and HXPI-P, respectively. | ||
The above polarity-sensitive probes achieved mitochondrial localization using positive charges that are attracted by negative potentials. Moreover, the localization mechanism was systematically confirmed by the Gryko group using probes 4a–4c (Fig. 12A).85 However, under depolarizing conditions, the retention of the dye was reduced, resulting in changes in fluorescence signal. To avoid this problem, the Xiao group designed a novel sensor MITFPS for tracking local depolarization using TP FLIM (Fig. 12B).86 The design philosophy of MITFPS is consistent with the design strategy of their reported Vis-A for mitochondrial viscosity.66 Namely the lipophilic fluorophore attached to a hydrophilic triphenylphosphine (TPP) cation through a flexible alkyl linker accelerates penetration of the probe deep into the phospholipid bilayer, while the cationic TPP as the hydrophilic end interacts with phosphate head groups via electrostatic interactions, allowing formation of a stable assembly between MITFPS and the phospholipid bilayer. Another notable feature of MITFPS was the introduction of a reactive aldehyde to TPP, which condenses with amino acids of the adjacent membrane proteins, permanently anchoring MITFPS at the desired position. Compared with potential-dependent probes, MITFPS exhibited specific and stable mitochondrial retention. Utilizing MITFPS, the research indicated that the polarization of each mitochondria even within the same cell may be different.
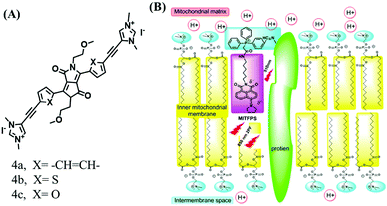 | ||
| Fig. 12 The structures of probe (A) 4a–4c. (B) Working principle of MITFPS: immobilization of the anchoring group on the surface and assembly of the fluorophore into the phospholipid layer. Reproduced from ref. 86 with permission of the Royal Society of Chemistry, copyright 2015. | ||
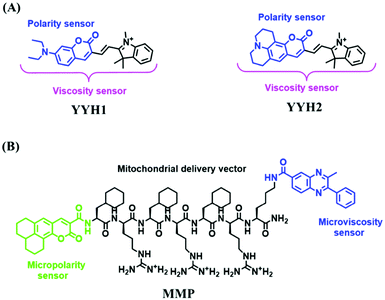
For the simultaneous detection of mitochondrial microviscosity and micropolarity, many groups have devoted a lot of effort. For example, the Qian group developed two fluorescent “off–on” probes YYH1 and YYH2 and they exhibited two emission bands (Fig. 13A).87 The emission peaks at shorter wavelengths were sensitive to the polarity, which may be attributed to the section of the probe without the indole moiety. While the longer wavelength region results from the whole π-conjugation system. Although both probes YYH1 and YYH2 have been used for bioimaging mitochondrial polarity or viscosity in living cells, they failed to quantitatively measure local mitochondrial microviscosity. Fortunately, the Kelley group developed another multifunctional mitochondrial probe MMP where the coumarin 343 was responsible for polarity with green emission, and the phenylquinoxaline acted as a viscosity rotor with blue emission, while the mitochondria-penetrating peptide served as a delivery vector (Fig. 13B).88MMP achieved precise, quantitative measurements of local mitochondrial microviscosity and micropolarity in the presence of a variety of agents perturbing cellular function. In addition, Gulyani et al. developed a series of probes, which facilitated the sensing of local ordering or viscosity of mitochondria and the tracking of mitochondrial dynamics.89
Although some progress has been made in the detection of mitochondrial polarity, the changes in mitochondrial polarity under some physiological and pathological conditions are still unknown. In particular, there are currently few reports on the detection of mitochondrial polarity in disease models. In the future, researchers should focus on exploring and revealing the relationships between mitochondrial polarity abnormalities and common diseases.
2.4. Fluorescent chemosensors for mitochondrial pH
Fluorescent probes commonly used in mitochondrial pH detection include mitochondrial targeting groups, fluorophore groups and pH recognition sites. This section will introduce the classification of pH recognition sites. Firstly, strategies involving the protonation and deprotonation of hydroxyl groups (OH) will be discussed. Under acidic conditions, this group exists in the form of –OH with weak electron-donating ability, while under alkaline conditions, due to deprotonation of the –OH, the hydroxyl group is converted to –O−. Therefore, the electron donating ability is enhanced, which increases the ICT effect of the whole molecule, resulting in a red shift of emission wavelength and an increase of fluorescence intensity. Based on this strategy, many probes have been conceived. In 2015, the Yu group designed the first ratiometric fluorescent probe CP for mitochondrial pH, where the coumarin, phenolic hydroxyl and pyridinium served as the fluorophore, recognition site and targeting group, respectively (Fig. 14A).90 Under acidic or neutral conditions, the hydroxyl group is a weak electron donating group, however, the deprotonated O− is a much stronger electron-donating group under alkaline conditions. Thus, the protonation or deprotonation of the phenolic hydroxyl group results in the fluorescence signals at 528 nm increasing and at 606 nm decreasing as the pH changes from 10.0 to 4.0. In a ratiometric mode, mitochondrial pH changes under acidification induced by pyruvate, and cellular apoptosis caused by CCCP were investigated. Likewise based on the protonation and deprotonation of the phenolic hydroxyl mechanism, the Yang group developed another probe Mito-pH-1 to quantify mitochondrial pH with changes in active temperature and H2O2 stimulation (Fig. 14B).91 In order to obtain the relationship between pH and H2O2, Mito-pH-1 was used to stain tumor cells (HeLa, MCF-7) and normal cells (NIH/3T3, HBE), and the imaging results indicated that the pH level increased mono-directionally upon stimulation using H2O2 in both tumor and normal cells (Fig. 14C). In addition, other probes such as CMP1,92NIR-F1,93 and HcP-H,94 based on hydroxyl groups have also been reported (Fig. 14D–F).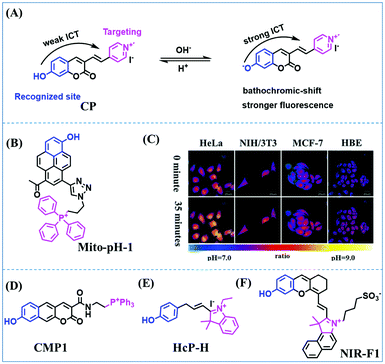 | ||
| Fig. 14 (A) Working principle of CP for pH. (B) The structure of Mito-pH-1. (C) Ratiometric images of different cells stained with Mito-pH-1 after treatment with H2O2 for 0 minute and 35 minutes. Reproduced from ref. 91 with permission of the Royal Society of Chemistry, copyright 2015. (D–F) The structures of CMP1, NIR-F1, and HcP-H. Blue groups represent pH recognition sites, and purple groups represent mitochondrial targeting groups. | ||
In addition to hydroxyl groups, fluorescent probes using recognition sites based on xanthene are also widely used for pH detection. For example, in 2015, the Guo group reported Mito-pH, which was constructed via hybridizing a pH-sensitive fluorescein (spirolactone form) fluorophore with a pH-insensitive cyanine fluorophore (Fig. 15A).95 When the pH was varied from 4.85 to 9.65, the emission spectra at 520 nm increased 40 fold, and the high pH facilitated spiroxanthen-3-one ring opening. Based on the same switching mechanism, FDI was developed (Fig. 15B). The probe exhibited superior cell-membrane permeability and mitochondrial targeting when compared with a commercial mitochondrial tracker.96 Although the probes Mito-pH and FDI have been used for biological applications, the fluorescence emission wavelengths are outside of the NIR region. Fortunately, Shuai Xia et al. designed two probes (MitopH1 and MitopH2) by modifying the structure of xanthene to further improve the performance of the molecules (Fig. 15C and D).97 In the design strategy, positively charged cyanine dye was selected as the TBET donor and mitochondrial targeting group, and hemicyanine dyes containing the xanthene structure were chosen as TBET acceptors. Meanwhile, 2-morpholinoethylamine was modified to afford hemicyanine dyes with pH-activated closed spirolactam structures. Under acidic conditions, MitopH1 exhibits an additional fluorescence peak at 740 nm because acidic pH promotes spirolactam ring opening of the hemicyanine acceptor, resulting in highly efficient TBET from the cyanine donor to the hemicyanine acceptor. Meanwhile, MitopH2 emitted fluorescence at 750 nm in acidic media, and the 15 nm redshift when compared with MitopH1 is probably due to an additional benzene ring in MitopH2. In addition, the probes MitopH1 and MitopH2 exhibited longer emission than Mito-pH and FDI. It is worth noting that although the above probes are all based on xanthene-based switching rings as recognition sites, the rings of the Rhodamine-based probes are open under acidic conditions, while the fluorescein platform-based probes are closed under acidic conditions.
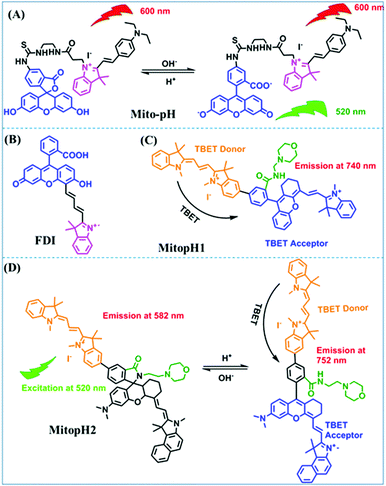 | ||
| Fig. 15 (A) Working mechanism of pH sensing by Mito-pH; (B and C) the chemical structures of FDI and MitopH1; (D) the recognized mechanism of MitopH2 towards pH changes. | ||
In addition, dual-activated probe (CFT) has been reported for imaging both O2˙− and pH levels of mitochondria by the Tang group (Fig. 16A).98 In this structure, the caffeoyl moiety was selected as the O2˙− recognition group and the fluorescein moiety serves as the pH responsive group. Using two sets of distinct blue-green fluorescence signals, changes in O2˙− or pH levels were differentiated at the tissue level (Fig. 16B). In addition, dual-targeting probes have been reported by several different groups. In 2018, the Yu group developed a rhodamine spirolactam based fluorescent sensor Rh-BMDZ for pH sensing (Fig. 16C).99 The introduction of a benzimidazole allows for ring-opening/ring-closing reaction of the spirolactam through the process of protonation/deprotonation of the –NH in Rh-BMDZ. The presence of 2-phenyl-1H-benzo[d]-imidazole, makes the N atom less basic and nucleophilic, rendering Rh-BMDZ more sensitive to pH detection. In neutral solution, a small amount of Rhodamine spirolactam can transform into ring-opened zwitterions, which can monitor the pH and localize in the mitochondria. Meanwhile, alkalescent benzimidazole attracts Rh-BMDZ into lysosomes, thus making Rh-BMDZ simultaneously accumulate in the mitochondria and lysosomes.
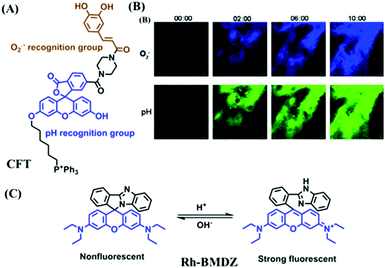 | ||
| Fig. 16 (A) The structure of CFT. (B) Time-dependent TP fluorescence images of tumorous mice pretreated with 10 μM CFT and 100 μM mdivi-1. Reproduced from ref. 98 with permission from the American Chemical Society, Copyright 2017. (C) The mechanism of Rh-BMDZ towards pH changes. | ||
The properties and structures of the mitochondrial pH probes above are summarized in Table 2. The structures, linear range, pKa, and biological applications have been comprehensively compared. Among these probes, only NIR-F1, FDI, MitopH1 and MitopH2 realized NIR imaging. MitopH1 and MitopH2 achieved detection in a very acid environment. Unfortunately, pH measurements in extremely alkaline environments are not currently available. In terms of biological applications, abnormal physiological pH changes stimulated by a variety of chemical agents at the cellular level have been realized and the agents used mostly include chloroquine, dichloroacetate and nigericin. However, there has been minimal tracking of pH in vivo, which is not conducive for revealing the relationship between mitochondrial pH abnormalities and diseases. In the future, NIR and TP probes should be developed for the visualization of mitochondrial pH in disease models.
2.5. Fluorescent chemosensors for mitochondrial hypoxia
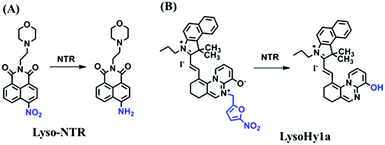
Hypoxia is a situation where tissue exhibits a low oxygen state due to an imbalance in oxygen consumption and supply. Various diseases, including stroke, inflammation, and cancer are correlated with hypoxia. Hypoxia can lead to an increase in reductive stress, resulting in an overexpression of intracellular reductases, such as azoreductase, lipoyl dehydrogenase, and nitroreductase (NTR). Among these, NTR is the most studied with nicotinamide adenine dinucleotide (NADH) as a donor. In this part of the review, the content will be classified according to the recognition sites and further categorized based on output signals including “turn-on”, “turn-off” and “Ratiometric” mode.4-Nitrobenzene has been one of the most widely used reaction sites for developing probes for NTR, where the reduction of the 4-nitrobenzene group by NTR, is followed by a 1,6-rearrangement-elimination process. Based on this reaction many probes have been developed. Including “turn-on” probes based on 4-nitrobenzene which have been reported by a number of groups. In 2015, the Ma group developed MitoHy1 where 4-nitrobenzene (quenching and targeting group) was connected to a hemicyanine fluorophore (Fig. 17A).100 A linear response was obtained over a range from 0.05–3.0 μg mL−1 NTR. Therefore, the distribution of NTR in zebrafish was visualized, which indicated that NTR primarily exists in zebrafish yolk sacs. In addition, other “turn-on” probes based on 4-nitrobenzene have subsequently been developed.101–105 Similarly, a “turn-off” type probe (Cy7-NO2) constructed by decorating the cyanine skeleton with an aromatic –NO2 unit has been developed (Fig. 17B).106Cy7-NO2 rapidly and selectively responds to NTR at 790 nm. Importantly, when Cy7-NO2 was injected into an A549 induced tumor mouse model via intratumoral injection an approximate 3.5-fold signal intensity decrease was observed in hypoxic tumors.
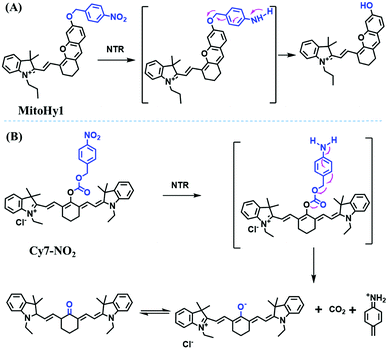 | ||
| Fig. 17 (A) The reaction mechanism of MitoHy1 for NTR. (B) The mechanism for monitoring NTR activityusing Cy7-NO2. | ||
In addition to switching probes, ratiometric probes based on 4-nitrobenzene for detecting NTR have been reported, such as CyNNO2 (Fig. 18A)107 and NIR-HMA (Fig. 18B).108 The reaction of CyNNO2 with NTR involves the cleavage of the carbamate unit and release of benzylamine-substituted tricarbocyanin. Upon reaction with NTR, the fluorescence signals of CyNNO2 at 805 nm are reduced, while a new hypsochromic-shifted peak at 747 nm was generated with LOD of 0.0058 ng mL−1. In addition, using NIR-HMA, the complete process of mitophagy in living cells has been tracked in real-time and the results indicated that with the prolongation of hypoxia, the fluorescence emission intensity in the green channel increased gradually while fluorescence in the red channel decreased indicating that mitophagy may be a process of self-protection allowing cells to adapt to microenvironments with insufficient oxygen supply (Fig. 18C).
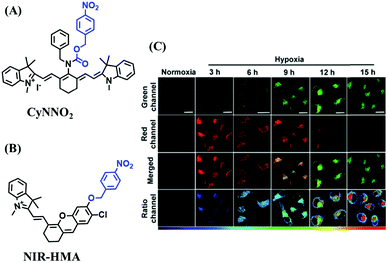 | ||
| Fig. 18 (A) The structure of CyNNO2. (B) The structure of NIR-HMA. (C) Fluorescent imaging of HeLa cells stained with NIR-HMA under normoxic or hypoxic conditions for different times. Reproduced from ref. 108 under a Creative Commons Attribution-NonCommercial 3.0 Unported Licence, copyright 2018, the authors, published by the Royal Society of Chemistry. | ||
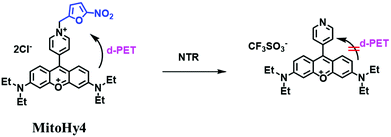
Based on a similar mechanism where the –NO2 group could be reduced by NTR to a hydroxylamine or an amino group, the nitrofuran unit has been used as a reaction site for NTR detection. In 2018, Yang et al. developed a probe (MitoHy4) with pyronine-pyridine structure.109 In the presence of NTR, the nitrofuran moiety of MitoHy4 was reduced and eliminated, thereby suppressing the d-PeT process (Fig. 19). Moreover, MitoHy4 displayed a turn-on response at 604 nm with an LOD of 2.2 ng mL−1. Furthermore, MitoHy4 was used to image live HeLa and Ges-1 cells.
The properties and structures of the developed mitochondrial hypoxia probes mentioned above are summarized in Table 3 where the probe type, LOD, linear range and biological applications are presented. Among these probes, Cy7-NO2 exhibits the widest linear range for NTR detection and the probe achieved excellent LOD (0.0058 ng mL−1) for NTR detection. While the emission wavelengths of probes used to detect mitochondrial hypoxia have mostly attained the NIR region, researchers have not fully explored the use of these probes for the detection of endogenous hypoxia in complex biological systems. In the future, researchers need to focus on the qualitative and quantitative detection of hypoxia in diseases and physiological abnormalities.
2.6. Fluorescent chemosensors for mitochondrial temperature
Mitochondrial thermodynamics are key to understanding the cellular activities associated with homeostasis and energy balance. As such a ratiometric fluorescent dye (Mito-RTP) combining rhodamine B and CS NIR dye was used to visualize temperature (Fig. 20A).110 Using this design strategy, the rhodamine B moiety contributed to the temperature sensitivity due to the rotation of diethylamino groups on the xanthene ring, causing a fluorescence decrease with increasing temperature (Fig. 20B). Meanwhile, the CS NIR dye acted as a calibration group, which is stable at various temperatures due to the restriction of free rotation within the molecule. Note that amide bonds of the hexamethylenediamine linker were methylated to avoid formation of the deprotonated quenched state. The fluorescence of the Mito-RTP decreases linearly with increasing temperature and was successfully used for visualizing the FCCP-coupled temperature increase in the mitochondria within HeLa cells. In the same year, based on rhodamine, another fluorescent thermometer (Mito thermo yellow) was developed to sense the intracellular temperature gradient produced by the external heating of diverse cells (Fig. 20C).111 Likewise, Chrétien et al. also designed a new temperature-sensitive probe for measuring mitochondrial temperature.112 These studies facilitated an understanding of the role of temperature in mitochondrial activity.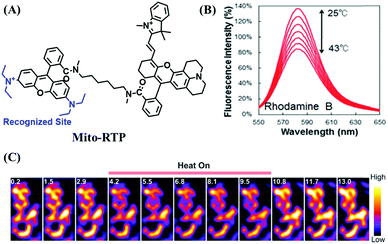 | ||
| Fig. 20 (A) The structure of Mito-RTP. (B) Fluorescence spectra of rhodamine B (λex = 563 nm) measured using a spectrophotometer every 3 °C from 25 °C to 43 °C. (C) Expanded images in 3T3 cells incubated with Mito thermo yellow. (B) and (C) reproduced from ref. 110 and 111 with permission of the Royal Society of Chemistry, copyright 2015. | ||
3. Small-molecule fluorescent chemosensors for the lysosomal microenvironment
3.1. The structure and function of the lysosome
Lysosomes are organelles found in most eukaryotic cells, and are saclike structures coated with a monolayer membrane and have a diameter of about 0.025–0.8 μm, which were discovered in mouse liver cells by Belgian scholar Cristian de Duve et al. in 1955.113 Lysosomes contain a variety of hydrolases, for digesting various exogenous and endogenous macromolecular substances such as proteins and polysaccharides.114 In addition, lysosomes play a vital role in maintaining cellular balance including recovering damaged organelles and plasma membrane repair etc. Note that when cells age, lysosomes rupture, releasing hydrolytic enzymes, which digest the entire cell. Generally, lysosomes are the most acidic (pH 3.8–6.6) and viscous (47–190 cP at 25 °C) organelles.115 It has been demonstrated that disorders of lysosomes are correlated with many diverse diseases.116–122 Therefore, more and more research on probes that can selectively-target lysosomes is required to explore the detailed biological function of lysosomes.123–1253.2. Lysosome-targeted fluorescent chemosensors for viscosity
The viscosity of lysosomes is a key indicator of lysosomal functionality, therefore developing powerful tools for detecting lysosomal viscosity are in high demand. Towards that goal, many probes have been developed for lysosomal viscosity. For example, in 2018, the Meng group reported the first lysosome targeted TP fluorescent probe (Lyso-NP) as a viscosity probe for monitoring autophagy.126Lyso-NP was constructed using phenylacetylene-substituted naphthylamine as the TP fluorophore, and the dimethylaminobenzene group was chosen as a rotor, and morpholine was added to the naphthylamine fluorophore. The fluorescence response mechanism was elucidated as the restricted rotation of the C–C single bond between the dimethylaminobenzene group and the ethynyl group (Fig. 21A). Using Lyso-NP, the Meng group quantified the viscosity distribution using FLIM imaging and revealed that viscosity in the lysosomal domain was 9.04–94.8 cP and the average value of viscosity was ∼45.36 cP. Importantly, the probe was also used to track changes in lysosomal viscosity during autophagy induced by starvation, the experimental results indicated that lysosomal viscosity changed from 46.37 to 63.47 during the 0–4.0 h of autophagy (Fig. 21B). In the same year, the Yu group designed a new probe Lyso-B for the real-time measurement of lysosomal viscosity using FLIM (Fig. 21C).127 The design strategy used morpholine groups as rotors and lysosome-targeting groups. The electron-rich morpholine group can quench the BODIPY fluorophore through PeT. In contrast, when the Lyso-B spreads into lysosomes, the morpholine moiety is protonated, therefore transforming from an electron donator to an electron acceptor. As a result, the PeT pathways become blocked, turning the fluorescence on. In the case of high viscosity within lysosomes, Lyso-B will emit stronger fluorescence due to inhibition of morpholine rotation. Lyso-B was used to explore the impact of dexamethasone on lysosomal viscosity in real time using FLIM and indicated that lysosomal viscosity in HeLa cells increased from 15 to 159 cP following dexamethasone treatment.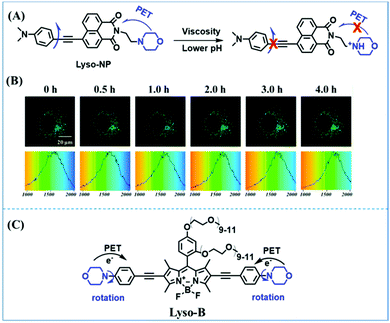 | ||
| Fig. 21 (A) The mechanism of the Lyso-NP for viscosity measurement. (B) FLIM of Lyso-NP stained under starvation (autophagy) conditions. Reproduced from ref. 126 with permission from the American Chemical Society, Copyright 2018. (C) The structure and proposed mechanism of Lyso-B for viscosity measurement. | ||
However, PeT-based probes like Lyso-B, are highly pH dependent, resulting in unstable signals due to lysosomal pH changes. To avoid this problem, the Tang group developed a pH independent probe with AIE properties (PIP–TPE) (Fig. 22A). The introduction of the two piperazine groups guarantees lysosome selectivity and the probe exhibited a deep blue color when not aggregated and a yellowish-green color in the bulk solid.128 In contrast to the working mechanism of PeT for most lysosome probes, increased fluorescence signals in lysosomes were attributed to the viscosity restricting intramolecular rotation and C–C twisting. Moreover, compared to Lyso Tracker Red, PIP–TPE exhibited better photostability. Other acidic pH independent probes including Lyso-Fl (Fig. 22B),129IQ-LV37 (Fig. 22C)130 and Lys-VBOD (Fig. 22D)131 have also been developed for tracing lysosomal viscosity changes by different researchers. In addition to being independent of pH, Zheng et al. also improved the emission wavelength of the probe and constructed a NIR fluorescent (685 nm) probe Lyso-BTC (Fig. 22E) where the intramolecular rotation between N,N-dimethylamino benzene and benzothiazole breaks the conjugation between the two parts, resulting in weak fluorescence in low viscous media.132 The structures of probes PIP–TPE, Lyso-Fl, Lys-VBOD, IQ-LV37 and Lyso-BTC are given in Fig. 22, and the freely rotating parts of each probe are indicated by blue arrows.
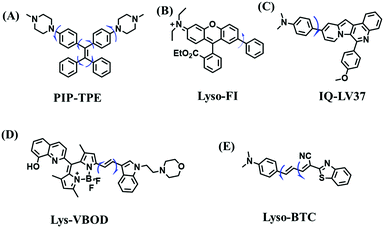 | ||
| Fig. 22 (A)–(E) are the structures of PIP–TPE, Lyso-Fl, IQ-LV37, Lys-VBOD and Lyso-BTC, respectively. | ||
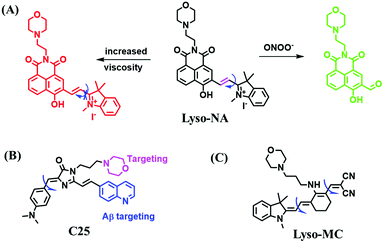
Analogous to probes for mitochondrial viscosity, the double activation concept has been adopted for lysosome-viscosity probes. In particular, abnormalities in viscosity and ROS in lysosomes are closely related with many diseases. As such, the Zhang group designed a powerful probe Lyso-NA for monitoring lysosomal viscosity and ONOO− in living cells (Fig. 23A).133Lyso-NA was synthesized by attaching a hemicyanine group to a naphthalimide unit. The free rotation of the hemicyanine moiety was suppressed in highly viscous media, resulting in a dramatic fluorescence enhancement at 610 nm as the viscosity increased. Simultaneously, in the presence of ONOO−, the C![[double bond, length as m-dash]](https://www.rsc.org/images/entities/char_e001.gif) C double bonds between the naphthalimide group and the indolium ring were oxidized and then cleaved, thereby turning on the fluorescence at 510 nm. Importantly, Lyso-NA could detect lysosomal viscosity and endogenous ONOO− in living systems. In 2020, Zhang and Yan et al. developed C25 for simultaneously monitoring lysosome viscosity and amyloid-β peptide (Aβ) fibrils (Fig. 23B). In their design strategy, the quinolone moiety and dimethylamino group were introduced to improve Aβ targeting and extend the π conjugation to produce a redshift in wavelength.134 Thus, probe C25 afforded obvious and distinguishable fluorescence enhancements with Aβ fibrils and viscosity at 570 and 600 nm, respectively. In addition, Zhang et al. have designed a dual-functional fluorescent dye Lyso-MC (Fig. 23C) for detecting lysosomal viscosity and Aβ at the cellular level.135
C double bonds between the naphthalimide group and the indolium ring were oxidized and then cleaved, thereby turning on the fluorescence at 510 nm. Importantly, Lyso-NA could detect lysosomal viscosity and endogenous ONOO− in living systems. In 2020, Zhang and Yan et al. developed C25 for simultaneously monitoring lysosome viscosity and amyloid-β peptide (Aβ) fibrils (Fig. 23B). In their design strategy, the quinolone moiety and dimethylamino group were introduced to improve Aβ targeting and extend the π conjugation to produce a redshift in wavelength.134 Thus, probe C25 afforded obvious and distinguishable fluorescence enhancements with Aβ fibrils and viscosity at 570 and 600 nm, respectively. In addition, Zhang et al. have designed a dual-functional fluorescent dye Lyso-MC (Fig. 23C) for detecting lysosomal viscosity and Aβ at the cellular level.135
All of the probes mentioned above are summarized in Table 4, where the structure, optical properties, detection range, and biological applications of each probe are described. Similar to the mitochondrial viscosity sensors, the lysosomal viscosity probes generally include a third component, the fluorophore, the rotor, and the locator group. Morpholine is widely used as a lysosomal locator. However, the electron donating ability of morpholine is affected by pH and thus affects the fluorescence of the probes through the PeT processes. While some researchers have developed pH-independent probes for lysosomal viscosity detection, there are still many mysteries surrounding these probes. For example, in the case of Lyso-Fl, the authors did not explain clearly why the probe that possesses a positive dimethylamine was in the lysosome rather than in the mitochondria. Therefore, the development of lysosomal probes in the future should not only avoid pH interference but also include the development new lysosomal targeting groups and explore the localization mechanism. In addition, in terms of biological applications, the current sensors have been used for the detection of lysosomal viscosity at the cellular level, with almost no detection in vivo. In the future, research should focus on the development of fluorescent probes with good biocompatibility and long excitation and emission wavelengths to achieve the detection of lysosomal viscosity in vivo.
3.3. Lysosome-targeted fluorescent chemosensors for polarity
Most traditional polarity-sensitive probes are based on ICT where a significant bathochromic shift in the emission wavelength and/or a decreased fluorescence intensity is observed in highly polar media. This form of “turn-off” polarity probe is suitable for monitoring the structure and activity of hydrophobic proteins and membranes. However, when local hydrophilicity increases in cases such as protein unfolding, the application of “turn-off” type probes are limited, whilst, “turn-on” type probes are more suitable. Therefore, in 2016, the Peng group developed several “turn-on” polarity-sensitive sensors (BP1–4), which were constructed by attaching a quaternary ammonium group to a BODIPY core via different carbon linkers (Fig. 24).136 Among them, BP-2 displayed the best polarity-sensing performance with a cationic quaternary ammonium at the meso-position of the BODIPY scaffold. In a nonpolar environment, the positively charged quaternary ammonium exhibited low negative reduction potential and can act as an excellent electron acceptor for the BODIPY core, thus quenching the BODIPY signals through a d-PeT pathway. While in polar media, the reduction potential of the acceptor reduces, and thus the fluorescence is restored due to blocking of d-PeT. With BP-2, the local hydrophilicity was monitored in disordered lysosomes. Significantly, this research provides a new perspective for the development of “turn-on” polarity-sensitive probes.Compared with switching type probes, ratiometric probes are more desirable. As such, in 2018, the Meng group designed the first ratiometric probe NOH for detecting lysosomal polarity (Fig. 25A).137NOH displayed a ratiometric response towards various polarity solvents (λem = 474, 552 nm) (Fig. 25B), which represented the first quantitative evaluation of lysosomal polarity in MCF-7 cells providing a value of 0.224. Furthermore, Zhang et al. designed another ratiometric fluorescent sensor DC for imaging lysosome micropolarity in cancer cells (Fig. 25C).138 The lowest Φf = 0.018 was calculated using ratiometric fluorescence signals. Importantly, DC can estimate the apoptosis of cancer cells in situ using multi-modal imaging methods.
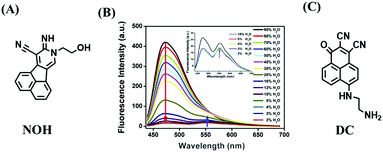 | ||
| Fig. 25 (A) The structure of NOH. (B) Fluorescence spectra of NOH in a mixture of H2O and 1,4-dioxane. Reproduced from ref. 137 with permission of Elsevier, copyright 2018 (C) Chemical structures of DC. | ||
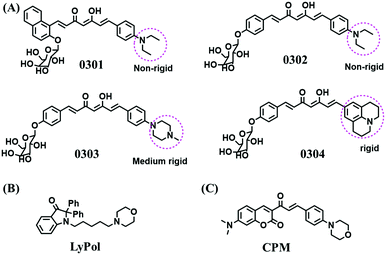
The relationship between lysosomal polarity and cancer has been investigated by numerous groups. For example, the Li group developed curcumin-based fluorescent probes for polarity (0301–0304) by attaching a galactose group to improve the water solubility (Fig. 26A).139 Compared with other polarity-sensitive probes, both 0301 and 0302 displayed a blue-shift rather than a red-shift in wavelength. The research indicated that normal cells exhibit higher lysosomal polarity than cancerous cells and the lysosomal polarity changed after being treated with dimethylsulfoxide and sucrose. A similar phenomenon was also observed using LyPol (Fig. 26B) and CPM (Fig. 26C).140,141 This research provides a new strategy for cancer diagnostics through deciphering the interior polarity of lysosomes.
To clarify lysosome polarity in complex biological systems, a powerful probe MND-Lys was developed by the Lin group for monitoring lysosome polarity (Fig. 27A).142MND-Lys was constructed using a naphthalimide (acceptor), diphenylamine (donor), benzyl (linker) and morpholine (targeting group). The push–pull electronic structure enables the probe to respond to polarity, and therefore, displays an excellent solvatokinetic effect with a direct linear relationship between the maximum wavelength and the solvent polarity. The probe exhibited stronger fluorescence in embryos than adult zebrafish (Fig. 27B), demonstrating that as zebrafish grow and develop the polarity gradually increases. In addition, the decreased polarity was tracked using MND-Lys in an inflammatory and obese mice model. Meanwhile, Lyso-OC (Fig. 27C) and Lyso-OSC (Fig. 27D) were used to monitor autophagy in real time and revealed that lysosomal polarity increases during autophagy.143,144 These results prompted the evaluation of lysosome-associated bioprocesses and metabolic diseases.
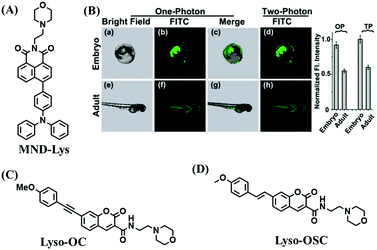 | ||
| Fig. 27 (A) The structure of MND-Lys. (B) Fluorescence imaging and normalized fluorescence intensity of the lysosomal polarity in embryo (a–d) and adult zebrafish (e–h). Reproduced from ref. 142 with permission of the Royal Society of Chemistry, copyright 2019. (C) and (D) are the structures of Lyso-OC and Lyso-OSC, respectively. | ||
A dual targeting strategy has been used for developing polarity probes. For example, the Yang group designed a naphthalimide-based fluorescent dye, NIM-7, for the simultaneously dual-colour monitoring of lipid drops (LDs) and lysosome dynamics. NIM-7 facilitates the three-dimensional (3D) imaging and quantitative analysis of LDs (similar to toluene) and lysosomes (similar to DMSO).145 Due to the hydrophobicity of the probe, NIM-7 accumulates in LDs and emits a yellow fluorescence. Simultaneously, due to the protonation in acidic lysosomes, NIM-7 exhibits a red fluorescence. In 2020, the Kim group designed a two-dye sensor, RPS-1 combining hydrophilic and hydrophobic environmentally sensitive fluorophores, which was used to stain various organelles in cells. Importantly, RPS-1 could sensitively and quantitatively track a wide range of intracellular polarity changes, and confirmed that lysosomes have the highest polarity.146
Although there are a significant number of reports on the polarity of lysosomes, they are at the cellular level, and mainly evaluate polarity changes in the state of chloroquine-induced cell dysfunction and lysosome polarity differences between normal cells and cancer cells. However, there are limited reports on the detection of lysosomal polarity in vivo. Therefore, future research should focus on the in-depth evaluation of the changes in lysosomal polarity in vivo and for a variety of disease models.
3.4. Lysosome-targeted fluorescent chemosensors for pH
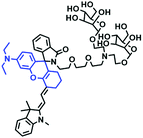
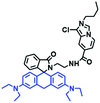
The simple and convenient measurement of lysosomal pH variations in living systems, has attracted considerable attention. Consequently, numerous probes have been developed. In this section, probes have been classified according to the recognition sites and the fluorescence signalling mechanism is discussed.Rhodamine dyes with spirocyclic structure are ideal “off–on” type fluorophore candidates. Generally, there is no fluorescence in basic and neutral media due to the prevalence of the ‘‘closed’’ state of the spirocyclic structure. However, in acidic pH, the ring opens, resulting in a marked fluorescence enhancement. Based on this structural change, many pH sensitive probes have been developed. In 2015, the Li group developed three rhodamine based fluorescent dyes RS1, RS2 and RS3.147 As is shown in the recognition mechanism of RS1 (Fig. 28A), pH controls the opening and closing of the rhodamine-lactam rings, with good response over a pH range from 4.0–6.0. Meanwhile, the amine functional group helps the probes accumulate selectively in an acidic lysosome environment. In addition, by attaching additional conjugation, the distribution of the N atom lone pair electrons in the lactam was significantly altered, so that RS2 and RS3 exhibited higher quantum yields and better sensitivity for staining lysosomes in vivo. Other rhodamine-based fluorescent probes, including RML,148Lyso-hNR,149RD,150NRL151LysopHa1 and LysopHb1152 have also been developed, and the structure of these probes is very similar to that of RS1–3. However, it is worth noting that LysopHa1 and LysopHb1 that incorporate mannose residues via 2,2-(ethylenedioxy)diethylamine tethered spacers to the fluorophore exhibit enhanced water solubility and biocompatibility. The probes structures are given in Fig. 28B.
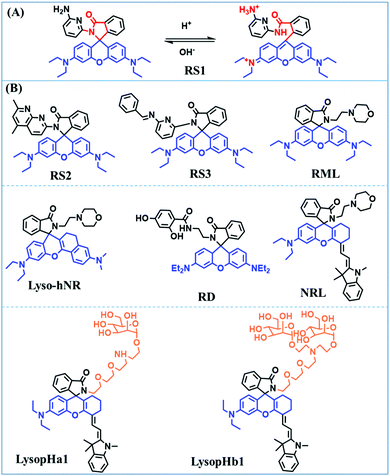 | ||
| Fig. 28 (A) The recognition mechanism of RS1 for pH. (B) Chemosensors based on rhodamine for lysosomal pH. | ||
In addition to switching type, ratiometric probes based on a rhodamine structure have been widely exploited for the monitoring of lysosomal pH. In 2015, the Zhang group reported a ratiometric fluorescent sensor FR-Lys for detecting dynamic changes in lysosomal pH.153 The xanthane moiety displays pH-regulated opening and closing of the lactam ring, and the o-hydroxy benzoxazole unit exhibits a pH modulated ESIPT process (Fig. 29A). Subsequently, the Zhao group designed four rhodamine-based derivatives RC1,154RNL,155RhMP156 and RMPM,157 to achieve ratiometric pH detection based on a FRET mechanism. In all four probe structures, the rodamine dye served as the FRET receptor and the recognition mechanism was based on the on–off design of the rhodamine lactam. Among these, RC1 was based on a coumarin–rhodamine FRET system for lysosome pH detection, and the H-bonding interaction and the electrostatic attraction between the protonated morpholine carbonyl on ring-opening of the rhodamine (Fig. 29B).154RNL was synthesized by attaching the naphthalimide unit (FRET donor) to the rhodamine group (acceptor) and the ratiometric response of RNL to pH was a combination of the PeT and FRET processes (Fig. 29C).155RhMP and RMPM were constructed using imidazo[1,5-a]pyridine and imidazo[1,5-α]pyridine quaternary ammonium salts as the FRET donors, respectively.156 Meanwhile, two other ratiometric probes (NRLys and Np-Rh-Lys) based on naphthalimide–rhodamine that are very similar to RNL were subsequently reported,158,159 where Np-Rh-Lys was based on a TBET mechanism for the ratiometric detection of pH (Fig. 29D).
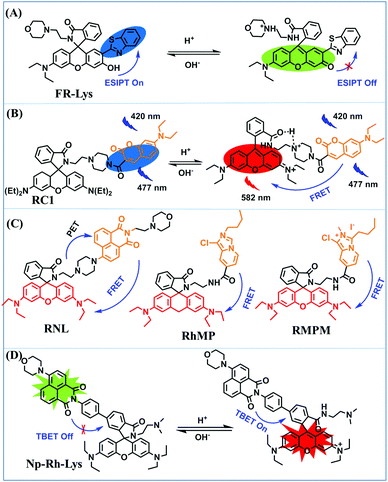 | ||
| Fig. 29 The structures and recognized mechanism of ratiometric probes based on rhodamine derivatives.(A) FR-Lys. (B) RC1. (C) RNL, RhMP and RMPM. (D) Np-Rh-Lys. | ||
Except for the cyclization mechanism of rhodamine lactam, the protonation of the N atom in the morpholine moiety to block the PeT effect is an efficient strategy for developing probes suitable for monitoring lysosomal pH. Based on this concept, a series of probes including on–off and ratiometric probes have been developed. In 2016, an NBD-based probe NBDlyso was constructed, and NBDlyso exhibited a fluorescence enhancement of 100-fold in acidic solution (Fig. 30A).160 The Lin group have evaluated a novel tumor-targeting dye (BN-lys) for detecting lysosomal pH variations (Fig. 30B).161 The probe used biotin as the tumor-targeting module, and as such BN-lys exhibited strong fluorescence in the lysosomes of cancer cells. In addition, the Liu group developed a pH probe (LysopH1) integrating the ICT and FRET mechanism for sensing pH,162 with a coumarin moiety as a donor and naphthalimide moiety as an acceptor (Fig. 30C).
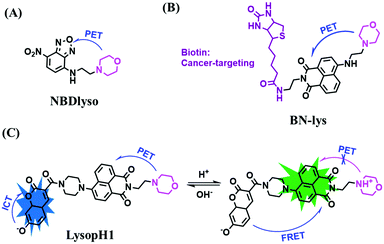 | ||
| Fig. 30 (A) Reaction of NBDlyso in neutral and acid solution. (B) The structure of BN-lys. (C) The proposed sensing principle of LysopH1 for pH. | ||
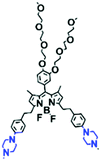
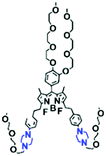
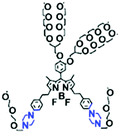
Piperazine can participate in rapid acid–based equilibria and can quench fluorescence via the PeT effect in neutral and alkaline media. Subsequent protonation at acidic pH stops PeT and restores the fluorescence. Based on this approach, three piperazine-modified BODIPY NIR probes LysopHA, LysopHB and LysopHC were designed for lysosomal pH by the Liu group (Fig. 31A).163 Amongst them, LysopHC exhibited higher water solubility and achieved imaging of lysosome pH in living cells (Fig. 31B). The fluorescence response mechanism towards pH was based on ICT and PeT from the piperazine moieties at the 3,5-positions of the BODIPY fluorophores. In addition, in 2020, a NIR fluorescent dye, PipDC, consisting of an N-ethyl piperazine (response group) and naphthyl dicyanoisophorone (fluorophore), was developed for measuring pH (Fig. 31C).164 Compared with most existing probes, PipDC exhibited extremely large Stokes shift (290 nm). Note that the emission signals at 730 nm increased as the pH values decreased, which is due to the protonation of piperazine removing PeT.
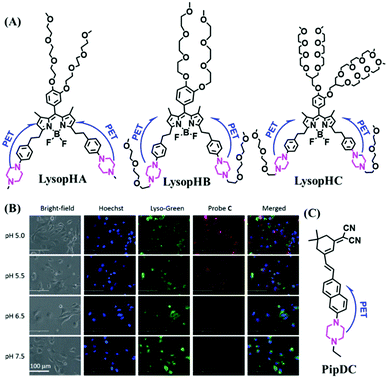 | ||
| Fig. 31 (A) Chemical structures of LysopHA, LysopHB and LysopHC. (B) Fluorescence images of HUVEC-C cells stained with LysopHC at various pH values. Reproduced from ref. 163 with permission of the Royal Society of Chemistry, copyright 2015. (C) The structure of PipDC. | ||
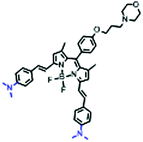
Based on the amino group as the recognition site, NBOH was designed by Liu et al. in 2017. The protonation of the amino group suppresses the PeT effect of the amino to BODIPY fluorophore (Fig. 32A).165 Using NBOH it was possible to discriminate tumor tissue from healthy tissue based on differences in the environmental pH. In 2018, Jiang et al. developed two probes (Fig. 32B and C) based on BODIPY for monitoring the pH of cells (LysopHD and LysopHE).166 The probes exhibited high sensitivity towards acidic pH through a protonation-regulated ICT process. After the protonation of the dimethylamino units under acidic conditions, the electron-donating ability was reduced, thereby suppressing the ICT mechanism, leading to marked hypsochromic shifts and remarkable fluorescence enhancements in the emission spectra. Notably, for LysopHD and LysopHE, the morpholine moieties are connected at the para-position of the meso-phenyl groups via a propoxy chain, and thus the morpholine moieties are electronically isolated from the BODIPY core, leading to the inhibition of ICT or PeT between the morpholine moiety and the BODIPY core. In order to compare the effect of aliphatic and aromatic amines, the Ge group developed two pH-sensitive dyes based on phenoxazinium with aliphatic (LysopHF) and aromatic amines (LysopHG) attached (Fig. 32D and E). LysopHF exhibited fluorescence enhancement at 665 nm over a pH range from 7.4 to 4.4, while LysopHG exhibited turn-on emission at 679 nm over a pH range from 7.4 to 4.2.167 This research demonstrated that phenoxazinium with an aromatic amino group could be successfully transported into lysosomes.
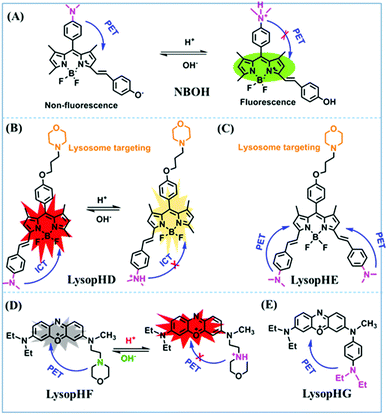 | ||
| Fig. 32 (A and B) The recognition mechanism of NBOH and LysopHD for pH. (C) The structure of LysopHE. (D) The recognition mechanism of LysopHF for pH. (E) The structure of LysopHG. | ||
Protonated quinoline increases the ICT effect. As such a ratiometric fluorescent sensor (CQ-Lyso) based on the chromenoquinoline chromophore was reported by Liu et al. for measuring the pH in living systems (Fig. 33A). The ICT process was enhanced by the protonation of the quinoline group of the probe in acidic media.168 Importantly, using CQ-Lyso, the pH changes of different chloroquine-induced cells were quantitatively detected as 5.4 (0.0 μM), 6.5 (100.0 μM), and 6.8 (200.0 μM), respectively. Based on the same mechanism, another ratiometric and NIR probe (CzQl) was constructed using an ethylene bridge between a methylcarbitol-substituted carbazole and quinoline for the quantitative detection of lysosomal pH in living systems (Fig. 33B).169 Using the CzQl, changes in lysosomal pH in LPS-mediated inflammation in vivo could be imaged. In 2019, VL was reported by the Zhang group for monitoring pH using a quinoline (Fig. 33C).170
A hemicyanine (recognition site) based ratiometric fluorescent probe BiDL was developed by the Song group. In the presence of H+, protonation of the benzoindole moiety enhanced ICT, causing the wavelength to redshift (Fig. 34A). The probe exhibited a good linear response over a pH ranging from 3.4 to 4.82.171 Note that according to theoretical analysis, the N atom electrons of the benzoindole do not participate in the π system conjugation. Thus, the N atom of the benzoindole should be protonated first. With excellent cell membrane permeability and photo-stability, BiDL was used to monitor lysosomal pH in HeLa cells. In addition, another hemicyanine based ratiometric probe BDP-BIM was reported for monitoring lysosomal pH (Fig. 34B).172 Based on the hydroxyl group as the recognition site, two probes CPY (Fig. 34C)173 and CPH (Fig. 34D),174 were developed, and CPY was used to map the distribution of lysosomal pH in living cells stimulated by heat stroke and revealed that lysosomal pH increased during heat stroke. In addition, VP with bis-pyridyl or bis-quinolyl moieties as a proton sensing sites (Fig. 34E) and TPE-CA were also reported (Fig. 34F).170,175 Interestingly, with increasing pH, the protonation of TPE-CA gradually decreased and the hydrophobic end of the tetraphenylethylene becomes clustered. When aggregated, intramolecular motion of the AIE component is shut off to a great extent, and the fluorescence emission increased drastically. Compared with other probes, TPE-CA overcomes the quenching problem at high concentrations found with most traditional dyes.
Dual activation probes involving lysosomal pH have been developed. In 2016, the Lin group developed a new dual activated probe (CN-pH).176 The response mechanism for CN-pH to pH integrated ICT, PeT, and FRET processes where the coumarin and naphthalimide groups acted as a FRET donor and acceptor, respectively, and the hydroxyl unit and morpholine simultaneously acted as pH responsive sites (Fig. 35A). CN-pH exhibited good pH sensitivity over a range from pH 4.0 to 8.0. Two years later, this group developed a dual site-controlled TP fluorescent probe for the imaging of lysosomal pH in living cells and the response mechanism for MP-lys to pH is presented in Fig. 35B.177
The properties and structures of the probes described for lysosomal pH are presented in Table 5 where the excitation wavelength, emission wavelength, detection range and biological application have been highlighted. In general, fluorescent probes used for lysosomal pH detection are mainly based on rhodamine, morpholine, pyridine and quinoline. Although most of these probes exhibit ratiometric detection, only a few of the probe's emission wavelengths reach the NIR region. Among these probes, CPH and MP-Lys could detect pH over a wide range. In terms of biological applications, most probes were used at the cellular level, and cell models are generally limited to chloroquine, NH4CL and other common drug-induced physiological disorders. These studies are far from sufficient to reveal the role of lysosomal pH in physiological processes. In order to better understand the relationship between lysosomal pH changes in health, changes of lysosomal pH involved in the origin and development of diseases should be explored in the future, in order to provide effective guidance for clinical medicine.
3.5. Lysosome-targeted fluorescent chemosensors for hypoxia
Developing a practical fluorescent probe is required to understand the role of lysosomal NTR under hypoxia. For that reason, fluorescent probe Lyso-NTR was developed by integrating a morpholine group into 4-nitro-1,8-naphthalic anhydride (Fig. 36A).178 The reduction of the –NO2 group to an amino (electron-rich) by NTR results in turn-on fluorescence. Importantly, Lyso-NTR was used to monitor the changes of lysosomal NTR in living A549 cells during hypoxia. In addition, the first dual-targeting chemosensor (LysoHy1a) (mitochondria and lysosome) was designed (Fig. 36B).179 The probe displayed fast response (180 s) and excellent LOD (3.2 ng mL−1) for NTR. Importantly, LysoHy1a could be used for the dual imaging of mitochondria/lysosome NTR in HeLa cells. Given that current reports on lysosomal hypoxia are rare, significant efforts should be devoted to exploring this area in the future.3.6. Lysosome-targeted fluorescent chemosensors for temperature
Probes for lysosomal temperature changes are rarely reported. The first lysosomal thermometer BDP-1 was developed by Wang et al. in 2015.180 In this probe, a Triple-OEG substituted phenyl group and BODIPY core serve as electron donor and acceptor, respectively, with morpholine as a lysosome-targeting group (Fig. 37A). The fluorescence of the thermometer was enhanced during heating, which was attributed to the increased local viscosity around the fluorophore caused by the OEG groups’ thermo-dehydration (Fig. 37B). Importantly, this is the first example of a fluorescence based thermometer for lysosomes. Considering that there are few studies on lysosomal temperature, temperature-sensitive probes should be developed to explore the effect of temperature on the performance of the normal physiological activities of lysosomes.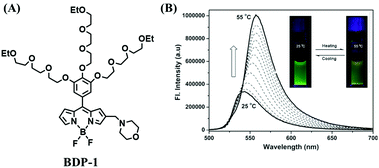 | ||
| Fig. 37 (A) The structure of BDP-1. (B) Fluorescence spectra of BDP-1 in different temperature solutions (pH 7). The inset is photographs of BDP-1 under a UV lamp. Reproduced from ref. 180 with permission of WILEY-VCH Verlag GmbH & Co. KGaA, Weinheim, copyright 2015. | ||
4. Small-molecule fluorescent chemosensors for the microenvironment of lipid drops (LDs)
4.1. The structure and function of LDs
LDs are the main storage site for neutral lipids, which are widely found in bacteria, yeast, plants, insects and animal cells. They consist of a neutral lipid core and are surrounded by a monolayer of phospholipids that are mounted with proteins. The size of LDs varies greatly, ranging from 40 nm to 100 μm in diameter.181 LDs have long been thought of as “inert” cellular components that only store energy, so they have until recently been overlooked. However, the latest research indicates that LDs are not just simple energy stores for cells, but are complex, vigorous and dynamic multifunctional organelles. They can move along the cytoskeleton and interact with other organelles, and play vital roles in lipid metabolism and storage, membrane transport, protein degradation, and signal transduction.182,183 Moreover, it has been shown that diverse metabolic disorders, such as obesity, cardiovascular disease, diabetes, neutral lipid storage disease and Niemann Pick C disease, are often accompanied by abnormal lipid storage.184,185 Therefore, biological research of LDs has received increasing attention.4.2. Fluorescent chemosensors for LD viscosity
Detecting LD viscosity is vital for clinical research. As such, the Lin group have developed a TP fluorescent sensor CBA for detecting the viscosity changes of LDs (Fig. 38A).186 In low viscosity media, CBA emitted weaker fluorescence owing to the free rotation of aldehyde and single bonds of the benzaldehyde group. In contrast, the rotation was hindered in high viscosity media, resulting in the emission of strong fluorescence. Considering these optical properties, imaging LD viscosity was realized both in cells and in vivo. However, traditional fluorescent probes, such as CBA, generally have 1–2 rotors, which greatly limits their detection sensitivity. To increase the sensitivity for viscosity monitoring, the Tang group developed a multi-rotor dye TPE-Cy with AIE properties (Fig. 38B).187TPE-Cy exhibited intense fluorescence signals in LDs owing to the aggregation of TPE-Cy in the hydrophobic environment of LDs. FLIM imaging using TPE-Cy indicated that the membrane-bound organelles exhibit longer lifetime (lager viscosity) than LDs (Fig. 38C). This phenomenon is caused by the loose arrangement of lipid molecules in the LDs.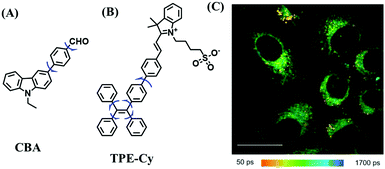 | ||
| Fig. 38 The structures of CBA (A) and TPE-Cy (B). (C) FLIM images of HeLa cells loaded with TPE-Cy. Reproduced from ref. 187 with permission of WILEY-VCH Verlag GmbH & Co. KGaA, Weinheim, copyright 2015. | ||
Since many probes developed emit short wavelengths resulting in interference from autofluorescence, the Lin group, developed a NIR fluorescent sensor NLV-1 for detecting viscosity alternations of LDs (Fig. 39A).188 The conjugated chain of the merocyanine group and the α,β-unsaturated malonitrile unit rotate freely in low viscosity media, leading to reduced emission. Using NIR emission characteristics, NLV-1 could monitor viscosity variations not only in cells, but also in zebra fish and living mice. Soon afterwards, another deep-red probe TCFAN was developed by the Ahn group (Fig. 39B).189TCFAN was developed by linking a pyrrolidine (electron-donating) group to a tricyanofuranyl (electron-withdrawing) group via a vinylnaphthalene spacer. The lambda stack images reveal that the maximum emission wavelength of the TCFAN was hypsochromically-shifted slightly from LDs to the cytosol (Fig. 39C), confirming the ability of the probe to evaluate the homeostasis of cellular LDs.
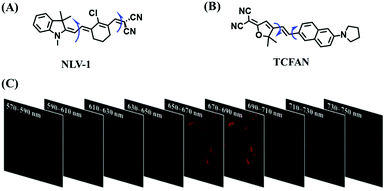 | ||
| Fig. 39 The structures of probes (A) NLV-1 and (B) TCFAN. (C) Fluorescent images of TCFAN loaded HeLa cells in different wavelength sections. Reproduced from ref. 189 with the permission of Elsevier, copyright 2019. | ||
Significant contributions have been made by the many different research groups in fundamental research of LD viscosity. However, due to a lack of assessment of complex physiological processes and multiple disease states of living animals, the relationship between disease and LD viscosity is still a major challenge. Therefore, in order to reveal the relationship between LD viscosity and complex biology, multiple pathological and physiological models need to be constructed to evaluate changes in LD viscosity during the occurrence and development of multiple diseases in the future.
4.3. Fluorescent chemosensors for LD polarity
LDs have been considered as highly dynamic cellular organelles involved in key biological functions and monitoring the number of LDs is vital to understand these processes. As such, many groups have developed probes based on different fluorophores for LD imaging. In 2017, the Dyrager group developed a benzothiadiazole dye LD-BTD1 for staining LDs in living and fixed cells. The probe exhibited excellent solvatochromic behaviour, large Stokes shift, and high fluorescence quantum yield in hydrophobic solvents.190 In the same year, the Rendina group reported a carborane-containing fluorophore for cellular LDs.191 Then, the Vilches-Herrera group reported that the pyrazole-based structure is specific for LDs.192 Meanwhile, the Tang group designed a series of AIEgens. Among them, DCMa and DCPy were used for the photodynamic therapy of cancer cells.193 The AIEgens exhibited excellent potential as bioprobes for LDs with the ability to rapidly stain LDs at ultralow concentrations (50 nM).194 Concurrently, many other probes such as NIM-3A, and LDP1–LDP4 have been reported by different groups to monitor the polarity of LDs.195–199To map the cell, the Suhling group measured the polarity of lipid-rich regions in living HeLa cells with commercial dye Nile red.200 The solvatochromic dye in LDs exhibited a shorter wavelength emission peak than internal membranes. This work revealed that the dielectric constant (ε) is about 5 in LDs and 25 < ε < 40 in other lipid-rich regions. The detection of intracellular polarity using FLIM facilitated the differentiation between LDs and other membrane regions. In the same year, using CPM, the Kankan Bhattacharyya group discovered that the LDs in a cancer cell are less polar and the solvent dynamics are slower.201 Although commercial dyes have been used for LD detection, there are still many disadvantages that need to be overcome with commercial dyes such as Nile red and BODIPY dyes. In 2016, the Goel group proposed a unique donor–acceptor based azafluorene and azafluorenone, which induces effective charge transfer and improves water solubility by replacing a benzene ring in the fluorene skeleton with its bioeconomic pyridine moiety (Fig. 40A). AFN selectively stained intracellular LDs and was stable during LD detection in comparison to Nile red.202 Similarly, a series of new fluorogenic merocyanine fluorophores based on an indolenine group and a dioxaborine barbiturate derivative named StatoMerocyanines (SMCy) were developed (Fig. 40B). In comparison to Nile red, these probes exhibited narrow absorption and emission bands.203 In addition, compared with the commercial dye BODIPY 493/503, the AIE bio-probe TPA-BI reported by the Tang group exhibited higher 3D resolution, lower photobleaching, and weaker interference from autofluorescence (Fig. 40C). Moreover, after staining with TPA-BI, clear spherical spots with intense fluorescence were observed with a much lower background (Fig. 40D).204
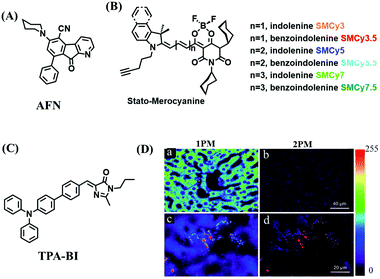 | ||
| Fig. 40 (A) The structure of AFN. (B) The structures of the StatoMerocyanine family. (C) The structure of TPA-BI. (D) Fluorescence images of fixed liver tissues incubated with (a and b) and without (c and d) TPA-BI. Reproduced from ref. 204 under a Creative Commons Attribution 3.0 Unported Licence, copyright 2017, the authors, published by the Royal Society of Chemistry. | ||
Abnormal levels of LDs are associated with various diseases. As such, the Lin group rationally designed a robust fluorescent dye CTPA to monitor LD polarity and number variation for cancer diagnostics.205 In their design strategy, 3-acetyl-7-(N,N-diethyl) amino benzopyran-2-one was chosen as the polarity-sensitive group (Fig. 41A) which exhibited a 132-fold attenuation in the emission signals from low polarity toluene to high polarity DMSO. Using probe CTPA, cancer diagnostics was achieved in cells (Fig. 41B) and in vivo. During cancer therapy, it is expected that the tumor area should gradually decrease and the profile of normal tissue would increase; as such, fluorescent sensors that displays turn-on signals with respect to normal cells would benefit tumor assessment during cancer treatment. Therefore, the Lin group developed CBMC (Fig. 41C) with a turn-on response for cancer evaluation.206 Compared with probes that exhibited turn-off fluorescence to normal cells, CBMC exhibits lower background interference, and higher sensitivity. Meanwhile, the chemosensor LA (Fig. 41D) reported by the Yang group was used to screen the localization of the sentinel lymph node and lymph node using in vivo NIR imaging.207 The accumulation of albumin protein in the draining tumor lymphatic system promotes the in situ formation of a fluorescent albumin-L complex. In addition, the coumarin-based probe PC6S (Fig. 41E) reported by the Tobita group in 2020, was used to image LDs in the hepatocytes of live healthy mice and could be used to visualize adipocytes of lipid-rich tissues and LDs in renal peritubular cells.208 In addition, the lower polarity and slower solvation dynamics in LDs over the cytosol was determined using C153 and the DAF.209 While DXB-NIR developed by Klymchenko allowed the mapping of the polarity of lipid compartments under starvation and oxidative stress.210
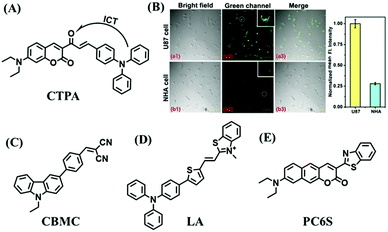 | ||
| Fig. 41 (A) The structure of CTPA. (B) Fluorescence images (left) and the mean fluorescence intensity (right) of U87 cells and NHA cells. Reproduced from ref. 205 with permission of the Royal Society of Chemistry, copyright 2018. The structures of (C) CBMC, (D) LA and (E) PC6S. | ||
Although a large number of probes have been developed for LDs, most of the probes only achieve the staining of LDs and rarely explore changes in the polarity of LDs in complex biological processes. Moreover, while the detection of LD polarity at the cellular level has been achieved, reports of in vivo detection are rare. Therefore, we recommend that fluorescent probes should be developed to reveal changes in LD polarity in a variety of disease models.
4.4. Fluorescent chemosensors for the pH of LDs
Based on a rhodamine ring switching mechanism under different acid–base conditions, in 2016, the Song group developed a pH sensitive fluorescent sensor (Rh-Met) based on a rhodamine spirolactam bearing L-methionine group for imaging protons in LDs (Fig. 42A).211 When the pH decreased from 9.7 to 3.5, Rh-Met produced a 240-fold fluorescence increase at 585 nm. Importantly, owing to hydrogen bond formation on ring-opening of the spirolactam, the pKa of Rh-Met was calculated as 6.81 (±0.06), which is higher than comparable rhodamine spirolactams. Since most probes suffer from aggregation-caused quenching (ACQ) and require complicated synthetic procedures, the Tang group developed two AIE probes (FAS and DPAS) using a simple synthetic procedure (Fig. 42B and C).212 Under basic conditions, the ESIPT process was inhibited but at low pH the emission was enhanced due to activation of the ESIPT process. In the following year, the Patra group designed a new fluorescent sensor, PITE, based on alkyl substituted pyridoindole and tetraphenylethylene (Fig. 42D).213 The pH values direct the photophysical properties of the PITE by controlling the lone pair of electrons on nitrogen in PITE through protonation and deprotonation. Moreover, the targeting ability of the probe to LDs was demonstrated in lower and higher eukaryotes.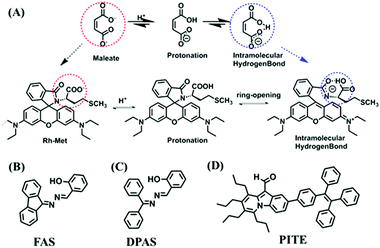 | ||
| Fig. 42 (A) Hydrogen bonding of Maleate and Rh-Met during protonation. The structures of (B) FAS. (C) DPAS. (D) PITE. | ||
4.5. Fluorescent chemosensors for hypoxia in LDs
Imaging hypoxic regions enables the accurate detection of early tumor formation and early diffusion of metastasis tumor cells. As such, the Tang group developed “simple” water-soluble AIE probes (TPE-2M N-oxide, TPE-2E N-oxide, TPE-2M2F N-oxide) for hypoxia detection (Fig. 43A).214 As shown in Fig. 43B, strong fluorescence was observed for TPE-2M N-oxide and TPE-2M2F N-oxide when they were incubated with HeLa cells under both normoxic and hypoxic conditions. In contrast, TPE-2E N-oxide afforded a dark background under normoxia caused by its AIE effect and zwitterionic character. Under hypoxic conditions, it exhibited an oxygen-dependent light-up behaviour in LDs. Notably, these probes could respond to oxygen concentrations of 8%, which was truly impressive. Thus, this work presented a new route suitable for developing theranostic systems based on AIEgens.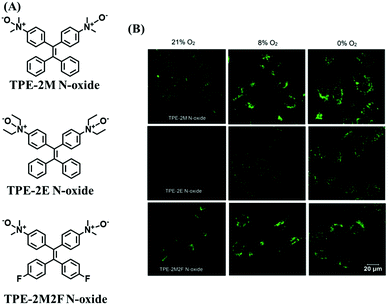 | ||
| Fig. 43 (A) Structures of TPE-2M N-oxide, TPE-2E N-oxide, and TPE-2M2F N-oxide. (B) Fluorescence images of various oxygen concentrations treated HeLa cells cultured with TPE-2M N-oxide, TPE-2E N-oxide, and TPE-2M2F N-oxide. Reproduced from ref. 214 with permission of WILEY-VCH Verlag GmbH & Co. KGaA, Weinheim, copyright 2019. | ||
5. Endoplasmic reticulum (ER)-located small-molecules as chemosensors for the ER microenvironment
5.1. The structure and function of the ER
The ER is an interconnected lamellar or small tubular system consisting of biological membranes, which comprises of the smooth ER and rough ER.215,216 The ER membrane, consists of 50–60% phospholipids and 20% protein, accounting for about half of the total cell membrane area of eukaryotic cells. The ER participates in diverse biological processes including protein synthesis, lipid metabolism and metabolism of xenobiotics.217–222 Moreover, the smooth ER is able to detoxify the cell. For example, in liver cells, the smooth ER contains enzymes able to remove fat-soluble wastes and harmful substances produced by metabolic action.5.2. ER-Located small molecules as chemosensors for viscosity
The effect of saturated fatty acids on ER membrane fluidity is rarely assessed owing to the lack of effective tools. Towards that goal, the Kim group have developed a membrane-selective probe (V-1) comprising of BODIPY and coumarin units with a long alkyl chain (n-C18) as an ER membrane targeting group (Fig. 44A).223 In the structure, BODIPY (518 nm) and coumarin (439 nm) moieties report the viscosity as the ratio of their fluorescent emissions. The long alkyl chain (n-C18) was selected as an ER membrane guiding group. Using V-1, the Kim group found that various endoplasmic reticulum stress (ERS) inducers including palmitic acid, tunicamycin or Brefeldin A could cause the fluidity of the ER membrane to decrease. Subsequently, the group developed a dual-functional fluorescent sensor (ER-VisB) for detecting ER microviscosity in the process of reticulophagy (Fig. 44B).224 The ER-VisB contained a BODIPY-based rotor and a phenylarsenicate unit, which can covalently bind to nascent proteins with vicinal dithiols, thereby reducing its folding or inducing its misfolding, leading to ERS and ultimately reticulophagy. Co-localization experiments with Lyso-Tracker indicate that when ER-VisB interacts with ER, the ER gradually fuses with the lysosome, demonstrating that ER-VisB can induce reticulophagy and at the same time the viscosity increased from 67 to 92 cP (Fig. 44C). Therefore, this work not only provided a promising tool to measure viscosity changes but also provides a new inducer for reticulophagy.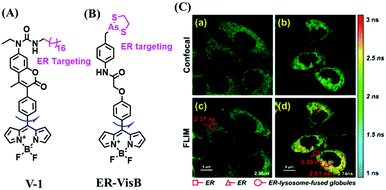 | ||
| Fig. 44 (A) The structure of V-1. (B) The structure of ER-VisB. (C). Fluorescence imaging of ER-VisB in HeLa cells at different incubation times. (a) and (c) for 5 min; (b) and (d) for 1 h. Reproduced from ref. 224 with permission of the Royal Society of Chemistry, copyright 2019. | ||
At present, the measurement of ER viscosity mostly comes from the Kim groups report. Therefore, while the Kim group has achieved the quantitative detection of viscosity under ERS, given the small number of studies at present, there is significant scope for the exploration of the ER, both in probe design and in biological applications. In particular, more NIR probes with TP performance should be developed for ER viscosity detection in the future. Moreover, consideration should be paid to the monitoring of ER viscosity in complex disease states.
5.3. ER-Located small molecules as chemosensors for polarity
Due to the urgent need for ER polarity detection many probes based on different platforms have been designed for monitoring ER polarity. In 2019, the Smith group developed a hydrophobic sensor based on the coumarin scaffold for selectively detecting the ER in mammalian cells.225 While, a pyrimidine imidazole based derivative for super-resolution ER imaging in living cells was reported by Tian et al.226 In addition, the Lin group developed a new dye NSp using naphthalimide as a fluorophore and the p-toluenesulfonamide moiety as an ER targeting group for imaging ER polarity in living cells and tissues.227 However, most ER specific fluorescent dyes are limited for biological applications due to the ACQ effect. To address this problem, a water-soluble terpyridyl-based molecular LB with AIE properties was developed.228 With this structure, the positive charge enhanced the water solubility and the hydrophobic terpyridine group of LB encouraged accumulation in the ER owing to the interactions of the LB with the phospholipid membrane of the ER. As the polarity increased, the probe exhibited weak bathochromic shifts, which were attributed to the interaction between LB and the surrounding environment. Due to good water solubility and membrane permeability, the probe quickly diffused into and illuminated the ER.The development of probes for detecting ER membrane fluidity is currently an active field in biosensor development. As such, a BODIPY/Nile Red hybrid ER1C was developed by the Kim group for selectively monitoring changes in ER membrane fluidity (Fig. 45A). The Nile Red unit acts as a membrane-specific moiety and FRET acceptor, while the BODIPY group of ER1C is an environmentally-insensitive internal reference and FRET energy donor.229 Meanwhile, triethylene glycol was used as a spacer that improved the water solubility of the probe. Fluorescence imaging indicated that the ER membrane fluidity in HepG2 cells is decreased in the palmic acid-induced metabolic syndrome cell model. Unfortunately, the authors did not clarify why the probe was located in the ER. We hypothesized that the lipophilicity of the Nile red and BODIPY resulted in the abundance of the molecule within the membrane. In the same year, the Kim group developed another far-red probe ERp for observing ERS (Fig. 45B). By imaging ERp and GFP-tubulin treated tunicamycin-induced cells (Fig. 45C), they discovered two interesting phenomena: (i) the fluorescence intensity of ERp accumulated at the perinuclear region of the cells, and (ii) the GFP-tubulin emission diminished throughout the cell structure. Moreover, from these phenomena they further deduced that (i) the weakened intensity of the tubulin is anticipated by the fact that the smooth ER structure is supported by the tubulin-based cytoskeleton and susceptible to ERS and (ii) the accumulation of ERp intensity near the nucleus by ERS may be closely related to the findings that the smooth ER membrane shrank to the perinuclear regions with enlarged ER.230
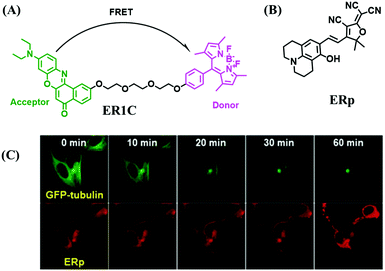 | ||
| Fig. 45 (A) The structure of ER1C. (B) The structure of ERp. (C) Fluorescence images of tunicamycin-treated HeLa cells using ERp. GFP-tubulin was introduced overnight at 37 °C before the experiment. Reproduced from ref. 230 with permission of the Royal Society of Chemistry, copyright 2016. | ||
To unravel complicated inter-relationships, a new fluorescent sensor ER-NAPC for the sensitive and selective measurement of superoxide anions (O2˙−) in the ER was developed by the Tang group.231 Combined with their previously reported polarity-sensitive probe (ER-P),232 they simultaneously imaged the O2˙− and polarity and determined that the O2˙− levels and polarity synergistically increase during ERS in living cells and diabetic myocardial tissue. This dual-mode imaging advances the exploration of the synergetic changes of different parameters during disease development.
In short, the current detection of ER polarity is similar to that of LDs, and there are still many unresolved problems. Therefore, more ER targeting probes should be developed to explore the role of ER polarity in complex physiological processes.
5.4. ER-Located small molecules as chemosensors for pH
In order to develop ER pH small molecules, various traditional recognition sites have been adopted. In 2015, a rhodamine conjugate LC was developed for probing endogenous ER pH changes based on a FRET mechanism (Fig. 46A).233 Based on the piperazine site, the Tang group developed ER-H,234 consisting of a piperazine-linked 1,8-naphthalimide as a fluorophore, a 4-methyl benzenesulphonamide unit for ER targeting, and a thiol reactive benzyl chloride subunit for biomacromolecular fixation to the ER (Fig. 46B). Importantly, ER-H was injected into the abdomen tissues and the imaging results indicated that ER-H at pH 7.4 emitted weak fluorescence at different depths within the abdomen. While, after acidification in the abdomen, ER-H displayed intense fluorescence (Fig. 46C), demonstrating that ER-H is an ideal sensor for the visualization of pH differences in the abdomen tissues of mice. In 2019, the Lin group developed a dual activated system named CNER-pH for monitoring ER pH (Fig. 46D).235 The naphthalimide and coumarin were controlled by PeT, ICT and FRET between the two fluorophores. Guided by the ICT-PeT-FRET mechanism, the probe could quantitatively detect the pH during ERS.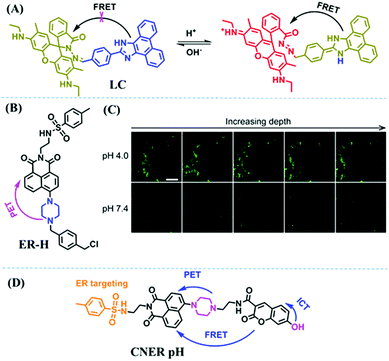 | ||
| Fig. 46 (A) The recognized mechanism of LC to pH. (B) The structure of ER-H. (C) Fluorescence images of abdominal tissues stained with ER-H at different pH values. Reproduced from ref. 234 with the permission of Elsevier, copyright 2018. (D) The structure of CNER-pH. | ||
5.5. ER-Located small molecules as chemosensors for hypoxia
ER aminopeptidase 1 (ERAP1) plays a vital role in antigen processing in vivo, and the disruption of ERAP1 can cause many diseases. In 2017, the Tan group reported a chemosensor (SNCL) consisting of 1,8-naphthalimide (TP scaffold), L-leucine (trigger group), and a methyl sulfonamide (ER-targeting moiety) for visualizing ERAP1 under different redox conditions.236 In the presence of ERAP1 the leucine group of the SNCL could be cleaved and released the cyclic urea and the fluorophore, resulting in fluorescence recovery (Fig. 47A). In addition to monitoring the enzymatic activity of ERAP1 under different redox conditions, SNCL was also used to detect ERAP1 in tumorous tissues. Subsequently, the Lin group developed a turn-on NTR probe Na-NTR-ER with a –NO2 group as an activation site (Fig. 47B).237 The probe exhibited an LOD of 36 ng mL−1 and was used to image cancerous mouse tissues with 100 μm penetration (Fig. 47C).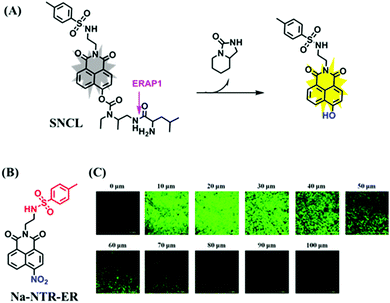 | ||
| Fig. 47 (A) Response of SNCL to the Target Enzyme. (B) The structure of Na-NTR-ER. (C) TP fluorescence imaging of NTR in tumorous tissues. Reproduced from ref. 237 with the permission of Elsevier, copyright 2018. | ||
6. Small-molecule fluorescent chemosensors for the golgi microenvironment
6.1. The structure and function of golgi apparatus
Golgi apparatus usually consists of three compartments: the cis-Golgi network (CGN), the Golgi stack of cisternae (cis-Golgi, medial-Golgi, and trans-Golgi) and the trans-Golgi network (TGN).238 The golgi apparatus is a highly polarized organelle and is usually distributed near the rough ER and nucleus. The primary function of the Golgi apparatus is to process, sort and transport the proteins synthesized by the ER, and then deliver them to specific regions of cells or secrete them outside cells.239–2436.2. Fluorescent chemosensors for golgi polarity
In 2019, the group of Cho developed two blue- and yellow-emitting TP probes (BGolgi-blue and PGolgi-yellow) for the Golgi Apparatus (Fig. 48A).244 The probes were constructed using 6-(benzo[d]oxazol-2-yl)-2-naphthalylamine and 2,5-bis(benzo[d]-oxazol-2-yl)pyrazine derivatives as the fluorophores and trans-Golgi-network peptide (SDYQRL) as the Golgi-apparatus-targeting group. Note that, upon increasing the polarity, PGolgi-yellow exhibited a larger bathochromic shift than BGolgi-blue (53 vs 21 nm) which was ascribed to the better stabilization of the charge-transfer excited state of the pyrazine unit. Considering the large cross-section values of 1860 and 1600 × 10−50 cm4 s per photon for BGolgi-blue and PGolgi-yellow, respectively, the utility of BGolgi-blue and PGolgiyellow for tissue imaging was further evaluated. The sectional TPM images of tissue slices labeled with BGolgi-blue obtained at depths of 120–270 μm revealed the distribution of the Golgi apparatus throughout its entire sample (Fig. 48B). In order to understand the complicated inter-relationship between Golgi polarity and depression, the Tang group created a NIR polarity-sensitive fluorescent probe (Golgi-P) where the cysteine moiety can aggregate in the Golgi apparatus and the merocyanine and benzoyl difluoroboronate groups detect polarity alternations (Fig. 48C).245Golgi-P could monitor the polarity differences in normal and cancerous cells, and detect variations of polarity in glutamate-induced PC12 cells. Moreover, after surgical exposure of the brain, Golgi-P (100 μM) was directly added to the brain, and the brains of mice with depression-like behavior exhibited two-fold decrease in the fluorescence intensity at 810 nm compared to that of the normal mice (Fig. 48D), indicating increased polarity in the brain of mice with depression-like behavior.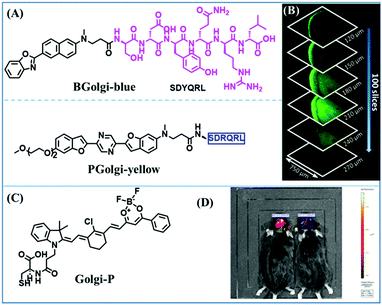 | ||
| Fig. 48 (A) The structures of BGolgi-blue and PGolgi-yellow. (B) TP images of a rat-hippocampal slice incubated with BGolgi-blue at 120–270 μm. (C) The structure of Golgi-P. (D) Fluorescent image of the brains in normal (left) and depression mice (right). (B) and (D) reproduced from ref. 244 and 245 with permission from the American Chemical Society respectively, Copyright 2019. | ||
At present, the bioimaging of the Golgi apparatus polarity has been achieved at the level of cells, tissues and living organisms. Compared with other subcellular organelles, Golgi polarity imaging is more extensive at the biological level. However, since the total number of probes used for Golgi polarity imaging is not significant at present, as such research into Golgi polarity in living organisms is limited. Therefore, in the future, more Golgi-targeted polar responsive probes should be developed to explore the role of Golgi polarity in biological systems.
6.3. Fluorescent chemosensors for golgi pH
In 2017, the Yi group reported a pH-sensitive photothermal ablation agent (pH-PTT) based on a cyanine dye for photothermal therapy (Fig. 49A).246 Under acidic media, pH-PTT was converted into a larger conjugated structure and exhibits an absorption at 808 nm, generating thermal energy. In addition, pH-PTT can be assembled with bovine serum albumin (BSA) to form nanoparticles (BSA-pH-PTT) due to strong hydrophobic binding of pH-PTT with BSA. Owing to the pH gradient and hypertrophic morphology of the Golgi apparatus in cancerous cells, BSA-pH-PTT could differentiate cancer cells from normal cells. Continuous irradiation of BSA-pH-PTT-treated tumors, resulted in recovery. As such, this research opened up a new route to develop smart drugs for superior photothermal therapeutic efficacy. In 2019, the Dong group developed a pH-sensitive fluorescent probe RSG based on rhodamine B with sphingosine as the Golgi-targeting module.247 Due to the proton-induced spirocyclic ring opening (Fig. 49B), RSG exhibited a 112-fold fluorescence enhancement at 600 nm when the pH changed from 7.40 to 2.00. Using RSG, the pH changes induced by drugs and LPS were monitored in cells and in vivo, respectively.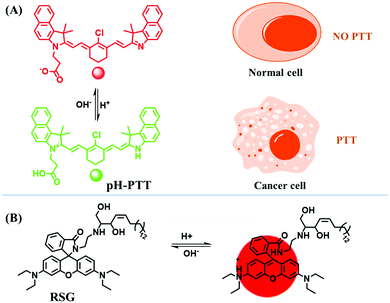 | ||
| Fig. 49 (A) The mechanism of pH-PTT as a smart drug for specific Golgi apparatus activated PTT. (B) The mechanism of RSG towards pH. | ||
7. Small-molecule fluorescent chemosensors for the nuclear microenvironment
7.1. The structure and function of the nucleus
The nucleus is the largest and most important subcellular organelle in eukaryotic cells. It consists mainly of nuclear membrane, chromatin, nucleolus and nuclear matrix. Most nuclei are spherical or ovoid and the size of the nuclei varies from species to species. For example, the nucleus diameter of higher animals is generally 5–10 μm, while it is 5–20 μm in advanced plants.248–251 The nucleus, as most significant marker that distinguishes eukaryotic cells from prokaryotic cells, is the regulatory center of cell genetics and plays vital roles in cell metabolism, growth and differentiation.252–2567.2. Fluorescent chemosensors for nuclear viscosity
In 2016, the Bizzarri group designed a BODIPY-based probe (BoMe) for imaging the viscosity in different intracellular regions (Fig. 50A).257BoMe could rapidly permeate cells and dye the cytoplasmic and nuclear area. Using BoMe, the nucleoplasm of HGPS (Hutchinson–Gilford progeria syndrome) cells, a cellular model of a morbid genetic pathology, exhibited lower viscosity than normal cells. In addition, since BoMe exhibits affinity for DNA, the correlation between lamin A misassembly and chromatin compaction was observed. Subsequently, another nucleus-targeting TP fluorescent probe TP-2Bz was designed for viscosity determination based on the restriction of intra-molecular rotation (Fig. 50B).258 In addition, two water-soluble and ratiometric sensors, (DSF and DBF) bearing an N-methyl benzothiazolium unit were developed, which bind to nuclear DNA and RNA in the nucleolus and cytoplasm, respectively (Fig. 50C).259 The high affinity of DSF for DNA was postulated to be the result of the interaction of DSF with the base pairs of DNA through hydrogen bonds and a reduction of non-radiative pathways caused by the free rotation of the vinyl bond. Moreover, DSF was used for ratiometric imaging of the viscosity distribution in live cells and tissues. As shown in Fig. 50D, both in cells and tissues, the probe exhibited different colors where the viscosity in the “blue” regions is less than 100 cP and 100–500 cP in “green” areas as well as 900 cP in small intracellular red zones. These color differences reveal the distribution of viscosity in cells and tissues.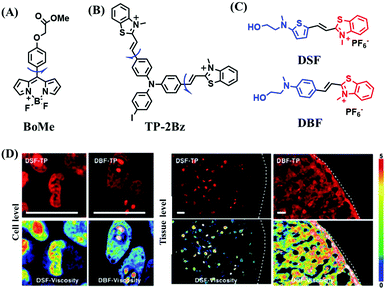 | ||
| Fig. 50 The structures of (A) BoMe, (B) TP-2Bz, (C) DSF and DBF. (D) Fluorescence images of HepG2 cells and fresh rat liver slices incubated with DSF and DBF. Reproduced from ref. 259 under a Creative Commons Attribution-NonCommercial 3.0 Unported Licence, copyright 2016, the authors, published by the Royal Society of Chemistry. | ||
Like ER-targeting viscosity probes, there are few probes for nuclear viscosity detection at present. However, although there are few probes for nucleic acid viscosity detection, the probes have exhibited many advantages both in optical properties and biological applications. As for the optical properties of the probe, the water solubility and emission wavelength of the probes have been improved. For biological applications, the probes have achieved quantitative viscosity detection at the level of cells and tissues. Of course, there is still a lot of room for further development, such as the development of TP and multi-functional fluorescent probes and the detection of nuclear viscosity in vivo.
7.3. Fluorescent chemosensors for nuclear polarity
In 2017, Liu et al. developed a series of triarylboron-based dyes as RNA sensors for nucleolar imaging.260 The optical properties such as water solubility and cell membrane permeability could be regulated by changing the ratio of hydrophilic cyclen and hydrophobic diphenylamine units. On binding with RNA, TAB-2 exhibited a significant hypsochromic shift caused by a decreased polarity from aqueous media to the RNA interior, resulting in a ratiometric signal. Moreover, TAB-2 was used for nucleolar imaging of NIH/3T3 cells and comparing the local polarity of the nucleolar and cytoplasm. In the following year, they designed another two probes (TAB-piperazine-1 and TAB-piperazine-2) by modifying triarylboron with different multiple piperazine groups resulting in water soluble fluorescent probes for imaging the polarity of the nucleoli, nuclear matrix and nuclear membrane.261 Meanwhile, in 2019, the azonia cyanine dyes (Nup1a–f) were reported by the Ge group which displayed a significant polarity dependence and large fluorescence enhancement on incubation with DNA/RNA.262 The structures of all the probes mentioned are given in Fig. 51.In addition, a dual-targeted probe strategy has been taken towards imaging the nucleus. For example, the dual-color organelle-specific AIE probe ASCP for the mitochondria and nucleolus has been developed by the Tang group.263 The incorporation of a pyridinium salt served as the targeting agent for mitochondria and intercalation and electrostatic interactions are the driving force for the binding of ASCP with nucleic acids. ASCP exhibited orange fluorescence in mitochondria under 405 nm excitation, and red fluorescence in the nucleoli with excitation of 560 nm. The probe can enter the nucleus and emit a strong red fluorescence. Note that, the source of this red fluorescence can be analyzed from two perspectives. On the one hand, as ASCP enters the cavity of the nucleic acid, it may take on a more coplanar and more uniform conjugated conformation, thus exhibiting red emission; on the other hand, hydrogen bonds between nucleotides in nucleic acids may provide a relatively polar environment for ASCP emission in the longer wavelength region. Ribonuclease assays further confirmed that the probe mainly stained intracellular RNA due to the strong electrostatic attraction. Thus, this research provided a new tool for simultaneously imaging the mitochondria and nucleolus.
At present, there are few probes for the detection of nuclear polarity, and there is a significant development space for the detection of nuclear polarity both in the type of probes and in biological applications. In the future, more probes should be developed to explore nuclear polarity associated with disease development.
8. Small-molecule fluorescent chemosensors for the cytoplasmic matrix microenvironment
8.1. The composition and function of the cytoplasmic matrix
The cytoplasmic matrix is the basic component of the cytoplasm. It is the homogeneous and translucent colloidal part of the cytoplasm that fills in between other visible structures. According to its relative molecular weight, the chemical composition of the cytoplasmic matrix can be divided into three categories, namely, small molecules (water and inorganic ions), medium molecules (lipids, sugars, amino acids, nucleotides, and their derivatives) and large molecules (polysaccharides, proteins, lipoproteins, and RNA). The main function of the cytoplasmic matrix is to provide a place and stable microenvironment for the metabolism of living cells. Abnormal changes in cytoplasmic matrix can result in various diseases including diabetes, atherosclerosis, and Alzheimer's disease.264–266 Thus, accurately quantifying microenvironmental changes of intracellular viscosity could help facilitate disease diagnosis and treatment.8.2. Fluorescent chemosensors for cytoplasmic matrix viscosity
BODIPY-based molecular rotors tend to be used for viscosity detection. Accordingly, a series of probes were developed for cytoplasmic matrix viscosity. For example, in 2016, the Kumar group developed Cyto-Vis-1 for imaging micro-viscosity changes (Fig. 52A).267 In this structure, the two phenyl rings and amino group will cause maximum deactivation of the excited state through a non-radiative pathway. Interestingly, this study indicates that in a low viscosity media the amino group could quench the fluorescence of the Cyto-Vis-1 by the PeT process while the PeT disappeared when rotation gets restricted in higher viscosity media. Moreover, using the Cyto-Vis-1, the intracellular viscosity in cancer (3 cP), normal (8 cP) and apoptotic C6 cells (40 cP) was quantitatively measured (Fig. 52B). In the same year, the Gryczynski group developed a triazine-based BODIPY dye Cyto-V1 and monitored viscosity changes in several cancer cell lines using FLIM.268 In the following year, Kuimova et al. developed two BODIPY-based sensors BODIPY1 and BODIPY2 for imaging tumor microscopic viscosity (Fig. 52C).269 Compared with BODIPY1, BODIPY2 displays a better aqueous solubility, narrow absorption spectrum and higher quantum yield, which was caused by the difference in substituents on the benzene ring. Although BODIPY based probes are widely used for viscosity detection, it is not clear how modification affects the optical properties of the probes. Therefore, to explore relationships between the structure and function of the BODIPY system, the Kuimova group investigated several BODIPY-based molecular rotors.270 With this research, they discovered several important concepts. Firstly, the integration of Br to the BODIPY fluorophore results in a slight blue shift both in absorption and emission spectra. Secondly, compared with the alpha-Br derivative, the beta-Br derivative exhibited broader spectra. Thirdly, the replacement of the electron donating ether unit on the phenyl moiety of the BODIPY with an electron withdrawing group, such as a bromine atom or an ester group enhanced the applicable dynamic range for the BODIPY molecules as viscosity probes. Recently, the Liu group reported a series of viscosity-activated NIR-II probes based on the BODIPY fluorophore to explore the influence of substituents on viscosity measurement.271 These probes contained strong electron-withdrawing (–NO2) or electron-donating groups (methoxy or diethylamino) in the ortho-position of the BODIPY core. Screening results suggested that a –NO2 unit at the ortho-position of the BODIPY exhibited the highest sensitivity towards viscosity changes. Moreover, the NO2-substituted BODIPY derivative WD-NO2 (Fig. 52D) was used to track the subtle alternations of viscosity in diabetes-induced liver injury. These important developments by the Kuimova and Liu groups provided useful guidance for the design of BODIPY based dyes.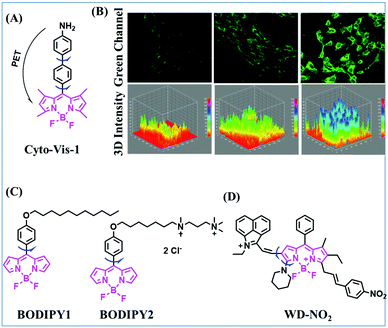 | ||
| Fig. 52 The structures of BODIPY-based probes for cytoplasmic matrix viscosity. (A) The structure of Cyto-Vis-1. (B) Confocal images of the Cyto-Vis-1 expression in C6 glioma cell (left) undifferentiated C6 glioma cells stained with Cyto-Vis-1; (middle) RA differentiated C6 glioma cell group; (right) apoptotic cell group. Reproduced from ref. 267 with permission of the Royal Society of Chemistry, copyright 2016. (C) The structure of BODIPY1 and BODIPY2. (D) The structure of WD-NO2. | ||
In addition to the BODIPY core, other fluorophores have also been used for cytoplasmic matrix viscosity detection. For example, in 2017, the Meng group developed a TP fluorescent probe (MCN) consisting of a dicyanovinyl unit (rotor) conjugated to a quinoline scaffold by a C–C bond.272 Note that on using MCN, the Meng group determined that the intracellular average viscosity value was 73.45 ± 21.55 cP in the cytosol. In addition, other viscosity probes based on coumarin (HY),273 carbazole (CB-V),274 naphthalamide (Cyto-VA)275 and julolidine (DJH)276 fluorophores have also been reported by different groups. Among these, DJH exhibited greater Stokes shift (165 nm) and higher viscosity response, with a 400-fold fluorescence increase on moving from PBS solution to 90% glycerol. Moreover, DJH could be used for tracking changes in viscosity within zebrafish treated with microplastics but in addition revealed higher blood viscosity in hypertensive and diabetic patients than healthy individuals. Although the probes mentioned above all respond to viscosity, the performance of the probes has not been systematically optimized by changing the rotors. Luckily, the Huang group developed three D–A–D type naphthyl and 2,1,3-benzoxadiazol hybrid NIR systems to systematically evaluate molecular rotors,277 which were functionalized with amino (NY1), N-methylamino (NY2) and N,N-dimethylamino (NY3) units for the detection of intracellular viscosity. The systematic research results indicated that NY3 was more sensitive for viscosity, which was attributed to the electron-donating ability and larger steric effect of the N,N-dimethylamino resulting in a narrower energy gap. All the structures of the above probes are given in Fig. 53.
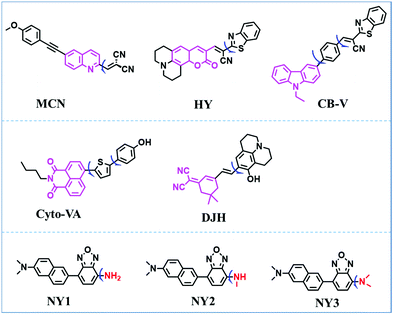 | ||
| Fig. 53 The structures of MCN, HY, CB-V, Cyto-VA, DJH, NY1, NY2 and NY3 for cytoplasmic matrix viscosity. | ||
As with previous systems, the two-site activation strategy has been used to develop cytoplasmic matrix viscosity-related probes. In 2017, Fang et al. developed a carbazole-based probe (Cyto-VL1) for the colorimetric imaging of cyanide (CN−) and viscosity (Fig. 54A).278Cyto-VL1 consists of a Schiff base derived from the reaction of the carbazole-containing aldehyde and nitrophenylhydrazine derivatives. In higher viscosity media, free rotation of the C–C bond formed between the electron-donating carbazole and electron-withdrawing pyridinium unit using a Heck reaction was restricted and resulted in the emission of fluorescence. Moreover, in the presence of CN−, deprotonation of the amine group resulted in an enhancement of the electron-donating ability within Cyto-VL1.
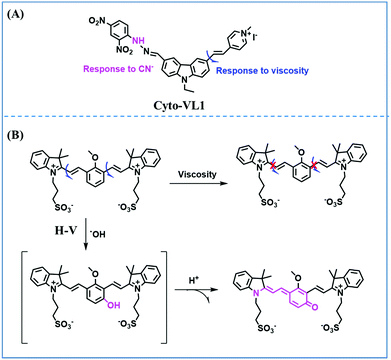 | ||
| Fig. 54 (A) The structures of Cyto-VL1. (B) The structure and response mechanism of H–V to viscosity and ˙OH. | ||
In addition, the Ma group designed a dual-responsive sensor H–V for monitoring changes of intracellular ˙OH and viscosity during ferroptosis.279H–V was designed with two symmetric π-conjugated units where the indolium moiety (electron acceptor) and anisole moiety (electron donor) are connected by a rotatable vinyl bond to form a D–π–A structure (Fig. 54B). In high viscous media, the intramolecular rotation is restricted leading to fluorescence enhancement of the probe. In the presence of the ˙OH, the unique hydroxylation of an aromatic compound occurred primarily at the meta-position of the methoxy group to form a phenol intermediate which then undergoes deprotonation and electron rearrangement to eventually form a larger polymethine π-conjugated system. Note that the incorporation of a strong electron-donating methoxy group enhanced the trapping ability of the ˙OH. Based on the molecular rotor and the unique aromatic hydroxylation by the ˙OH strategy, the probe was used for the detection of ˙OH and viscosity using two independent channels without spectral cross interference. This research indicated that ferroptosis is accompanied by significant ˙OH generation and cytoplasmic viscosity increase.
According to the above summary, it can clearly be seen that significant progress has been made in the study of cytoplasmic matrix viscosity with the probes developed. However, there is still much room for improvement. For example, at present, researchers have mainly studied the effects of substituents on the optical properties of BODIPY dyes, but there are no relevant reports on the effects of other fluorophore groups including coumarin, naphthalamide and carbazole. In addition, although double-responsive fluorescent probes have been developed, they have only revealed the variation of two factors, and have not explored the interaction mechanism between them, therefore failing to provide powerful guidance for a detailed understanding of specific pathological mechanisms.
8.3. Fluorescent chemosensors for cytoplasmic matrix polarity
Cellular micro-polarity controls several biological processes, and as such the sensing of cellular microenvironmental parameters is particularly important. In 2015, Wu et al. synthesized dicyanoboron diketonates and evaluated their photophysical properties.280 Compared with the corresponding difluoroboron diketonates, dicyanoboron diketonates display higher molar absorption coefficients (>60![[thin space (1/6-em)]](https://www.rsc.org/images/entities/char_2009.gif) 000 M−1 cm−1) and larger bathochromic shifts (>25 nm) in the absorption and emission spectra, indicating that replacement of the fluorene by a cyano unit significantly affects the optical behavior. Moreover, the molar absorption coefficient of Cyto3c is significantly higher than those of Cyto1b, Cyto1c,Cyto2b and Cyto2c owing to the extension of π conjugation and the two cyano units. Meanwhile, Cyto3b and Cyto3c exhibit high sensitivity towards the polarity and Cyto3c was used for cell imaging. As such, this research provided an effective method to regulate the optical properties of the probes. The structures of the probes discussed are given in Fig. 55A.
000 M−1 cm−1) and larger bathochromic shifts (>25 nm) in the absorption and emission spectra, indicating that replacement of the fluorene by a cyano unit significantly affects the optical behavior. Moreover, the molar absorption coefficient of Cyto3c is significantly higher than those of Cyto1b, Cyto1c,Cyto2b and Cyto2c owing to the extension of π conjugation and the two cyano units. Meanwhile, Cyto3b and Cyto3c exhibit high sensitivity towards the polarity and Cyto3c was used for cell imaging. As such, this research provided an effective method to regulate the optical properties of the probes. The structures of the probes discussed are given in Fig. 55A.
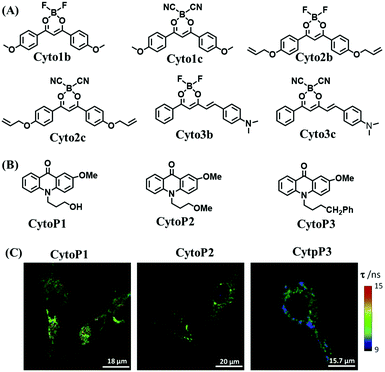 | ||
| Fig. 55 (A) The structure of Cyto1b, Cyto1c, Cyto2b, Cyto2c, Cyto3b and Cyto3c. (B) The structure of CytoP1, CytoP2, and CytoP3. (C) Representative FLIM images of CytoP1, CytoP2, and CytoP3 in MDA-MB-231 cells. Reproduced from ref. 281 with permission of Elsevier, copyright 2020. | ||
For the accurate detection of intracellular polarity, in 2020, the Orte group presented a new methodology that combined lifetime and dual-color imaging.281 N-Substituted 2-methoxy-9-acridone probes (CytoP1–3) were prepared as suitable bioimaging polarity probes (Fig. 55B) and the photophysics was systematically evaluated. Moreover, these probes were used for imaging breast cancer cells using FLIM and indicated that the characteristic long lifetime of the acridones changed depending on the environment, with longer lifetimes being observed in more polar environments (Fig. 55C).
Since 2015, only a few research groups have realized the detection of cytoplasmic matrix polarity, and the current research is limited to the cellular level, which is unsatisfactory for uncovering the role of cytoplasmic polarity in living systems. As such, the exploration of the change of cytoplasmic polarity within complex biological systems should be the focus of future research.
8.4. Fluorescent chemosensors for cytoplasmic matrix pH
As with other targeted probes discussed so far for pH detection, multiple recognition sites have been used for sensing cytoplasmic matrix pH. Firstly, the phenol was chosen as an ideal candidate due to the change from phenol to phenoxide under different pH conditions. Using this change, many probes including CytopH1, CytopH2, HDXMM, BtyC-1 and BtyC-2 have been developed by different groups.282–284 Amongst these, HDXMM was able to “distinguish” normal cells from tumor cells due to fluorescence changes as a result of different pH values. In particular, BtyC-1 was used to image cellular pH and NH4Cl-induced pH alternations in living cells. Secondly, the Liu group synthesized three probes (CytopHA, CytopHB, and CytopHC) with morpholine (recognition site) attached to BODIPY dyes at the 4,4′- and 2,6-positions.285 Protonation of the tertiary amines of the morpholine residues in an acidic medium could quench the BODIPY fluorophore through a d-PeT pathway while the morpholine did not quench the BODIPY signal under neutral and basic conditions. Thirdly, using a phenol, the Lin group developed a locked-flavylium fluorophore LF3 for the three-color ratiometric detection of pH in living cells.286 Fourthly, using an acetyl unit, an indolizine derivative ID-1 was designed for imaging H+ in living cells relying on ICT changes where the acetyl group serves as an acceptor and the carboxyl anion as an electron donor to form a push–pull system.287 Fifthly, using a benzothiazole, probe ECBT facilitated the imaging of extreme acidity in Escherichia coli cells.288 While pyrazoline-based pH fluorescent probes reported by the Zhao group were used to image the strong acidity in Saccharomyces cerevisiae.289 Moreover, ratiometric NIR-fluorescent probes DIDBA and QVBI were used for detecting the pH changes in live cells,290,291 where significant bathochromic shift of the fluorescence was the result of the enhanced ICT caused by protonation of the indole moiety. All these probes with different recognition sites are given in Fig. 56 and the recognition sites are highlighted in blue for each probe.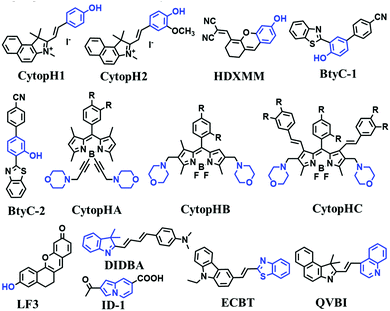 | ||
| Fig. 56 Various pH probes based on different recognition sites. The group marked in blue is the pH recognition site. | ||
In order to explore the best probes for pH detection, many researchers carried out a structure relationship analysis where optimizations of the type and site of substitution are explored. For example, Yang et al. designed a class of NIR probes through the introduction of various substituents (methoxyl, chloride and benzothiazole) onto the hemicyanine scaffold,292 where changes in ICT as a result of protonation/deprotonation at the hydroxyl in the skeleton cause a shift in emission. Among these, the benzothiazole modified probe NIR-Ratio-BTZ displayed the largest emission shift (from 672 to 748 nm) when the pH changed from acidic to basic and was used to monitor changes of physiological pH near neutrality (Fig. 57A). Recently, three fluorescent sensors (HBT-pH 1, HBT-pH 2, and HBT-pH 3) were designed for monitoring pH variations by coupling benzothiazole and spiropyrans.293 The recognition mechanism was attributed to the fact that sipropyran derivatives could undergo reversible changes from the ring-open form to ring-closed form when the environment is changed from acidic to alkaline. HBT-pH 1 exhibited turn-on signals as the pH decreased from 12.00 to 2.02, whereas ratiometric fluorescence was observed for HBT-pH 2 and HBT-pH 3 (Fig. 57B). Moreover, the pKa values of HBT-pH 1, HBT-pH 2 and HBT-pH 3 were 6.57, 4.90 and 3.95, respectively, making them suitable for detecting the pH in weakly acidic, acidic and strongly acidic environments.
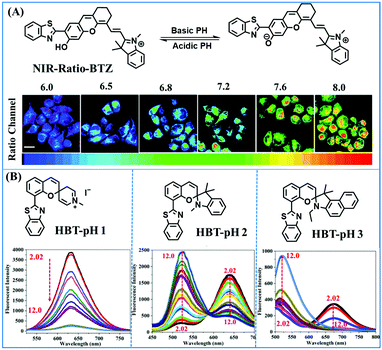 | ||
| Fig. 57 (A) The response mechanism of NIR-Ratio-BTZ to pH and fluorescence images of HeLa cells cultured at different pH. Reproduced from ref. 292 with permission from the American Chemical Society, Copyright 2015. (B) The structures of HBT-pH 1, HBT-pH 2 and HBT-pH 3 and their fluorescence spectra at different pH. Reproduced from ref. 293 with permission of Elsevier, copyright 2020. | ||
Given that NTR activity and acidity are key indicators of a tumor, powerful sensors for simultaneously monitoring NTR and acidity are urgently required. As such Cheng et al. reported on a dual-function ratiometric dye, NAFP, for imaging acidity and NTR.294 Owing to the ICT and PeT mechanism from the nitrogen atom of morpholine to the –NO2 unit of the 1,8-naphthalimide, NAFP exhibited a enhanced green fluorescence at lower pH and in the presence of NTR. As such, the probe was used to simultaneously monitor the acidity and expression of NTR in living cells. In addition, the Lin group used a dual-activated strategy for imaging pH alterations in the cytoplasm and lysosomes during autophagy where the downregulation of pH during starvation induced autophagy and the effect of NH4Cl and chloroquine on autophagy was evaluated.295
All the probes for cytoplasmic matrix pH are summarized in Table 6 where the pKa, probe types, linear range and biological application are given. From Table 6, it can be clearly seen that there are only a few fluorescent probes in the NIR region used to detect the pH of the cytoplasmic matrix, which is not conducive for an in-depth study of the role of pH in the cytoplasmic matrix of biological systems. Although the cytoplasmic matrix pH has been monitored in vivo, the relationship between cytoplasmic matrix pH and disease development remains unclear due to the lack of in vivo disease models. Therefore, future research should focus on the detection of cytoplasmic matrix pH in multi-disease models.
8.5. Fluorescent chemosensors for cytoplasmic matrix hypoxia
Similar to probes for mitochondrial hypoxia detection, numerous probes have been developed for imaging cytoplasmic matrix hypoxia. For example, reduction approaches have been explored as an efficient mechanism for designing hypoxic-related probes. Many activation sites including the azo moiety and –NO2 group have been employed for sensing cytoplasmic matrix hypoxia. In these systems, the activating group is reduced under hypoxic conditions. For the –NO2 activating group, the systems can be summarized according to the type of –NO2 including pure –NO2, nitrobenzyl group, nitrofuran, and nitroimidazole.The strategy of directly attaching the –NO2 group to the fluorophore, has been utilized for developing probes by Lin and other groups. In 2017, the Lin group developed CoNO2-HY where a –NO2 unit was integrated into the 3-position of coumarin as the recognition/activation site for NTR.296 The –NO2 group effectively quenched the fluorescence of CoNO2-HY, while in the presence of NTR, the –NO2 group was reduced enhancing the fluorescence. As such CoNO2-HY was used for monitoring endogenous NTR in living tissues. Using the same mechanism, another turn-on probe CM-NO2 was designed by Zhou et al. to image tumor hypoxia in living systems.297 In addition to turn-on type probes, the Lin group has also developed turn–off probe TPE-HY towards NTR using tetraphenylethene as the fluorophore.298 Owing to the strong electron acceptor capacity of –NO2 group, the TPE-HY exhibited “D–π–A” electronic structure and emitted strong fluorescence. However, on treatment with NTR, the –NO2 group was reduced to the amino moiety, and the electronic structure of the TPE-HY changed to “D–π–D”, leading to quenched fluorescence. Importantly, TPE-HY was used to image the NTR in living cells. All the structures discussed are given in Fig. 58.
Under hypoxic conditions, NTR can reduce an aromatic –NO2 unit to amine, resulting in the subsequent release of a free fluorophore via a 1,6-rearrangment elimination. This mechanism has been widely utilized in developing reaction-based sensors, and as such a number of such probes have been developed using a nitrobenzyl group. In 2015, the Zhang group developed a naphthalene derivative (CytoHyp1) using a p-nitrobenzyl moiety as the NTR recognition group (Fig. 59A).299 The fluorescence of the probe was quenched by the p-nitrobenzyl moiety via a PeT process while in the presence of NTR with NADH as an electron donor, the nitrobenzyl group was reduced to an amino-group followed by a 1,6-rearrangement elimination reaction, which afforded a “turn-on” fluorescent response. The probe exhibited ∼70-fold signal amplification towards NTR with a LOD of 20 ng mL−1. Importantly, the probe was used to image the hypoxic status in living cancerous cells and tissues with low autofluorescence. Many other probes using the same strategy have been reported by different groups.300–311 Among these probes, the Zhang group developed CL-NTR (Fig. 59B) exhibiting high water solubility which was used to detect exogenous NTR in tumor bearing mice. The in vivo imaging results demonstrated that the strongest fluorescence intensity was observed in tumors with the lowest oxygen content (Fig. 59C).306 Besides turn-on sensors, ratiometric probes based on the nitrobenzyl group have been used for imaging hypoxia in the cytoplasmic matrix.312
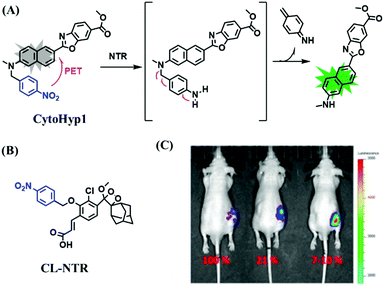 | ||
| Fig. 59 (A) The structure and response mechanism of CytoHyp1 towards NTR. (B) The structure of CL-NTR. (C) Images of living A549 tumor xenograft mice at different O2 contents. Reproduced from ref. 306 with permission of the American Chemical Society, copyright 2019. | ||
In addition to probes based on the nitrobenzyl group, probes based on the nitrofuran moiety have been developed. As such in 2015, a quaternarized 4-pyridinyl-modified BODIPY molecule (CytoHypA) integrating a 5-nitrofuran group was designed for detecting the hypoxic status of cancerous cells.313 The probe exhibited turn-on fluorescence towards NTR in the presence of NADH and was utilized to image the hypoxic status of cancerous cells and Escherichia coli. In the same year, the Dubikovskaya group developed an “NTR caged luciferin” (NCL) sensor that was selectively reduced by NTR, releasing light proportional to the NTR activity.314 Using the NCL probe, the in vitro imaging of NTR in bacteria and cancerous cells, was achieved and NTR-expressing tumor xenografts were revealed. Similarly, based on the 4-nitroimidazole moiety, a turn-on fluorescent dye (3-HF-NO2) for monitoring NTR was reported using two morpholine units on a 3-HF platform at the 6,8-position.315 All structures discussed are given in Fig. 60.
In addition to the –NO2 reduction mechanism, the N![[double bond, length as m-dash]](https://www.rsc.org/images/entities/char_e001.gif) N bond is another widely used approach for hypoxia detection. In particular, the Li group developed a bioluminescent hypoxia probe (HBL) based on the reductive capacity of CYP450 enzymes/NADPH (Fig. 61).316HBL contains an azo unit that can be reduced by CYP450 reductase into amino luciferin. The fluorescence of HBL was quenched due to the azo group. However, under hypoxic conditions, the azo bond of HBL was damaged, and the signal was recovered. Using the probe, a clear correlation between dynamic degrees of hypoxia and tumors of different sizes was established. Using the same mechanism, YZP1, Cy-AP and AXNN were developed to image hypoxia in mouse models.317–319
N bond is another widely used approach for hypoxia detection. In particular, the Li group developed a bioluminescent hypoxia probe (HBL) based on the reductive capacity of CYP450 enzymes/NADPH (Fig. 61).316HBL contains an azo unit that can be reduced by CYP450 reductase into amino luciferin. The fluorescence of HBL was quenched due to the azo group. However, under hypoxic conditions, the azo bond of HBL was damaged, and the signal was recovered. Using the probe, a clear correlation between dynamic degrees of hypoxia and tumors of different sizes was established. Using the same mechanism, YZP1, Cy-AP and AXNN were developed to image hypoxia in mouse models.317–319
Although reactive groups for hypoxia detection have been developed, the performance of the probes still needs to be improved. Firstly, the role of the linker and fluorescence release efficacy are not particularly well established; therefore, the Chang group developed a series of NTR-responsive fluorescent probes, based on fluorescein and rhodal which were attached to an NTR-sensitive unit using different linkages.320 Then the performance of the sensors with an ether or a carbamate linkage were compared, and both exhibited high sensitivity and enhanced fluorescence towards NTR. Secondly, to develop better probes, several groups have optimized the probe structure. For example, in 2016, the Li group designed three reaction-based probes (CytoHyp2, CytoHyp3 and CytoHyp4) for imaging NTR (Fig. 62A).321 For CytoHyp2, an aminoluciferin fluorophore was substituted with a –NO2 unit. While for CytoHyp3, a –NO2 substituted benzylic linker was used to acylate the 6′-NH2 moiety of aminoluciferin. Then for CytoHyp4, a self-immolative linker was added to the luciferin platform at the 6′-position. Amongst these probes, CytoHyp4 performed the best and was used to visualize NTR overexpression and degree of hypoxia in tumors (Fig. 62B). Three fluorescent probes (FBN-1-3) consisting of a fluorescein and one of three different aromatic –NO2 units have been developed by Luo et al. (Fig. 62C).322 Amongst these probes, FBN-1 exhibited excellent sensitivity and selectivity for the detection of hypoxia with turn-on response. FBN-1 was able to discriminate different growth stages of tumors by detecting the degree of tumorous hypoxia and revealed that the NTR concentration remains nearly constant in tumorous tissues 7 days or 35 days after implantation. This research illustrated that these probes could be powerful tools to help determine the molecular mechanisms of tumor malignant transformation under oxygen-free conditions.
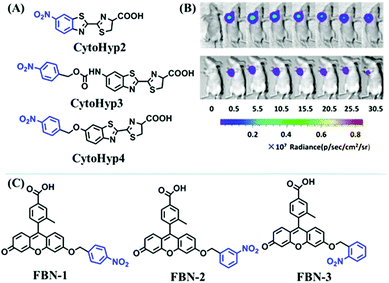 | ||
| Fig. 62 (A) The structure of CytoHyp2, CytoHyp3 and CytoHyp4. (B). Time-dependent imaging of different sized tumors using CytoHyp4. The first row is 1.3 cm and the second row is 1.0 cm. Reproduced from ref. 321 with permission from the American Chemical Society, Copyright 2016. (C) The structures of FBN-1-3. | ||
The simultaneous detection of NTR and ATP may help to understand the hypoxic state and clarify the correlation between NTR and ATP in cells. Therefore, the Ma group developed a dual-function fluorescent probe consisting of a rhodamine/1,8-naphthalimide hybrid structure as the scaffold. The –NO2 group in the 1,8-naphthalimide was reduced to an amine by NTR, releasing fluorescence.323 The diethylenetriamine provides multiple hydrogen bonding sites for ATP recognition (Fig. 63). In addition, π–π stacking interactions between the rhodamine and the adenine moiety of ATP facilitates spirolactam ring opening and the fluorescence increase. It was shown that NTR exhibits an exponential increase but ATP exhibits a decrease during hypoxia. In addition, an amphiphilic lipopeptide molecule, RNNF, incorporating indocyanine green and an arginine-rich dendritic peptide with both NTR and glutathione responsive linkers was reported by the Nie group.324
All probes for cytoplasmic matrix hypoxia based on different recognition units including a –NO2 group, nitrobenzyl group, nitrofuran moiety and N![[double bond, length as m-dash]](https://www.rsc.org/images/entities/char_e001.gif) N bond are summarized in Table 7. It can be seen from the table that most of the probes exhibit green and red fluorescence and only a few emit NIR fluorescence. From the point of view of the linear range, these probes can detect NTR over both low and high concentrations. The lowest LOD (0.947 μg mL−1) was achieved using CL-NTR. From the aspect of biological application, although hypoxia detection has been realized at the level of cells, tissues and living animals, qualitative detection has not been achieved, which is not conducive to practical biological applications. As such, in the future, more NIR probes should be developed to achieve the quantitative detection of NTR under different physiological conditions in vivo, so as to provide effective guidance for the study of NTR-related diseases.
N bond are summarized in Table 7. It can be seen from the table that most of the probes exhibit green and red fluorescence and only a few emit NIR fluorescence. From the point of view of the linear range, these probes can detect NTR over both low and high concentrations. The lowest LOD (0.947 μg mL−1) was achieved using CL-NTR. From the aspect of biological application, although hypoxia detection has been realized at the level of cells, tissues and living animals, qualitative detection has not been achieved, which is not conducive to practical biological applications. As such, in the future, more NIR probes should be developed to achieve the quantitative detection of NTR under different physiological conditions in vivo, so as to provide effective guidance for the study of NTR-related diseases.
9. Small-molecule fluorescent chemosensors for the cell membrane microenvironment
9.1. The composition and function of the cell membrane
The membrane mainly consists of lipids (mostly phospholipids), proteins and sugars with a thickness of 7–8 nm. They play a vital role in controlling diffusion, transport, and intermolecular interactions.325,326 The cell membrane is a barrier that prevents extracellular species from freely entering the cell and results in transport via pinocytosis, phagocytosis, or exocytosis. In addition, cell membranes play essential roles in cell recognition, signal transmission, cellulose synthesis and the assembly of microfilaments.9.2. Fluorescent chemosensors for cell membrane viscosity
The fluidity of the membrane can regulate the dynamics and interactions of biological molecules and thus affect the function of cells and organisms. The quantitative assessment of membrane viscosity was achieved in 2016, when Mika et al. developed a molecular rotor BODIPY C10 for monitoring the viscosity of the membrane of Escherichia coli bacteria.327 Based on the conventional molecular rotor theory, BODIPY C10 exhibited high sensitivity to viscosity. With the help of fluorescence imaging technology, this research determined that at 37 °C, the membrane viscosity in live E. coli cells is about 950 cP, which is higher than that previously observed in other live cell membranes such as eukaryotic cells, and vegetative cells of bacillus. In addition, the Widengren group reported another dye MC540 for probing membrane microviscosity in biological membranes and in live cells.328 The dye MC540, an anionic lipophilic polymethine dye, binds superficially to the outer leaflets of membranes. When lipids in the membrane are loosely packed, MC540 is parallel to the membrane surface and immersed between the phospholipid chains. However, in the case of increasing lipid packing, the dye takes an orientation perpendicular to the surface and superficial to the phospholipid chains, accompanied by a red shift of fluorescence wavelength and a decrease of fluorescence quantum yield. Based on this strategy, MC540 was used to evaluate the membrane fluidity of live MCF7 cells.In short, there are just a few studies on cell membrane fluidity, either for cells or bacteria. However, to accurately detect biofilm fluidity, there is still a significant amount of room for improvement at least in probe design. On the one hand, the probe should be targeted to the cell membrane, to reduce the influence of other lipid suborganelle membranes. On the other hand, due to the complexity of the hydrophilic and hydrophobic structure of the membrane, the probe should only respond to viscosity without interference from polarity.
9.3. Fluorescent chemosensors for cell membrane polarity
Cellular plasma membranes have a significant influence on cellular functions, and as such the development of probes for analysing membrane polarity are highly desirable. Therefore, in 2015, a family of thiophene derivatives Mem1a/b and Mem2a/b were developed and evaluated for monitoring plasma membranes (Fig. 64A).329 The vinylene-linked molecules (Mem1a/b) were prepared via a Knoevenagel reaction, while the ethynylenelinked molecules (Mem2a/b) were prepared by Sonogashira coupling and N-alkylation. All the probes exhibited NIR emission with strong positive solvatochromism. Importantly, the solvatochromism and hyperpolarizability of the vinylene-linked probes (Mem1a/b) were similar to the commercial membrane dye (the styryl dye FM4-64), demonstrating that the substitution of a vinylene-link by a thiophene group only slightly affects the electronic distribution. In contrast, the ethynylene-linked probes (Mem 2a/b) are less π-conjugated than the vinylene-linked molecules and displayed hypsochromic shifts in the spectra. Moreover, the singly charged methyl-pyridinium probes (Mem1a, Mem2a) were more toxic than the doubly-charged systems (Mem1b, Mem2b), which may be due to the rapid internalization of the singly-charged methyl-pyridinium dyes into cells. Excitingly, Mem1b and Mem2b accumulated in the plasma membrane. In addition, the polarity-responsive membrane probes NR12S, Di-4-AN(F)EPPTEA, and Di-4-ANEPPDHQ were evaluated by Sezgin et al. (Fig. 64B).330 Among these, Di-4-AN(F)EPPTEA achieved imaging of CHO cell membranes using confocal and stimulated emission depletion (STED) microscopy (Fig. 64C). In summary, the preceding research has demonstrated that polarity-sensitive dyes are useful tools for investigating cell membrane heterogeneity.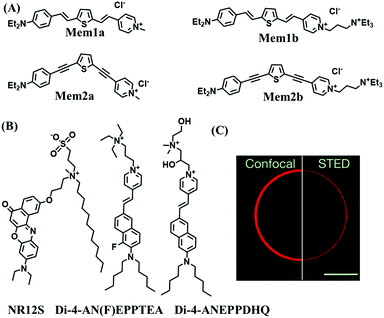 | ||
| Fig. 64 (A) The structures of Mem1a/b and Mem2a/b. (B) The structures of NR12S, Di-4-AN(F)EPPTEA, and Di-4-ANEPPDHQ. (C) Fluorescence (left) and STED (right) microscopy images of the same CHO cells stained with Di-4-AN(F)EPPTEA. Reproduced from ref. 330 with the permission of Elsevier, copyright 2017. | ||
10. Concluding remarks, challenges and future perspectives
The microenvironment (viscosity, temperature, polarity, hypoxia, and acidic-basic status), plays significant roles in controlling specific cellular functions. However, an abnormal microenvironment could lead to malfunctions of organelles, resulting in disorders and disease development. Fluorescent sensors that can specifically target organelles are capable of reporting localized environmental bioinformation and facilitate a better understanding of the microenvironment of both healthy and diseased states. Over the past several decades, interest in organelle-targeting probes for microenvironmental response has surged considerably. Consequently, many small-molecule fluorescent chemosensor/probes have emerged for imaging the microenvironment. However, as far as we know, no review on this topic has been published since 2015. Therefore, we believe that this review represents a timely summary of the advances in small molecule based fluorescent chemosensors for imaging of the microenvironment within specific cellular regions.In this review, we comprehensively summarize recent progress towards small molecule based fluorescent probes for detecting and imaging the microenvironment within specific cellular regions reported since 2015. To make the topic easy to follow, the research has been classified according to the specific cellular regions targeted by the probes including the mitochondria, lysosome, endoplasmic reticulum, golgi apparatus, cell membrane, nucleus and cytoplasmic matrix. We anticipate that this classification will facilitate a better understanding of the topic and encourage research directed towards the development of probes targeted for specific cellular regions. Moreover, under each sub organelle category, microenvironmental factors have been discussed separately, in which the chemical synthesis, sensing mechanisms, fluorescent signals, and bio-imaging applications are discussed and compared in detail.
Currently, the reported microenvironmental probes have been used effectively for cellular or in vivo applications. Moreover, some probes have been used for specific disease models facilitating a deeper understanding of the complex relationships existing between disease development and the microenvironment. We anticipate that this review will stimulate additional research towards microenvironmental probes for organelles and result in systems able to provide practical guidance in clinical research.
Despite the progress made to date in developing organic small molecular fluorescent probes for investigating the microenvironment changes in cellular specific regions, there are still many unmet challenges to be overcome. Here, we will outline several aspects of current probes that need improvement/development. Firstly, most probes exhibited short excitation (<500 nm)/emission (<600 nm) wavelengths, which is fraught with interference caused by auto fluorescence and restricts their applications in vivo. Secondly, numerous probes display a turn-on fluorescence signal in a single channel, which can be subject to interference from instrumental parameters and dye concentrations, reducing the accuracy of detection. Thirdly, many probes suffer from poor water solubility, limiting their performance in biological systems. In addition, small Stokes shifts, high toxicity, low photostability and low signal to noise ratios should be improved. In terms of biological applications, more emphasis should be placed on the less studied subcellular organs. Until recently, there have only been a few studies on the Golgi apparatus, cell membrane and nuclear microenvironment. In addition, research towards the effects of hypoxia and temperature changes on cell membranes is still lacking; therefore, we suggest that these areas should be the focus of future research.
Similarly, more effort should be devoted to optimizing the current micro-environmentally-sensitive probes for biological applications. In particular it is vital to improve the current probes’ selectivity, photostability and sensitivity, and increase the Stokes shift and water solubility. In addition, near-infrared and two-photon strategies should be adopted owing to the merits of minimum photo-damage to biological samples, low background and deep tissue penetration in biological imaging. Moreover, dual activatable and dual targeting probes should be developed in order to improve the efficiency and precision for microenvironmental detection. Finally, in the future small molecule fluorescent probes should be combined with other approaches such as using quantum dots, fluorescent proteins, and metal cations (ruthenium, etc.).
In summary, we believe that our review provides information on the current state of the art for small molecular-based probes and provides a systematic understanding of the function of the microenvironment in each organelle. Moreover, this review will help readers understand the relationships between the microenvironment and health/diseases. As such the guidance provided as part of this review will benefit the chemosensor, bioanalytical detection, molecular imaging, chemical biology, and medical science communities. Finally, we expect that improvement and exciting progress will only be achieved by cooperation and pooling of resources by experts from all of these communities. We therefore hope that this review will provide incentives for such far ranging and important interactions.
Abbreviations
| Aβ | Amyloid beta peptide |
| ACQ | Aggregation-caused quenching |
| AIE | Aggregation induced emission |
| ATP | Adenosine triphosphate |
| BODIPY | Boron-dipyrromethene |
| CCCP | Carbonylcyanide-m-chlorophenylhydrazone |
| C. elegans | Caenorhabditis elegans |
| DPI | Diphenyliodonium chloride |
| D–π–A | Donor–π–acceptor |
| ER | Endoplasmic reticulum |
| ERAP1 | Endoplasmic reticulum aminopeptidase 1 |
| ESIPT | Excited state intramolecular proton transfer |
| FLIM | Fluorescence lifetime imaging |
| FRET | Fluorescence resonance energy transfer |
| H2O2 | Hydrogen peroxide |
| ICT | Intramolecular charge transfer |
| IQ | Indolizino[3,2-c]quinolone |
| LOD | Limit of detection |
| LPS | Lipopolysaccharide |
| NADH | Nicotinamide adenine dinucleotide |
| NIR | Near infrared emission |
| NTR | Nitroreductase |
| PEG | Polyethylene glycol |
| PeT | Photoinduced electron transfer |
| pH | Scale used to specify the acidity or basicity of an aqueous solution |
| ROS | Reactive oxygen species |
| SNR | Signal-to-noise ratio |
| TBET | Through bond energy transfer |
| TICT | Twisted intramolecular charge transfer |
| TP | Two-photon |
| TPP | Triphenylphosphine |
| 3D | Three-dimensional |
Conflicts of interest
There are no conflicts to declare.Acknowledgements
This work was financially supported by NSFC (21672083, 21877048, and 22077048), Guangxi Natural Science Foundation (2021GXNSFDA075003), and the startup fund of Guangxi University (A3040051003). T. D. J. wishes to thank the Royal Society for a Wolfson Research Merit Award and the Open Research Fund of the School of Chemistry and Chemical Engineering, Henan Normal University for support (2020ZD01). L. W. wishes to thank China Scholarship Council and The University of Bath for supporting his PhD in the UK.Notes and references
- B. Strehmel, V. Strehmel and J. J. Malpert, Molecular Fluorescence 2nd, Markono Print Media, Singapore. 2013 Search PubMed.
- K. P. Carter, A. M. Young and A. E. Palmer, Chem. Rev., 2014, 114, 4564–4601 CrossRef CAS PubMed.
- Z. Guo, S. Park, J. Yoon and I. Shin, Chem. Soc. Rev., 2014, 43, 16–29 RSC.
- V. S. Lin, W. Chen, M. Xian and C. J. Chang, Chem. Soc. Rev., 2015, 44, 4596–4618 RSC.
- L. Y. Niu, Y. Z. Chen, H. R. Zheng, L. Z. Wu, C. H. Tung and Q. Z. Yang, Chem. Soc. Rev., 2015, 44, 6143–6160 RSC.
- Y. Tang, Y. Ma, J. Yin and W. Lin, Chem. Soc. Rev., 2019, 48, 4036–4048 RSC.
- D. Cao, Z. Liu, P. Verwilst, S. Koo, P. Jangjili, J. S. Kim and W. Lin, Chem. Rev., 2019, 119, 10403–10519 CrossRef CAS PubMed.
- M. Beija, C. A. Afonso and J. M. Martinho, Chem. Soc. Rev., 2009, 38, 2410–2433 RSC.
- N. Boens, V. Leen and W. Dehaen, Chem. Soc. Rev., 2012, 41, 1130–1172 RSC.
- R. M. Duke, E. B. Veale, F. M. Pfeffer, P. E. Kruger and T. Gunnlaugsson, Chem. Soc. Rev., 2010, 39, 3936–3953 RSC.
- J. Yin, Y. Ma, G. Li, M. Peng and W. Lin, Coordin. Chem. Rev., 2020, 412 Search PubMed.
- J. R. Lakowicz, Principles of fluorescence spectroscopy, 3rd edn, Springer Science + Business Media, New York, 2006 Search PubMed.
- L. He, B. Dong, Y. Liu and W. Lin, Chem. Soc. Rev., 2016, 45, 6449–6461 RSC.
- V. S. Padalkar and S. Seki, Chem. Soc. Rev., 2016, 45, 169–202 RSC.
- L. Wu, C. Huang, B. P. Emery, A. C. Sedgwick, S. D. Bull, X. P. He, H. Tian, J. Yoon, J. L. Sessler and T. D. James, Chem. Soc. Rev., 2020, 49, 5110–5139 RSC.
- D. Cao, L. Zhu, Z. Liu and W. Lin, J. Photochem. Photobiol., C, 2020, 44 Search PubMed.
- K. Luby-Phelps, Int. Rev. Cytol., 2000, 192, 189–221 CAS.
- S. J. Singer and G. L. Nicolson, Science, 1972, 175, 720–731 CrossRef CAS PubMed.
- M. J. Stutts, C. M. Canessa, J. C. Olsen, M. Hamrick, J. A. Cohn, B. C. Rossier and R. C. Boucher, Science, 1995, 269, 847–850 CrossRef CAS PubMed.
- H. R. Petty, Microsc. Res. Tech., 2007, 70, 687–709 CrossRef PubMed.
- K. Simons and D. Toomre, Nat. Rev. Mol. Cell Biol., 2000, 1, 31–39 CrossRef CAS PubMed.
- S. Munro, Cell, 2003, 115, 377–388 CrossRef CAS PubMed.
- R. G. W. Anderson and K. Jacobson, Science, 2002, 296, 1821–1825 CrossRef CAS PubMed.
- S. Mukherjee and F. R. Maxfield, Annu. Rev. Cell Dev. Biol., 2004, 20, 839–866 CrossRef CAS PubMed.
- R. A. Gottlieb, J. Nordberg, E. Skowronski and B. M. Babior, Proc. Natl. Acad. Sci. U. S. A., 1996, 93, 654–658 CrossRef CAS PubMed.
- A. Varadi and G. A. Rutter, Endocrinology, 2004, 145, 4540–4549 CrossRef CAS PubMed.
- J. M. Brown and W. R. Wilson, Nat. Rev. Cancer, 2004, 4, 437–447 CrossRef CAS PubMed.
- W. R. Wilson and M. P. Hay, Nat. Rev. Cancer, 2011, 11, 393–410 CrossRef CAS PubMed.
- B. B. Lowell and B. M. Spiegelman, Nature, 2000, 404, 652–660 CrossRef CAS PubMed.
- S. Prusiner and M. Poe, Nature, 1968, 220, 235–237 CrossRef PubMed.
- G. Kroemer, L. Galluzzi and C. Brenner, Physiol. Rev., 2007, 87, 99–163 CrossRef CAS PubMed.
- Z. Yang, J. Cao, Y. He, J. H. Yang, T. Kim, X. Peng and J. S. Kim, Chem. Soc. Rev., 2014, 43, 4563–4601 RSC.
- H. Zhu, J. Fan, J. Du and X. Peng, Acc. Chem. Res., 2016, 49, 2115–2126 CrossRef CAS PubMed.
- A. S. Klymchenko, Acc. Chem. Res., 2017, 50, 366–375 CrossRef CAS PubMed.
- C. Ma, W. Sun, L. Xu, Y. Qian, J. Dai, G. Zhong, Y. Hou, J. Liu and B. Shen, J. Mater. Chem. B, 2020, 8, 9642–9651 RSC.
- H. Xiao, P. Li and B. Tang, Coord. Chem. Rev., 2021, 427, 213582 CrossRef CAS.
- P. Gao, W. Pan, N. Li and B. Tang, Chem. Sci., 2019, 10, 6035–6071 RSC.
- D. C. Wallace, Science, 1999, 283, 1482–1488 CrossRef CAS PubMed.
- T. Nakagawa and L. Guarente, Aging, 2009, 1, 578–581 CrossRef CAS PubMed.
- G. Nie, Blood, 2005, 105, 2161–2167 CrossRef CAS PubMed.
- L. Ernster and G. Schatz, J. Cell Biol., 1981, 91, 227s–255s CrossRef CAS PubMed.
- S. W. Tait and D. R. Green, Nat. Rev. Mol. Cell Biol., 2010, 11, 621–632 CrossRef CAS PubMed.
- M. J. Hansson, S. Morota, M. Teilum, G. Mattiasson, H. Uchino and E. J. Elmer, J. Biol. Chem., 2010, 285, 741–750 CrossRef CAS PubMed.
- G. S. Zubenko, U. Kopp, T. Seto and L. L. Firestone, Psychopharmacology, 1999, 145, 175–180 CrossRef CAS PubMed.
- P. Mecocci, M. F. Beal, R. Cecchetti, M. C. Polidori, A. Cherubini, F. Chionne, L. Avellini, G. Romano and U. Senin, Mol. Chem. Neuropathol., 1997, 31, 53–64 CrossRef CAS PubMed.
- A. M. Aleardi, G. Benard, O. Augereau, M. Malgat, J. C. Talbot, J. P. Mazat, T. Letellier, J. Dachary-Prigent, G. C. Solaini and R. J. Rossignol, J. Bioenergy Biomembr., 2005, 37, 207–225 CrossRef CAS PubMed.
- A. P. West, G. S. Shadel and S. Ghosh, Nat. Rev. Immunol., 2011, 11, 389–402 CrossRef CAS PubMed.
- R. Rizzuto, D. Stefani, A. Raffaello and C. Mammucari, Nat. Rev. Mol. Cell Biol., 2012, 13, 566–578 CrossRef CAS PubMed.
- D. C. Wallace, Nat. Rev. Cancer, 2012, 12, 685–698 CrossRef CAS PubMed.
- R. N. Kumar, V. Bhalla and M. Kumar, Chem. Commun., 2015, 51, 15614–15628 RSC.
- D. Su, C. L. Teoh, N. Gao, Q. H. Xu and Y. T. Chang, Sensors, 2016, 16, 1397 CrossRef PubMed.
- M. Peng, J. Yin and W. Lin, New J. Chem., 2019, 43, 16945–16949 RSC.
- K. Zhou, M. Ren, B. Deng and W. Lin, New J. Chem., 2017, 41, 11507–11511 RSC.
- L. Dai, M. Ren, Z. Li, L. Wang and W. Lin, Anal. Methods, 2019, 11, 4561–4565 RSC.
- Y. Zhang, Z. Li, W. Hu and Z. Liu, Anal. Chem., 2019, 91, 10302–10309 CrossRef CAS PubMed.
- R. Guo, J. Yin, Y. Ma, Q. Wang and W. Lin, J. Mater. Chem. B, 2018, 6, 2894–2900 RSC.
- H. Wang, L. Zhou, F. Cai, X. Shen, J. Sun, Y. Wei, D. Feng, Z. Feng and J. He, Chem. Pap., 2019, 74, 1071–1078 CrossRef.
- R. Guo, Y. Ma, Y. Tang, P. Xie, Q. Wang and W. Lin, Talanta, 2019, 204, 868–874 CrossRef CAS PubMed.
- X. Tian, S. Hussain, H. Wang, Q. Zhang, M. Zhao, J. Chen, H. Zhang, H. Zhou, Y. Chen and Y. Tian, Dyes Pigm., 2017, 147, 90–98 CrossRef CAS.
- H. Wang, B. Fang, L. Xiao, D. Li, L. Zhou, L. Kong, Y. Yu, X. Li, Y. Wu and Z. Hu, Spectrochim. Acta, Part A, 2018, 203, 127–131 CrossRef CAS PubMed.
- Y. Baek, S. J. Park, X. Zhou, G. Kim, H. M. Kim and J. Yoon, Biosens. Bioelectron., 2016, 86, 885–891 CrossRef CAS PubMed.
- H. Wang, F. Cai, L. Zhou, J. He, D. Feng, Y. Wei, Z. Feng, X. Gu, U. Kajsa and Z. Hu, New J. Chem., 2019, 43, 8811–8815 RSC.
- S. J. Park, B. K. Shin, H. W. Lee, J. M. Song, J. T. Je and H. M. Kim, Dyes Pigm., 2020, 174, 108080 CrossRef CAS.
- Y. Wu, W. Shu, C. Zeng, B. Guo, J. Shi, J. Jing and X. Zhang, Dyes Pigm., 2019, 168, 134–139 CrossRef CAS.
- B. Chen, C. Li, J. Zhang, J. Kan, T. Jiang, J. Zhou and H. Ma, Chem. Commun., 2019, 55, 7410–7413 RSC.
- X. Song, N. Li, C. Wang and Y. Xiao, J. Mater. Chem. B, 2017, 5, 360–368 RSC.
- S. O. Raja, G. Sivaraman, A. Mukherjee, C. Duraisamy and A. Gulyani, ChemistrySelect, 2017, 2, 4609–4616 CrossRef CAS.
- Y. Ma, Y. Zhao, R. Guo, L. Zhu and W. Lin, J. Mater. Chem. B, 2018, 6, 6212–6216 RSC.
- M. Ren, K. Zhou, L. Wang, K. Liu and W. Lin, Sens. Actuators, B, 2018, 262, 452–459 CrossRef CAS.
- F. Liu, Y. Luo and M. Xu, Tetrahedron Lett., 2018, 59, 4540–4544 CrossRef CAS.
- J. Yin, M. Peng and W. Lin, Anal. Chem., 2019, 91, 8415–8421 CrossRef CAS PubMed.
- W. Wang, Y. Liu, J. Niu and W. Lin, Analyst, 2019, 144, 6247–6253 RSC.
- L. Zhu, M. Fu, B. Yin, L. Wang, Y. Chen and Q. Zhu, Dyes Pigm., 2020, 172, 107859 CrossRef CAS.
- Z. Zou, Q. Yan, S. Ai, P. Qi, H. Yang, Y. Zhang, Z. Qing, L. Zhang, F. Feng and R. Yang, Anal. Chem., 2019, 91, 8574–8581 CrossRef CAS PubMed.
- I. E. Steinmark, A. L. James, P. H. Chung, P. E. Morton, M. Parsons, C. A. Dreiss, C. D. Lorenz, G. Yahioglu and K. Suhling, PLoS One, 2019, 14, e021116 CrossRef PubMed.
- M. Ren, B. Deng, K. Zhou, X. Kong, J. Y. Wang and W. Lin, Anal. Chem., 2017, 89, 552–555 CrossRef CAS PubMed.
- H. Li, C. Xin, G. Zhang, X. Han, W. Qin, C.-W. Zhang, C. Yu, S. Jing, L. Li and W. Huang, J. Mater. Chem. B, 2019, 7, 4243–4251 RSC.
- W. Sun, Y.-D. Shi, A.-X. Ding, Z.-L. Tan, H. Chen, R. Liu, R. Wang and Z.-L. Lu, Sens. Actuators, B, 2018, 276, 238–246 CrossRef CAS.
- S. J. Li, Y. F. Li, H. W. Liu, D. Y. Zhou, W. L. Jiang, J. Ou-Yang and C. Y. Li, Anal. Chem., 2018, 90, 9418–9425 CrossRef CAS PubMed.
- C. Sun, W. Cao, W. Zhang, L. Zhang, Y. Feng, M. Fang, G. Xu, Z. Shao, X. Yang and X. Meng, Dyes Pigm., 2019, 171, 107709 CrossRef CAS.
- H. Xiao, P. Li, W. Zhang and B. Tang, Chem. Sci., 2016, 7, 1588–1593 RSC.
- N. Jiang, J. Fan, F. Xu, X. Peng, H. Mu, J. Wang and X. Xiong, Angew. Chem., Int. Ed., 2015, 54, 2510–2514 CrossRef CAS PubMed.
- K. Pal and A. L. Koner, Chemistry, 2017, 23, 8610–8614 CrossRef CAS PubMed.
- X. Li, X. Li and H. Ma, Chem. Sci., 2020, 11, 1617–1622 RSC.
- M. Grzybowski, E. Glodkowska-Mrowka, V. Hugues, W. Brutkowski, M. Blanchard-Desce and D. T. Gryko, Chemistry, 2015, 21, 9101–9110 CrossRef CAS PubMed.
- B. Wang, X. Zhang, C. Wang, L. Chen, Y. Xiao and Y. Pang, Analyst, 2015, 140, 5488–5494 RSC.
- J. Cui, Y. Yao, C. Chen, R. Huang, W. Zhang and J. Qian, Chin. Chem. Lett., 2019, 30, 1071–1074 CrossRef CAS.
- A. Jimenez-Sanchez, E. K. Lei and S. O. Kelley, Angew. Chem., Int. Ed., 2018, 57, 8891–8895 CrossRef CAS PubMed.
- A. Gulyani, O. Raja and G. Sivaraman, US Pat., 10808128, 2020 Search PubMed.
- M. Y. Wu, K. Li, Y. H. Liu, K. K. Yu, Y. M. Xie, X. D. Zhou and X. Q. Yu, Biomaterials, 2015, 53, 669–678 CrossRef CAS PubMed.
- L. Cao, Z. Zhao, T. Zhang, X. Guo, S. Wang, S. Li, Y. Li and G. Yang, Chem. Commun., 2015, 51, 17324–17327 RSC.
- A. R. Sarkar, C. H. Heo, L. Xu, H. W. Lee, H. Y. Si, J. W. Byun and H. M. Kim, Chem. Sci., 2016, 7, 766–773 RSC.
- P. Wang, J. Huang and Y. Gu, RSC Adv., 2016, 6, 95708–95714 RSC.
- L. Q. Niu, J. Huang, Z. J. Yan, Y. H. Men, Y. Luo, X. M. Zhou, J. M. Wang and J. H. Wang, Spectrochim. Acta, Part A, 2019, 207, 123–131 CrossRef CAS PubMed.
- Y. Chen, C. Zhu, J. Cen, Y. Bai, W. He and Z. Guo, Chem. Sci., 2015, 6, 3187–3194 RSC.
- G. Li, B. Zhang, X. Song, Y. Xia, H. Yu, X. Zhang, Y. Xiao and Y. Song, Sens. Actuators, B, 2017, 253, 58–68 CrossRef CAS.
- S. Xia, J. Wang, Y. Zhang, N. Whisman, J. Bi, T. E. Steenwinkel, S. Wan, J. Medford, M. Tajiri, R. L. Luck, T. Werner and H. Liu, J. Mater. Chem. B, 2020, 8, 1603–1615 RSC.
- W. Zhang, X. Wang, P. Li, H. Xiao, W. Zhang, H. Wang and B. Tang, Anal. Chem., 2017, 89, 6840–6845 CrossRef CAS PubMed.
- D. Wang, Z. Wang, Y. Li, Y. Song, Y. Song, M. Zhang and H. Yu, New J. Chem., 2018, 42, 11102–11108 RSC.
- Z. Li, X. He, Z. Wang, R. Yang, W. Shi and H. Ma, Biosens. Bioelectron., 2015, 63, 112–116 CrossRef CAS PubMed.
- Z. Thiel and P. Rivera-Fuentes, Angew. Chem., Int. Ed., 2019, 58, 11474–11478 CrossRef CAS PubMed.
- S.-Y. Na, S. Park, S.-Y. Kim and H.-J. Kim, Dyes Pigm., 2019, 161, 247–251 CrossRef CAS.
- B. Huang, W. Chen, Y. Q. Kuang, W. Liu, X. J. Liu, L. J. Tang and J. H. Jiang, Org. Biomol. Chem., 2017, 15, 4383–4389 RSC.
- Q. Yang, S. Wang, D. Li, J. Yuan, J. Xu and S. Shao, Anal. Chim. Acta, 2020, 1103, 202–211 CrossRef CAS PubMed.
- M. Safir Filho, P. Dao, A. R. Martin and R. Benhida, J. Photochem. Photobiol., A, 2020, 396, 112528 CrossRef CAS.
- Y. Li, Y. Deng, J. Liu, J. Fu, Y. Sun, R. Ouyang and Y. Miao, Sens. Actuators, B, 2019, 286, 337–345 CrossRef CAS.
- D. Zhu, L. Xue, G. Li and H. Jiang, Sens. Actuators, B, 2016, 222, 419–424 CrossRef CAS.
- Y. Liu, L. Teng, L. Chen, H. Ma, H. W. Liu and X. B. Zhang, Chem. Sci., 2018, 9, 5347–5353 RSC.
- L. Yang, J.-Y. Niu, R. Sun, Y.-J. Xu and J.-F. Ge, Sens. Actuators, B, 2018, 259, 299–306 CrossRef CAS.
- M. Homma, Y. Takei, A. Murata, T. Inoue and S. Takeoka, Chem. Commun., 2015, 51, 6194–6197 RSC.
- S. Arai, M. Suzuki, S. J. Park, J. S. Yoo, L. Wang, N. Y. Kang, H. H. Ha and Y. T. Chang, Chem. Commun., 2015, 51, 8044–8047 RSC.
- D. Chrétien, P. Bénit, H.-H. Ha, S. Keipert, R. El-Khoury, Y.-T. Chang, M. Jastroch, H. T. Jacobs, P. Rustin and M. Rak, PLoS Biol., 2018, 16, e2003992 CrossRef PubMed.
- R. Lüllmann-Rauch, History and Morphology of the Lysosome. In Lysosomes, Springer, New York, 2005, pp. 1–16 Search PubMed.
- J. P. Luzio, P. R. Pryor and N. A. Bright, Nat. Rev. Mol. Cell Biol., 2007, 8, 622–635 CrossRef CAS PubMed.
- S. Ohkuma and B. Poole, Proc. Natl. Acad. Sci. U. S. A., 1978, 75, 3327–3335 CrossRef CAS PubMed.
- H. Appelqvist, P. Waster, K. Kagedal and K. Ollinger, J. Mol. Cell Biol., 2013, 5, 214–221 CrossRef CAS PubMed.
- F. M. Platt, B. Boland and A. C. Spoel, J. Cell Biol., 2012, 199, 723–728 CrossRef CAS PubMed.
- L. Zhang, R. Sheng and Z. Qin, Acta Biochim. Biophys. Sin., 2009, 41, 437–446 CrossRef CAS PubMed.
- N. Mizushima, Genes Dev., 2007, 21, 2861 CrossRef CAS PubMed.
- M. Malicdan, S. Noguchi, I. Noaka, P. Saftig and I. Nishino, Neuromuscular Disord., 2008, 18, 521 CrossRef PubMed.
- A. Lieberman, R. Puertollano, N. Raben, S. Slaugenhaupt, S. Walkley and A. Ballabio, Autophagy, 2012, 8, 719 CrossRef CAS PubMed.
- S. Stern, P. Adiseshaiah and R. Crist, Part. Fibre Toxicol., 2012, 9, 20–27 CrossRef CAS PubMed.
- L. Wang, Y. Xiao, W. Tian and L. Deng, J. Am. Chem. Soc., 2013, 135, 2903–2914 CrossRef CAS PubMed.
- H. Yu, Y. Xiao and L. Jin, J. Am. Chem. Soc., 2012, 134, 17486 CrossRef CAS PubMed.
- Q. Wan, S. Chen, W. Shi, L. Li and H. Ma, Angew. Chem., Int. Ed., 2014, 53, 10916–10924 CrossRef CAS PubMed.
- L. Hou, P. Ning, Y. Feng, Y. Ding, L. Bai, L. Li, H. Yu and X. Meng, Anal. Chem., 2018, 90, 7122–7126 CrossRef CAS PubMed.
- L. Li, K. Li, M. Li, L. Shi, Y. H. Liu, H. Zhang, S. Pan, N. Wang, Q. Zhou and X. Yu, Anal. Chem., 2018, 90, 5873–5878 CrossRef CAS PubMed.
- Y. Cai, C. Gui, K. Samedov, H. Su, X. Gu, S. Li, W. Luo, H. H. Y. Sung, J. W. Y. Lam, R. T. K. Kwok, I. D. Williams, A. Qin and B. Z. Tang, Chem. Sci., 2017, 8, 7593–7603 RSC.
- D. Han, J. Yi, C. Liu, L. Liang, K. Huang, L. Jing and D. Qin, Spectrochim. Acta, Part A, 2020, 238, 118405 CrossRef CAS PubMed.
- B. Shen, L. F. Wang, X. Zhi and Y. Qian, Sens. Actuators, B, 2020, 304, 127271 CrossRef CAS.
- J. Park, B. Lim, N. K. Lee, J. H. Lee, K. Jang, S. W. Kang, S. Kim, I. Kim, H. Hwang and J. Lee, Sens. Actuators, B, 2020, 309, 127764 CrossRef CAS.
- T. Chen, Z. Chen, R. Liu and S. Zheng, Org. Biomol. Chem., 2019, 17, 6398–6403 RSC.
- B. Guo, J. Jing, L. Nie, F. Xin, C. Gao, W. Yang and X. Zhang, J. Mater. Chem. B, 2018, 6, 580–585 RSC.
- H. Sun, H.-X. Leng, J.-S. Liu, G. Roy, J.-W. Yan and L. Zhang, Sens. Actuators, B, 2020, 305, 127509 CrossRef CAS.
- H. Y. Tan, Y. T. Qiu, H. Sun, J. W. Yan and L. Zhang, Chem. Commun., 2019, 55, 2688–2691 RSC.
- H. Zhu, J. Fan, H. Mu, T. Zhu, Z. Zhang, J. Du and X. Peng, Sci. Rep., 2016, 6, 35627 CrossRef CAS PubMed.
- M. Li, J. Fan, H. Li, J. Du, S. Long and X. Peng, Biomaterials, 2018, 164, 98–105 CrossRef CAS PubMed.
- Y. Wang, G. Wang, K. Wang, Z. Wang, Y. Guo and H. Zhang, Sens. Actuators, B, 2018, 261, 210–217 CrossRef CAS.
- L. Hu, D. Shi, X. Li, J. Zhu, F. Mao, X. Li, C. Xia, B. Jiang, Y. Guo and J. Li, Dyes Pigm., 2020, 177, 108320 CrossRef CAS.
- K. Pal, P. Kumar and A. L. Koner, J. Photochem. Photobiol., B, 2020, 206, 111848 CrossRef CAS PubMed.
- L. Fan, X. Wang, J. Ge, F. Li, X. Wang, J. Wang, S. Shuang and C. Dong, Chem. Commun., 2019, 55, 4703–4706 RSC.
- J. Yin, M. Peng and W. Lin, Chem. Commun., 2019, 55, 11063–11066 RSC.
- J. Jiang, X. Tian, C. Xu, S. Wang, Y. Feng, M. Chen, H. Yu, M. Zhu and X. Meng, Chem. Commun., 2017, 53, 3645–3648 RSC.
- C. Jiang, L. Li, J. Jiang, L. Hou, G. Fang, Y. Haizhu and X. Meng, Chin. Chem. Lett., 2020, 31, 447–450 CrossRef CAS.
- X. Zheng, W. Zhu, F. Ni, H. Ai, S. Gong, X. Zhou, J. L. Sessler and C. Yang, Chem. Sci., 2019, 10, 2342–2348 RSC.
- S. J. Park, V. Juvekar, J. H. Jo and H. M. Kim, Chem. Sci., 2020, 11, 596–601 RSC.
- H. Li, C. Wang, M. She, Y. Zhu, J. Zhang, Z. Yang, P. Liu, Y. Wang and J. Li, Anal. Chim. Acta, 2015, 900, 97–102 CrossRef CAS PubMed.
- S. L. Shen, X. P. Chen, X. F. Zhang, J. Y. Miao and B. X. Zhao, J. Mater. Chem. B, 2015, 3, 919–925 RSC.
- G. Niu, P. Zhang, W. Liu, M. Wang, H. Zhang, J. Wu, L. Zhang and P. Wang, Anal. Chem., 2017, 89, 1922–1929 CrossRef CAS PubMed.
- B. Li, G. b. Ge, L. Wen, Y. Yuan, R. Zhang, X. Peng, F. Liu and S. Sun, Dyes Pigm., 2017, 139, 318–325 CrossRef CAS.
- S.-L. Shen, X.-F. Zhang, Y.-Q. Ge, Y. Zhu, X.-Q. Lang and X.-Q. Cao, Sens. Actuators, B, 2018, 256, 261–267 CrossRef CAS.
- S. Zhang, T. H. Chen, H. M. Lee, J. Bi, A. Ghosh, M. Fang, Z. Qian, F. Xie, J. Ainsley, C. Christov, F. T. Luo, F. Zhao and H. Liu, ACS Sens., 2017, 2, 924–931 CrossRef CAS PubMed.
- Q. Wang, L. Zhou, L. Qiu, D. Lu, Y. Wu and X. B. Zhang, Analyst, 2015, 140, 5563–5569 RSC.
- X.-F. Zhang, T. Zhang, S.-L. Shen, J.-Y. Miao and B.-X. Zhao, RSC Adv., 2015, 5, 49115–49121 RSC.
- X. F. Zhang, T. Zhang, S. L. Shen, J. Y. Miao and B. X. Zhao, J. Mater. Chem. B, 2015, 3, 3260–3266 RSC.
- G.-J. Song, S.-Y. Bai, X. Dai, X.-Q. Cao and B.-X. Zhao, RSC Adv., 2016, 6, 41317–41322 RSC.
- G. J. Song, S. Y. Bai, J. Luo, X. Q. Cao and B. X. Zhao, J. Fluoresc., 2016, 26, 2079–2086 CrossRef CAS PubMed.
- L. Zhou, D.-Q. Lu, Q. Wang, S. Hu, H. Wang, H. Sun and X. Zhang, Sens. Actuators, B, 2017, 238, 274–280 CrossRef CAS.
- L. Zhou, Y. Liu, S. Hu, H. Wang, H. Sun and X. Zhang, Tetrahedron, 2016, 72, 4637–4642 CrossRef CAS.
- X. J. Cao, L. N. Chen, X. Zhang, J. T. Liu, M. Y. Chen, Q. R. Wu, J. Y. Miao and B. X. Zhao, Anal. Chim. Acta, 2016, 920, 86–93 CrossRef CAS PubMed.
- B. Dong, X. Song, X. Kong, C. Wang, N. Zhang and W. Lin, J. Mater. Chem. B, 2017, 5, 988–995 RSC.
- W. Luo, H. Jiang, X. Tang and W. Liu, J. Mater. Chem. B, 2017, 5, 4768–4773 RSC.
- J. Zhang, M. Yang, C. Li, N. Dorh, F. Xie, F. T. Luo, A. Tiwari and H. Liu, J. Mater. Chem. B, 2015, 3, 2173–2184 RSC.
- W. Shen, L. Wang, S. Zhu, S. Yu, C. Cai, W. Yi and Q. Zhu, Anal. Biochem., 2020, 596, 113609 CrossRef CAS PubMed.
- R. Shi, L. Huang, X. Duan, G. Sun, G. Yin, R. Wang and J. J. Zhu, Anal. Chim. Acta, 2017, 988, 66–73 CrossRef CAS PubMed.
- M. Zhu, P. Xing, Y. Zhou, L. Gong, J. Zhang, D. Qi, Y. Bian, H. Du and J. Jiang, J. Mater. Chem. B, 2018, 6, 4422–4426 RSC.
- X. L. Wang, X. J. Li, R. Sun, Y. J. Xu and J. F. Ge, Analyst, 2016, 141, 2962–2969 RSC.
- X. Liu, Y. Su, H. Tian, L. Yang, H. Zhang, X. Song and J. W. Foley, Anal. Chem., 2017, 89, 7038–7045 CrossRef CAS PubMed.
- W. Niu, J. Jia, J. Li, C. Zhang and K. Yun, New J. Chem., 2019, 43, 13363–13370 RSC.
- T. Zhang, D. Xu, C. Y. Poon, X. Wang, F. Bolze, H. W. Li and M. S. Wong, Talanta, 2019, 202, 34–41 CrossRef CAS PubMed.
- Y. Zhang, Y. Zhao, Y. Wu, B. Zhao, L. Wang and B. Song, Spectrochim. Acta, Part A, 2020, 227, 117767 CrossRef CAS PubMed.
- Z. Li, L.-J. Li, T. Sun, L. Liu and Z. Xie, Dyes Pigm., 2016, 128, 165–169 CrossRef CAS.
- L. Wu, Y. Wang, T. D. James, N. Jia and C. Huang, Chem. Commun., 2018, 54, 5518–5521 RSC.
- L. Wu, X. Li, C. Huang and N. Jia, Anal. Chem., 2016, 88, 8332–8338 CrossRef CAS PubMed.
- X. Lou, M. Zhang, Z. Zhao, X. Min, A. Hakeem, F. Huang, P. Gao, F. Xia and B. Z. Tang, J. Mater. Chem. B, 2016, 4, 5412–5417 RSC.
- B. Dong, X. Song, C. Wang, X. Kong, Y. Tang and W. Lin, Anal. Chem., 2016, 88, 4085–4091 CrossRef CAS PubMed.
- C. Wang, B. Dong, X. Kong, N. Zhang, W. Song and W. Lin, Luminescence, 2018, 33, 1275–1280 CrossRef CAS PubMed.
- J. Zhou, W. Shi, L. H. Li, Q. Y. Gong, X. F. Wu, X. H. Li and H. M. Ma, Chem. – Asian J., 2016, 11, 2719–2724 CrossRef CAS PubMed.
- X.-L. Sha, X.-Z. Yang, X.-R. Wei, R. Sun, Y.-J. Xu and J.-F. Ge, Sens. Actuators, B, 2020, 307, 127653 CrossRef.
- H. Wang, Y. Wu, Y. Shi, P. Tao, X. Fan, X. Su and G. C. Kuang, Chemistry, 2015, 21, 3219–3223 CrossRef CAS PubMed.
- K. Tauchi-Sato, S. Ozeki, T. Houjou, R. Taguchi and T. Fujimoto, J. Biol. Chem., 2002, 277, 44507–445013 CrossRef CAS PubMed.
- R. Bartz and K. D. Chapman, J. Lipid Res., 2007, 48, 837–845 CrossRef CAS PubMed.
- S. Martin and R. G. Parton, Nat. Rev. Mol. Cell Biol., 2006, 7, 373–380 CrossRef CAS PubMed.
- N. Krahmer, R. V. Farese, Jr and T. C. Walther, EMBO Mol. Med., 2013, 5, 973–978 CrossRef PubMed.
- F. Baenke, B. Peck, H. Miess and A. Schulze, Dis. Models Mech., 2013, 6, 1353–1360 CrossRef CAS PubMed.
- M. Peng, J. Yin and W. Lin, New J. Chem., 2018, 42, 18521–18525 RSC.
- S. Chen, Y. Hong, Y. Zeng, Q. Sun, Y. Liu, E. Zhao, G. Bai, J. Qu, J. Hao and B. Z. Tang, Chem. – Eur. J., 2015, 21, 4315–4320 CrossRef CAS PubMed.
- R. Guo, J. Yin, Y. Ma, G. Li, Q. Wang and W. Lin, Sens. Actuators, B, 2018, 271, 321–328 CrossRef CAS.
- C. W. Song, U. Tamima, Y. J. Reo, M. Dai, S. Sarkar and K. H. Ahn, Dyes Pigm., 2019, 171, 107718 CrossRef CAS.
- H. Appelqvist, K. Stranius, K. Borjesson, K. P. R. Nilsson and C. Dyrager, Bioconjugate Chem., 2017, 28, 1363–1370 CrossRef CAS PubMed.
- A. Wu, J. L. Kolanowski, B. B. Boumelhem, K. Yang, R. Lee, A. Kaur, S. T. Fraser, E. J. New and L. M. Rendina, Chem. – Asian J., 2017, 12, 1704–1708 CrossRef CAS PubMed.
- M. Becerra-Ruiz, V. Vargas, P. Jara, C. Tirapegui, C. Carrasco, M. Nuñez, N. Lezana, A. Galdámez and M. Vilches-Herrera, Eur. J. Org. Chem., 2018, 4795–4801 CrossRef CAS.
- Z. Zheng, T. Zhang, H. Liu, Y. Chen, R. T. K. Kwok, C. Ma, P. Zhang, H. H. Y. Sung, I. D. Williams, J. W. Y. Lam, K. S. Wong and B. Z. Tang, ACS Nano, 2018, 12, 8145–8159 CrossRef CAS PubMed.
- G. Niu, R. Zhang, J. P. C. Kwong, J. W. Y. Lam, C. Chen, J. Wang, Y. Chen, X. Feng, R. T. K. Kwok, H. H. Y. Sung, I. D. Williams, M. R. J. Elsegood, J. Qu, C. Ma, K. S. Wong, X. Yu and B. Z. Tang, Chem. Mater., 2018, 30, 4778–4787 CrossRef CAS.
- F. de Moliner, A. King, G. G. Dias, G. F. de Lima, C. A. de Simone, E. N. da Silva Junior and M. Vendrell, Front. Chem., 2018, 6, 339–343 CrossRef PubMed.
- X. Zheng, W. Zhu, F. Ni, H. Ai and C. Yang, Sens. Actuators, B, 2018, 255, 3148–3154 CrossRef CAS.
- L. Li, Y. Xu, Y. Chen, J. Zheng, J. Zhang, R. Li, H. Wan, J. Yin, Z. Yuan and H. Chen, Anal. Chim. Acta, 2020, 1096, 166–173 CrossRef CAS PubMed.
- M. S. Filho, P. Dao, A. R. Martin and R. Benhida, Dyes Pigm., 2019, 167, 68–76 CrossRef.
- G. Liu, J. Wang, G. Zhang, H. Zhang, Y. Zhu, H. Xu, L. Kong, Y. Tian, X. Zhu and H. Zhou, Spectrochim. Acta, Part A, 2020, 228, 117766 CrossRef CAS PubMed.
- J. A. Levitt, P. H. Chung and K. Suhling, J. Biomed. Opt., 2015, 20, 096002 CrossRef PubMed.
- R. Chowdhury, M. A. Amin and K. Bhattacharyya, J. Phys. Chem. B, 2015, 119, 10868–10875 CrossRef CAS PubMed.
- A. Sharma, S. Umar, P. Kar, K. Singh, M. Sachdev and A. Goel, Analyst, 2016, 141, 137–143 RSC.
- M. Collot, T. K. Fam, P. Ashokkumar, O. Faklaris, T. Galli, L. Danglot and A. S. Klymchenko, J. Am. Chem. Soc., 2018, 140, 5401–5411 CrossRef CAS PubMed.
- M. Jiang, X. Gu, J. W. Y. Lam, Y. Zhang, R. T. K. Kwok, K. S. Wong and B. Z. Tang, Chem. Sci., 2017, 8, 5440–5446 RSC.
- J. Yin, M. Peng, Y. Ma, R. Guo and W. Lin, Chem. Commun., 2018, 54, 12093–12096 RSC.
- J. Yin, M. Peng and W. Lin, Sens. Actuators, B, 2019, 288, 251–258 CrossRef CAS.
- S. Samanta, M. Huang, F. Lin, P. Das, B. Chen, W. Yan, J. J. Chen, K. Ji, L. Liu, J. Qu and Z. Yang, Anal. Chem., 2020, 92, 1541–1548 CrossRef CAS PubMed.
- T. Yoshihara, R. Maruyama, S. Shiozaki, K. Yamamoto, S. I. Kato, Y. Nakamura and S. Tobita, Anal. Chem., 2020, 92, 4996–5003 CrossRef CAS PubMed.
- M. Collot, S. Bou, T. K. Fam, L. Richert, Y. Mely, L. Danglot and A. S. Klymchenko, Anal. Chem., 2019, 91, 1928–1935 CrossRef CAS PubMed.
- A. H. Ashoka, P. Ashokkumar, Y. P. Kovtun and A. S. Klymchenko, J. Phys. Chem. Lett., 2019, 10, 2414–2421 CrossRef CAS PubMed.
- H. Yu, G. Li, B. Zhang, X. Zhang, Y. Xiao, J. Wang and Y. Song, Dyes Pigm., 2016, 133, 93–99 CrossRef CAS.
- Z. Wang, C. Gui, E. Zhao, J. Wang, X. Li, A. Qin, Z. Zhao, Z. Yu and B. Z. Tang, ACS Appl. Mater. Interfaces, 2016, 8, 10193–10200 CrossRef CAS PubMed.
- B. Sk, P. K. Thakre, R. S. Tomar and A. Patra, Chem. – Asian J., 2017, 12, 2501–2509 CrossRef CAS PubMed.
- C. Xu, H. Zou, Z. Zhao, P. Zhang, R. T. K. Kwok, J. W. Y. Lam, H. H. Y. Sung, I. D. Williams and B. Z. Tang, Adv. Funct. Mater., 2019, 29, 1903278 CrossRef.
- G. K. Voeltz, M. M. Rolls and T. A. Rapoport, EMBO Rep., 2002, 3, 944–950 CrossRef CAS PubMed.
- A. R. English, N. Zurek and G. K. Voeltz, Curr. Opin. Cell Biol., 2009, 21, 596–602 CrossRef CAS PubMed.
- S. Varadarajan, E. T. Bampton, J. L. Smalley, K. Tanaka, R. E. Caves, M. Butterworth, J. Wei, M. Pellecchia, J. Mitcheson, T. W. Gant, D. Dinsdale and G. M. Cohen, Cell Death Differ., 2012, 19, 1896–1907 CrossRef CAS PubMed.
- D. Pendin, J. A. McNew and A. Daga, Curr. Opin. Cell Biol., 2011, 23, 435–442 CrossRef CAS PubMed.
- Y. Du, S. Ferro-Novick and P. Novick, J. Cell Sci., 2004, 117, 2871–2878 CrossRef CAS PubMed.
- D. N. Hebert and M. Molinari, Physiol. Rev., 2007, 87, 1377–1408 CrossRef CAS PubMed.
- K. Araki and K. Nagata, Cold Spring Harbor Perspect. Biol., 2012, 4, a015438 Search PubMed.
- M. E. Paquet, M. R. Leach and D. B. Williams, Methods, 2005, 35, 338–347 CrossRef CAS PubMed.
- H. Lee, Z. Yang, Y. Wi, T. W. Kim, P. Verwilst, Y. H. Lee, G. I. Han, C. Kang and J. S. Kim, Bioconjugate Chem., 2015, 26, 2474–2480 CrossRef CAS PubMed.
- Y. He, J. Shin, W. Gong, P. Das, J. Qu, Z. Yang, W. Liu, C. Kang, J. Qu and J. S. Kim, Chem. Commun., 2019, 55, 2453–2456 RSC.
- C. S. Wijesooriya, M. Nieszala, A. Stafford, J. R. Zimmerman and E. A. Smith, Photochem. Photobiol., 2019, 95, 556–562 CrossRef CAS PubMed.
- L. Hu, S. Hussain, T. Liu, Y. Yue, J. Liu, Y. Tian and X. Tian, New J. Chem., 2018, 42, 14725–14728 RSC.
- W. Song, B. Dong, Y. Lu, X. Kong, A. H. Mehmood and W. Lin, New J. Chem., 2019, 43, 12103–12108 RSC.
- Q. Rao, M. Yang, G. Liu, H. Zhang, H. Xu, J. Wang, Y. Tian, J. Yu, A. Wang and H. Zhou, Dyes Pigm., 2019, 169, 60–65 CrossRef CAS.
- Z. Yang, Y. Wi, Y. M. Yoon, P. Verwilst, J. H. Jang, T. W. Kim, C. Kang and J. S. Kim, Chem. – Asian J., 2016, 11, 527–531 CrossRef CAS PubMed.
- H. R. Kim, R. Kumar, W. Kim, J. H. Lee, M. Suh, A. Sharma, C. H. Kim, C. Kang and J. Seung Kim, Chem. Commun., 2016, 52, 7134–7137 RSC.
- H. Xiao, C. Wu, P. Li and B. Tang, Anal. Chem., 2018, 90, 6081–6088 CrossRef CAS PubMed.
- H. Xiao, C. Wu, P. Li, W. Gao, W. Zhang, W. Zhang, L. Tong and B. Tang, Chem. Sci., 2017, 8, 7025–7030 RSC.
- G. U. Reddy, A. H. A. F. Ali, N. Taye, S. Chattopadhyay and A. Das, Org. Lett., 2015, 17, 5532–5535 CrossRef PubMed.
- H. Xiao, R. Zhang, C. Wu, P. Li, W. Zhang and B. Tang, Sens. Actuators, B, 2018, 273, 1754–1761 CrossRef CAS.
- B. Dong, W. Song, Y. Lu, X. Kong, A. H. Mehmood and W. Lin, Chem. Commun., 2019, 55, 10776–10779 RSC.
- S. Xu, H. W. Liu, X. X. Hu, S. Y. Huan, J. Zhang, Y. C. Liu, L. Yuan, F. L. Qu, X. B. Zhang and W. Tan, Anal. Chem., 2017, 89, 7641–7648 CrossRef CAS PubMed.
- A. Xu, Y. Tang and W. Lin, Spectrochim. Acta, Part A, 2018, 204, 770–776 CrossRef CAS PubMed.
- A. Rivinoja, F. M. Pujol, A. Hassinen and S. Kellokumpu, Ann. Med., 2012, 44, 542–55495 CrossRef CAS PubMed.
- M. Prabaharan, J. J. Grailer, S. Pilla, D. A. Steeber and S. Gong, Biomaterials, 2009, 30, 5757–5766 CrossRef CAS PubMed.
- H. Palokangas, M. Ying and J. Saraste, et al. , Mol. Biol. Cell, 1998, 9, 3561–3578 CrossRef CAS PubMed.
- B. Campbell, G. Rowe, K. Leiper and J. Rhodes, Glycobiology, 2001, 11, 385–393 CrossRef CAS PubMed.
- M. Schindler, S. Grabski, E. Hoff and S. M. Simon, Biochemistry, 1996, 35, 2811–2817 CrossRef CAS PubMed.
- A. Rivinoja, F. M. Pujol, A. Hassinen and S. Kellokumpu, Ann. Med., 2012, 44, 542–554 CrossRef CAS PubMed.
- J. W. Choi, S. T. Hong, M. S. Kim, K. C. Paik, M. S. Han and B. R. Cho, Anal. Chem., 2019, 91, 6669–6674 CrossRef CAS PubMed.
- P. Li, X. Guo, X. Bai, X. Wang, Q. Ding, W. Zhang, W. Zhang and B. Tang, Anal. Chem., 2019, 91, 3382–3388 CrossRef CAS PubMed.
- F. Xue, Y. Wen, P. Wei, Y. Gao, Z. Zhou, S. Xiao and T. Yi, Chem. Commun., 2017, 53, 6424–6427 RSC.
- L. Fan, X. Wang, J. Ge, F. Li, C. Zhang, B. Lin, S. Shuang and C. Dong, Chem. Commun., 2019, 55, 6685–6688 RSC.
- F. M. Boisvert, S. van Koningsbruggen, J. Navascues and A. I. Lamond, Nat. Rev. Mol. Cell Biol., 2007, 8, 574–589 CrossRef CAS PubMed.
- M. Carmo-Fonseca, L. Mendes-Soares and I. Campos, Nat. Cell Biol., 2000, 2, E107 CrossRef CAS PubMed.
- S. Boulon, B. J. Westman, S. Hutten, F. M. Boisvert and A. I. Lamond, Mol. Cell, 2010, 40, 216–222 CrossRef CAS PubMed.
- A. H. Fischer, S. Bardarov and Z. Jiang, J. Cell. Biochem., 2004, 91, 170–175 CrossRef CAS PubMed.
- M. M. Yusupov, G. Z. Yusupova, A. Baucom, K. Lieberman, T. N. Earnest, J. H. D. Cate and H. F. Noller, Science, 2001, 292, 883–891 CrossRef CAS PubMed.
- M. O. J. Olson, K. Hingorani and A. Szebeni, Int. Rev. Cytol., 2002, 219, 199–204 CrossRef CAS PubMed.
- M. Carmo-Fonseca, L. Mendes-Soares and I. Campos, Nat. Cell Biol., 2000, 2, E107 CrossRef CAS PubMed.
- Y. W. Lam, L. Trinkle-Mulcahy and A. I. Lamond, J. Cell Sci., 2005, 118, 1335–1337 CrossRef CAS PubMed.
- Y. S. Mao, B. Zhang and D. L. Spector, Trends Genet., 2011, 27, 295–304 CrossRef CAS PubMed.
- G. Ferri, L. Nucara, T. Biver, A. Battisti, G. Signore and R. Bizzarri, Biophys. Chem., 2016, 208, 17–25 CrossRef CAS PubMed.
- W. Sun, J. X. Cui, L. L. Ma, Z. L. Lu, B. Gong, L. He and R. Wang, Analyst, 2018, 143, 5799–5804 RSC.
- D. Li, X. Tian, A. Wang, L. Guan, J. Zheng, F. Li, S. Li, H. Zhou, J. Wu and Y. Tian, Chem. Sci., 2016, 7, 2257–2263 RSC.
- J. Liu, S. Zhang, C. Zhang, J. Dong, C. Shen, J. Zhu, H. Xu, M. Fu, G. Yang and X. Zhang, Chem. Commun., 2017, 53, 11476–11479 RSC.
- J. Liu, S. Li, S. Zhang, C. Shen, J. Zhu, G. Yang and X. Zhang, Sens. Actuators, B, 2018, 261, 531–536 CrossRef CAS.
- Y. Chen, X.-R. Wei, R. Sun, Y.-J. Xu and J.-J. Ge, Anal. Methods, 2019, 11, 3523–3531 RSC.
- C. Y. Y. Yu, W. Zhang, R. T. K. Kwok, C. W. T. Leung, J. W. Y. Lam and B. Z. Tang, J. Mater. Chem. B, 2016, 4, 2614–2619 RSC.
- W. Osterode, C. Holler and F. Ulberth, Diabetic Med., 1996, 13, 1044–1050 CrossRef CAS PubMed.
- A. M. Aleardi, G. Benard, O. Augereau, M. Malgat, J. C. Talbot, J. P. Mazat, T. Letellier, J. Dachary-Prigent, G. C. Solaini and R. Rossignol, J. Bioenergy Biomembr., 2005, 37, 207–225 CrossRef CAS PubMed.
- O. Hurnak and J. Zachar, Gen. Physiol. Biophys., 1995, 14, 359–366 CAS.
- N. Gupta, S. I. Reja, V. Bhalla, M. Gupta, G. Kaur and M. Kumar, J. Mater. Chem. B, 2016, 4, 1968–1977 RSC.
- S. L. Raut, J. D. Kimball, R. Fudala, I. Bora, R. Chib, H. Jaafari, M. K. Castillo, N. W. Smith, I. Gryczynski, S. V. Dzyuba and Z. Gryczynski, Phys. Chem. Chem. Phys., 2016, 18, 4535–4540 RSC.
- L. E. Shimolina, M. A. Izquierdo, I. Lopez-Duarte, J. A. Bull, M. V. Shirmanova, L. G. Klapshina, E. V. Zagaynova and M. K. Kuimova, Sci. Rep., 2017, 7, 41097–41106 CrossRef CAS PubMed.
- A. Vysniauskas, I. Lopez-Duarte, N. Duchemin, T. T. Vu, Y. Wu, E. M. Budynina, Y. A. Volkova, E. Pena Cabrera, D. E. Ramirez-Ornelas and M. K. Kuimova, Phys. Chem. Chem. Phys., 2017, 19, 25252–25259 RSC.
- K. Dou, W. Huang, Y. Xiang, S. Li and Z. Liu, Anal. Chem., 2020, 92, 4177–4181 CrossRef CAS PubMed.
- P. Ning, P. Dong, Q. Geng, L. Bai, Y. Ding, X. Tian, R. Shao, L. Li and X. Meng, J. Mater. Chem. B, 2017, 5, 2743–2749 RSC.
- S. Gao, Y. Ma and W. Lin, Anal. Methods, 2019, 11, 2626–2629 RSC.
- M. Peng, J. Yin and W. Lin, Spectrochim. Acta, Part A, 2020, 224, 117310 CrossRef CAS PubMed.
- S. Zhu, X. Yu, Y. He, M. Ma and W. Lu, Dyes Pigm., 2020, 178, 108353 CrossRef CAS.
- M. Fu, W. Shen, Y. Chen, W. Yi, C. Cai, L. Zhu and Q. Zhu, J. Mater. Chem. B, 2020, 8, 1310–1315 RSC.
- G. Zhang, Y. Ni, D. Zhang, H. Li, N. Wang, C. Yu, L. Li and W. Huang, Spectrochim. Acta, Part A, 2019, 214, 339–347 CrossRef CAS PubMed.
- W. Zhang, K. Xu, L. Yue, Z. Shao, Y. Feng and M. Fang, Dyes Pigm., 2017, 137, 560–568 CrossRef CAS.
- H. Li, W. Shi, X. Li, Y. Hu, Y. Fang and H. Ma, J. Am. Chem. Soc., 2019, 141, 18301–18307 CrossRef CAS PubMed.
- Y. Zhou, Y.-Z. Chen, J.-H. Cao, Q.-Z. Yang, L.-Z. Wu, C.-H. Tung and D.-Y. Wu, Dyes Pigm., 2015, 112, 162–169 CrossRef CAS.
- M. C. Gonzalez-Garcia, T. Peña-Ruiz, P. Herrero-Foncubierta, D. Miguel, M. D. Giron, R. Salto, J. M. Cuerva, A. Navarro, E. Garcia-Fernandez and A. Orte, Sens. Actuators, B, 2020, 309, 127770 CrossRef CAS.
- X. Li, Y. Yue, Y. Wen, C. Yin and F. Huo, Dyes Pigm., 2016, 134, 291–296 CrossRef CAS.
- M. Liu, Y. Lv, X. Jie, Z. Meng, X. Wang, J. Huang, A. Peng and Z. Tian, Sens. Actuators, B, 2018, 273, 167–175 CrossRef CAS.
- W. Song, B. Dong, Y. Lu and W. Lin, Tetrahedron Lett., 2019, 60, 1696–1701 CrossRef CAS.
- J. Zhang, M. Yang, W. Mazi, K. Adhikari, M. Fang, F. Xie, L. Valenzano, A. Tiwari, F. T. Luo and H. Liu, ACS Sens., 2016, 1, 158–165 CrossRef CAS PubMed.
- H. Chen, W. Lin, W. Jiang, B. Dong, H. Cui and Y. Tang, Chem. Commun., 2015, 51, 6968–6971 RSC.
- Y. Ge, A. Liu, J. Dong, G. Duan, X. Cao and F. Li, Sens. Actuators, B, 2017, 247, 46–52 CrossRef CAS.
- J. Chao, Y. Liu, J. Sun, L. Fan, Y. Zhang, H. Tong and Z. Li, Sens. Actuators, B, 2015, 221, 427–433 CrossRef CAS.
- X. Zhang, S.-Y. Jing, S.-Y. Huang, X.-W. Zhou, J.-M. Bai and B.-X. Zhao, Sens. Actuators, B, 2015, 206, 663–670 CrossRef CAS.
- W. Niu, Z. Wei, J. Jia, S. Shuang, C. Dong and K. Yun, Dyes Pigm., 2018, 152, 155–160 CrossRef CAS.
- W. Niu, L. Fan, M. Nan, Z. Li, D. Lu, M. S. Wong, S. Shuang and C. Dong, Anal. Chem., 2015, 87, 2788–2793 CrossRef CAS PubMed.
- Y. Li, Y. Wang, S. Yang, Y. Zhao, L. Yuan, J. Zheng and R. Yang, Anal. Chem., 2015, 87, 2495–2503 CrossRef CAS PubMed.
- J. Zhu, Q. Gao, Q. Tong and G. Wu, Spectrochim. Acta, Part A, 2020, 225, 117506 CrossRef CAS PubMed.
- Z. He, Y. Chou, H. Zhou, H. Zhang, T. Cheng and G. Liu, Org. Biomol. Chem., 2018, 16, 3266–3272 RSC.
- M. Tian, C. Liu, B. Dong, Y. Zuo and W. Lin, Chem. Commun., 2019, 55, 10440–10443 RSC.
- A. Xu, Y. Tang, Y. Ma, G. Xu, S. Gao, Y. Zhao and W. Lin, Sens. Actuators, B, 2017, 252, 927–933 CrossRef CAS.
- L. Zhou, L. Gong and S. Hu, Spectrochim. Acta, Part A, 2018, 199, 254–259 CrossRef CAS PubMed.
- G. Xu, Y. Tang, Y. Ma, A. Xu and W. Lin, Spectrochim. Acta, Part A, 2018, 188, 197–201 CrossRef CAS PubMed.
- J. Zhang, H. W. Liu, X. X. Hu, J. Li, L. H. Liang, X. B. Zhang and W. Tan, Anal. Chem., 2015, 87, 11832–11839 CrossRef CAS PubMed.
- S. Wang, H. Liu, J. Mack, J. Tian, B. Zou, H. Lu, Z. Li, J. Jiang and Z. Shen, Chem. Commun., 2015, 51, 13389–13392 RSC.
- Z. R. Liu, Y. Tang, A. Xu and W. Lin, Biosens. Bioelectron., 2017, 89, 853–858 CrossRef CAS PubMed.
- Y. Zhou, K. N. Bobba, X. W. Lv, D. Yang, N. Velusamy, J. F. Zhang and S. Bhuniya, Analyst, 2017, 142, 345–350 RSC.
- Y. Liu, W. Liu, H. Li, W. Yan, X. Yang, D. Liu, S. Wang and J. Zhang, Anal. Chim. Acta, 2018, 1024, 177–186 CrossRef CAS PubMed.
- J. Zheng, Y. Shen, Z. Xu, Z. Yuan, Y. He, C. Wei, M. Er, J. Yin and H. Chen, Biosens. Bioelectron., 2018, 119, 141–148 CrossRef CAS PubMed.
- L. Xia, F. Hu, J. Huang, N. Li, Y. Gu and P. Wang, Sens. Actuators, B, 2018, 268, 70–76 CrossRef CAS.
- J. Sun, Z. Hu, R. Wang, S. Zhang and X. Zhang, Anal. Chem., 2019, 91, 1384–1390 CrossRef CAS PubMed.
- L. Zhang, X. Shan, L. Guo, J. Zhang, J. Ge, Q. Jiang and X. Ning, Analyst, 2019, 144, 284–289 RSC.
- K. H. Gebremedhin, Y. Li, Q. Yao, M. Xiao, F. Gao, J. Fan, J. Du, S. Long and X. Peng, J. Mater. Chem. B, 2019, 7, 408–414 RSC.
- Y. Wang, X. Han, X. Zhang, L. Zhang and L. Chen, Analyst, 2020, 145, 1389–1395 RSC.
- Z. Zhang, T. Lv, B. Tao, Z. Wen, Y. Xu, H. Li, F. Liu and S. Sun, Bioorg. Med. Chem., 2020, 28, 115280 CrossRef PubMed.
- J. L. Klockow, K. S. Hettie, E. L. LaGory, E. J. Moon, A. J. Giaccia, E. E. Graves and F. T. Chin, Sens. Actuators, B, 2020, 306, 127446 CrossRef CAS PubMed.
- D. Yang, H. Y. Tian, T. N. Zang, M. Li, Y. Zhou and J. F. Zhang, Sci. Rep., 2017, 7, 9174–9181 CrossRef PubMed.
- J. Xu, S. Sun, Q. Li, Y. Yue, Y. Li and S. Shao, Analyst, 2015, 140, 574–581 RSC.
- A. G. Vorobyeva, M. Stanton, A. Godinat, K. B. Lund, G. G. Karateev, K. P. Francis, E. Allen, J. G. Gelovani, E. McCormack, M. Tangney and E. A. Dubikovskaya, PLoS One, 2015, 10, e0131037 CrossRef PubMed.
- W. Feng, Y. Wang, S. Chen, C. Wang, S. Wang, S. Li, H. Li, G. Zhou and J. Zhang, Dyes Pigm., 2016, 131, 145–153 CrossRef CAS.
- Y. Gao, Y. Lin, T. Liu, H. Chen, X. Yang, C. Tian, L. Du and M. Li, Anal. Chem., 2017, 89, 12488–12493 CrossRef CAS PubMed.
- Y. Ti, L. Yu, Y. Tang, T. Jin, M. Yang, R. Wang, Y. Xu and W. Zhu, Sens. Actuators, B, 2018, 265, 582–590 CrossRef CAS.
- Y. Tian, Y. Li, W. X. Wang, W. L. Jiang, J. Fei and C. Y. Li, Anal. Chem., 2020, 92, 4244–4250 CrossRef CAS PubMed.
- X. Tian, Z. Li, Y. Sun, P. Wang and H. Ma, Anal. Chem., 2018, 90, 13759–13766 CrossRef CAS PubMed.
- K. N. More, T.-H. Lim, S.-Y. Kim, J. Kang, K.-S. Inn and D.-J. Chang, Dyes Pigm., 2018, 151, 245–253 CrossRef CAS.
- P. Feng, H. Zhang, Q. Deng, W. Liu, L. Yang, G. Li, G. Chen, L. Du, B. Ke and M. Li, Anal. Chem., 2016, 88, 5610–5614 CrossRef CAS PubMed.
- S. Luo, R. Zou, J. Wu and M. P. Landry, ACS Sens., 2017, 2, 1139–1145 CrossRef CAS PubMed.
- Y. Fang, W. Shi, Y. Hu, X. Li and H. Ma, Chem. Commun., 2018, 54, 5454–5457 RSC.
- H. Liang, Q. Bi, A. Hu, X. Chen, R. Jin, X. Song, B. Ke, M. Barz and Y. Nie, Chem. Commun., 2020, 56, 6949–6952 RSC.
- D. Lingwood and K. Simons, Science, 2010, 327, 46–50 CrossRef CAS PubMed.
- E. Sezgin, I. Levental and C. Eggeling, Nat. Rev. Mol. Cell Biol., 2017, 18, 361–374 CrossRef CAS PubMed.
- J. T. Mika, A. J. Thompson, M. R. Dent, N. J. Brooks, J. Michiels, J. Hofkens and M. K. Kuimova, Biophys. J., 2016, 111, 1528–1540 CrossRef CAS PubMed.
- V. Chmyrov, T. Spielmann, H. Hevekerl and J. Widengren, Anal. Chem., 2015, 87, 5690–5697 CrossRef CAS PubMed.
- I. Lopez-Duarte, P. Chairatana, Y. Wu, J. Perez-Moreno, P. M. Bennett, J. E. Reeve, I. Boczarow, W. Kaluza, N. A. Hosny, S. D. Stranks, R. J. Nicholas, K. Clays, M. K. Kuimova and H. L. Anderson, Org. Biomol. Chem., 2015, 13, 3792–3802 RSC.
- E. Sezgin, F. Schneider, V. Zilles, I. Urbancic, E. Garcia, D. Waithe, A. S. Klymchenko and C. Eggeling, Biophys. J., 2017, 113, 1321–1330 CrossRef CAS PubMed.
| This journal is © The Royal Society of Chemistry 2021 |


