Ji-Xuan Fu,
Wei-Ting Wong and
Wei-Ren Liu*
Department of Chemical Engineering, Chung Yuan Christian University, Taiwan. E-mail: WRLiu1203@gmail.com
First published on 27th August 2015
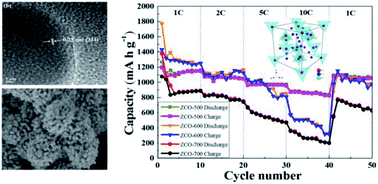
In this study, nano-porous ZnCo2O4 anodes are synthesized via a hydrothermal method with subsequent annealing at different temperatures. X-ray diffraction (XRD), Brunauer–Emmett–Teller (BET) analysis, scanning electron microscopy (SEM), and transmission electron microscopy (TEM) are carried out to study the crystal structure, pore size distribution, surface morphology and characteristics, respectively. With increasing sintering temperature, the morphology of ZnCo2O4 turns to sphere-like with a porous structure. The as-prepared porous ZnCo2O4 nanospheres synthesized at the optimal condition of 600 °C (ZCO-600) demonstrate a high capacity of 1800 mA h g−1 and a good retention performance of 1242 mA h g−1 after 30 cycles. The AC data shows that the ZCO-600 anode gives a lower impedance compared to ZCO at other temperatures. The porous nanostructure and large surface area are responsible for the superior performance. Moreover, nano-porous ZCO synthesized at 500 °C gave a better cycle performance and much higher rate capability compared to the samples synthesized at temperatures of 600 °C and 700 °C, because of its superior structural properties.
Considering anode materials, graphite is the primary one used in the market. However, the theoretical capacity of a commercial graphite anode is only 372 mA h g−1, which cannot meet our demand for high energy capacity in the future.6 Therefore, it is necessary to look for better materials to replace graphite. In recent research, 3D transition metal oxides with nanostructures and porous characteristics have been found to be good at improving the cycle performance and coulombic efficiency with high capacity.7–10
In previous reports, transition metal oxides such as NiO,11 Fe2O3 (ref. 12) and Co3O4 (ref. 13) have shown excellent electrochemical performance. Among all of them, Co3O4 exhibits the best anodic performance with high theoretical capacity as high as ∼900 mA h g−1.1,14–21 However, cobalt is toxic and expensive thus it is unfriendly to our environment and the commercial costs are too high to bear. In order to solve the above disadvantages, cobalt is being partially replaced in Co3O4 with eco-friendly and cheaper alternative metals such as Ni,10 Zn,22 Mg,23 Fe23 and Mn,24,25 which are also electrochemically active for Li insertion and extraction. Spinel anode materials have been reported with NiCo2O4,27,28 ZnCo2O4,29–34 MgCo2O4,23 FeCo2O4,23 MnCo2O4/CoMn2O4,24,35 and CuCo2O4.26,36 Among all of them, ZnCo2O4 has strong potential as an electrode material for lithium storage and could provide the highest capacity because both Zn and Co are more electrochemically active with respect lithium than other alternative metals.37 Therefore, ZnCo2O4 is considered as the most attractive material to substitute for a graphite anode in a Li-ion battery due to its perfect electrochemical properties such as high reversible capacity, excellent cycle performance and good environmental friendliness.34
So far, ZnCo2O4 nanomaterials with different shapes have been widely studied, such as nanoparticles,29 nanoflakes,38 nanotubes,37 nanowires39 and nanorods,40 all prepared using different methods and all exhibited excellent electrochemical performances. However, little literature focuses on the effect of the synthetic temperature on the structural change and electrochemical performance.
Thus, in this study, we attempt to systematically synthesize ZCO with different annealing temperatures from 500 °C to 700 °C. Characterization techniques, including different electrochemical analyses and BET measurements were used to establish the relationship between the structure and electrochemical properties. The results could provide important information for material design of ZCO as a potential anode for Li-ion batteries in the future.
Fig. 2 shows the TGA and DTG results of the thermal properties of the precursor. There are two obvious weight losses during the heating process. The first one that occurred below 200 °C was attributed to the loss of free water or other organic molecules, while the second one was due to the thermal decomposition of the precursors into ZnCo2O4 by releasing CO2, corresponding to sharp exothermic peaks located at 188.3 °C and 242.7 °C in the DTG curve. The large total weight loss of 54.7%, and no weight loss or exothermic peaks found over 300 °C, indicated that the precursor was transformed to ZnCo2O4 completely. Therefore, to ensure that the ZnCo2O4 obtained after annealing was pure phase, a temperature above 500 °C was chosen as the annealing temperature for the synthesis of ZnCo2O4.
Fig. 3 shows the SEM images of ZnCo2O4 synthesized at different annealing temperatures of 500 °C, 600 °C and 700 °C. It can be seen from Fig. 3(a) that the structure consists of ZnCo2O4 nanoparticles with diameters of 20–30 nm, but the shape of the structure is hardly confirmed at the lower synthetic temperature of 500 °C. With increasing the annealing temperature to 600 °C, shown in Fig. 3(b), the nanoparticles assemble into sphere-like structures. For the higher temperature of 700 °C, it can be seen that the sphere-like structures become rough and larger because of the fusion between the nanoparticles. In the high-magnification images in Fig. 3(d)–(f), all of the structures have a porous nature, especially at 600 °C. Obviously, for the higher temperature of 700 °C, the phenomenon of sintering occurs and most of these pores disappear. The porosity of ZCO, indeed, could be controlled by tuning the annealing temperature. The electrochemical properties, such as the capacity, cycling stability as well as rate performance will be different. Nano-sized particles with high porosity could be good for enhancing Li-ion intercalation and diffusion into the spinel lattice. It also becomes much easier for the electrolyte to penetrate into the active material, thus enhancing contact areas between the electrolyte and ZnCo2O4 and shortening the Li-ion diffusion distance in the structure. Fig. 4(a) shows the ZnCo2O4 synthesized at 600 °C, the diameters of the ZnCo2O4 particles are about 20–30 nm, which match well with the SEM observation. The HRTEM image of ZCO shown in Fig. 4(b) reveals a lattice fringe with an interplanar spacing of 0.25 nm, corresponding to the (311) plane of the spinel ZnCo2O4 phase. From the result of the SAED shown in Fig. 4(c), the d values of 0.286 nm, 0.244 nm and 0.202 nm correspond well to the Miller indices of (220), (311) and (400) for a ZnCo2O4 crystal. The EDS information of ZnCo2O4 is shown in Fig. 5(a). The elements Zn, Co and O can only be seen in the nanostructure, indicating the formation of pure phase ZnCo2O4. Fig. 5(b) also shows the EDS mapping results, the elements Zn, Co and O are evenly distributed all over the structure.
![]() | ||
Fig. 3 SEM images of ZnCo2O4 synthesized at different annealing temperatures: low magnification of (a) 500 °C, (b) 600 °C and (c) 700 °C; high magnification of (d) 500 °C, (e) 600 °C and (f) 700 °C. |
The specific surface areas and pore size distribution of ZnCo2O4 nanospheres synthesized at different annealing temperatures were characterized using BET analysis using nitrogen adsorption–desorption, as shown in Fig. 6. It can be seen that the specific surface areas of ZnCo2O4 synthesized at 500 °C and ZnCo2O4 synthesized at 600 °C are about 11.67 m2 g−1 and 12.48 m2 g−1, respectively. The specific surface area of ZCO-600 was similar to that of ZCO-500. As for ZCO-700 shown in Fig. 6(c), its specific surface area is only 7.81 m2 g−1. The decrease of surface area from 500–600 °C to 700 °C might be due to the fusion between the ZnCo2O4 nanoparticles at the higher annealing temperature. All these ZCO samples showed a narrow pore size distribution below 10 nm because nano-sized ZnCo2O4 particles were formed in the pores. The enhanced surface area of ZCO-500 and ZCO-600 could be attributed to the smaller diameters and larger quantities of nanoparticles and nanopores.
![]() | ||
Fig. 6 N2 adsorption–desorption isotherms and BJH pore size distributions of ZnCo2O4 synthesized at (a) 500 °C, (b) 600 °C and (c) 700 °C. |
According to the previous study, the entire electrochemical process can be explained as follows:
ZnCo2O4 + 8Li+ + 8e− → Zn + 2Co + 4Li2O | (1) |
Zn + Li+ + e− ↔ LiZn | (2) |
Zn + Li2O ↔ ZnO + 2Li+ + 2e− | (3) |
2Co + 2Li2O ↔ 2CoO + 4Li+ + 4e− | (4) |
2CoO + 2/3Li2O ↔ 2/3Co3O4 + 4/3Li+ + 4/3e− | (5) |
With the above electrochemical processes, the cyclic voltammetry test (CV) and charge/discharge test can be discussed clearly below.
Fig. 7(a) shows the cyclic voltammograms of ZCO-600 in the first three cycles. The reduction peak in the first cycle shows an intense irreversible reaction at ∼0.15 V, which might be due to the decomposition of ZnCo2O4 to Zn0 and Co0 according to eqn (1) with the formation of a solid electrolyte interphase (SEI). In comparison, the discharge of the second and third cycle show peaks at ∼0.4 V and ∼0.7 V, which are indicative of different electrochemical reactions occurring during the two processes. However, in the first three cycles, two oxidation peaks at ∼1.9 V and 2.3 V in the anodic polarization can be observed in all cycles, and the peaks can be attributed to the oxidation of Zn0 to Zn2+ and Co0 to Co3+ (eqn (3)–(5)), respectively. To compare the charge/discharge degree of the Li-ion in ZnCo2O4 at different annealing temperatures, the CV curves of these samples in the third cycle were tested and shown in Fig. 7(b). It can be observed that the positions of the redox peaks for ZCO-500 and ZCO-600 were quite close, which demonstrate a similar phenomenon for Li-ion diffusion in these porous structures and a similar specific surface area shown in the BET data. The potential of the reduction reactions of ZCO-600 and ZCO-500 occurs at ∼1.2 V vs. Li/Li+. However, for the ZCO-700 sample, an obvious polarization phenomenon was observed in the CV tests. First, the currents of reduction and oxidation for ZCO-700 were lower than those of ZCO-500 and ZCO-600. Second, the onset potential for reduction decreased to 0.9 V vs. Li/Li+. The difference of electrochemical properties might be due to a diffusion issue. From the viewpoint of diffusion, the nano-size and porous nature of the ZCO-500 and ZCO-600 samples provide a short diffusion path for Li ions into the materials. For ZCO-700, however, the lower specific surface area and pore volume might result from a problem with the charge and discharge processes.
![]() | ||
Fig. 7 (a) The first three cycles of the CVs for ZnCo2O4 synthesized at 600 °C and (b) CV curves of ZnCo2O4 synthesized at 500 °C, 600 °C and 700 °C in the 3rd cycle. |
Fig. 8 shows charge/discharge curves of ZnCo2O4 synthesized at 600 °C at a current density of 0.1C in the voltage range of 0.01–3.5 V in the first three cycles. It can clearly be seen that there is a plateau at ∼0.9 V in the first charging process. For the second and third cycle, the plateau shifts to ∼1.2 V and becomes steeper, which is consistent with the CV results shown in Fig. 7(a). The initial charge and discharge capacities are 1800 and 1452 mA h g−1, respectively. The coulombic efficiency in the first cycle is as high as 80.6%. The irreversible capacity loss in the first cycle is ∼19.4%, which is associated with the formation of an SEI film. In addition, the coulombic efficiency of the second cycle and third cycle is enhanced to as high as 98.9% and 98.8%, and the charge/discharge curves almost overlap, indicating the high reversibility of the electrochemical properties of ZCO-600 and that the result is well-matched with the CV results shown before.
Fig. 9(a) shows the cycle performance of ZnCo2O4 synthesized at 500 °C, 600 °C and 700 °C at a current density of 0.1C. It can be observed that the initial charge/discharge capacity of ZCO-600 is the highest one compared to ZCO-700 and ZCO-500. The change in capacity indicated that the capacities of ZnCo2O4 synthesized at 600 °C and 700 °C started to decline after 12 cycles, but the capacity of ZnCo2O4 synthesized at 500 °C not only did not decline but also increased, exhibiting the more perfect cycle performance. After 30 cycles, the reversible capacities of ZnCo2O4 synthesized at 500 °C, 600 °C and 700 °C are 1075, 1242 and 713 mA h g−1, respectively. Among these samples, both ZCO-500 and ZCO-600 still retained the higher capacity and good retention, which might be attributed to the porous nanosphere structure. From the BET results shown in Fig. 6, the more complete structure and higher surface area of ZCO-500 and ZCO-600 provide Li ions with a shorter diffusion distance and enhance the contact areas between the electrolyte and ZnCo2O4, exhibiting better capacity and retention ability than at other annealing temperatures. The coulombic efficiency of ZCO-500, ZCO-600 and ZCO-700 in the first 30 cycles, shown in Fig. 9(a), shows close to 100% efficiency for these samples, which indicates their good cyclability. For larger current tests, Fig. 9(b) demonstrates 100 cycle tests at 1C for these three samples. Obviously, ZCO-500 gave a superior cycling performance compared to those of the other samples. The reversible capacity of ZCO-500 could be maintained to ∼500 mA h g−1 which is ∼1.34 times than that of a graphite anode.
The rate performance of ZCO at different annealing temperatures was also investigated. As shown in Fig. 9(c), the average discharge capacity of ZCO-600 decreases from ∼1250, ∼1100, ∼950 and ∼1000 mA h g−1 with increasing current from 1C, 2C, 5C, and 10C. In the subsequent cycle, the capacity rebounded to ∼1100 mA h g−1 with the current back to 1C. ZCO-500, however, demonstrates a much higher capacity than ZCO-600 and ZCO-700. Under 10C, the capacity of ZCO-500 was as high as ∼900 mA h g−1. The results demonstrate again that the nanostructure plays a very important role in both the cycle stability and rate capability.
The AC impedance results of ZCO synthesized at 500 °C, 600 °C and 700 °C after charging in the third cycle is shown in Fig. 10. The diameters of the semicircles for ZCO-500, ZCO-600 and ZCO-700 are 320 Ω, 160 Ω and 725 Ω, respectively. The ZCO-600 sample exhibited the lowest impedance. In order to understand the major contribution of impedance in these three samples, we used a typical equivalent circuit (shown in the inset in Fig. 10). Herein, R1, RSEI and RCT are the impedances resulting from the electrolyte, SEI film and charge transfer of ZCO, respectively. Some of the corresponding fitting data are displayed in Table 1. First of all, the R1 values for these three samples are almost the same, which is due to the similar impedance of the interface between the electrode and electrolyte. For the contribution of the SEI film, as shown in Table 1, the RSEI values were also very close because the surface chemistry of ZCO synthesized at different annealing temperatures was similar. Significantly, the dramatic difference in impedance was the charge transfer resistance. The RCT values of ZCO-500, ZCO-600 and ZCO-700 were 243, 84.5 and 602, respectively, thanks to the nano-porous nature, which facilities both the reaction kinetics and the diffusion of Li ions.
ZnCo2O4 | R1 | RSEI | RCT |
---|---|---|---|
500 °C | 2.801 | 66 | 243 |
600 °C | 2.236 | 62 | 84.5 |
700 °C | 2.738 | 64 | 602 |
Based on the above results, ZnCo2O4 synthesized at 600 °C could provide the best electrochemical properties. To exhibit the superiority of the ZnCo2O4 anode materials in this study, Table 2 shows the synthesis methods, electrochemical properties and annealing temperatures from previous research. Compared with this study, it can clearly observed that the 1st cycle discharge capacity and the 30th cycle charge capacity are all superior to related references, demonstrating the excellent electrochemical properties.
Synthesis method | Morphology | 1st cycle discharge capacity (mA h g−1) | 30th cycle charge capacity (mA h g−1) | Annealing temperature | Reference |
---|---|---|---|---|---|
Hydrothermal method | Nanospheres | 1800 | 1242 | 600 °C | This study |
Hydrothermal method | Parallel columns | 1332 | ∼900 | 400 °C | 30 |
Hydrothermal method | Microspheres | 1087 | ∼810 | 700 °C | 33 |
Co-precipitation | Nanowires | 1331 | ∼1100 | 500 °C | 39 |
Hydrothermal method | Nanorods | 1509 | ∼850 | N/A | 40 |
Hydrothermal method | Flower-like | 1430 | ∼895 | 400 °C | 41 |
Co-precipitation | Nanoflakes | 1458 | ∼1200 | 500 °C | 42 |
This journal is © The Royal Society of Chemistry 2015 |