
 Open Access Article
 This Open Access Article is licensed under a
 Creative Commons Attribution 3.0 Unported Licence
On the crystal structure thermal evolution of formamidinium lead tribromide, CH(NH2)2PbBr3†
Carmen
Abia
ab,
Carlos Alberto
López
 ac,
María Consuelo
Álvarez-Galván
d,
Laura
Canadillas-Delgado
b,
María Teresa
Fernández-Díaz
b and
José Antonio
Alonso
*a
ac,
María Consuelo
Álvarez-Galván
d,
Laura
Canadillas-Delgado
b,
María Teresa
Fernández-Díaz
b and
José Antonio
Alonso
*a
aInstituto de Ciencia de Materiales de Madrid, CSIC, Cantoblanco, 28049 Madrid, Spain. E-mail: ja.alonso@icmm.csic.es
bInstitut Laue Langevin, F-38042 Grenoble Cedex, France
cINTEQUI (UNSL-CONICET) and Facultad de Química, Bioquímica y Farmacia, UNSL, Almirante Brown 1455, (5700) San Luis, Argentine
dInstituto de Catálisis y Petroleoquímica, CSIC, Cantoblanco, 28049 Madrid, Spain
First published on 12th November 2021
Abstract
Although methylammonium lead triiodide (CH3NH3PbI3) is recognized as the best candidate for photovoltaic applications, unfortunately it undergoes fast degradation when exposed to moisture and mild temperatures. Among hybrid organic–inorganic perovskites, formamidinium lead tribromide (FA: formamidinium, CH(NH2)2+) is an excellent alternative given its long-term stability. Here we present a structural study from synchrotron X-ray and neutron diffraction of an undeuterated FAPbBr3 specimen, carried out to follow its crystallographic behaviour in the 1–298 K temperature range. Two phase transitions are identified; at 256–261 K from the cubic structure observed at RT (Pm![[3 with combining macron]](https://www.rsc.org/images/entities/char_0033_0304.gif) m), to a tetragonal symmetry (P4/mbm), and at 159–160 K to an orthorhombic phase (space group Pnma). Our neutron diffraction data allowed us to unveil the configuration of the organic FA units and their full localization within the mentioned temperature range, thus improving the crystallographic description of this compound. The evolution with temperature of the H-bonds between the organic molecule and the inorganic cage is followed. The UV-Vis diffuse reflectance spectrum shows a band gap of 2.23 eV, making it a suitable material for optoelectronic devices.
m), to a tetragonal symmetry (P4/mbm), and at 159–160 K to an orthorhombic phase (space group Pnma). Our neutron diffraction data allowed us to unveil the configuration of the organic FA units and their full localization within the mentioned temperature range, thus improving the crystallographic description of this compound. The evolution with temperature of the H-bonds between the organic molecule and the inorganic cage is followed. The UV-Vis diffuse reflectance spectrum shows a band gap of 2.23 eV, making it a suitable material for optoelectronic devices.
Introduction
In recent years, hybrid organic–inorganic perovskites have attracted broad interests due to their outstanding properties for solar-cell applications, which have experienced a fast development.1–8 An energy conversion of over 22% and high carrier mobility, along with their low production costs, are the reasons behind the promotion of these promising materials for optoelectronic applications.9 Hybrid perovskites follow the general formula ABX3, where B metals and X halogens constitute BX6 octahedra that establish a three-dimensional framework, forming cages occupied by the organic A cations. Given the wide choice of components, these hybrid perovskite materials present a great chemical flexibility.To date, methylammonium (MA: CH3NH3+) lead triiodide, CH3NH3PbI3 (known as MAPbI3 or MAPI), is the most widely studied hybrid perovskite and the best candidate for photovoltaic applications. It exhibits a convenient bandgap of ∼1.6 eV, allowing a wide absorption range across the entire visible light region.10 Unfortunately, its fast degradation upon UV light exposure at mild temperatures and low tolerance to moisture have been an important drawback for its commercialization.11 To overcome this problem, alternative options in the chemical composition of the perovskites have been proposed.7,12
Alternative organic cations like formamidinium (FA: CH(NH2)2+) have been successfully proposed to replace the MA molecule and to occupy the A position.13 In particular, formamidinium lead halide (FAPbX3) perovskites have recently attracted great attention due to their broad absorption and higher thermal stability compared to MAPbI3.
FAPbBr3 has drawn research interests due to its photoemission properties, having efficient charge transfer and good responsivity.14,15 Its bandgap of 2.18 eV, slightly larger than the archetype, can ideally reach the strict standards after being finely tuned,16 making it a good candidate for optoelectronic applications.
Since the crystallochemistry of perovskites is intimately correlated to their macroscopic phenomenology, it is essential to handle a complete structural landscape concerning the different phase transitions they may experience as a function of temperature. FAPbBr3 has been previously studied and its thermal evolution was described as a series of low-temperature phase transitions evolving from cubic Pmm symmetry at RT to tetragonal P4/mbm at 275–250 K and finally to orthorhombic Pnma at 250–225 K.17,18 Some authors have reported the complexity of the cascade of transitions this perovskite undergoes: moreover, the orientation of the FA units and its position within the unit cell have not yet been addressed.
In this work, FAPbBr3 samples were prepared by the inverse-temperature crystallization method19 and solution chemistry procedures, obtaining single crystals and well-crystallized powder samples, respectively. The phases obtained by these methods allowed us performing an exhaustive structural analysis. Based on what has already been reported in the literature,20 we have corroborated the phase transitions reported before, and revised the structure from 1 K to 298 K using several state-of-the-art characterization techniques. The general crystallographic features were solved with single crystal and high-resolution synchrotron powder X-ray diffraction experiments. However, the crystallographic analysis from X-ray techniques for these hybrid compounds is partial, since H atoms cannot be located; the complete elucidation of the FA organic unit can only be accomplished by performing neutron diffraction experiments. By combining these techniques, it is possible to unveil all the subtle structural changes that may have a relevant impact on the opto-electrical properties. Only a few works utilized neutron diffraction measurements to study the crystallographic structure of this compound: Franz et al.18 used the rigid-body formalism for the formamidinium cation to establish a crystallographic model and compared the effect of deuteration on powder samples; Keshavarz et al.20 reported its complex cascade of sharp transitions. In the present work, we were able to localize the organic FA unit across a wide temperature range by neutron powder diffraction, and performed a deep analysis of the orientation of the FA molecule and its delocalisation, finding results that complement those described by Keshavarz et al.20 Moreover, we are able to achieve a much improved cubic model only by using angles and distance constraints, in contrast with previous rigid body modelling.18 In the orthorhombic phase, difference Fourier maps unveiled a novel configuration for the formamidinium units, unreported in precedent works. Finally, a complete study of the H-bonds interactions between the organic molecule and the inorganic PbBr3 framework is described, playing an important role in the crystal structure as well as in the opto-electrical properties.
Experimental
Synthetic procedures
The crystal growth of FAPbBr3 was carried out by the inverse temperature crystallization method.19 Stoichiometric amounts of FABr (Sigma-Aldrich, >99%) and PbBr2 (Alfa Aesar, 99.9%) reacted in a 1 M solution, using a combination of dimethylformamide (DMF) and gamma-butyrolactone (GBL) as a solvent, obtaining well-crystallized orange single-crystals at 50 °C, suitable for X-ray and neutron diffraction.The FAPbBr3 microcrystalline powder was obtained by introducing in a vial the corresponding stoichiometric amounts of FABr (CH5BrN2 ≥ 98% Sigma Aldrich) and PbBr2 (Johnson Matthey, 99.99% ultra dry). Then, a weight of DMF (N,N dimethylformamide) equal to the sum of both precursors is added dropwise. Afterwards, the reaction between both compounds is carried out by heating at 60 °C and stirring at 100 rpm on a heating and stirring plate. The reaction is left to proceed for 20 h. Finally, the content is dropped on a crystallizer and heated at 100 °C for 30 minutes on a heating plate, resulting in a well-crystallized orange powder.
Materials and methods
Laboratory XRD patterns were collected in a Bruker D5 powder diffractometer, with KαCu (λ = 1.5418 Å) radiation. A single-crystal X-ray diffraction measurement at room temperature (298 K) was done in a Bruker D8 diffractometer with Ag Kα (λ = 0.56086 Å) radiation. The data were integrated and scaled with the program package APEX2. The FAPbBr3 crystal was selected under a microscope, with a size between 0.1–0.5 mm.The thermal evolution of the crystallographic structure was studied by synchrotron X-ray powder diffraction (SXRD) and neutron powder diffraction (NPD). The SXRD patterns were collected with the high-resolution set-up (MAD) in the MSPD beamline at ALBA synchrotron, Barcelona (Spain).21 The powder sample, contained in a 0.3 mm diameter quartz capillary, was measured at 120, 155, 170, 220 K and at room temperature, selecting an incident beam of 38 keV energy, λ = 0.3262 Å.
Neutron powder diffraction (NPD) experiments were performed to complete the study of this hybrid perovskite.22–24 The NPD patterns were collected at the HRPT diffractometer of the SINQ spallation source (PSI, Paul Scherrer Institute, Villigen, Switzerland) with a wavelength of 1.494 Å at 1, 100, 150, 200 and 298 K.
Single-crystal neutron diffraction (SCND) data were collected at the D19 single-crystal monochromatic neutron diffractometer (ILL-Grenoble). A suitable “neutron-sized” crystal with dimensions of 1 × 1 × 1 mm3, approximately, was mounted on a pin, and the measurements were carried out with a neutron wavelength of 1.454696 Å from a Cu (331) monochromator at a take-off angle of 90°. The low-temperature data sets were collected using a Displex cryo-refrigerator device, after cooling at a suitable rate in order to avoid damaging the sample. The cell indexing measurement protocol consisted of several 7° ω-scans with a step of 0.07°. The strong peaks were found with the ILL program PFIND, and indexed with the DIRAX program; the orientation matrix, the unit-cell parameters and the chi, omega and detector offsets were post-refined with the ILL program RAFD19. After that, a sequence of approximately 80° ω-scans at a number of positions of phi and χ were collected to obtain high data completeness. The reflections were integrated using the ILL program RETREAT. The crystal attenuation correction was done with the D19FACE, D19ABS and ABSCAN programs, after manually indexing the crystal faces and checking them with PLATON software.
Both SXRD and NPD data were analysed with the Rietveld method using the FullProf program.25,26 In order to generate the shape of the diffraction peaks of the patterns collected, a pseudo-Voigt function was set. The background was interpolated from areas with no reflections. The parameters simultaneously refined were: scale factor, background coefficients, zero-point error, pseudo-Voigt corrected for asymmetry parameters, positional coordinates, anisotropic displacement factors and occupancy factors. For the neutron refinements, the coherent scattering lengths for Pb, Br, N, C and H were 9.405, 6.795, 9.36, 6.646 and −3.739 fm, respectively. The high contrast of H scattering lengths allowed the full elucidation of the organic FA groups.
Laue diffraction patterns were collected at the single crystal diffractometer CYCLOPS (Cylindrical CCD Laue Octagonal Photo Scintillator) at the ILL. These patterns allowed a fast examination of the reciprocal space from 1.5 K to room temperature, which eased the localization of structural phase transitions. The graphical visualization of the data collected was accomplished using the ESMERALDA software, see Fig. S1 of the ESI† for comparative Laue patterns.
Results and discussion
Initial characterization: XRD and DSC measurements
The powder and the single crystal samples were initially identified from laboratory XRD, confirming their quality for both cases. Fig. 1a illustrates the XRD pattern of the powder sample; the reflections are characteristic of a pure perovskite-type structure, and all the diffraction lines can be indexed in the expected cubic symmetry, with a = 5.9923(5) Å. Fig. 1b shows the DSC curves below RT, corresponding to two consecutive warming–cooling cycles. There are at least four thermal events, at 135, 159, 178 and 256 K in the heating run, and 261, 182, 160 and 151 K in the cooling runs, with different degrees of hysteresis. Normally, the hysteresis is associated with first order transitions, when the structures undergo reconstructive changes and both phases coexist in a certain temperature range. For non-reconstructive transitions, normally of second order, no hysteresis is expected, but there is a gradual transformation of some structural features. In the present case, we are not able to judge the transition order, but the different observed hysteresis already indicate that there are distinct degrees of structural reconstruction. DSC data suggest the complete reversibility of the processes, showing that the second cycle perfectly matches with the first one. Moreover, while the events at 261 K and 182 K are weak and wide, the 160 K and 151 K ones are strong and narrow, at least during the cooling runs. This DSC profile is similar to that reported by Schueller et al.17 Besides, recently Keshavarz et al.20 reported on a cascade of sharp transitions from dilatometry measurements whose temperatures (265, 182, 161, 152 and 120.5 K) roughly match the events shown in Fig. 1b. However, there is only solid crystallographic evidence to support the presence of the cubic, tetragonal and orthorhombic symmetries in Pmm, P4/mbm and Pnma space groups, respectively.17,18,20 These previous reports described the cubic to tetragonal phase transition close to 260 K and the tetragonal to orthorhombic transition below 155 K. All the diffraction analyses at lower temperatures defined an orthorhombic symmetry for this phase.17,18,20
 | ||
| Fig. 1 (a) Laboratory XRD pattern of powder FAPbBr3 at room temperature with CuKα radiation. (b) First and second cycle of DSC curves of FAPbBr3, showing several reversible phase transitions. | ||
Crystallographic analysis at room temperature
At room temperature, the cubic symmetry was also confirmed from SXRD data. The corresponding diagram was Rietveld refined in a unit-cell with a = 5.99248(3) Å, described in the Pmm space group. The pattern fitting from SXRD data is displayed in Fig. 2a, and the crystallographic results are listed in Table S1 (ESI†). Pb2+ cations and Br− anions are located at 1a (0, 0, 0) and 3d (0.5, 0, 0) Wyckoff sites, respectively. The organic cation FA+ is centred at (½, ½, ½), being the C and N atoms that form the FA organic unit located at 6f (½, y, ½) and 24l (x, y, 0.5) sites, respectively. These results are in agreement with previous ones; however, the data shown in Fig. 2a and its inset only present a partial picture of the crystal features, due to the hindrance to locate light atoms.
 | ||
| Fig. 2 Observed (red crosses), calculated (full black line) and difference (blue line) Rietveld profiles for FAPbBr3 at RT from (a) SXRD and (c) NPD. NPD at RT. View of the crystal structure obtained from Inset (a) SXRD and Inset (c) NPD. (b) Images of the crystals used in single crystal diffraction experiments. Views of the obtained crystallographic models of FAPbBr3 at room temperature where (d) the organic molecule FA is fixed along the [100] direction and (e) the FA can move freely. (f) View of the refined crystal structure at RT, enhancing the disk-shaped anisotropic displacement factors obtained from single crystal ND. | ||
The single crystal XRD laboratory analysis also confirmed this symmetry, yielding a unit-cell parameter of a = 6.007(2) Å and assessing the quality of the crystal. Fig. 2b illustrates the typical shape and size of single crystals. This result is in full agreement with that refined from SXRD data at RT; C and N atoms are indistinguishable, and the H atoms could not be located.
Neutron diffraction techniques expand the capacities to uncover the formamidinium position in this hybrid material. The first approach to unveil the complete structure was attained by neutron powder diffraction (NPD), based on the previous synchrotron results. The best fit of the NPD data was achieved considering the FA cation with a delocalization fixed along [100] directions, where it was only possible to refine the shift towards the face of the unit-cell; attempts to fit additional parameters led to a divergence in the refinements. For this to do, the angles and distances of FA units were fixed and only the displacement of the molecules along the [100] directions was refined, with respect to the ideal A position in the cubic APbBr3 perovskite. Intrinsically, the FA molecule presents a six-fold disorder, which is illustrated in the inset Fig. 2c. The final atomic parameters after the refinement are listed in Table S2 (ESI†), and Fig. 2c displays the goodness of the fit. Despite the good agreement between observed and calculated NPD profiles, the crystallographic results differ from those of a recent structural analysis made from NPD data by Franz et al.,18 using the rigid-body formalism to refine the FA position without restrictions of position and/or direction. This motivated us to carry on the crystal analysis using a complementary technique.
Therefore, to deepen into this crystallographic feature, single crystal neutron diffraction (SCND) data were collected and analyzed using different strategies. Upon modeling the FA unit as a rigid body, two options were tested: (a) limiting the FA position to a unique displacement along [100] direction and (b) allowing the cation to take the most favorable positions. In the first case, the mass center of FA is located at (x, ½, ½) with the molecule aligned along the [100] direction (Fig. 2d). In contrast, for the second case, the mass center of FA is in a general (x, y, z) position and the molecule can move away from the [100] direction (Fig. 2e). Both situations were tested separately leading to reasonable fittings, not showing significant differences, see Table S3 (ESI†); the reliability factors are slightly lower when the FA is less restrained. Fig. S2 (ESI†) displays more views of both structural alternatives. This comparison allows us to assume that the free position refinement of FA, despite improving subtly the fit, does not lead to a real picture of the crystal structure. The results obtained for the free position of FA do not necessarily represent the more statistically probable position of FA in the PbBr3 framework. Considering the high thermal agitation at RT and the cubic symmetry of the PbBr3 framework, we presume that the FA positioned along the [100] directions is the most appropriate model to consider the highly disordered nature of FA in FAPbBr3, at least from diffraction techniques.
Consequently, the refinement was remade considering only the [100] displacement of the FA unit, but using distances and angles constraints, instead of the rigid body formalism. It should be noted that each constraint with its standard deviation is considered to be minimized by the Rietveld method. Therefore, some chemical restrictions are established while maintaining the molecular flexibly. This model allowed a better refinement and it was possible to consider some anisotropic displacement factors of the FA unit. Fig. 2f shows a view of the crystallographic structure and Table S4 (ESI†) lists the obtained results with the mentioned procedure; as shown, the reliability factors are substantially improved in comparison with previous FA models.
Crystallographic analysis at low temperature
In order to define the symmetry of the different phases below room temperature, several synchrotron X-ray diffraction (SXRD) patterns were collected at 220, 155, 170 and 120 K. These temperatures were chosen according to the thermal events observed in the DSC curves displayed in Fig. 1b. A selected angular range of the SXRD patterns is presented in Fig. 3a, showing a conspicuous evolution of the patterns from cubic to tetragonal and from tetragonal to orthorhombic symmetry as temperature decreases. | ||
| Fig. 3 (a) Thermal evolution of the diffraction patterns, exhibiting three distinct symmetries, cubic, tetragonal and orthorhombic. (b) Temperature dependence of the unit-cell parameters, displayed in pseudocubic form, for the sake of comparison, and mean unit-cell volumes of FAPbBr3, obtained from SXRD data. The dashed lines indicate the events observed from DSC. | ||
At 220 K, the cubic Pmm symmetry is no longer observed, the pattern exhibiting the characteristic peaks of the tetragonal symmetry instead. We assume, then, that the weak thermal event observed in Fig. 2 at 256–261 K (heating–cooling) corresponds to this cubic-tetragonal transition. This symmetry reduction involves new reflections e.g. (210) and (211), as shown in Fig. 3a. The tetragonal structure is well defined in the P4/mbm space group, where the Pb atoms are placed in 2a (0, 0, 0) whereas Br1 and Br2 atoms are located at 2b (0, 0, ½) and 4g (x, y, 0) Wyckoff sites, respectively. The C and N atoms forming the organic unit are in 4f (½, 0, z) and 8k (x, x+½, z) sites, respectively. This transition to P4/mbm space group involves an in-phase octahedral tilt along c-axis, typified as a0a0c+ in Glazer's notation.27
The wide peak observed in the DSC curves at 182–178 K (cooling–heating) in Fig. 2 corresponds to the tetragonal–orthorhombic transition, involving a small heat exchange. This is subtly evidenced in the synchrotron patterns with the appearance of small diffraction lines as (131), as shown in Fig. 3a. Indeed, the rest of the patterns (170, 155 and 120 K) were successfully modelled in the orthorhombic Pnma space group. In this structure, Pb atoms are located in the 4b (0, 0, ½) sites and Br1 and Br2 atoms in 4c (x, ¼, z) and 8d (x, y, z) positions, respectively. The C and N atoms are located in general 8d (x, y, z) positions. The Tables S5, S6, S7 and S8 (ESI†) contains all the crystallographic data, while Fig. S3, S4, S5 and S6 (ESI†), display the Rietveld refinement plots for those temperatures. Fig. 3b displays the dependence of the unit-cell volume/Z and lattice parameters with temperature. The latter are represented as pseudocubic (psc) in order to ease the comparison, being apsc = a/√2, bpsc = b/2 and cpsc = c/√2. The increase of the pseudocubic lattice parameters indicates a constant expansion of the unit-cell volume as temperature increases. Although there is an overall expansion trend, we observe an inversion of the apsc and cpsc orthorhombic lattice parameters for the lowest temperature reached; this could be related to an abrupt re-arrangement in the orthorhombic phase around 120 K, reported by M. Keshavarz et al.20 detected from thermal expansion measurements. This inversion in the orthorhombic unit-cell parameters is clearly observed in the diffraction data. While the patterns at 170 and 150 K are very similar, at 120 K some diffraction lines show a conspicuous splitting, as illustrated in Fig. S7 (ESI†) for (02n0) and (n0n) reflections (e.g. (080) and (404)). This change between 155 and 120 K is not unexpected considering the high energetic events at 160 and 151 K observed in DSC data (Fig. 2). Hence, we can assume that both events are the result of changes in the interactions between the organic molecule and the inorganic framework, but not involving a change of symmetry. It is interesting to underline the different nature of the calorimetric events; while the phase transitions dominated by the inorganic framework are less intense and broad, the interactions between FA and the PbBr3 framework through H-bonds, are strong and narrow. A detailed analysis of the organic–inorganic interactions is described below from NPD data.
The temperature stability of the three phases assigned from diffraction and DSC analysis are in agreement with those reported in literature from DSC and dilatometry.17,20 On the other hand, previous analysis from diffraction data showed similar temperatures for the cubic to tetragonal transition, but lower temperatures for the tetragonal to orthorhombic transition. While the present synchrotron patterns show evidences of orthorhombic symmetry at 170 K, the T–O transition was previously reported around 150 K.17,18 This difference may be due to the pseudocubic behaviour of the orthorhombic symmetry above 150 K. In the present case, the high quality of the SXRD data allowed us to identify the weak peak of the (131) plane, characteristic of the orthorhombic phase (see insets in Fig. 3a).
The crystallographic analysis by NPD and SCND data allowed a complementary study involving invaluable information about the organic part in this hybrid material. Hence, low-temperature NPD patterns were collected at 200, 150, 100 and 1 K. A preliminary analysis reveals a tetragonal (200 K) and orthorhombic (150, 100 and 1 K) symmetry, in agreement with SXRD data results. In all cases, the FA ion was modelled using a rigid body formalism, by refining both position and direction of the molecule. In contrast with the cubic phase observed at room temperature, where the FA unit presents a six fold disorder, four possible positions of the FA molecule were found over a unique plane in the tetragonal phase at 200 K. Fig. 4a and b illustrate schematic views of this tetragonal crystal structure. The crystallographic results and the pattern refinements are included in Table S9 and Fig. S8 (ESI†), respectively. Moreover, the SCND data collected at 220 K corroborate the tetragonal structure, well-defined in the P4/mbm space group. Fig. S9 (ESI†) displays two views of the structural model derived from SCND data, and Table S10 (ESI†) presents the complete crystallographic parameters, showing good agreement with the previously reported NPD model.
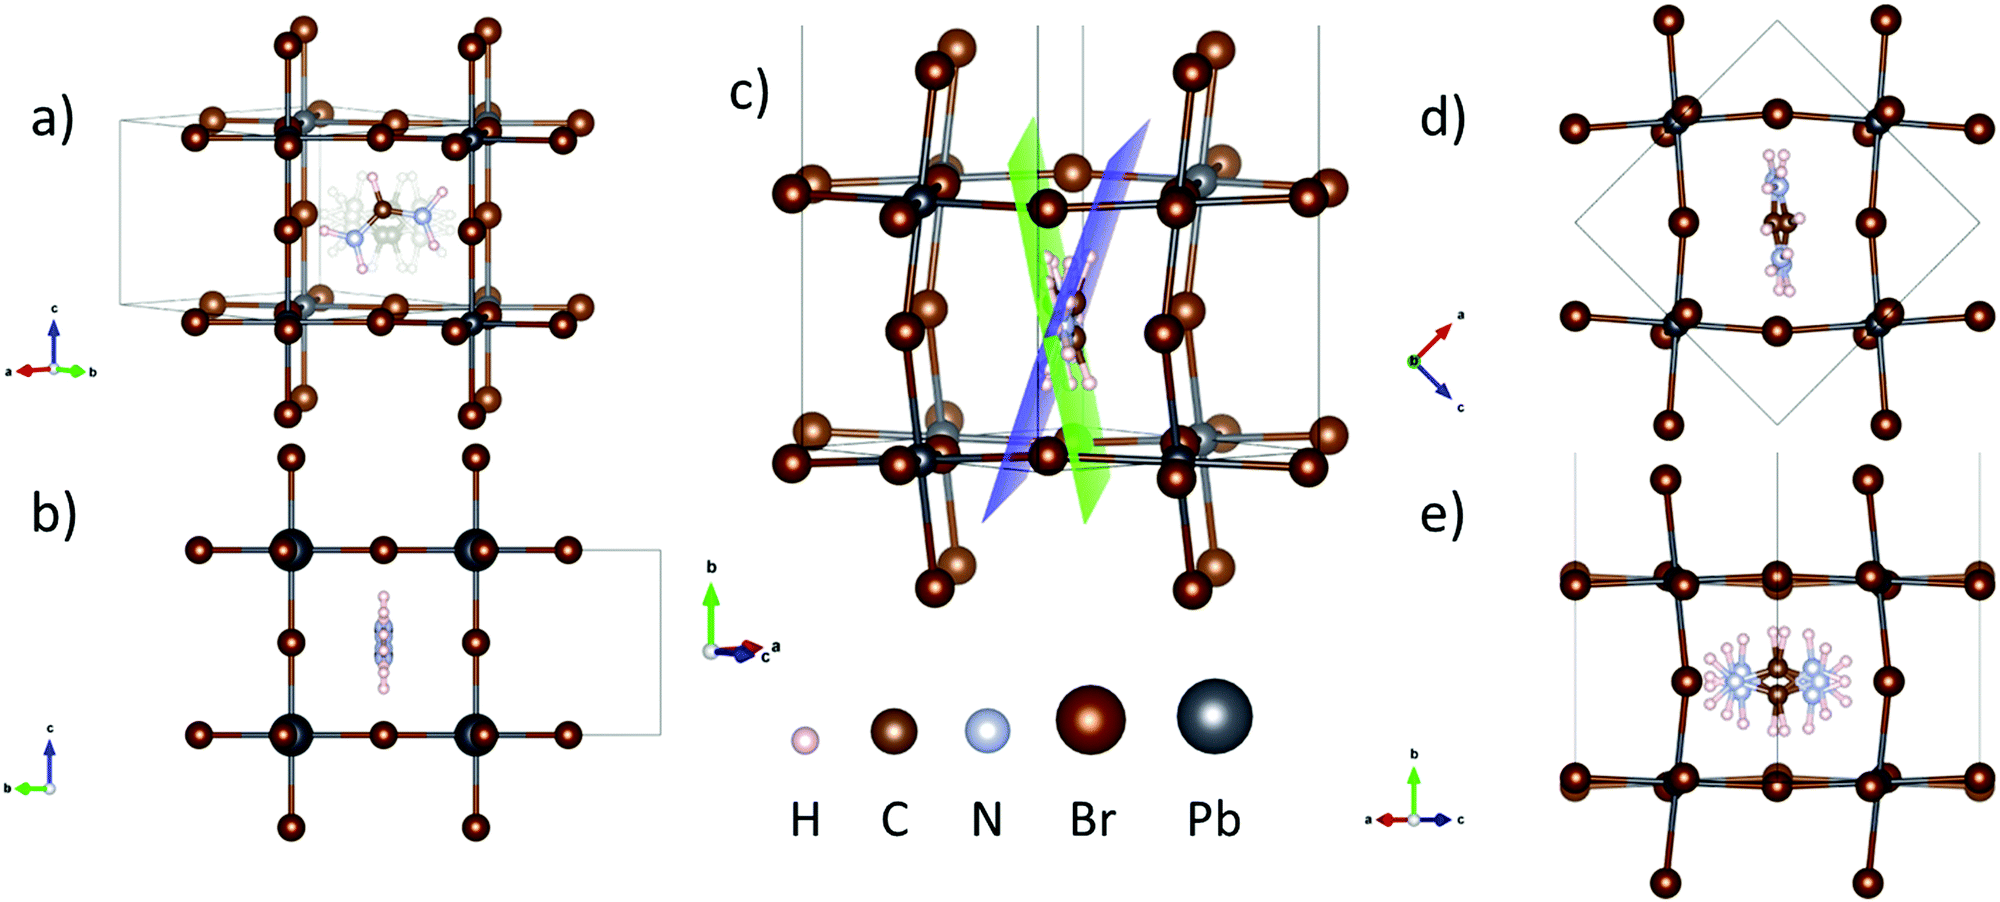 | ||
| Fig. 4 (a) and (b) Two crystallographic views of the FAPbBr3 tetragonal phase, refined from NPD data at 200 K, showing in (a) the four possible positions of the FA unit, and in (b) plane containing the delocalized molecule. (c), (d) and (e) Different views of the orthorhombic crystal structure of FAPbBr3, containing two distinct FA units, (d) FAA and (e) FAB, highlighted with a blue and green plane in (c). | ||
At lower temperatures, in the orthorhombic frameworks the organic part was properly fitted using a unique FA unit, which by symmetry generates a twofold disorder. Thus, the organic cation has a tilt with respect to the (200) plane in terms of the cubic polytype. This situation agrees with previous results;18 however, a detailed inspection of the refinement unveiled conspicuous differences in some diffraction lines. Moreover, Difference Fourier Maps revealed the presence of noticeable negative regions around FA, as illustrated in Fig. S10 (ESI†). The positions of these negative densities, illustrated in blue, clearly suggest the presence of an additional FA molecule on the other side of the plane (200) or, in other words, opposite to the first FA unit. This situation with an additional FA was modelled, leading to a non-negligible improvement of the refinements. The presence of two distinct FA units (named FAA and FAB) remained upon cooling at 1, 100 and 150 K. Figures S11, S12 and S13 (ESI†) illustrate the Rietveld refinements and Tables S11, S12 and S13 (ESI†) list the crystallographic results. This phase is illustrated in Fig. 4c–e, where Fig. 4c shows a view of the crystal structure, highlighting FAA and FAB units with blue and green planes, respectively.
Fig. 5 illustrates a view of both, the tetragonal and the orthorhombic phases at 200 K and 1 K respectively, where the delocalization of the organic FA unit within the PbBr3 inorganic cage is highlighted. For the tetragonal case, the FA unit suffers a delocalization within the (101) plane, while at lower temperatures (orthorhombic case), the organic unit also suffers a further out-of-plane delocalization.
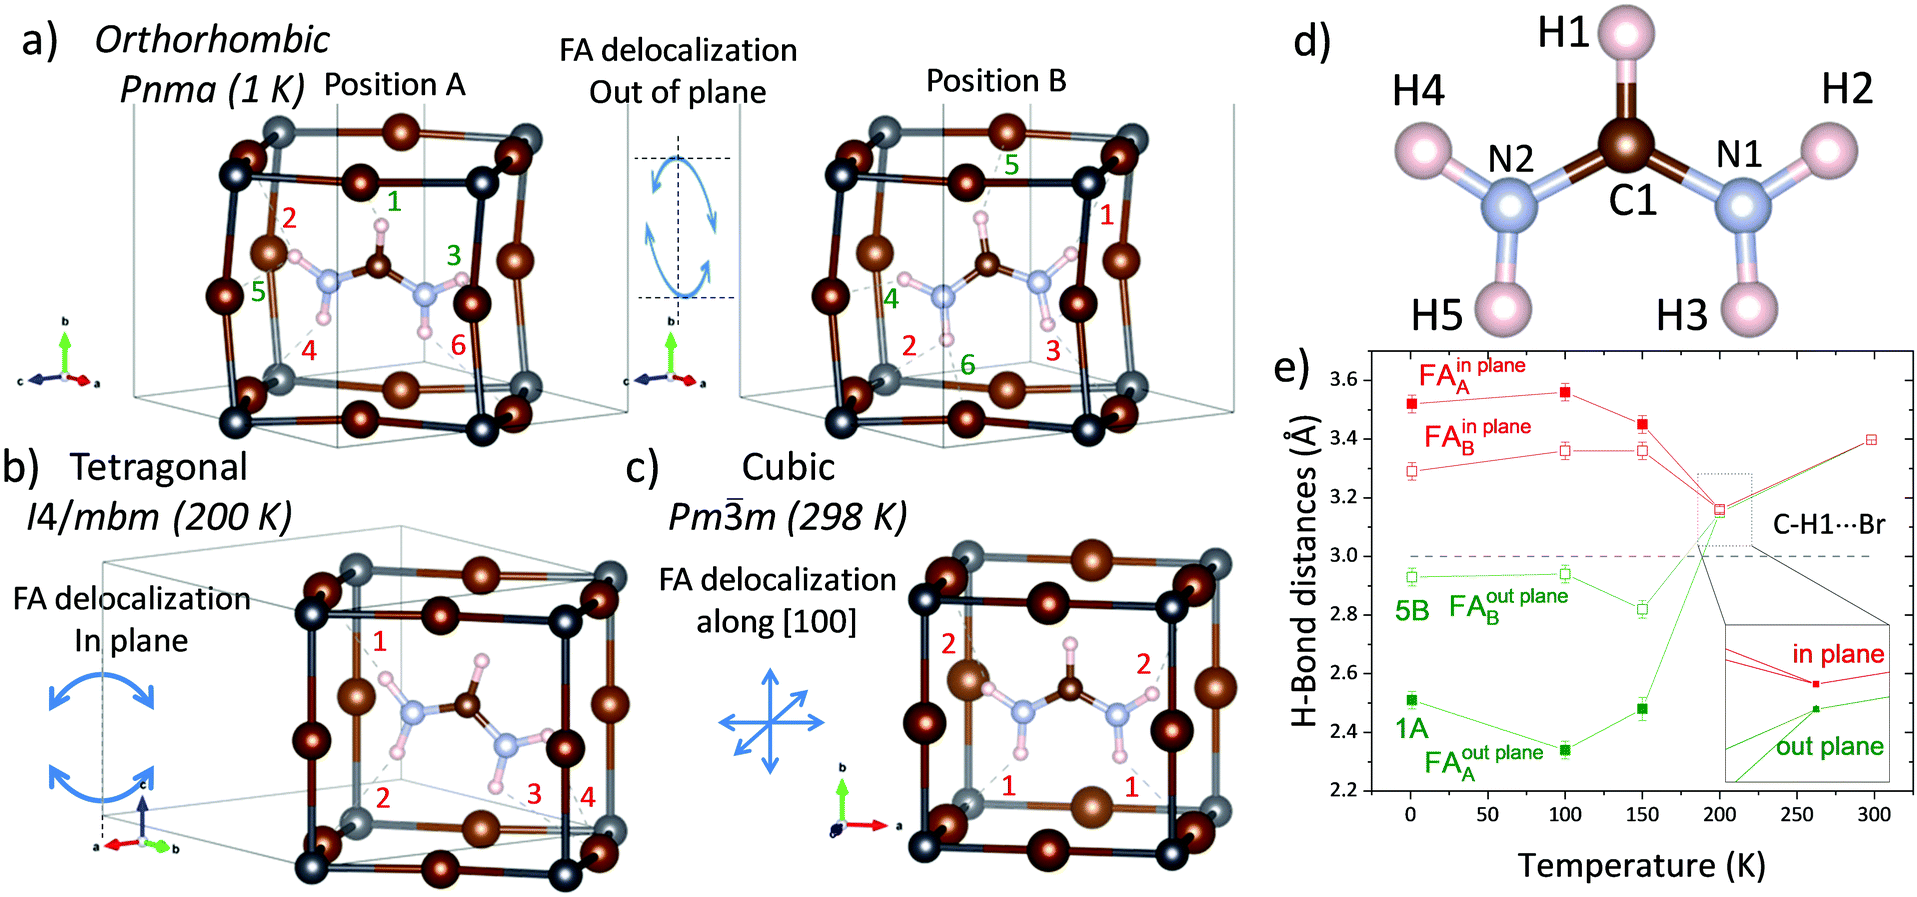 | ||
| Fig. 5 Delocalization of the FA organic unit in the (a) orthorhombic, (b) tetragonal and (c) cubic phase. Dashed lines highlight the shortest distances (< 3 Å) for the FA unit within the PbBr3 cage. The numbers establish the order of these distances, being the ones in red, the interactions within the FA plane, and the ones in green, out of the plane interactions. (d) Scheme of the organic molecule FA with labelled atoms. (e) Illustration the thermal evolution of the H-bond distances of the H1(C) atoms from 1 K to 298 K. | ||
Additionally, the thermal evolution of inorganic matrix can be appreciated through Pb–Br distances and Pb–Br–Pb angles, which emphasize the symmetry of the three phases (Fig. S14, ESI†). The PbBr6 octahedra appear substantially tilted in the orthorhombic phases, and denote structural differences in between the thermal events, indicated by the present DSC curves. This behaviour supports the non-monotonic structural evolution of the orthorhombic phase below 180 K, as already observed from SXRD data.
H-bonds interactions
It is widely accepted that the H-bond interactions play a predominant role in these hybrid materials,24 both in their crystal structure and in their properties. Thus, NPD is the primary experimental method that allows gathering information about the distances and angles defining the H-bond interactions. The N (or C)–H⋯Br angle and H⋯Br distance are two parameters that allow quantifying the hardness of these interactions. For this perovskite, the H-bonds can be classified depending on whether they are contained in the FA plane or not. In order to analyze the thermal evolution of this phase in terms of the H-bonds, the shortest H⋯Br distances are examined across the three polymorphs. Fig. 5a–c illustrate the shortest distances (< 3 Å) at 1 K for the two possible configurations of the FA unit, where the number indicates the order of these distances. The color specifies whether the H⋯Br interactions are in the FA plane (red) or they are out of the FA plane (green). The thermal evolution of these distances is plotted in Fig. 5d, Fig. S15 and S16 (ESI†), and allows us gaining some information regarding the different interactions and the crystal symmetry. The H1(C) only shows an appreciable interaction with bromide in the orthorhombic symmetry, and it is stronger when the FA unit is on the A position, (Fig. 5e). In addition, these H-bonds are with Br out of the FA plane (101), indicating the associated effects between the FA tilt on each side of the (101) plane and the in-phase tilt of PbBr6 along the b-axis. In the tetragonal system, this distance is subtly above 3 Å and both, in- and out-of-FA plane, are very similar (3.16(1) and 3.15(1) Å, respectively) due to the FA tilt in the (101) plane. On the other hand, in the cubic symmetry, H1 seems not to interact with Br (Fig. 5c). A similar observation can be made from the distances plotted in Fig. S15 (ESI†). The H2 and H4 atoms in the cubic phase are closer to Br in the same plane, but in the tetragonal phase this distance is split due to the FA displacement within its plane. Then, in the orthorhombic phases, strong H⋯Br interactions appear out the plane, in agreement with the existence of two FA positions and the occurrence of antiphase tilts of PbBr6 octahedra perpendicular to the b-axis. The H-bonds through H3 and H5 preferably occur with Br ions placed in the FA plane in all the temperature range (see Fig. S16, ESI†). In spite of this generality, the N–H⋯Br distances at 150 K present non-negligible differences with the phases at 100 and 1 K. This is observed in both FAA and FAB positions, concerning changes in the shortest H-bond distance (Fig. S14a, S15a and S15b, ESI†). These rearrangements in the preferred H-bonds surely imply thermal events involving non-negligible energies, which can explain those observed by calorimetric measurements.Absorption capacity of FAPbBr3 by UV-Vis spectroscopy
The absorption capacity of the synthesized FAPbBr3 perovskite powder was investigated by diffuse reflectance UV-Vis spectroscopy. Fig. 6 depicts the optical absorption coefficient related to the Kubelka–Munk function (F(R) = a = (1 − R)2/2R), being R the reflectance versus wavelength in eV. The band gap for this perovskite has been calculated by extrapolating the linear region to the abscissa. The value obtained for FAPbBr3 (2.23 eV) is slightly greater than reported by Saidaminov et al. (2.13 eV)28 but it is close to informed in later reports (2.23 eV).29,30 Besides this is slightly smaller in comparison with the methyl ammonium-based counterpart (MAPbBr3) (2.34 eV), which makes that FAPbBr3 absorbs in a wider range within the visible light spectrum. | ||
| Fig. 6 Kubelka–Munk function versus energy. Inset: Detail of the determination of the optical band gap in FAPbBr3. | ||
Conclusions
We have synthesized well-crystallized powder and single crystals of the hybrid FAPbBr3 perovskite, and its crystallographic features with synchrotron and neutron diffraction in the 1–298 K temperature range have been determined. The range of stability of the cubic Pmm, tetragonal I4/mbm and orthorhombic Pnma phases has been established. The combination of SXRD (able to detect subtle symmetry deviations) and NPD (sensitive to H positions) allowed us to deepen into the configuration of the FA units within the inorganic cages. In particular, the orthorhombic phase presents an unreported splitting of the FA molecule at 1, 100 and 150 K, determined by Difference Fourier Maps. In addition, a study of the H-bond interactions was performed, unveiling strong H⋯Br interactions in the orthorhombic phase out the plane, in agreement with the presence of two different FA positions and the occurrence of antiphase tilts of PbBr6 octahedra perpendicular to the b-axis. Furthermore, the join analysis of diffraction and calorimetry reveals that the cascade of events below ∼180 K corresponds to the formation and rupture of H-bonds without changes in the crystallographic symmetry, which keeps the orthorhombic symmetry defined in the Pnma space group. Finally, the absorption capacity of our FAPbBr3 specimen, evaluated by UV-Vis spectroscopy; exhibits a bandgap value of 2.15 eV that translates into a broad absorption within the visible light range.
Author contributions
M. C. A. G. and C. A. prepared the samples; C. A., M. T. F. D., J. A. A. and L. C. collected and analysed the structural NPD data; J. A. A., C. A. and C. A L. collected and analysed the SXRD data; M. C. A. G. carried out the optical measurements; all the authors participated in the discussion of results and redaction of the article.Conflicts of interest
There are no conflicts to declare.Acknowledgements
Authors acknowledge financial support given by the Spanish Ministry of Science, Innovation, and Universities for funding the project number: MAT2017-84496-R. They wish to express their gratitude to ILL and ALBA synchrotron for making all facilities available for the neutron and synchrotron X-ray diffraction experiments. CAL acknowledges UNSL and ANPCyT for financial support (projects PROICO 2-2320 and PICT2017-1842, respectively), Argentine. CA thanks financial support from the Institut Laue-Langevin through the DA/SRH/GRI/AS/19-214 contract.References
- A. Rubino, T. Huq, J. Dranczewski, G. Lozano, M. E. Calvo, S. Vezzoli, H. Míguez and R. Sapienza, J. Mater. Chem. C, 2020, 8, 15990–15995 RSC.
- L. Dou, Y. Yang, J. You, Z. Hong, W.-H. Chang, G. Li and Y. Yang, Nat. Commun., 2014, 5, 5404 CrossRef CAS PubMed.
- G. W. P. Adhyaksa, L. W. Veldhuizen, Y. Kuang, S. Brittman, R. E. I. Schropp and E. C. Garnett, Chem. Mater., 2016, 28, 5259–5263 CrossRef CAS.
- C. C. Boyd, R. Cheacharoen, T. Leijtens and M. D. McGehee, Chem. Rev., 2019, 119, 3418–3451 CrossRef CAS PubMed.
- N. Aristidou, C. Eames, I. Sanchez-Molina, X. Bu, J. Kosco, M. S. Islam and S. A. Haque, Nat. Commun., 2017, 8, 15218 CrossRef PubMed.
- J. B. Hoffman, A. L. Schleper and P. V. Kamat, J. Am. Chem. Soc., 2016, 138, 8603–8611 CrossRef CAS PubMed.
- M. Saliba, T. Matsui, K. Domanski, J.-Y. Seo, A. Ummadisingu, S. M. Zakeeruddin, J.-P. Correa-Baena, W. R. Tress, A. Abate, A. Hagfeldt and M. Gratzel, Science, 2016, 354, 206–209 CrossRef CAS PubMed.
- W. Li, Z. Wang, F. Deschler, S. Gao, R. H. Friend and A. K. Cheetham, Nat. Rev. Mater., 2017, 2, 16099 CrossRef.
- M. A. Green, K. Emery, Y. Hishikawa, W. Warta and E. D. Dunlop, Prog. Photovoltaics Res. Appl., 2016, 24, 905–913 CrossRef.
- J. Navas, A. Sánchez-Coronilla, J. J. Gallardo, N. Cruz Hernández, J. C. Piñero, R. Alcántara, C. Fernández-Lorenzo, D. M. De los Santos, T. Aguilar and J. Martín-Calleja, Nanoscale, 2015, 7, 6216–6229 RSC.
- B. R. Wygant, G. T. Geberth, A. Z. Ye, A. Dolocan, D. E. Cotton, S. T. Roberts, D. A. Vanden Bout and C. B. Mullins, ACS Appl. Energy Mater., 2020, 3, 6280–6290 CrossRef CAS.
- M. Saliba, T. Matsui, J.-Y. Seo, K. Domanski, J.-P. Correa-Baena, M. K. Nazeeruddin, S. M. Zakeeruddin, W. Tress, A. Abate, A. Hagfeldt and M. Grätzel, Energy Environ. Sci., 2016, 9, 1989–1997 RSC.
- A. A. Zhumekenov, M. I. Saidaminov, M. A. Haque, E. Alarousu, S. P. Sarmah, B. Murali, I. Dursun, X.-H. Miao, A. L. Abdelhady, T. Wu, O. F. Mohammed and O. M. Bakr, ACS Energy Lett., 2016, 1, 32–37 CrossRef CAS.
- F. Zhang, B. Yang, K. Zheng, S. Yang, Y. Li, W. Deng and R. He, Nano-Micro Lett., 2018, 10, 43 CrossRef PubMed.
- A. A. Sutanto, V. I. E. Queloz, I. Garcia-Benito, K. Laasonen, B. Smit, M. K. Nazeeruddin, O. A. Syzgantseva and G. Grancini, APL Mater., 2019, 7, 041110 CrossRef.
- Y. Zhang, Y. Liang, Y. Wang, F. Guo, L. Sun and D. Xu, ACS Energy Lett., 2018, 3, 1808–1814 CrossRef CAS.
- E. C. Schueller, G. Laurita, D. H. Fabini, C. C. Stoumpos, M. G. Kanatzidis and R. Seshadri, Inorg. Chem., 2018, 57, 695–701 CrossRef CAS PubMed.
- A. Franz, D. M. Többens, F. Lehmann, M. Kärgell and S. Schorr, Acta Crystallogr., Sect. B: Struct. Sci., Cryst. Eng. Mater., 2020, 76, 267–274 CrossRef CAS PubMed.
- M. I. Saidaminov, A. L. Abdelhady, B. Murali, E. Alarousu, V. M. Burlakov, W. Peng, I. Dursun, L. Wang, Y. He, G. Maculan, A. Goriely, T. Wu, O. F. Mohammed and O. M. Bakr, Nat. Commun., 2015, 6, 7586 CrossRef PubMed.
- M. Keshavarz, M. Ottesen, S. Wiedmann, M. Wharmby, R. Küchler, H. Yuan, E. Debroye, J. A. Steele, J. Martens, N. E. Hussey, M. Bremholm, M. B. J. Roeffaers and J. Hofkens, Adv. Mater., 2019, 1900521 CrossRef PubMed.
- F. Fauth, R. Boer, F. Gil-Ortiz, C. Popescu, O. Vallcorba, I. Peral, D. Fullà, J. Benach and J. Juanhuix, Eur. Phys. J. Plus, 2015, 130, 160 CrossRef.
- L. Chi, I. Swainson, L. Cranswick, J. H. Her, P. Stephens and O. Knop, J. Solid State Chem., 2005, 178, 1376–1385 CrossRef CAS.
- A. Varadwaj, P. R. Varadwaj, H. M. Marques and K. Yamashita, Mater. Today Chem., 2018, 9, 1–16 CrossRef CAS.
- J. Li and P. Rinke, Phys. Rev. B, 2016, 94, 045201 CrossRef.
- H. M. Rietveld, J. Appl. Crystallogr., 1969, 2, 65–71 CrossRef CAS.
- J. Rodríguez-Carvajal, Phys. B, 1993, 192, 55–69 CrossRef.
- A. M. Glazer, Acta Crystallogr., Sect. B: Struct. Crystallogr. Cryst. Chem., 1972, 28, 3384–3392 CrossRef CAS.
- M. I. Saidaminov, A. L. Abdelhady, G. Maculan and O. M. Bakr, Chem. Commun., 2015, 51, 17658–17661 RSC.
- K. Galkowski, A. Mitioglu, A. Miyata, P. Plochocka, O. Portugall, G. E. Eperon, J. T.-W. Wang, T. Stergiopoulos, S. D. Stranks, H. J. Snaith and R. J. Nicholas, Energy Environ. Sci., 2016, 9, 962–970 RSC.
- G. Mannino, I. Deretzis, E. Smecca, A. La Magna, A. Alberti, D. Ceratti and D. Cahen, J. Phys. Chem. Lett., 2020, 11, 2490–2496 CrossRef CAS PubMed.
Footnote |
| † Electronic supplementary information (ESI) available. See DOI: 10.1039/d1tc04642j |
| This journal is © The Royal Society of Chemistry 2021 |