 Open Access Article
Asymmetric N-heteroacene tetracene analogues as potential n-type semiconductors†
Max
Attwood
 *a,
Dong Kuk
Kim
 a,
Joseph H. L.
Hadden
 a,
Anthony
Maho
 a,
Wern
Ng
 a,
Hao
Wu
 a,
Hiroki
Akutsu
 b,
Andrew J. P.
White
 c,
Sandrine
Heutz
 a and
Mark
Oxborrow
a
aDepartment of Materials, Imperial College London, South Kensington Campus, Exhibition Road, London SW7 2AZ, UK. E-mail: m.attwood@imperial.ac.uk
bDepartment of Chemistry, Graduate School of Science, Osaka University, 1-1 Machikaneyama, Toyonaka, Osaka 560-0043, Japan
cDepartment of Chemistry, Imperial College London, White City Campus, 82 Wood Lane, London W12 0BZ, UK
First published on 23rd November 2021
Abstract
In the search for high performance n-type organic semiconductors (OSCs) a simple strategy might be substitution of aromatic CH groups for nitrogen heteroatoms. Here, we report the synthesis and characterisation of two novel N-heteroacene compounds, namely, 1,5,12-triazatetracene (TrAT1) and 2,5,12-triazatetracene (TrAT2). Their potential as n-type materials is evaluated against 5,12-diazatetracene (DAT) by UV/vis and EPR spectroscopy, cyclic voltammetry, DFT, single crystal X-ray diffraction and thin film characterisation. Increasing the number of N-heteroatoms was found to stabilise the HOMO and LUMO leading to electron affinities for TrAT1 and TrAT2 of ca. −4 eV. Both compounds were found to exhibit columns of co-facial π-stacked molecules. For TrAT1, molecules are also linked by hydrogen bonding, while the crystal structure of TrAT2 was found to be inherently disordered. Thin films of DAT, TrAT1 and TrAT2 were grown by organic molecular beam deposition (OMBD) and found to form discontinuous films, where TrAT1 exhibited a preferential orientation.
Introduction
In the last two decades, exploration of polycyclic aromatic hydrocarbons (PAHs) has yielded a remarkable library of organic semiconductor (OSC) compounds with carefully tuned photophysical and electronic properties.1 OSCs are versatile materials that can be exploited as field-effect transistors (FETs), organic light emitting diodes (OLEDs) and more recently, microwave gain media in the form of masers.2–5 Typical approaches to tuning the properties of OSCs towards these ends have involved modulation of the acene length, functionalisation of various C–H positions with inductive, mesomeric or electron withdrawing chemical groups or substitution of sp2-carbon atoms with heteroatoms such as nitrogen, oxygen or sulfur.6–8 Ultimately, the objective of these modifications is to modulate the functional properties by controlling the π-system topography and solid-state crystal packing – the latter of which can be exceedingly difficult to predict.Tetracene is an archetypal OSC molecule and an intrinsic p-type semiconductor with a band gap of ∼2.5 eV and hole field effect mobility at room temperature of 2.4 cm2 V−1 s−1 in single crystals9,10 and 0.12 cm2 V−1 s−1 in thin films.11 Improving the field effect mobilities of OSCs relies largely on modification of the crystal packing arrangement to maximise interactions between neighbouring HOMO- and LUMO-containing π-systems. For instance, tetracene adopts an edge-to-face herringbone packing arrangement with minimal overlap between the π-systems of adjacent tetracene molecules which inhibits intermolecular charge transfer. Significant improvements can be achieved by multiple phenyl substitution. For instance, rubrene (5,6,11,12-tetraphenyltetracene), another p-type conductor, exhibits superior overlap between the core tetracene groups due to steric “directions” by the four phenyl groups. In addition, rubrene forms high quality single crystals and highly orientated crystalline films leading to hole mobilities of up to 20 cm2 V−1 s−1.12 Importantly, rubrene is also far more chemically stable and soluble than tetracene.
While these findings have led to impressive developments in organic p-type conductors, the development of high-performance organic n-type conductors is lagging behind. In these materials, passage of a charge is primarily facilitated by electrons which oscillate through an electron-deficient lattice. This property can be achieved through chemical modification of the acene carbon backbone. Substitution of carbons for more electronegative atoms such as nitrogen that leads to a heterogeneous charge distribution within the molecule and regions of electron deficiency. The design of n-type conductors must also consider a balance between electron affinity (EA) and stability. Typically, electron affinities of ca. −4 eV are targetted in order for candidate materials to be compatible with conventional metal electrodes with work functions of >3.5 eV; however, less than −4 eV organic materials tend to be susceptible to degradation in air.
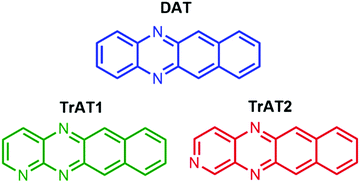
Here, we report the synthesis and characterisation of three asymmetric azatetracene derivatives (Scheme 1). The electronic properties of these compounds were controlled by the number and position of nitrogen heteroatoms. In all cases, these molecules were found to be n-type semiconductors with optical band gaps slightly less than tetracene and co-facial solid-state packing attributed to intermolecular hydrogen bonding.
Results
Synthesis
The synthesis of 5,12-dihydrobenzo[b]phenazine (H2DAT), 5,12-dihydrobenzo[g]pyrido[2,3-b]quinoxaline (H2TrAT1) and 5,12-dihydrobenzo[g]pyrido[3,4-b]quinoxaline (H2TrAT2) was straightforward, involving a co-melt of the reagents at 180 °C under argon (Scheme S1, see ESI† for details). Subsequently, generating a slurry in acetone proved an excellent method of removing impurities and residual starting materials such that the NMR traces for each product indicate high purity (Fig. S1–S3, ESI†). Expecting their aromatic derivatives would be sensitive to oxidation, strong oxidising agents such as K2Cr2O7 which have previously been used to synthesise 5,12-diazatetracene (DAT)13 were avoided and replaced with the mild oxidant, chloranil. DAT, 1,5,12-triazatetracene (TrAT1) and 2,5,12-triazatetracene (TrAT2) were then synthesised by reflux with chloranil in toluene. Upon cooling, dark red needle crystals formed and would saturate the solution. These crystals were initially isolated and analysed by NMR spectroscopy and single crystal X-ray diffraction. These materials were thus identified as co-crystals of the desired azatetracene compounds and the reduced derivative of chloranil, tetrachlorohydroquinone (TCHQ). The presence of TCHQ was evidenced by the presence of a hydroxyl-group associated 1H NMR shift at ∼10.14 ppm (Fig. S7, ESI†) and in the crystal structure of TrAT2:TCHQ (Fig. S8, ESI†). To remove TCHQ, the mother liquor was diluted with additional toluene following the reflux phase to prevent crystallisation. This solution was then washed repeatedly with NaOH solution and the toluene evaporated to yield the azatetracene compounds in high purity according to 1H NMR spectroscopy (see ESI†). Substitution of sp2-CH groups for N-heteroatoms has been suggested to enhanced stability of the tetracene in air,14 an effect associated with a kinetic blockade of the reactive 5,12-CH-groups.15 In our experience, while we have seen excellent air-stability for these compounds in the solid-state, we have found that TrAT1 and TrAT2 will degrade after a few days in solution. This likely stems from retention of central 6,13-position CH groups, which along with the 5,12-CH groups of tetracene are susceptible to redox.15,16Characterisation
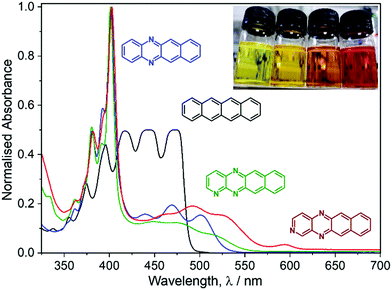
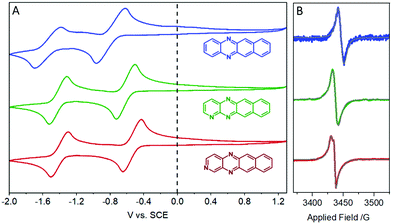
UV/vis spectroscopy of DAT, TrAT1 and TrAT2 was then performed revealing a gradual red shift in the optical band gap (Fig. 1). Interestingly, λmax for all three compounds was found to be ∼405 nm, a feature not seen in the spectrum of tetracene. TD-DFT calculations were thus performed to probe the nature of these peaks. Unanimously, the 405 nm peaks (blue shifted in DFT simulations to ∼365 nm, Fig. S11, ESI†) could be attributed to transitions between molecular orbitals below the HOMO to the LUMO, or from the HOMO to the LUMO+2, all corresponding to π* → π transitions. It is notable that our calculations assume a Gaussian band shape and consider the vibrational fine structure seen in the experimental UV/vis spectrum. Probing the luminescence behaviour of these compounds in THF solutions while illuminating at 405 nm revealed that while all compounds exhibited fluorescence at ∼425 nm and ∼455 nm, only DAT and TrAT2 exhibited additional fluorescence at >530 nm. All compounds exhibited fluorescence at >530 nm when probed with light corresponding to any of the longer wavelength absorbance peaks (Fig. S10, ESI†).Cyclic voltammetry (CV) was initially performed in DMF with 0.1 M NBu4PF6 to investigate the electrochemical properties (Fig. 2A). In all instances, no oxidation events were observed up to +1.3 V. The electron deficient nature of these compounds was reflected by two reduction events at negative potentials. For DAT, onset potentials were found to be −0.72 and −1.45 V, representing DAT0/− and DAT−/2−, respectively.17 These potentials are shifted higher to −0.55 and −1.36 V respectively for TrAT1 and −0.46 and −1.35 V respectively for TrAT2. Using the empirical formula ELUMO = 5.1 + (Ered − EFc/Fc+),18 the LUMO energies could be estimated (Table 1), and were found to be −3.91, −4.08 and −4.17 eV for DAT, TrAT1 and TrAT2, respectively. CV performed in THF solvent returns slightly more negative reduction potentials due to the reduced polarity of the solvent, with the second reduction event becoming irreversible or quasi-reversible in all cases (Fig. S14, ESI†). For DAT, the experimental LUMO energies in DMF and THF are similar to that reported by Miao et al., where DAT0/− was found at −1.44 V vs. FeCp2+/0.17 Estimations of the HOMO energies and band gaps for these materials offers an excellent match with the UV/vis-derived optical band gap. These experimentally derived energies are almost 20% lower than those calculated by DFT methods – a typical discrepancy characteristic of band gap underestimation expected for DFT methods.19 Overall, these results confirm that DAT, TrAT1 and TrAT2 are n-type semiconductors. In all instances, the LUMO energies, which corresponds to the electron affinity for n-type materials, are within the ∼3.0 eV threshold required to accept charges from metal electrodes which typically comprise the source and drain in organic FET (OFET) devices.20 It is also notable that the electron affinities of these compounds are comparable to other N-heteroacene molecules that are usually far more synthetically difficult to obtain.8,21
| Solvent | E red (V) | LUMOa (eV) | HOMOb (eV) | E gap,exp (eV nm−1) | LUMODFT (eV) | HOMODFT (eV) | E gap,DFT (eV nm−1) | |
|---|---|---|---|---|---|---|---|---|
| a Estimated using the empirical formula, ELUMO = 5.1 + (Ered − EFc/Fc+). b Estimated using the formula, EHOMO = ELUMO − Egap. c Estimated using the lowest energy transition revealed by UV/vis spectroscopy (Fig. 1). d Taken as the lowest energy transition for the calculated excitation spectrum by TD-DFT at the 6-311++G(d,p) level in Gaussian 09 (Fig. S11, ESI). | ||||||||
| DAT | DMF | −0.72 | −3.91 | −6.47 | 2.45/507 | −3.08 | −5.80 | 2.34/530 |
| THF | −0.96 | −3.59 | −6.04 | |||||
| TrAT1 | DMF | −0.55 | −4.08 | −6.65 | 2.40/517 | −3.30 | −5.99 | 2.30/540 |
| THF | −0.63 | −3.92 | −6.32 | |||||
| TrAT2 | DMF | −0.46 | −4.17 | −6.49 | 2.32/534 | −3.42 | −6.09 | 2.27/547 |
| THF | −0.60 | −3.95 | −6.27 | |||||
Interestingly, even following purification by vacuum sublimation, these compounds were found to generate radical species by X-band EPR spectroscopy (Fig. 2B). Such signals are usually found in charge transfer materials with donor and acceptor motifs,22–24 but are also observed in pure organic semiconductor materials where they are described as aggregation-induced, though their origin remains contentious.25,26 Reasonable fittings (see Table S1, ESI†) were obtained by simulating a radical system with g-anisotropy, hyperfine splitting via14N-coupling, and a Lorentzian line shape. Interestingly, modelling the signal observed from TrAT2 required the use of a diradical system, consistent with the presence of a cationic and anionic radical that exhibit a degree of weak coupling. This may indicate that these intrinsic radicals exist on separate chains within the quasi-1D structure (vide infra) with limited interchain hopping.27 To probe whether these signals may be due to some minor impurity, DAT crystals were grown by vacuum sublimation and the “dark” EPR spectrum was measured, showing a clear radical signal (Fig. S9, ESI†). During our measurements, we were unable to resolve any clear hyperfine splitting that can arise from 14N-coupling, and perhaps most recognisably observed with porphyrins.28,29 This may be attributable to two factors: firstly, the collective hyperfine splitting pattern would contain contributions from each nitrogen atom and potentially hydrogen atoms as well, yielding a complex hyperfine pattern. Furthermore, DFT calculations performed on DAT in the gas phase designate a higher portion of electron density situated on the N-atoms for the radical cation species, relative to radical anion species (Fig. S12, ESI†). This could compound the overlapping hyperfine signals, making each one more difficult to resolve. Secondly, these paramagnetic species may be delocalised, either over the whole molecule or through the crystal structure, thereby reducing the strength of individual couplings. Intriguingly, according to our band structure calculations, which employ an extended Hückel theory (vide infra), the HOMO for DAT and TrAT1 is distributed over neighbouring molecules in the crystal structure which supports delocalisation (Fig. S13, ESI†). It is also notable that as our materials are n-type, radical species arising as a result of oxygen absorption and formation of the superoxide anion, O2−*, as often found with porphyrins, are unlikely.28,30 Reduction of oxygen can only be catalysed by n-type semiconductors in an electrochemical setting coupled with photoactivation.31
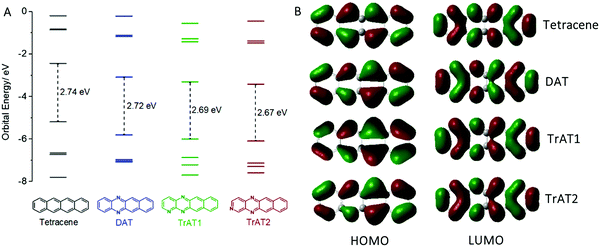
To further understand these results, we conducted DFT calculations on each of our compounds. This revealed that the dominant influence of the N-heteroatoms is to reduce the HOMO/LUMO energies with a corresponding slight reduction in the band gap (Fig. 3A). The larger separation between nitrogen atoms on TrAT2, as opposed to TrAT1, has a small stabilising effect on the LUMO, which is also reflected in the CV-derived reduction potentials. This is despite the similar architectures of the HOMO and LUMO orbitals across this series of compounds (Fig. 3B). DAT, TrAT1 and TrAT2 have asymmetrical HOMO and LUMO lobes compared to tetracene with the differences becoming more obvious down the series. Without any significant change relative to tetracene and due to the lack of distinct acceptor:donor domains, it is reasonable to assume that the radicals revealed by EPR spectroscopy correspond to intermolecular, and not intramolecular, charge transfer involving the HOMO and LUMO of neighbouring molecules.
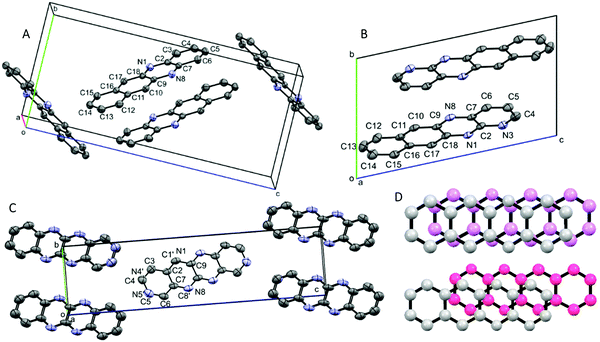
CV and DFT approaches are limited by their inability to reliably predict the solid-state properties of novel compounds. For example, the effective band gap and electron vs. hole mobilities are also significantly influenced by the crystal packing structure. During our investigations, we obtained solvent-free crystal structures of DAT, TrAT1 and TrAT2. Crystals of DAT were grown by recrystallisation from ethanol, while crystals of TrAT1 and TrAT2 could only be grown via vacuum sublimation due to their poor stability in solution. Analysis of each compound by single crystal X-ray diffraction revealed distinct molecular packing regimes. As previously described by Miao et al.,17DAT crystallises in the monoclinic P21/c space group (Fig. 4A and Table 2). DAT molecules form dimers with an overall herringbone-like packing arrangement, similar to tetracene and pentacene where the dominate interaction is π–π stacking with edge-to-face interactions. In this instance, the rings of adjacent molecules are situated over atoms, as opposed to rings, of their neighbours (Fig. 4D). This ring-over-atom (RA) stacking is considered preferable to ring-over-bond (RB) stacking for organic conductors since it typically corresponds to larger transfer integrals.32 Despite the presence of nitrogen lone pairs and the expected enhanced polarity of hydrogen atoms compared to tetracene, DAT does not exhibit any edge-to-edge interactions such as hydrogen bonding.
| Name | DAT | TrAT1 | TrAT2 | TrAT2:TCHQ |
|---|---|---|---|---|
| a Completeness to 0.84 Å resolution. b R 1 = ∑||Fo| − |Fc||/∑|Fo|; wR2 = {∑[w(Fo2 − Fc2)2]/∑[w(Fo2)2]}1/2; w−1 = σ2(Fo2) + (aP)2 + bP. c The structure has crystallographic inversion symmetry. | ||||
| Empirical formula | C16H10N2 | C15H9N3 | C15H9N3 | C36H20Cl4N6O2 |
| Formula weight | 230.26 | 231.25 | 231.25 | 710.38 |
| Colour, habit | Orange blocks | Dark red shards | Red platy needles | Red needles |
| Temperature/K | 173(2) | 173(2) | 173(2) | 173(2) |
| Crystal system | Monoclinic | Triclinic | Monoclinic | Monoclinic |
| Space group | P21/c |
P![[1 with combining macron]](https://www.rsc.org/images/entities/char_0031_0304.gif) |
P21/n | P21/c |
| a/Å | 7.0360(4) | 6.0069(10) | 3.8495(4) | 20.605(2) |
| b/Å | 8.4397(5) | 7.3094(14) | 6.0654(7) | 5.1363(6) |
| c/Å | 18.5162(10) | 12.450(2) | 22.823(3) | 14.6410(18) |
| α/° | 90 | 77.645(16) | 90 | 90 |
| β/° | 95.183(5) | 85.513(14) | 91.759(12) | 109.685(12) |
| γ/° | 90 | 87.083(15) | 90 | 90 |
| Volume/Å3 | 1095.03(11) | 532.01(17) | 532.64(11) | 1458.9(3) |
| Z | 4 | 2 | 2c | 2c |
| ρ calc/g cm−3 | 1.397 | 1.444 | 1.442 | 1.617 |
| μ/mm−1 | 0.084 | 0.089 | 0.703 | 0.455 |
| F(000) | 480.0 | 240.0 | 240.0 | 724.0 |
| Crystal size/mm3 | 0.327 × 0.169 × 0.087 | 0.177 × 0.137 × 0.059 | 0.306 × 0.192 × 0.009 | 0.261 × 0.043 × 0.019 |
| Radiation | MoKα (λ = 0.71073) | MoKα (λ = 0.71073) | CuKα (λ = 1.54184) | MoKα (λ = 0.71073) |
| 2Θ range/° | 5.308 to 56.06 | 5.71 to 56.362 | 7.752 to 146.026 | 5.566 to 55.704 |
| Reflections collected | 3720 | 3003 | 1541 | 5004 |
| Independent reflections | 2190 | 2091 | 1007 | 2907 |
| Completenessa (%) | 99.0 | 98.5 | 97.7 | 99.1 |
| Goodness-of-fit on F2 | 1.014 | 0.985 | 1.047 | 0.950 |
| R 1(obs)b | R 1 = 0.0470 | R 1 = 0.0698 | R 1 = 0.0724 | R 1 = 0.0717 |
| wR2 (all data)b | wR2 = 0.1209 | wR2 = 0.2135 | wR2 = 0.2357 | wR2 = 0.1497 |
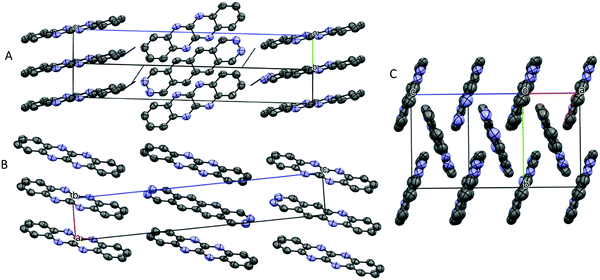
TrAT1 was found to crystallise in the triclinic P![[1 with combining macron]](https://www.rsc.org/images/entities/char_0031_0304.gif) space group with the unit cell consisting of two molecules stacked in a co-facial arrangement (Fig. 4B and Table 2). The larger packing motif is found to contain alternating RA and RB dimers with mean interplane distances of 3.366 and 3.331 Å, respectively (Fig. 5A). RB dimers arise due to a small displacement between TrAT1 molecules along the short molecular axis (∼0.7 Å). Pyrazine rings are stacked in the b-direction with the adjacent pyridine rings occupying positions over naphthalene moieties (Fig. 5B and C). Nearly perpendicular to the stacking direction, neighbouring TrAT1 molecules also interact via hydrogen bonding which is facilitated by the presence of nitrogen lone pairs. On each molecule, one of the pyrazine–nitrogen lone pairs interact with the C–H group at the 4-pyridine position, while the pyridine–nitrogen lone pair and the remaining pyrazine–nitrogen lone pair interact with naphthalene C–H groups (Fig. 5C). These features are distinct from DAT and likely responsible for avoidance of the herringbone packing arrangement.
space group with the unit cell consisting of two molecules stacked in a co-facial arrangement (Fig. 4B and Table 2). The larger packing motif is found to contain alternating RA and RB dimers with mean interplane distances of 3.366 and 3.331 Å, respectively (Fig. 5A). RB dimers arise due to a small displacement between TrAT1 molecules along the short molecular axis (∼0.7 Å). Pyrazine rings are stacked in the b-direction with the adjacent pyridine rings occupying positions over naphthalene moieties (Fig. 5B and C). Nearly perpendicular to the stacking direction, neighbouring TrAT1 molecules also interact via hydrogen bonding which is facilitated by the presence of nitrogen lone pairs. On each molecule, one of the pyrazine–nitrogen lone pairs interact with the C–H group at the 4-pyridine position, while the pyridine–nitrogen lone pair and the remaining pyrazine–nitrogen lone pair interact with naphthalene C–H groups (Fig. 5C). These features are distinct from DAT and likely responsible for avoidance of the herringbone packing arrangement.
TrAT2 was found to crystallise in the monoclinic P21/n space group with the unit cell consisting of two molecules (Z = 2) (Fig. 4C and Table 2). The crystal structure contains a centre of symmetry at the central C9–C9A bond. Since TrAT2 cannot have this symmetry, it must be reasoned that the structure is inherently disordered with each molecule randomly flipped on the x- or y-molecular axis throughout the structure. As such, sites N1/C1′ and N8/C8′ are both 50% occupied with nitrogen or carbon atoms. Similarly, sites N4′/C4 and N5′/C5 are occupied by nitrogen atoms on average ca. 30% and 20% of the time, respectively, and with carbon atoms otherwise. We were unable to distinguish packing differences at either end of the molecule with N4′/C4 and N5′/C5 sites exhibiting end to end hydrogen bond-like interactions with their equivalent sites on neighbouring molecules (Fig. 6A). Along the unit cell a-axis, molecules stack to form columns with an RA packing motif and mean interplane distances of 3.416 Å (Fig. 6B and C). TrAT2 does not exhibit any edge-to-edge interactions between N1/C1′, C4, C6 or C8/N8′ atoms. As a comparison, this is consistent with the structure of TrAT2:TCHQ (Fig. S8, ESI†), which is also absent of hydrogen bonding between neighbouring TrAT2 molecules. Hence of the three structures, it might be expected that TrAT1 would exhibit superior electrical properties since, unlike DAT and TrAT2, molecules of TrAT1 do not form distinct dimers or distinct 1D stacks.
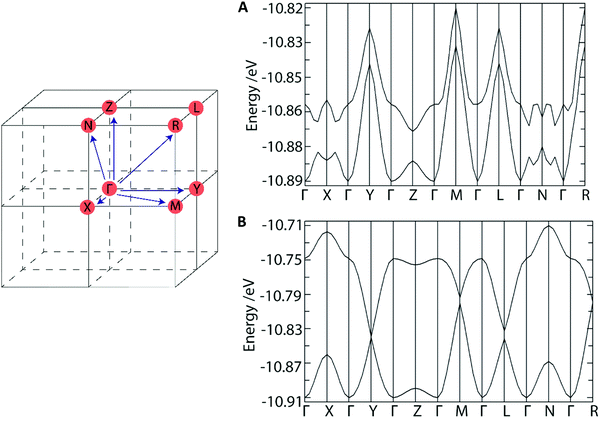
To understand how the crystal structure might influence the charge transfer properties of these materials we performed band structure calculations (Fig. 7A and B). As these are n-type OSCs, we expect the LUMO character to reveal their conductive character. For DAT, the LUMO and LUMO+1 dispersion bands converge along most Brillouin zone directions indicating a 3D-conductor property. The HOMO (donor)–LUMO (acceptor) band gap was found to be consistent with a semiconductor at ∼1.9 eV. Overall, these findings are consistent with the presence of isolated DAT dimers which do not interact significantly with the π-system of neighbouring DAT molecules, and thus there is no preferential route for conduction. For TrAT1 however, The LUMO and LUMO+1 dispersion bands converge along the Y-, L-, M- and R-Brillouin zone directions which closely corresponds to the crystallographic b, c-direction – parallel to stacks of co-facial TrAT1 molecules (refer to Fig. 5B). This indicates a potential as a quasi-1D conductor with a preferential charge transfer route through TrAT1 molecular stacks in the solid state. The band gap is also slightly reduced compared to DAT at ∼1.7 eV. Unfortunately, equivalent calculations for TrAT2 would not be meaningful due to the whole-molecule disorder of each TrAT2 molecule in the crystal structure. Nevertheless, these results qualitatively demonstrate that these materials are likely to be semiconductors and that dimensional preferences for conduction can likely be engineered into materials by intelligent molecular design.
To probe the electrical characteristics of DAT, TrAT1 and TrAT2, thin films were grown by organic molecular beam deposition (OMBD, see ESI† for details). The influence of deposition rate on thin-film uniformity and morphology was assessed by comparing growth at 0.5 and 1 Å s−1. Films of each compound were grown on glass for UV/vis spectroscopy and X-ray diffraction, silicon for scanning electron microscopy (SEM) and atomic force microscopy (AFM) imaging, and finally on prefabricated bottom-gate top-contact FET substrates with Au electrodes for characterisation of their charge transport properties.
In each case, non-continuous films of micro-crystallites were produced with their size and the overall film roughness appearing markedly reduced at higher growth rates. For DAT, plate and rod-like crystals between 2–7 μm in length were formed with the films exhibiting an average roughness of 135 (±9) nm and 123 (±5) nm for growth rates of 0.5 and 1 Å s−1, respectively (Fig. 8A, D and Fig. S18, ESI†). High resolution SEM images of both crystallite morphologies indicated that the micro-crystallites are made up of smaller formations, with the plate-type crystals appearing smoother and more consistent (Fig. S17, ESI†). Interestingly, the median size of DAT crystals decreases at the faster growth rate of 1 Å s−1 (100–250 μm at 1 Å s−1, 300–400 μm at 0.5 Å s−1). Powder X-ray diffraction indicates that the faster growth rate may also influence the underlying crystal structure of DAT. This is apparent by the presence of a diffraction signal at 2θ = 8.2° which cannot be indexed using the structure derived from the bulk phase (Fig. 8F). For both films, the (002) and (122) planes are observed where the DAT molecules adopt a standing and face-on arrangements, respectively (Fig. S21, ESI†). Interestingly, the theoretical plane of largest intensity, (102), is absent for both deposition rates which suggests that a side-on arrangement is unfavourable. The 0.5 Å s−1 rate encourages growth along crystal planes where at least two DAT molecules adopt a face-on arrangement with the additional presence of the (121) plane (Fig. S21, ESI†). The face-on orientation observed can be correlated to the platelet-like grains, which notably, exhibit a less consistent grain orientation and less structural texture too. It is notable that our materials exhibit a significant background contribution by UV/vis spectroscopy when deposited by OMBD (Fig. S16, ESI†). This is consistent with the presence of scattering powder-like particles and could explain why we observe relatively weak X-ray diffraction signals. Since organic conductors usually have preferred crystal axis for conductivity, optimal performance in these OFET devices would require the surface crystallites to exhibit a strong directional preference.
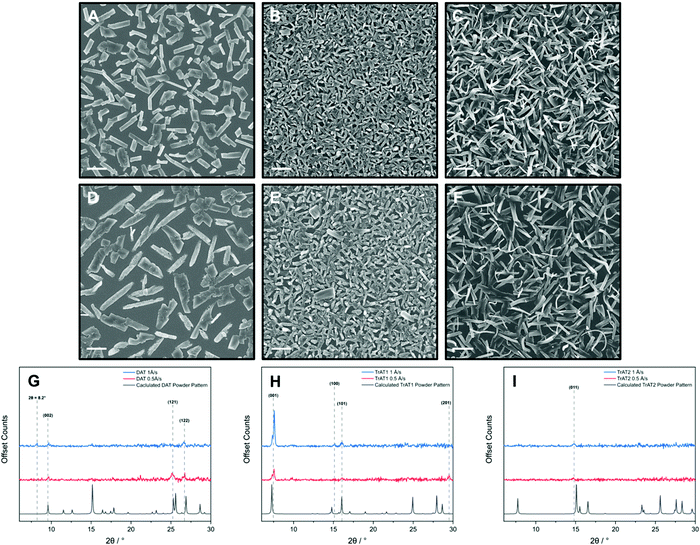 | ||
| Fig. 8 Imaging and X-ray analysis of (A, D, and G) DAT, (B, E and H) TrAT1 and (C, F and I) TrAT2 thin films on a silicon substrate. All materials were grown by OMBD at deposition rates of 1 (A–C) and 0.5 Å s−1 (D–F). Additional SEM and AFM images for films grown at 0.5 Å s−1 can be found in the ESI.† SEM imaging, scale bar = 2 μm. | ||
Thin films of TrAT1 were found to consist of crystallites <2 μm in length (Fig. 8B and E) with larger crystals forming at faster growth rates. This correlated with a surface roughness of 88 (±6) nm and 65 (±2) nm for deposition rates of 0.5 and 1 Å s−1, respectively (Fig. S18, ESI†). Films of TrAT1 are significantly more uniform compared to those of DAT and TrAT2. In contrast to DAT, both TrAT1 films are indexed to be predominantly oriented along the (001) plane, although a shift of 1–2 degrees compared to the powder pattern is observed (Fig. 8H). Compared to the 0.5 Å s−1 deposition rate, at 1 Å s−1 the (001) peak increased by a factor of 2.6, suggesting the faster deposition rate encourages growth of more crystalline and/or ordered films. Interestingly, the (001) plane exhibits a shoulder at 2θ = 7.1° for both deposition rates, at the position for the (001) powder peak. This may suggest the presence of a thin film and crystal phase which requires further investigation. For both films, there are additional planes where the TrAT1 molecules adopt a side-on arrangement along the substrate surface, although these comprise minor components (Fig. S22, ESI†). Since the band structure of TrAT1 indicates a 1D conductor, the orientated nature of these films would be expected to benefit their performance in applications where charge transport parallel to the substrate is required.
OMBD of TrAT2 leads to films consisting of ribbon-like features (Fig. 8C). This is also effectively seen in the cross-section views of the films, where some crystallites curve away from the substrate (Fig. S19, ESI†). As a result, we were unable to obtain AFM images due to the excessive roughness of the films. The faster deposition rate induces the formation of smaller but more numerous crystallites. Like TrAT1, these films also appear to exhibit a preferential orientation with one clear peak indexed as the (011) plane, independent of deposition rate (Fig. 8H and Fig. S23, ESI†). If accurate, this would correspond to a face-on orientation, similar to DAT, however, a substantial shift in the peak position of 2θ = 0.4° is observed compared to the simulated powder pattern. Due to the obvious visual randomness and weak X-ray diffraction pattern, it would be reasonable to assume that much of the TrAT2 films are composed of amorphous particles, and hence are not necessarily represented by the diffraction data in terms of growth orientation. This is supported by the large scattering background observed for the UV/Vis data, consistent with powder or amorphous particles (Fig. S16, ESI†).
Despite interesting surface data, we have been unable to record any meaningful FET performance during our work with these materials, despite operating under an inert atmosphere. This is likely due to the non-continuous nature of the films, and the topological inconsistencies of the crystallites leading to reduced contact between source and drain electrodes. Consequentially, measurement of conductivity would rely on single crystals bridging between neighbouring electrodes. Indeed, optical micrographs of our OFET devices seem to support this idea with few crystals observed between electrodes (Fig. S20, ESI†).
Discussion
In the past two decades, small molecule OSCs have been explored as potential replacements to conventional inorganic materials for applications that include photovoltaics, OLEDs, and FET devices. The ability to synthetically augment their properties based on the molecular structure is a property that chemists have sought to exploit. Often, this involves extensive functionalisation of a molecules’ periphery33,34 or by substitution of the molecular “core” sp2-atoms, such as, replacement of carbon atoms with heteroatoms such as oxygen, sulfur or nitrogen.21,35,36 In this article, we report on the properties of three azatetracene derivatives, leading to the development of novel n-type materials.Our attempts to obtain n-type OSCs focused on a straightforward synthetic methodology involving a solvent-free reaction between an aromatic diamine and dihydroxynaphthalene. The resulting quinoxaline precursors are then oxidised under mild conditions to the aromatic diaza- and triazatetracenes, namely, DAT, TrAT1 and TrAT2. Compared to tetracene, the optical band gaps were found to red shift for DAT, TrAT1 and TrAT2, respectively, reaching a minimum of 2.32 eV. These trends were reflected by DFT calculations which also revealed corresponding stabilisation of the HOMO and LUMO energy levels. Experimentally, the minimum LUMO energy was determined to be less than −4 eV for triazatetracene compounds. Electron affinities of between −3.92 and −4.17 eV should be sufficiently low to permit electron injection/acceptance from metal electrodes in downstream FET devices. Furthermore, the electron affinities of TrAT1 and TrAT2 are lower than many small molecule acenes, most of which require reasonably sophisticated synthetic routes, and demonstrates the overlooked potential of these materials.21 Furthermore, 5-azatetracene, a mono-substituted tetracene compound was found by cyclic voltammetry in DCM solution to exhibit a LUMO at −3.50 eV,37 slightly higher in energy compared to DAT. These results are consistent with photoelectron spectroscopy of tetracene, phenazine and DAT,38 which suggested that azatetracenes make better electron acceptors due to the stabilisation of the HOMO and corresponding increase in the molecular ionisation energies. Indeed, the merit of expecting these materials to facilitate charge transport was supported by EPR spectroscopy of powder samples where signals consistent with charge transfer radicals were observed. Charge transfer characteristics have also been noted following quantum calculations for 5-azatetracene.37 We expect these radicals are symptomatic of intermolecular, rather than intramolecular, charge transfer due to the reasonably symmetrical nature of the LUMO orbitals. Typically, intramolecular charge transfer operates most effectively with distinct acceptor:donor molecular domains,39 which are absent here.
The single crystal structures of TrAT1 and TrAT2 were hence obtained by vacuum sublimination. These structures revealed potentially viable conduction pathways, namely, through interacting π-systems. The influence of additional aromatic nitrogen lone pairs on the crystal structure was most clearly observed with TrAT1, where neighbouring molecules interact with extensive hydrogen bonding. The result was a planar co-facial packing structure; a motif that was not observed when these interactions were absent as with DAT and TrAT2, which present with a pseudo-herringbone-type packing structure. Utilizing hydrogen bonding to modulate the crystal packing has previously been shown to be a useful strategy with linear, unsubstituted acenes. For example, Isoda et al., have demonstrated that nitrogen lone pairs will effectively generate linear, co-facial packing arrangements in 5,6,11,12-tetraazatetracene (TANC) and 5,6,13,14-tetrazapentacene (BTANC).40 These n-type organic conductors were shown to exhibit hydrogen bonding between pyrazine-nitrogen lone pair to benzene/naphthalene C–H groups, however due to the pyrazine group being positioned in the centre of the TANC molecule, the effective overlap between neighbouring moieties was reduced compared to BTANC, which exhibited hydrogen bonding between 4 of the 5 rings of adjacent molecules. The extent of intermolecular π-interactions is known to be a critical parameter for effective charge transport through organic media. Indeed, the switch from the herringbone to co-facial packing motif is thought to be responsible for the significant improvement in charge carrier mobilities in rubrene (and other phenyl-substituted tetracene derivatives), compared to tetracene.10,12,41 Thus far, an n-type rubrene-tetracene has not been found but aza-rubrene-like compounds have exhibited potential as n-type OSCs.42
To begin probing the electrical characteristics of these materials we modelled their dispersion band structures. As expected from the crystal structures, the long range co-facial π–π stacking exhibited by TrAT1 permits the formation of quasi-1D channels where the bonding character LUMO and LUMO+1 is increased. These calculations indicated that effective π-overlap between adjacent molecules is likely a beneficial component towards enhancing charge transport properties.
We next attempted the fabrication of OFET devices to test these ideas, however, we have been unable to record any field-effect behaviours. Interestingly, Isoda et al., noted that with their films of TANC and BTANC, OFET behaviour could only be observed within 30 minutes of film growth due to the development of non-contacted crystal domains.40 Similarly, we expect our results are likely due to the discontinuous nature of the films, a known problem with bottom-gate FET devices,43 and thus the formation of conductive channels would require electrode-bridging by single crystals or current hoping between crystals. This demonstrates the importance of effective crystal/crystal and crystal/electrode contact in OFET devices of small molecules. Using our OMBD approach, the texture of all the films were found to be highly dependent on the deposition rate used. In all cases, the faster deposition rate resulted in the increased formation of smaller crystallites. The molecules are all volatile, thus we are most likely operating in an equilibrium of adsorption/desorption with the deposition rates used. Future efforts should focus on tuning the deposition conditions to produce continuous films. Previous reports have indicated that the faster deposition rates would likely produce more continuous films, as observed for example, with pentacene44 and biferrocene.45 Alternatively, introducing templating layers to control the morphology and uniformity of the films may improve their potential as devices. For OFETs, the addition of an octadecyltrichlorosilane (OTS) self-assembled monolayer or 3,4,9,10-perylenetetracarboxylic dianhydride (PTCDA) pre-coating on the FET interface is a useful approach to ease charge injection, control molecular packing, and ultimately improve device efficiency.46,47 Finally, we could look to explore alternative deposition methodologies such as spin coating followed by a program of annealing.
Conclusion
In summary, two new N-heteroacene derivatives of tetracene have been synthesised and evaluated for their promise as n-type OSCs. These compounds were analysed by UV/vis and EPR spectroscopic, electrochemical, X-ray diffraction and DFT methods to determined how the molecular electronic and structural properties were modulated by these chemical modifications. Compared to tetracene, azatetracenes exhibited slightly smaller optical band gaps with n-type semiconductor properties and relatively high electron affinities. Structurally, triazatetracene compounds exhibited long range π-stacking leading to solid-state band gaps that are typically favourable for enhanced conductivity. Thin films were grown and their morphology and molecular organisation properties were probed by SEM, AFM and X-ray diffraction. Our investigations have indicated that triazatetracene compounds can exhibit an encouraging preferential growth orientation compared with DAT, especially at higher rates of deposition. In this instance, while the non-continuous nature of the films prevented the measurement of their electronic performance in an OFET structure, our results indicate that these azatetracene materials exhibit favourable energy characteristics for use as n-type semiconductors. Promising directions for improving the prospects of device manufacture include using higher deposition rates and utilisation of pre-coated layers to enhance film uniformity. Importantly, we have shown that the crystal packing can be engineered towards more favourable molecular packing architectures for enhanced electrical properties. In the future, we hope to explore the potential of these materials as photovoltaic devices and optical/microwave gain media.Conflicts of interest
Nothing to declare.Acknowledgements
This work was supported by the U.K. Engineering and Physical Sciences Research Council through Grants No. EP/M020398/1 and EP/V048430/1. The authors would also like to thank Dr Irena Nevjestic who manages and consults in our SPIN-Lab facility at Imperial College London, funded by the EPSRC-funded facility SPIN-Lab (EP/P030548/1). We would also like to thank Dr Yingqi Xu for managing and consulting in our NMR spectrometer facility. D. K. acknowledges the Department of Materials at Imperial College London for a PhD studentship. S. H. thanks EPSRC (EP/F04139X/1 and EP/F039948/1) for support. A. M. thanks University of Liège and Wallonie-Bruxelles International (WBI.World Excellence Fellowship) for support and funding.References
- J. E. Anthony, Chem. Rev., 2006, 106, 5028–5048 CrossRef CAS PubMed.
- M. Oxborrow, J. D. Breeze and N. M. Alford, Nature, 2012, 488, 353–356 CrossRef CAS PubMed.
- J. Breeze, K. J. Tan, B. Richards, J. Sathian, M. Oxborrow and N. M. N. Alford, Nat. Commun., 2015, 6, 1–6 Search PubMed.
- E. van Wynsberghe and A. Turak, Optoelectronics – Advanced Device Structures, InTech, 2017, pp. 213–231 Search PubMed.
- H. Wu, W. Ng, S. Mirkhanov, A. Amirzhan, S. Nitnara and M. Oxborrow, J. Phys. Chem. C, 2019, 123, 24275–24279 CrossRef CAS.
- U. H. F. Bunz, Chem. – Eur. J., 2009, 15, 6780–6789 CrossRef CAS PubMed.
- S. Bogatko, P. D. Haynes, J. Sathian, J. Wade, J. S. Kim, K. J. Tan, J. Breeze, E. Salvadori, A. Horsfield and M. Oxborrow, J. Phys. Chem. C, 2016, 120, 8251–8260 CrossRef CAS.
- U. H. F. Bunz and J. Freudenberg, Acc. Chem. Res., 2019, 52, 1575–1587 CrossRef CAS PubMed.
- J. C. S. Costa, R. J. S. Taveira, C. F. R. A. C. Lima, A. Mendes and L. M. N. B. F. Santos, Opt. Mater., 2016, 58, 51–60 CrossRef CAS.
- C. Reese, W. J. Chung, M. M. Ling, M. Roberts and Z. Bao, Appl. Phys. Lett., 2006, 89, 202108 CrossRef.
- D. J. Gundlach, J. A. Nichols, L. Zhou and T. N. Jackson, Appl. Phys. Lett., 2002, 80, 2925–2927 CrossRef CAS.
- D. A. Da Silva Filho, E. G. Kim and J. L. Brédas, Adv. Mater., 2005, 17, 1072–1076 CrossRef CAS.
- H. Kouno, Y. Kawashima, K. Tateishi, T. Uesaka, N. Kimizuka and N. Yanai, J. Phys. Chem. Lett., 2019, 10, 2208–2213 CrossRef CAS PubMed.
- Y. Chen, L. Shen and X. Li, J. Phys. Chem. A, 2014, 118, 5700–5708 CrossRef CAS PubMed.
- Z. Liang, W. Zhao, S. Wang, Q. Tang, S.-C. Lam and Q. Miao, Org. Lett., 2008, 10, 2007–2010 CrossRef CAS PubMed.
- N. Kolmer-Anderl, A. Kolmer, C. M. Thiele and M. Rehahn, Chem. – Eur. J., 2016, 22, 5277–5287 CrossRef CAS PubMed.
- S. Miao, S. M. Brombosz, P. V. R. Schleyer, J. I. Wu, S. Barlow, S. R. Marder, K. I. Hardcastle and U. H. F. Bunz, J. Am. Chem. Soc., 2008, 130, 7339–7344 CrossRef CAS PubMed.
- C. M. Cardona, W. Li, A. E. Kaifer, D. Stockdale and G. C. Bazan, Adv. Mater., 2011, 23, 2367–2371 CrossRef CAS PubMed.
- J. M. Crowley, J. Tahir-Kheli and W. A. Goddard, J. Phys. Chem. Lett., 2016, 7, 1198–1203 CrossRef CAS PubMed.
- M. Winkler and K. N. Houk, J. Am. Chem. Soc., 2007, 129, 1805–1815 CrossRef CAS.
- A. Naibi Lakshminarayana, A. Ong and C. Chi, J. Mater. Chem. C, 2018, 6, 3551–3563 RSC.
- Y. Qin, J. Zhang, X. Zheng, H. Geng, G. Zhao, W. Xu, W. Hu, Z. Shuai and D. Zhu, Adv. Mater., 2014, 26, 4093–4099 CrossRef CAS.
- A. Mandal, K. Rissanen and P. Mal, CrystEngComm, 2019, 21, 4401–4408 RSC.
- X. Kuang, L. Meng and C.-Z. Lu, iScience, 2021, 24, 102956 CrossRef PubMed.
- Z. Chen, W. Li, Y. Zhang, Z. Wang, W. Zhu, M. Zeng and Y. Li, J. Phys. Chem. Lett., 2021, 12, 9783–9790 CrossRef CAS PubMed.
- G. P. Eyer, K. R. Kittilstved and T. L. Andrew, J. Phys. Chem. C, 2017, 121, 24929–24935 CrossRef CAS.
- C. Coulon and R. Clérac, Chem. Rev., 2004, 104, 5655–5687 CrossRef CAS PubMed.
- M. Lan, H. Zhao, H. Yuan, C. Jiang, S. Zuo and Y. Jiang, Dyes Pigm., 2007, 74, 357–362 CrossRef CAS.
- M. D. Peeks, C. E. Tait, P. Neuhaus, G. M. Fischer, M. Hoffmann, R. Haver, A. Cnossen, J. R. Harmer, C. R. Timmel and H. L. Anderson, J. Am. Chem. Soc., 2017, 139, 10461–10471 CrossRef CAS PubMed.
- M. L. Pegis, J. A. S. Roberts, D. J. Wasylenko, E. A. Mader, A. M. Appel and J. M. Mayer, Inorg. Chem., 2015, 54, 11883–11888 CrossRef CAS PubMed.
- M. Gryszel, M. Sytnyk, M. Jakešová, G. Romanazzi, R. Gabrielsson, W. Heiss and E. D. Głowacki, ACS Appl. Mater. Interfaces, 2018, 10, 13253–13257 CrossRef CAS PubMed.
- T. Mori, Bull. Chem. Soc. Jpn., 1998, 71, 2509–2526 CrossRef CAS.
- Y. C. Lin, C. H. Lin, C. Y. Chen, S. S. Sun and B. Pal, Org. Biomol. Chem., 2011, 9, 4507–4517 RSC.
- T. Okamoto, S. Kumagai, E. Fukuzaki, H. Ishii, G. Watanabe, N. Niitsu, T. Annaka, M. Yamagishi, Y. Tani, H. Sugiura, T. Watanabe, S. Watanabe and J. Takeya, Sci. Adv., 2020, 6, eaaz0632 CrossRef CAS PubMed.
- Q. Meng and W. Hu, Phys. Chem. Chem. Phys., 2012, 14, 14152 RSC.
- J. T. E. Quinn, J. Zhu, X. Li, J. Wang and Y. Li, J. Mater. Chem. C, 2017, 5, 8654–8681 RSC.
- A. Ghosh, M. Budanovic, T. Li, C. Liang, M. Klein, C. Soci, R. D. Webster, G. G. Gurzadyan and A. C. Grimsdale, Asian J. Org. Chem., 2021, 10, 2571–2579 CrossRef CAS.
- I. Novak, J. Electron Spectrosc. Relat. Phenom., 2019, 236, 9–11 CrossRef CAS.
- D. N. Kanekar, S. Chacko and R. M. Kamble, ChemistrySelect, 2018, 3, 4114–4123 CrossRef CAS.
- K. Isoda, M. Nakamura, T. Tatenuma, H. Ogata, T. Sugaya and M. Tadokoro, Chem. Lett., 2012, 41, 937–939 CrossRef CAS.
- W. Xu, Y. He, I. Murtaza, D. Zhang, A. Li, Z. Hu, X. Zeng, Y. Guo, Y. Zhu, M. Liu and H. Meng, J. Mater. Chem. C, 2017, 5, 2852–2858 RSC.
- J. Li, F. Yan, J. Gao, P. Li, W. W. Xiong, Y. Zhao, X. W. Sun and Q. Zhang, Dyes Pigm., 2015, 112, 93–98 CrossRef CAS.
- C. D. Dimitrakopoulos and P. R. L. Malenfant, Adv. Mater., 2002, 14, 99–117 CrossRef CAS.
- D. Lubert-Perquel, D. K. Kim, P. Robaschik, C. W. M. Kay and S. Heutz, J. Mater. Chem. C, 2019, 7, 289–296 RSC.
- R. Leber, L. E. Wilson, P. Robaschik, M. S. Inkpen, D. J. Payne, N. J. Long, T. Albrecht, C. F. Hirjibehedin and S. Heutz, Chem. Mater., 2017, 29, 8663–8669 CrossRef CAS.
- Y. Kim, S. Chung, K. Cho, D. Harkin, W.-T. Hwang, D. Yoo, J.-K. Kim, W. Lee, Y. Song, H. Ahn, Y. Hong, H. Sirringhaus, K. Kang and T. Lee, Adv. Mater., 2019, 31, 1806697 CrossRef PubMed.
- H.-H. Tseng, M. Serri, N. M. Harrison and S. Heutz, J. Mater. Chem. C, 2015, 3, 8694–8699 RSC.
Footnote |
| † Electronic supplementary information (ESI) available. CCDC 2103753–2103756. For ESI and crystallographic data in CIF or other electronic format see DOI: 10.1039/d1tc03933d |
| This journal is © The Royal Society of Chemistry 2021 |

