Single-molecule conductance variations of up to four orders of magnitude via contacting electrodes with different anchoring sites†‡
Zhiyu
Zhu
a,
Hang
Qu
a,
Yaorong
Chen
a,
Chengyang
Zhang
a,
Ruihao
Li
a,
Yi
Zhao
a,
Yu
Zhou
a,
Zhixin
Chen
*ab,
Junyang
Liu
 a,
Zongyuan
Xiao
*a and
Wenjing
Hong
 *a
*a
aState Key Laboratory of Physical Chemistry of Solid Surfaces, iChEM, College of Chemistry and Chemical Engineering, Xiamen University, Xiamen 361005, China. E-mail: xiaozy@xmu.edu.cn; whong@xmu.edu.cn
bDepartment of Materials, University of Oxford, Parks Road, Oxford OX1 3PH, UK. E-mail: zhixin.chen@materials.ox.ac.uk
First published on 6th October 2021
Abstract
Control of conductance through a single molecule via alternating anchoring points provides a unique perspective to design single-molecule electronic devices. A high conductance difference among different states is essential for a single-molecule electronic device, which is challenging due to restriction of the structural changes in single-molecule junctions. Here, tetraphenylethylene derivatives with multiple anchoring sites are designed and synthesized to investigate single-molecule conductance using the scanning tunneling microscope break junction (STM-BJ) technique. In the break-junction cycle process, connection conformations with different anchor sites have been achieved reversibly to switch single-molecule conductance using the STM-BJ technique. Through mechanical control, these multi-anchored single-molecule junctions can achieve up to three conductance switching cycles, and the variation in conductance reaches up to four orders of magnitude. Theoretical calculations reveal that the conductance change originates from the different connecting sites and the different anchored configurations of single-molecule junctions provide a significantly different transmission. Our findings provide a reliable strategy to manipulate the mechanical switching and shed light on investigating the intrinsic charge transport of multi-anchored molecules.
Introduction
Utilizing molecules in electronics devices provides an essential step in the roadmap for the miniaturization and functionalization of electronic components.1–7 To improve the signal-to-noise ratio of electronic devices during operation, high conductance differences among the different states are essential for single-molecule devices.8–12 Molecular isomerization, as a common and effective method for designing molecular conductance switches, is widely utilized to implement high conductance differences primarily within 2 orders of magnitude of switching factors.13–22 However, this strategy requires specific conditions such as pH regulation13,14,21 or external field modulation15–17,22 to activate the molecules, while a high switching factor is challenging since the electronic structures in different states are similar.23–25 The mechanical modulation of particular binding sites between the molecule and the electrodes to vary the conductance provides a better opportunity to achieve more conductance states and a significantly higher switching factor by rational design of molecular structures.26–28With this strategy, different anchoring sites between the molecule and the electrodes could be well controlled via mechanical tuning to switch various junction states.29 The control of conductance by alternating anchoring sites has recently been reported, such as bisthioanisole substituted 1,2-disilaacenaphthenes30 and pyridinium in the middle of the molecular skeleton.31 However, switching factors with only two changeable conductance states are still relatively low. To maximize the switching factor in single-molecule junctions, we designed a new type of molecule to achieve up to tri-stable conductance switching as a result of different anchoring sites providing various conduction pathways, in which a four orders of magnitude change in switching factor has been achieved.
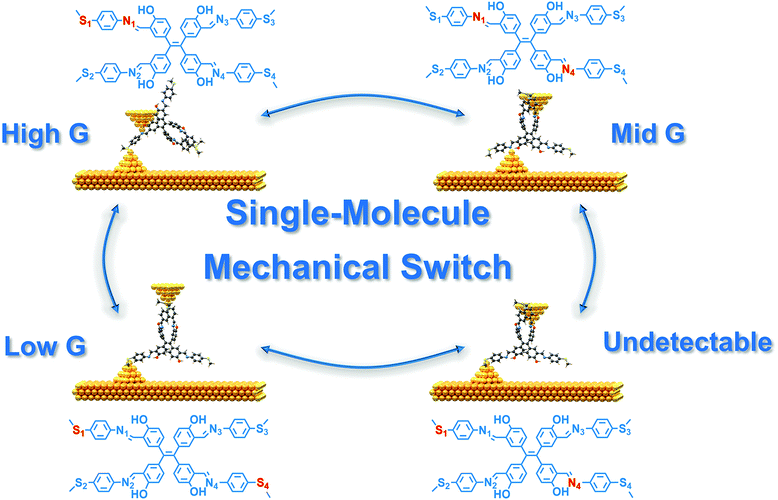
In this work, we designed and investigated the charge transport properties of two types of tetraphenylethylene derivatives. Through molecular engineering, multiple anchoring sites are introduced in the molecular chain to construct single-molecule junctions using the scanning tunneling microscopy break junction (STM-BJ) technique to switch conductance as a molecular mechanical switch,32–36 as shown in Scheme 1. Moreover, the value of conductance shifts in three states, and the highest switching factor is more than four orders of magnitude larger, which is ten times higher than the recently reported highest value.31 The compression–elongation experiments demonstrated the reversibility of the single-molecule switches. The flicker noise analysis combined with DFT theoretical calculations elucidates that every conductance for each molecular structure corresponds to through-bond transport mechanisms. Our results provide an in-depth insight towards the study of multi-anchoring molecules and expand the avenue for designing single-molecule mechanical switches.
Results and discussion
STM-BJ conductance measurement
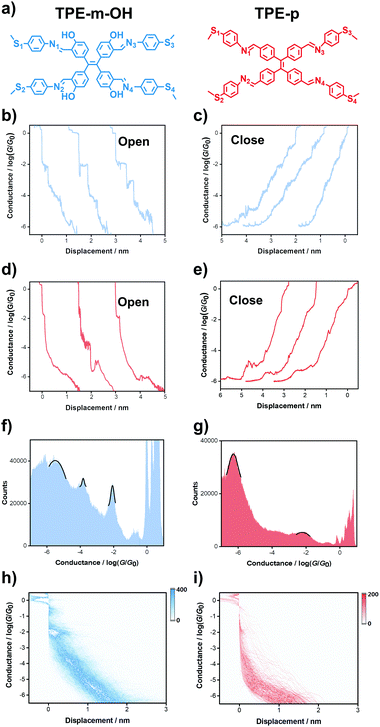
These two tetraphenylethylene derivatives, as shown in Fig. 1a, were measured using the STM-BJ technique. Typical individual conductance traces are randomly selected from break junction cycles, as shown in Fig. 1b–e. On comparing the traces in the same break-junction cycle, for both TPE-m-OH and TPE-p, the closing traces exhibit a trend of increasing conductivity as the electrode nanogap decreases, while the opening traces are the opposite. In every opening and closing cycle, the targeted molecules present multiple plateaus, indicating the construction of molecular junctions, which is related to the distance between electrodes and shows great potential for mechanical switches. TPE-m-OH shows three obvious plateaus at about 10−2.07G0, 10−3.88G0 and 10−5.54G0, where G0 means quantum conductance and equals 77.5 μS.37 For TPE-p, two prominent plateaus are observed located at about 10−2.0G0 and 10−6.1G0, respectively. These results show the potential for being utilized as mechanical molecular switches since their high switching factors (3.5 and 4 orders of magnitude higher, respectively) and the conductance could switch between two or three states, which presents remarkable superiority over other molecular systems.In the one-dimensional (1D) conductance diagrams, peaks are exhibited for TPE-m-OH and TPE-p (Fig. 1f and g). The three conductance peaks of the TPE-m-OH junction are determined at 10−2.07G0, 10−3.88G0 and 10−5.54G0 by Gaussian fitting, while for TPE-p, two distinct conductance peaks are observed, where the low conductance is 10−6.2G0, and the high conductance is 10−2.04G0, which is consistent with the aforementioned individual conductance trace results. Correlation analysis and control experiments confirm that the signals derive from the same molecule (see more details in Fig. S4 in the ESI‡).
To further explore the origin of the mechanical switching behavior, two-dimensional (2D) histograms are constructed (more than 3000 stretching traces of the targeted molecules without data selection) to elucidate the relationship between conductance and displacement (Fig. 1h and i). The clear plateaus illustrate the successful construction of single-molecule junctions. Considering the Au–Au snap–back distance (0.5 nm),38 the length of junctions for TPE-m-OH are calibrated to be ∼0.62 nm (high conductance), ∼1.2 nm (medium conductance) and ∼1.95 nm (low conductance). As for TPE-p, the length of the junctions is determined to be around ∼0.6 nm for high conductance and ∼2.48 nm for low conductance, which illustrates that the variations in conductance result from the different anchoring sites (see Fig. S2 in the ESI‡ for more details). The distinguished density clouds demonstrate the robustness of the switching process, indicating these two types of molecule could serve as single-molecule mechanical switches.
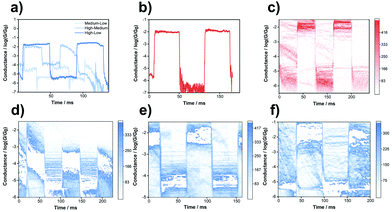
To further investigate the reversibility of the single-molecule mechanical switches, compression–elongation experiments were carried out. The junctions were elongated at the position where the conductance can be captured according to the conductance mentioned above. Then, a square wave was applied to the piezo to adjust the distance between the tip and the substrate. In this condition, the structures of the molecular junction were repeatedly elongated or compressed in correlation with the piezo movements to modulate the conductance by mechanical control. The tip–substrate distance was modulated by the piezo applied with the square wave, and for TPE-m-OH the tip–substrate distance was modulated by 0.58 nm, 0.75 nm and 1.2 nm for the switch between high–medium, medium–low and high–low conductance respectively, while for TPE-p, the tip–substrate distance was modulated by 1.9 nm. The frequency of the square wave remains constant (500 Hz), and the continuous and reverse regulation of switching between the two states are correlated with the wave amplitude, which is presented in Fig. 2. Hundreds of traces were collected to construct a 2D histogram, as shown in Fig. 2c–f. The conductance of TPE-m-OH and TPE-p switching among the high, medium and low conductance states is successfully observed, validating the reproducibility of the switching process for an individual junction. For the switch between the medium conductance state and the low conductance state of TPE-m-OH, the conductance always drops down to a conductance level that is below the low conductance state after the transition point, and then jumps up to the low conductance state, and vice versa, which might be attributed to the transition through an undetectable state during the transition process (S1–N4 anchoring sites, see more details in Fig. S5f in the ESI‡). Additionally, the highest switching factor (more than four orders of magnitude) was obtained in Fig. 2c, and its performance is improved approximately by one order of magnitude compared with previous work.28,29
According to the principle of the break-junction process, before the molecule forms a molecular junction, one of the terminal groups is adsorbed on the surface of the electrode. When the gold tip is moving in and out of contact with the gold substrates, it anchors with another terminal group to form a molecular junction. Therefore, the low-G state and the mid-G state could not transform mutually, which further indicates the existence of an undetectable state during the transition process between the medium conductance state and the low conductance state. The possible mechanism of the transitions between different conductance states is shown in Fig. S7 in the ESI.‡ However, during one break-junction cycle, the tip could connect with any anchoring sites along with the movement, hence the correlation between any of the two states of conductance should still be positive, as the 2D correlation histograms show in Fig. S4 in the ESI.‡
Flicker noise analysis
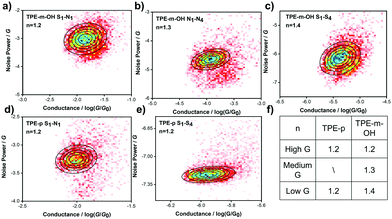
To further investigate the charge transport mechanism through junctions with different anchoring sites, flicker noise analysis of both target molecules was performed.39–42 The molecular junctions are suspended for about 150 ms to extract signals for subsequent analysis. Typical traces are shown in Fig. S3 (ESI‡). Generally, a higher value of n is obtained due to the stronger correlation between noise and conductance, corresponding to through-space charge transport. In contrast, a lower n indicates the charge transport is dominated by through-bond charge transport.41,43The 2D histograms of flicker noise power versus average conductance for TPE-m-OH and TPE-p are shown in Fig. 3a–e, respectively (2D histograms normalized for noise power versus conductance are presented in Fig. S3, ESI‡). The noise power of TPE-m-OH scaled as G1.2, G1.3 and G1.4 for high, medium and low conductance, respectively, indicating that the charge transport through the junction is dominated by through-bond transport. Moreover, the noise power of TPE-p, which is scaled as G1.2 for both the high conductance and the low conductance states, shows a similar transport behavior to that of TPE-p. These results explain that all of the probable connecting patterns exhibit a similar transport mechanism. In addition, according to previous research, single-stacking junctions show stronger through-space transport and the noise power tends to scale as G2.0.44 The noise power of both molecules are close to G1.0, which demonstrates that the multiple conductance does not derive from the stacking configuration.
Theoretical calculations
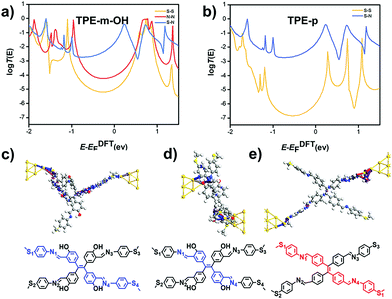
To further understand the charge transport through the single-molecule junctions with different anchoring sites, theoretical calculations were carried out, and all possible connected junctions are counted and optimized (see Fig. S4 in the ESI‡ for more details). The numbering of atoms is as shown in Fig. 1a. Among them, the distance for TPE-m-OH (S1–N1 anchoring sites of 0.6 nm, N1–N4 anchoring sites of 1.2 nm and S1–S4 anchoring sites of 1.9 nm) and the distance for TPE-p (S1–N1 anchoring sites of 0.6 nm and S1–S4 anchoring sites of 2.5 nm) are consistent with the length of the junctions determined by the experimental results. The results of the binding energy calculations reveal the strong interaction of Au–N bonds, validating that the medium conductance from the N1–N4 anchoring conformation is energy allowed (see more details in Fig. S6 and S8, ESI‡). The transmission spectra are calculated to illustrate the relationship between conductance and anchoring sites, as shown in Fig. 4a and b. It is found that the S1–S4 anchoring sites have the lowest transmission coefficient, while the transmission coefficient of the S1–N1 anchoring sites is the highest in both molecules.45,46The transmission pathway calculation is adopted to reveal the charge transport mechanism through the molecules exhibited in Fig. 4c–e.47,48 For every possible anchoring mode in TPE-m-OH and TPE-p, the transmission pathways show the current majorly flows between neighboring atoms through chemical bonds (see more details in Fig. S6 in, ESI‡), indicating the through-bond transport mechanism. Those theoretical calculation results fit well with the experimental consequences mentioned in the previous discussion, indicating the multiple conductance originates from the various anchoring sites, and all of these possible anchoring methods conform to the through-bond mechanism.
In our previous study,43 it has been demonstrated that hydroxy substituents whose orientations were fixed by intramolecular hydrogen bonds with imide groups could significantly suppress the destructive quantum interference raised by meta-connected benzene, for which the meta-connected benzene could show a similar charge transport capability to that of para-connected benzene. Additionally, the hydroxy group is a strong electron-donating group on pi-systems, which could increase electron density on the benzene ring, and further increase the anchoring capability of adjacent nitrogen atoms, for which tri-stable conductance switching could be achieved. Besides, the intramolecular hydrogen bonds make the molecule TPE-m-OH more planar, making it easier to achieve intramolecular stacking as shown in Scheme 1. The intramolecular stacking does not contribute to through-space transport, which has been demonstrated by transmission pathway calculations. However, this stacking in some degree increases the electron cloud density on the benzene rings, which may also further increase the charge transport capability of the benzene ring and increase the anchoring capability of the atoms.
Conclusions
In conclusion, we designed, synthesized, and investigated the charge transport through the single-molecule junctions of two tetraphenylethylene derivatives TPE-m-OH and TPE-p, using the STM-BJ technique. The molecules are designed and synthesized with multiple anchoring sites, which exhibit two and three variable conductance values, respectively. The switching factor of TPE-m-OH is 3.5, while that of TPE-p rises by four orders of magnitude, which is more than one order of magnitude larger than the highest value reported in previous studies. The flicker noise analysis combined with theoretical calculations confirms this viewpoint and reveals that a through-bond mechanism dominates the charge transport through different states. The combined calculation and the experimental investigations reveal that the origin of the different conductance values comes from the different connections between various anchoring sites and the electrodes. Our work provides a novel and constructive perspective for designing next-generation electronic components with multiple states and significant switching factors.Experimental section
Materials
TPE-m-OH and TPE-p were designed and synthesized by imine condensation. See more details in the ESI.‡Scanning tunneling microscopy break junction measurements
The single-molecule conductance was acquired using a lab-built STM-BJ setup under ambient environmental conditions and at room temperature. Before the conductance measurements, a calibration was conducted in a pure solvent to acquire accurate conductance information versus distance. See more details in the ESI.‡ Then all single-molecule conductance values were measured in a solution containing 0.1 mM of the targeted molecules in 1,2,4-trichlorobenzene (TCB). The molecular junctions were constructed by repeatedly moving the tips in and out of contact with the gold substrates, which was precisely regulated using a stepper motor and a piezo stack. A fixed bias voltage of 100 mV was applied between the tips and substrates. The conductance versus displacement traces were collected in every opening (tip retracting) and closing (tip approaching) cycle for further analysis.Compression–elongation experiments
When the conductance reached the required range, the tip was held over the electrodes for about 200 ms, and the triangular wave was applied to the piezo to elongate and compress the distance between electrodes to match the length of the molecules. The reversible and reproducible switching between the two different states reveals the excellent mechanical switching performance.Flicker noise analysis on molecular junctions
A flicker noise analysis of the molecular junctions was conducted based on previous studies. According to the previous research, the scaling factor n, which could be obtained by dividing the average conductance into the noise power G, is usually used to quantize the correlation. About 3000 traces without data selection are collected during the suspending period, and the fast Fourier transform is used to analyze the noise spectra by the integration from 100 to 1000 Hz for the plot of the noise power versus the average conductance, which elucidates the pattern of coupling.Theoretical calculations
All of the molecular structures in this work are optimized using the B3LYP method and 6-31g* basis sets via Gaussian 16 software. The configuration of the devices was optimized using the ATK software package. The energy-dependent transmission coefficient T(E) is calculated using DFT combined with the non-equilibrium Green's function (NEGF) formalism using the ATK software package.14,49 See the ESI‡ for more details.Conflicts of interest
There are no conflicts to declare.Acknowledgements
This work was supported by the Open Fund of Guangdong Provincial Key Laboratory of Luminescence from Molecular Aggregates (2019B030301003), the National Key R&D Program of China (2017YFA0204902), the National Natural Science Foundation of China (No. 21673195, 21722305, 21703188, U1705254), the China Postdoctoral Science Foundation (No. 2017M622060) and the Young Thousand Talent Project of China.Notes and references
- M. Ratner, Nat. Nanotechnol., 2013, 8, 378–381 CrossRef CAS PubMed.
- E. Lörtscher, Nat. Nanotechnol., 2013, 8, 381–384 CrossRef PubMed.
- M. Koole, J. M. Thijssen, H. Valkenier, J. C. Hummelen and H. S. J. van der Zant, Nano Lett., 2015, 15, 5569–5573 CrossRef CAS PubMed.
- G. K. Ramachandran, Science, 2003, 300, 1413–1416 CrossRef CAS PubMed.
- H. Song, M. A. Reed and T. Lee, Adv. Mater., 2011, 23, 1583–1608 CrossRef CAS PubMed.
- F. Meng, Y.-M. Hervault, Q. Shao, B. Hu, L. Norel, S. Rigaut and X. Chen, Nat. Commun., 2014, 5, 3023 CrossRef PubMed.
- S. J. van der Molen, Nat. Nanotechnol., 2013, 8, 622–623 CrossRef CAS PubMed.
- C. Jia, J. Wang, C. Yao, Y. Cao, Y. Zhong, Z. Liu, Z. Liu and X. Guo, Angew. Chem., Int. Ed., 2013, 52, 8666–8670 CrossRef CAS PubMed.
- S. Kumar, J. T. van Herpt, R. Y. N. Gengler, B. L. Feringa, P. Rudolf and R. C. Chiechi, J. Am. Chem. Soc., 2016, 138, 12519–12526 CrossRef CAS PubMed.
- J. Li, P. Shen, S. Zhen, C. Tang, Y. Ye, D. Zhou, W. Hong, Z. Zhao and B. Z. Tang, Nat. Commun., 2021, 12, 167 CrossRef CAS PubMed.
- D. Stefani, M. Perrin, C. Gutiérrez-Cerón, A. C. Aragonès, J. Labra-Muñoz, R. D. C. Carrasco, Y. Matsushita, Z. Futera, J. Labuta, T. H. Ngo, K. Ariga, I. Díez-Pérez, H. S. J. Van Der Zant, D. Dulić and J. P. Hill, ChemistrySelect, 2018, 3, 6473–6478 CrossRef CAS.
- S. Cai, W. Deng, F. Huang, L. Chen, C. Tang, W. He, S. Long, R. Li, Z. Tan, J. Liu, J. Shi, Z. Liu, Z. Xiao, D. Zhang and W. Hong, Angew. Chem., Int. Ed., 2019, 58, 3829–3833 CrossRef CAS PubMed.
- L. Herrer, S. Martín, A. González-Orive, D. C. Milan, A. Vezzoli, R. J. Nichols, J. L. Serrano and P. Cea, J. Mater. Chem. C, 2021, 9, 2882–2889 RSC.
- Z. Li, M. Smeu, S. Afsari, Y. Xing, M. A. Ratner and E. Borguet, Angew. Chem., Int. Ed., 2014, 53, 1098–1102 CrossRef CAS PubMed.
- D. Roldan, V. Kaliginedi, S. Cobo, V. Kolivoska, C. Bucher, W. Hong, G. Royal and T. Wandlowski, J. Am. Chem. Soc., 2013, 135, 5974–5977 CrossRef CAS PubMed.
- C. Jia, A. Migliore, N. Xin, S. Huang, J. Wang, Q. Yang, S. Wang, H. Chen, D. Wang, B. Feng, Z. Liu, G. Zhang, D.-H. Qu, H. Tian, M. A. Ratner, H. Q. Xu, A. Nitzan and X. Guo, Science, 2016, 352, 1443–1445 CrossRef CAS PubMed.
- X. Huang and T. Li, J. Mater. Chem. C, 2020, 8, 821–848 RSC.
- E. Leary, C. Roche, H.-W. Jiang, I. Grace, M. T. González, G. Rubio-Bollinger, C. Romero-Muñiz, Y. Xiong, Q. Al-Galiby, M. Noori, M. A. Lebedeva, K. Porfyrakis, N. Agrait, A. Hodgson, S. J. Higgins, C. J. Lambert, H. L. Anderson and R. J. Nichols, J. Am. Chem. Soc., 2018, 140, 710–718 CrossRef CAS PubMed.
- X. Yin, J. Z. Low, K. J. Fallon, D. W. Paley and L. M. Campos, Chem. Sci., 2019, 10, 10733–10739 RSC.
- T. A. Su, H. Li, M. L. Steigerwald, L. Venkataraman and C. Nuckolls, Nat. Chem., 2015, 7, 215–220 CrossRef CAS PubMed.
- R. J. Brooke, D. S. Szumski, A. Vezzoli, S. J. Higgins, R. J. Nichols and W. Schwarzacher, Nano Lett., 2018, 18, 1317–1322 CrossRef CAS PubMed.
- F. Meng, Y.-M. Hervault, L. Norel, K. Costuas, C. Van Dyck, V. Geskin, J. Cornil, H. H. Hng, S. Rigaut and X. Chen, Chem. Sci., 2012, 3, 3113 RSC.
- M. Taniguchi, M. Tsutsui, K. Yokota and T. Kawai, Chem. Sci., 2010, 1, 247 RSC.
- J. L. Zhang, J. Q. Zhong, J. D. Lin, W. P. Hu, K. Wu, G. Q. Xu, A. T. S. Wee and W. Chen, Chem. Soc. Rev., 2015, 44, 2998–3022 RSC.
- I. Franco, C. B. George, G. C. Solomon, G. C. Schatz and M. A. Ratner, J. Am. Chem. Soc., 2011, 133, 2242–2249 CrossRef CAS PubMed.
- T. A. Su, M. Neupane, M. L. Steigerwald, L. Venkataraman and C. Nuckolls, Nat. Rev. Mater., 2016, 1, 16002 CrossRef CAS.
- E. Leary, A. La Rosa, M. T. González, G. Rubio-Bollinger, N. Agraït and N. Martín, Chem. Soc. Rev., 2015, 44, 920–942 RSC.
- M. Kiguchi, T. Ohto, S. Fujii, K. Sugiyasu, S. Nakajima, M. Takeuchi and H. Nakamura, J. Am. Chem. Soc., 2014, 136, 7327–7332 CrossRef CAS PubMed.
- J. S. Meisner, M. Kamenetska, M. Krikorian, M. L. Steigerwald, L. Venkataraman and C. Nuckolls, Nano Lett., 2011, 11, 1575–1579 CrossRef CAS PubMed.
- N. T. Kim, H. Li, L. Venkataraman and J. L. Leighton, J. Am. Chem. Soc., 2016, 138, 11505–11508 CrossRef CAS PubMed.
- C. Tang, J. Zheng, Y. Ye, J. Liu, L. Chen, Z. Yan, Z. Chen, L. Chen, X. Huang, J. Bai, Z. Chen, J. Shi, H. Xia and W. Hong, iScience, 2020, 23, 100770 CrossRef CAS PubMed.
- V. Kaliginedi, P. Moreno-García, H. Valkenier, W. Hong, V. M. García-Suárez, P. Buiter, J. L. H. Otten, J. C. Hummelen, C. J. Lambert and T. Wandlowski, J. Am. Chem. Soc., 2012, 134, 5262–5275 CrossRef CAS PubMed.
- Y. Komoto, S. Fujii, M. Iwane and M. Kiguchi, J. Mater. Chem. C, 2016, 4, 8842–8858 RSC.
- B. Xu, Science, 2003, 301, 1221–1223 CrossRef CAS PubMed.
- A. C. Aragonès, N. L. Haworth, N. Darwish, S. Ciampi, N. J. Bloomfield, G. G. Wallace, I. Diez-Perez and M. L. Coote, Nature, 2016, 531, 88–91 CrossRef PubMed.
- Y.-H. Wang, H. Huang, Z. Yu, J.-F. Zheng, Y. Shao, X.-S. Zhou, J.-Z. Chen and J.-F. Li, J. Mater. Chem. C, 2020, 8, 6826–6831 RSC.
- A. I. Yanson, G. R. Bollinger, H. E. van den Brom, N. Agraït and J. M. van Ruitenbeek, Nature, 1998, 395, 783–785 CrossRef CAS.
- W. Hong, H. Valkenier, G. Mészáros, D. Z. Manrique, A. Mishchenko, A. Putz, P. M. García, C. J. Lambert, J. C. Hummelen and T. Wandlowski, Beilstein J. Nanotechnol., 2011, 2, 699–713 CrossRef PubMed.
- Y. Song and T. Lee, J. Mater. Chem. C, 2017, 5, 7123–7141 RSC.
- C. Tang, L. Chen, L. Zhang, Z. Chen, G. Li, Z. Yan, L. Lin, J. Liu, L. Huang, Y. Ye, Y. Hua, J. Shi, H. Xia and W. Hong, Angew. Chem., Int. Ed., 2019, 58, 10601–10605 CrossRef CAS PubMed.
- O. Adak, E. Rosenthal, J. Meisner, E. F. Andrade, A. N. Pasupathy, C. Nuckolls, M. S. Hybertsen and L. Venkataraman, Nano Lett., 2015, 15, 4143–4149 CrossRef CAS PubMed.
- Y. Chen, H.-C. Wang, Y. Tang, Y. Zhou, L. Huang, J. Cao, C. Tang, M. Zhang, J. Shi, J. Liu, X. Ren, Y.-X. Xu and W. Hong, Chem. Commun., 2021, 57, 1935–1938 RSC.
- Z. Chen, L. Chen, G. Li, Y. Chen, C. Tang, L. Zhang, J. Liu, L. Chen, Y. Yang, J. Shi, J. Liu, H. Xia and W. Hong, Cell Rep. Phys. Sci., 2021, 2, 100329 CrossRef CAS.
- Y. Tang, Y. Zhou, D. Zhou, Y. Chen, Z. Xiao, J. Shi, J. Liu and W. Hong, J. Am. Chem. Soc., 2020, 142, 19101–19109 CrossRef CAS PubMed.
- K. S. Thygesen and K. W. Jacobsen, Chem. Phys., 2005, 319, 111–125 CrossRef CAS.
- B. Capozzi, J. Xia, O. Adak, E. J. Dell, Z.-F. Liu, J. C. Taylor, J. B. Neaton, L. M. Campos and L. Venkataraman, Nat. Nanotechnol., 2015, 10, 522–527 CrossRef CAS PubMed.
- M. H. Garner, H. Li, Y. Chen, T. A. Su, Z. Shangguan, D. W. Paley, T. Liu, F. Ng, H. Li, S. Xiao, C. Nuckolls, L. Venkataraman and G. C. Solomon, Nature, 2018, 558, 415–419 CrossRef CAS PubMed.
- G. C. Solomon, C. Herrmann, T. Hansen, V. Mujica and M. A. Ratner, Nat. Chem., 2010, 2, 223–228 CrossRef CAS PubMed.
- M. Brandbyge, J.-L. Mozos, P. Ordejón, J. Taylor and K. Stokbro, Phys. Rev. B: Condens. Matter Mater. Phys., 2002, 65, 165401 CrossRef.
Footnotes |
| † Dedicated to Professor Kees Hummelen on the occasion of his retirement. |
| ‡ Electronic supplementary information (ESI) available. See DOI: 10.1039/d1tc03506a |
| This journal is © The Royal Society of Chemistry 2021 |

