
 Open Access Article
 This Open Access Article is licensed under a Creative Commons Attribution-Non Commercial 3.0 Unported Licence
Extreme downsizing of spin crossover nanoparticles towards stable colloids in water: a detailed nano-topographic study†
Christina D.
Polyzou
*a,
Ondřej
Malina
 *b,
Michaela
Polaskova
bc,
Manoj
Tripathi
d,
Alan B.
Dalton
d,
John
Parthenios
e and
Vassilis
Tangoulis
*a
*b,
Michaela
Polaskova
bc,
Manoj
Tripathi
d,
Alan B.
Dalton
d,
John
Parthenios
e and
Vassilis
Tangoulis
*a
aDepartment of Chemistry, Laboratory of Inorganic Chemistry, University of Patras, 26504, Patras, Greece. E-mail: chpolyzou@upatras.gr; vtango@upatras.gr
bRegional Centre of Advanced Technologies and Materials, Czech Advanced Technology and Research Institute (CATRIN), Palacký University Olomouc, Šlechtitelů 27, 73 71, Olomouc, Czech Republic. E-mail: ondrej.malina@upol.cz
cDepartment of Experimental Physics, Faculty of Sciences of the Czech Republic, v.v.i., Flemingovo nám. 2, 16610 Prague 6, Czech Republic
dDepartment of Physics and Astronomy, University of Sussex, Brighton BN1 9RH, UK
eInstitute of Chemical Engineering Sciences, Foundation of Research and Technology-Hellas (FORTH/ICE-HT), Stadiou Street, Platani, Patras, 26504, Greece
First published on 15th October 2021
Abstract
The investigation and elaboration of the spin-crossover (SCO) phenomenon in two-dimensional (2D) Hofmann-type nanosized SCO materials and the size-reduction effect on the cooperativity and thermodynamic properties of the nanoparticles are still in progress. Liquid phase exfoliation (LPE) as a top-down experimental protocol for the fabrication of 2D SCO atomically thin nanosheets is also an underexplored area of research. Given the increasing scientific interest for 2D nanosheets and their unique thickness-dependent electronic properties, the above-mentioned study is of utmost importance. In this context, we present a detailed nano-synthetic study based on the reverse-micellar synthesis of [FeII(2-mpz)2Ni(CN)4] and further rationalization of this method followed by LPE experimental protocols in order to synthesize nanoparticles with well-controlled sizes and shapes. The role of concentration and reaction temperature is investigated with respect to the size, dispersion, morphology and magnetic properties of the nanoparticles. It was found that for specific values of these parameters, the synthesis of nanoparticles is controlled and the final products are nanoparticles with an agglomerated architecture. According to an extensive atomic force microscopy (AFM) nano-topographic study, this agglomeration is best described as right truncated thick prisms of [FeII(2-mpz)2Ni(CN)4] stacked in a vertical position on a rectangular base plate. During the LPE procedure and by prolonging the sonication period, the thick prisms are detached and, eventually, exfoliated to atomically thin right prisms of height ∼1 nm. Magnetic measurements revealed that the size reduction leads to the progressive downshift of abrupt thermal hysteresis with two-step SCO transition temperatures of the bulk [FeII(2-mpz)2Ni(CN)4] material to a gradual incomplete SCO behavior of an almost single-layer 2D [FeII(2-mpz)2Ni(CN)4] nanosheet.
Introduction
The ability of octahedral FeII ions to switch from an electronic high spin (HS, t2g4eg2) to a low-spin (LS, t2g6eg0) state triggered by external stimuli such as temperature, pressure, light irradiation, pulsed magnetic field and guest molecules has led iron(II) to spin-crossover (SCO) and thus to a class of well-known switchable materials.1–14 SCO materials have been widely used in potential applications such as multifunctional materials,15 new generation memory devices,16 and various applications due to their molecular bistability associated with the SCO phenomenon.17 Material downsizing focuses on these goals even if there are reports claiming suppression of magnetic hysteresis.18,19 Research in the frames of size-reduction effect on cooperativity and relevant physical properties is still in progress.Nanosized SCO materials20,21 are recently at the forefront of research community due to the emerging challenges in order to preserve the bistability and cooperative spin transition properties of the primary bulk material. SCO nanoparticles are mainly classified into three categories: the so called “molecular complexes” consisting of mononuclear complexes with supramolecular interactions, the 1D coordination polymers with a general formula of the type [FeII(4R-1,2,4-Trz)3]X2·nH2O (R = H, NH2, X = BF4−, ClO4−)22–31 and the 2D or 3D Hofmann-type coordination polymers.
The elaboration of the SCO behavior of the latter category has been extensively discussed especially for 3D Hofmann-type coordination polymers.32–40 In our recent article,41 we reviewed the various synthetic approaches for the preparation of nanoparticles with formula {Fe(pz)[M(CN)4]} (M = Ni, Pd, Pt) and their magnetic behavior upon size reduction which is different than those in the bulk form. Boldog et al.19 and Volatron et al.18 used a reverse micelle technique for preparing w/o microemulsions with anionic surfactant sodium bis-(2-ethylhexyl)sulfosuccinate (NaAOT) as the stabilizer and octane as the organic phase. By varying the concentrations, constants ω and temperature of the reactions, the formation of different sizes of nanoparticles was evident. For a smaller particle size, the smaller hysteresis widths appear with a shift of the critical temperatures to lower values. Peng et al.42 prepared particles with a wide range of sizes between 12 and 110 nm, considering the concentration and mixing rate of the two microemulsions as the varying parameters, as well as ultra-small nanoparticles of 2 and 3 nm also by a reverse micelle method and re-opening of their hysteretic behavior. Larionova et al.43 introduced a different synthetic method for the synthesis of ultra-small nanoparticles with a hysteresis width at 10 K using polysaccharide chitosan as the matrix and pioneered the way for the alternative processes with various surrounding matrices such as calixarene,44 chitosan and alginate beads.45
Nevertheless, limited research has been implemented in downsizing 2D SCO coordination polymers. 2D Hofmann-type coordination polymers with the general formula [FeII(L)2M(CN)4] (M = Ni, Pd, Pt) where L represents azo-ligands such as (R)-pyridines (R = Cl, F, Br, Me),46–48N-thiophenylidene-4H-1,2,4-triazol-4-amine (thtrz),49 2-fluoropyrazine,50 (E)-2-(((4H-1,2,4-triazol-4-yl)imino)methyl)phenol) (saltrz),51 4-phenylpyridine (4PhPy),52,53 4-styrylpyridine (stpy),54 4-(2-phenylethyl)pyridine (pep),54,55 (E)-1-phenyl-N-(1,2,4-triazol-4-yl)methanimine (bztrz),56 (E)-1-phenyl-N-(1,2,4-triazol-4-yl)methanimine (bztrz),57 4-tetrathiofulvalenylcarboxamidopyridine (ttf-adpy),58 3-phenylazopyridine (3-PAP),59 4-phenylazopyridine(4-PAP),59 2-methylpyrazine (2-mpz),60 3-aminopyridine (NH2py),61 (E)-3-phenyl-N-(4H-1,2,4-triazol-4-yl)prop-2-yn-1-imine (proptrz),62 4-[(E)-2-(5-methyl-2-thienyl)vinyl]-1,2,4-triazole (thiome),63 isoquinoline (isoq),64 4-(2-pyridyl)-1,2,4,4H-triazole (trz-py),65,66 and 4-(1Hpyrazol-3-yl)pyridine (Hppy),67 which are known only in their bulk forms.68
Unfortunately, the database of 2D SCO nanoparticles is still in its infancy with a limited number of examples so far to be reported in the literature. The first example was the 2D coordination polymer with formula [Fe(3-Fpy)2M(CN)4] (M = Ni, Pd, Pt) prepared in the form of nanocrystals as well as nanoparticles almost one decade ago by Martinez et al.69 The methods used for their synthesis were focused on the reverse micelle technique and polymer coating. Influences of these approaches on size, morphology and SCO properties were observed correlating the reverse micelle technique with surfactant-free nanocrystals of average length of 400 nm. The use of water-soluble polymer polyvinylpyrrolidone (PVP) provided smaller nanoparticles in the range between 70 and 200 nm. The size-reduction effect on the SCO properties was apparent as large nanocrystals present a quasi-complete first-order spin transition around 200 K, whereas the PVP-coated nanoparticles undergo continuous second-order spin transition at around 160 K.
A recent report by Yang et al.70 has described the nanostructures of a 2D coordination polymer with formula [Fe(py)2Ni(CN)4] synthesized by the reverse micelle method. The variation in the synthetic parameters such as the reaction time, temperature and [H2O]/[surfactant] ratio resulted in different nanoparticle morphologies (nanoplates, nanocubes, nanosheets, and nanoboxes). SCO behavior is considered to be morphology dependent as the hysteresis widths decrease from nanoplates to nanoboxes. The formation mechanism of the diverse forms of nanocrystals was proposed based on the XRD technique and intrinsic characteristics of the product.
Our group is also interested in the field of SCO materials and has reported recently71 the preliminary results on the downsizing effect on a 2D Hofmann-type SCO coordination polymer based on 2-methylpyrazine. The synthesis and hysteretic SCO behavior of the [FeII(2-mpz)2Ni(CN)4] polymer were studied both in the bulk microcrystalline powder form and nanoparticles. Magnetic susceptibility measurements showed that as the size decreases from the bulk material to nanoparticles the cooperativity associated with the SCO reduces and evidently the thermal hysteresis width is shortened. A detailed AFM topographic study revealed a nano-growth relationship between the height and length of the nanoparticles.
One of the most popular experimental protocols for the fabrication of coordination nanosheets consisting of both metal centers and ligands is the LPE method.72 The main aspects of this method are the ultrasonication and an appropriate solvent useful to enhance the interlayer separation of bulk crystalline layered materials. In order to evaluate the colloidal stability of the final dispersion the Tyndall scattering is required. The very first example of the LPE method applied in a metal–organic framework (MOF) was reported by Zamora and co-workers.73
Y.-H. Luo et al.74 describe the exfoliation via freeze–drying of a bulk van der Waals paramagnetic material with formula {[Fe(1,3-bpp)2(NCS)2]2 (1,1,3-bpp = 1,3-di(4-pyridyl)-propane)} into single-layered 2D nanosheets exhibiting a two-step SCO behavior. The two-step magnetic response of 2D nanosheets is considered the first reported in the literature and is attributed to the ultrahigh surface sensitivity derived from the presence of different degree van der Waals interactions between the stacked heterostructures. The exfoliation of a 2D SCO polymer with formula [Fe(L1)2](ClO4)2 (L1 = tris(2-(1H-tetrazol-1-yl)ethyl)amine) using the LPE method was reported by Suarez-Garcia et al.75 An effective delamination of the crystals, after 12 hours of sonication, was achieved by producing flakes with thickness, down to 1–2 nm.
Herein we present an extended work on the nanosynthesis of [FeII(2-mpz)2Ni(CN)4] using reverse micelle methods investigating the role of concentration and reaction's temperature in the size, dispersion and morphology of the nanoparticles and subsequently in their SCO magnetic behavior. The application of the LPE method is investigated as a promising tool for the formation of atomically thin nanoparticles and stable colloids while atomic force microscopy (AFM) was used for the first time to probe the nano-topographic characteristics of the nanoparticles at different stages of the exfoliation process. The exfoliated material retains its chemical composition as well as its stable colloidal suspensions for weeks. An alternative synthetic procedure for the synthesis of the bulk material will also be discussed correlating their SCO magnetic response with the results from our previous work.71 Their physical and structural characterization was carried out with thermogravimetric analysis (TGA), infrared (IR) and UV-Vis (UV-Vis) spectroscopies and powder X-ray diffraction (p-XRD). Finally, the SCO behavior was determined using magnetic and differential scanning calorimetry (DSC) studies.
Experimental section
Materials and procedures
All manipulations were performed under aerobic conditions using reagents and solvents (Alfa Aesar, Sigma Aldrich, Serva) as received. The ligand 2-methylpyrazine (2-mpz) and the iron(II)tetrafluoroborate hexahydrate salt, Fe(BF4)2·6H2O, were purchased from Alfa-Aesar, while both the potassium tetracyanonickelate(II) hydrate salt, K2[Ni(CN)4]·xH2O and n-hexane were purchased from Sigma Aldrich. Sodium bis-(2-ethylhexyl) sulfosuccinate (NaAOT) was obtained from Serva and used without further purification. The deionized water used for the synthesis was deoxygenated by simultaneous sonication and argon bubbling for 1 h. The synthesis of the bulk materials 1 and 2 and nanoparticle 4 has been described in ref. 71.Synthesis of bulk material 3
The slow diffusion technique was used in the preparation of compound 3: liquid 2-mpz (74 μL, 0.81 mmol) was dissolved in 30 mL of distilled water and then was filled in two vials where the smaller one had been placed inside the larger one. Solid Fe(BF4)2·6H2O (0.091 g, 0.27 mmol) was dissolved in 1 mL of distilled water and then the resulting colourless solution was injected into the smaller vial. Similarly, solid K2[Ni(CN)4]·H2O (0.070 g, 0.27 mmol) was dissolved in 1 mL of distilled water resulting in a yellow solution. Then, the solution was injected into the larger vial, and the vial was sealed and left undisturbed at room temperature. Over a week, gradual precipitation of yellow-orange powder was observed in both the inner and outer part of the smaller vial. The solid was filtered and dried under vacuo.Synthesis of nanoparticles 5 and 6
![[thin space (1/6-em)]](https://www.rsc.org/images/entities/char_2009.gif) 000 rpm at ∼7 minutes.
000 rpm at ∼7 minutes.
000 rpm at ∼7 minutes.
000 rpm at ∼7 minutes.
Exfoliation process
1 mg of nanoparticle 6 was dispersed in 10 mL of different solvents such as water, methanol (MeOH), acetone (Me2CO), ethanol (EtOH), chloroform (CHCl3), dimethylformamide (DMF), and tetrahydrofuran (THF). The mixture was sonicated in a sonicator bath at 45 KHz for 2 h at 30 °C and then left undisturbed for 3 days. All the dispersions were characterized by the Tyndall effect and only the acetone dispersion revealed a successful delamination of the nanocrystals. After this period, the colloidal suspension was centrifuged (2000 rpm × 2 min) in order to separate the unexfoliated nanoparticles remaining in the pellet and the yellow sediment was removed while the supernatant was isolated. The supernatant was left undisturbed for almost three weeks. Then centrifugation of the colloidal suspension was carried out (2000 rpm × 2 min) and “traces” of yellow sediment were removed once again. The supernatant was sonicated for a second time for 2 h at 30 °C and then left undisturbed for 3 days. A small aliquot of the supernatant was removed for deposition on a SiO2 film by using a drop casting method (6exf) for the AFM nano-topographic study. It was possible to scale up the previous process to samples of 10 mg of nanoparticle 6 in 100 ml of acetone. In order to obtain dried unexfoliated nanoparticles 6exf, acetone was evaporated under vacuum conditions and the obtained powder was used for FT-IR, p-XRD and magnetic measurements. The powder was easily redispersed in water (remaining stable for over a month without any evidence of precipitation) and the colloidal suspension was used for DLS and UV-Vis measurements.Physical measurements
Elemental analyses (C, H, N) were performed using the in-house facilities of the University of Patras (Greece). IR spectra (400–4000 cm−1) were recorded using a PerkinElmer 16PC FT-IR spectrometer with samples prepared as KBr pellets. Thermogravimetric analysis (TGA) was performed using a SETA-RAM SetSys-1200 and carried out at a heating rate of 10 °C min−1 under a N2 atmosphere. UV-Vis absorption spectra were recorded between 280 and 1100 nm by using a PGS-2 Carl Zeiss spectrometer.The powder X-ray diffraction (PXRD) measurements were performed at room temperature on a Malvern Panalytical X’Pert PRO diffractometer with focusing Kα1 geometry. Polycrystalline samples were loaded into 1 mm borosilicate glass capillaries while the X-ray tube was operated at 45 kV and 40 mA. The incident-beam side (CuKα1 radiation, λ = 1.54056 Å) is equipped with a focusing X-ray mirror, a 0.5° fixed divergence slit, 0.5° anti-scatter slits and 0.04 rad Soller slits, while on the diffracted-beam side, the system was configured with 0.04 rad Soller slits and a PIXcel1D detector with anti-scatter shielding. Four scans were performed in Debye–Scherrer mode, with a step size of 0.0066° on a spinning stage (∼300 rpm), within a 2θ range of 4.0–90.0°. No radiation damage was observed even after 5 h of measurement, therefore all scans were merged together to increase the counting statistics.
Thin-films prepared with the drop-casting technique using a 3 μL droplet of nanoparticle suspension in acetone on a SiO2 substrate were examined using a field emission scanning electron microscope (FE-SEM, FEI InspectTM F50). The TEM study was performed utilizing a FEI CM20 TEM operating at 200 kV. The TEM specimens were prepared by drop casting a 3 μL droplet of nanoparticle suspension in acetone on a carbon coated Cu TEM grid. The size of the particles was determined by ‘‘manual counting’’ using ImageJ software (https://imagej.net).
The direct-current (DC) magnetic susceptibility measurements were carried out on powder samples using a physical-property measurement system (PPMS, Quantum Design) at 2–300 K with a rate of 0.5 K min−1 under an applied dc magnetic field of 1000 Oe. The experimental data were corrected for diamagnetism and the signal of the sample holder and the Pascal constants were used for the diamagnetic corrections.
Differential scanning calorimetry (DSC) measurements were carried out in a N(g) atmosphere using a DSC (Q100, TA Instruments, USA) instrument. Aluminium hermetic pans were used to encapsulate 5–7 mg of sample. The pans were purged with nitrogen at a rate of 50 mL min−1 and liquid nitrogen was used for cooling. Initially, the samples were cooled down from ambient to 183 K at the maximum permissible rate by the instrument. Then the samples were subjected to two successive thermal regimes; (a) heating from 183 K to 213 K at a rate of 10 K min−1 and (b) cooling to 183 K at the same rate. At the beginning and end of each heating and cooling run, the sample was held isothermally for 5 min.
DLS measurements were performed using a ZetaSizer Zen3600 (Malvern Instruments). The sample was loaded into a disposable micro-cuvette and measured at 25 °C. The intensity size distribution or the Z-average diameter was obtained using the cumulant analysis with a repeatability of 1.6% while AFM characterization was performed in samples 6 and 6exf. In particular, the surface topography images of the substrate under ambient conditions were acquired using a Bruker Dimension Icon with PF-QNM (PeakForce-Quantitative NanoMechanical) mode during the stage 1 of the exfoliation process. Cantilevers are calibrated by preceding thermal tune for resonance frequency and stiffness, which are measured as 0.4 N m−1 and 70 kHz for topography and adhesion measurements. Surface topography images of the substrate after the stage 2 of the exfoliation process were acquired by using a 2FSM Nanoview 2000 (FSM-precision, China) operating in tapping mode. The cantilever used was beam shaped silicon supplied by Budget sensors with a nominal force constant of 48 N m−1 and a tip radius of ∼10 nm. Image processing was carried out using open source software: WSxM version 3.1 (Nanotec Electronica, Madrid, Spain) and Gwyddion version 2.46 (CMI, Brno, Czech Republic).
Results and discussion
Synthetic comments and nanoparticle growth
Table 1 summarizes the synthetic characteristics of the synthesized bulk compounds 1,712,71 and 3 and nanoparticles 4,715 and 6. Bulk compounds 1 and 2 were synthesized at room temperature in two different ratios with one-pot reactions while compound 3 was synthesized with the liquid diffusion technique. The latter method was initially applied as a promising method for the crystallization of [FeII(2-mpz)2Ni(CN)4] but unfortunately ended up in the isolation of powder form. Regarding the synthesis of nanoparticles, a series of experiments employing the reverse micelle method technique were initially carried out in various reaction ratios (1:1:3, 1:1:6, and 1:1:10) and concentrations (0.05 M, 0.1 M, 0.13 M, and 0.15 M) which finally resulted in unsuccessful attempts due to the very large distribution and size of the nanoparticles as well as for their indefinable shape (Fig. S1, ESI†). Table S1 (ESI†) presents the size and distribution of the synthesized nanoparticles in various reaction-ratios and concentrations. It was found that using a reaction ratio of 1:1:15 and a concentration of 0.05 M the synthesis of nanoparticles is controlled and the final products are nanoparticles with well-defined shapes, while the distribution of sizes is narrowed down.
| Method | Ratio | T inc | T mix | Chemical formula |
|---|---|---|---|---|
| a Microemulsion incubation temperature. b Microemulsion mixing temperature. c Liquid diffusion. d Reverse Micelle method. | ||||
| One-pot | 1:1:3 |
— | — | [FeII(2-mpz)2Ni(CN)4] (1)71 |
| One-pot | 1:1:15 |
— | — | [FeII(2-mpz)2Ni(CN)4]·(2-mpz)0.2 (2)71 |
| L. D.c | 1:1:3 |
— | — | [FeII(2-mpz)2Ni(CN)4]·(2-mpz)2 (3) |
| R.M.M.d | 1:1:15 |
300 K | 300 K | [FeII(2-mpz)2Ni(CN)4]·(2-mpz)0.8 (4)71 |
| R.M.M. | 1:1:15 |
278 K | 300 K | [FeII(2-mpz)2Ni(CN)4]·(2-mpz)0.5 (5) |
| R.M.M. | 1:1:15 |
250 K | 287 K | [FeII(2-mpz)2Ni(CN)4]·(2-mpz)0.2 (6) |
In order to reduce further the size of the nanoparticles we involved two new temperature dependent experimental parameters, the incubation temperature (Tinc) of the microemulsions and the temperature of the mixing (Tmix) of microemulsions. When these two temperatures are close to RT the nanoparticles 4 were obtained with well-defined shapes (plates) and a distribution of sizes 300–600 nm and 50–150 nm discussed in detail elsewhere.71 When the incubation temperature is close to 4 °C (overnight period) and the final mixing of the microemulsions is close to RT the size of the nanoparticles is reduced further (250–350 nm) as well as their distribution. With this experimental protocol nanoparticles 5 were obtained.
Decreasing the incubation temperature down to −20 °C (1 hour period) and further mixing the microemulsions at temperatures lower than RT (14 °C) provided an efficient experimental protocol for the production of nanoparticles 6. Further attempts to decrease the size of the nanoparticles were unsuccessful.
The detailed composition of all the compounds synthesized in the bulk form (1–3) as well as nanoparticles (4–6) was determined by elemental (Table S2, ESI†) and TGA (Fig. S2, ESI†) analyses. The slow diffusion technique used for the preparation of the bulk material 3 (instead of the fast one-pot method used for 1 and 2) seems to drastically change the crystal packing of the 2D [FeII(2-mpz)2Ni(CN)4] polymer by increasing the number of 2-mpz molecules in the lattice from zero (1) and 0.2 (2) to two molecules (3). The latter conclusion is confirmed by the TGA analysis (Fig. S2, ESI†). For the case of the nanosynthetic protocols the downsizing procedure reduced the percentage of the 2-mpz molecules in the lattice from 0.8 molecules (4) to 0.5 molecules (5) and 0.2 molecules (6) verified by the TGA analysis (Fig. S2, ESI†). It should be mentioned that all products described in Table 1 are free of water molecules in the lattice.
Fig. S3a (ESI†) shows the characteristic view of the pillared layer of the diamagnetic isostructural analogue [ZnII(2-mpz)2Ni(CN)4] in the ac plane and in Fig. S3b (ESI†) are shown the interacting layers along the b axis. The chemical structure of the latter compound was characterized by single-crystal X-ray diffraction as the crystallization of the FeII analogue was proven impossible. However, the comparison of the theoretical p-XRD pattern of the ZnII analogue with the experimental patterns of FeII analogues verified that these structures are isostructural.71 According to the crystallographic study, discussed elsewhere,71 the FeII site is in a slightly distorted octahedral geometry occupied by four equatorial N atoms of the [Ni(CN)4]2− moiety and two axial N atoms of the two 2-mpz ligands.
Fig. 1a shows the SEM images of nanoparticles 5 and 6 deposited on Si films after dispersion in acetone for 10 minutes of sonication while Fig. 1c and d show the TEM images of 5 and 6 nanoparticles verifying their morphological characteristics. Concerning the nanoparticles 5 well-shaped plates are formed with distinctive square faces. Further verification of the distribution and size was obtained from TEM images shown in Fig. 1c. For the case of nanoparticles 6 an interesting aggregation form appeared which is shown in Fig. 1b. Inspired by the work of Y.-H. Luo et al.74 who also noticed this peculiar aggregation form of curly or vertically stacked 2D building blocks we designed a facile LPE method (described before) for an effective exfoliation of nanoparticles 6 into single-layered 2D nanosheets in order to explore the extreme downsizing possibility of this system.
 | ||
| Fig. 1 SEM images of nanoparticles 5 (a) and 6 (b) deposited on thin films prepared with the drop casting technique. TEM images of nanoparticles 5 (c) and 6 (d). | ||
AFM nano-topographic study
The successful exfoliation of ultrathin nanosheets (6exf) was examined in detail using AFM microscopy. Concerning the morphology of nanoparticles 6 before the exfoliation procedure an AFM topographic analysis vis-a-vis with SEM imaging is presented in Fig. 2. In particular Fig. 2a and b show a characteristic ensemble of nanoparticles 6. Each of them is comprised of a rectangular base plate either flat or inclined with respect to the flat substrate. On top of that, thinner folded or crumbled plates are grown. The folds correspond to the brighter portions of the images. In Fig. 2c, an AFM topography image of a similar ensemble of nanoparticles 6 with base plates is presented. The dimensions of the plates are similar for all nanoparticles of about 500 × 700 nm while thinner plates are clearly grown from the inclined base. By analyzing the height profile 1 (Fig. 2f) of the base plate of the individual nanoparticle 6 (Fig. 2d) one can identify the layered structure of the base. In particular, it consists of two layers, a lower layer with a thickness of about 80 nm (Fig. 2f) and an upper layer with a prismatic shape. The upper surface is inclined with a slope of about 250 nm μm−1 with respect to the substrate surface. The thinner plates are grown from the inclined surface of the prismatic plate (Fig. 2e) and appear with rounded edges which correspond to folds similar to those shown in SEM images (brighter portions). The profile 2 shown in Fig. 2d is used to estimate the fold thickness from the graph in Fig. 2f which is found to be around 60 nm. Fig. S4 (ESI†) presents two nanoparticles with thinner plates grown almost vertically with respect to the base plate and therefore their thickness can be quantified more precisely. In Fig. S4c (ESI†) two relevant height profiles are plotted from which the width of these plates were found to be in the range from 60 to 90 nm. | ||
| Fig. 2 (a) and (b) SEM images of different ensembles of 6 nanoparticles, (c) A two dimensional topography AFM imaging of a different ensemble (Scale bar: 500 nm), (d) Zooming the nanoparticle into the white line rectangular of (c) (Scale bar: 200 nm), (e) the corresponding 3D representation and (f) the height profiles 1 and 2 shown in (d). The layered structure in profile 1 is also shown. | ||
The nano-topographic behavior of the nanoparticles is changed dramatically after the exfoliation process. In Fig. 3a and b several individual nanoparticles 6exf of various thicknesses can be identified. All nanoparticles have the same shape of a right prism consisting of two almost identical right triangular prisms. In Fig. 3a and b right prism nanoparticles 6exf with heights (thickness) 1–3 nm are shown, while in Fig. 3b the thicker nanoparticles up to 10 nm have the shape of a right truncated prism (inset in Fig. 3b, lower panel). The truncation of the upper face of the prism is identified by an inclined profile line as shown in profile line 2 of Fig. 3b while its 3D counterpart is presented in Fig. S5 (ESI†). Additional right prism nanoparticles 6exf with various thicknesses are presented in Fig. S6 (ESI†). It is worth noting that in the recorded AFM scans all nanoparticles appeared with the same orientation (Fig. 3, S4, S5 and S6, ESI†). We discovered that the thinnest right prism nanoparticle among all those measured is of height ∼1 nm. It is thus concluded that this is the building block of thicker nanoparticles found in our study. In particular, for the thicker nanoparticles, we propose a building model of epitaxial stacking of several building blocks as shown schematically in the inset of Fig. 3a (lower panel). This assumption is supported by the arrangement in space of nanoparticles such as those enclosed in the white dashed line rectangle of Fig. 3b. These nanoparticles resemble a pack of playing cards laid out onto a plane substrate. A 3D magnification of this region is shown in Fig. S5b (ESI†) along with the values of characteristic steps of about 2 nm. Regarding the upper face surface morphology, we found that it is not flat with a pattern resembling the surface of the thin nanoparticles (h ∼ 1 nm) shown in Fig. 3b (e.g. profile 1). Apart from the heights of the right prisms, we measured the dimensions of their 4-sided polygonal base which can be equivalently represented by two equal right triangles with a common hypotenuse (Fig. S5c, ESI†). We measured the side dimensions and angles of triangles in five different nanoparticles 6exf shown in Fig. S7 (ESI†) and found that the mean lengths of the two right sides x and y are 0.66(7) μm and 0.29(2) μm respectively leading to a mean length of the hypotenuse of 0.72(6) μm. The two angles θ1 and θ2 of the right triangles were found to be 24(3)° and 66(6)°, respectively. Consequently, the mean area of the right prism base is 0.106 (11) μm2 and the volume ranges from 423 to 1552 nm3. The details of these calculations are summarized in Table S3 (ESI†) and are presented in the supplementary data. Conclusively it appears that during the exfoliation procedure, the agglomerated right truncated thick prisms stacked in a vertical position on a rectangular base plate (6exf) are detached and eventually, by prolonging the sonication period, are exfoliated to atomically thin right prisms of height ∼1 nm (6exf).
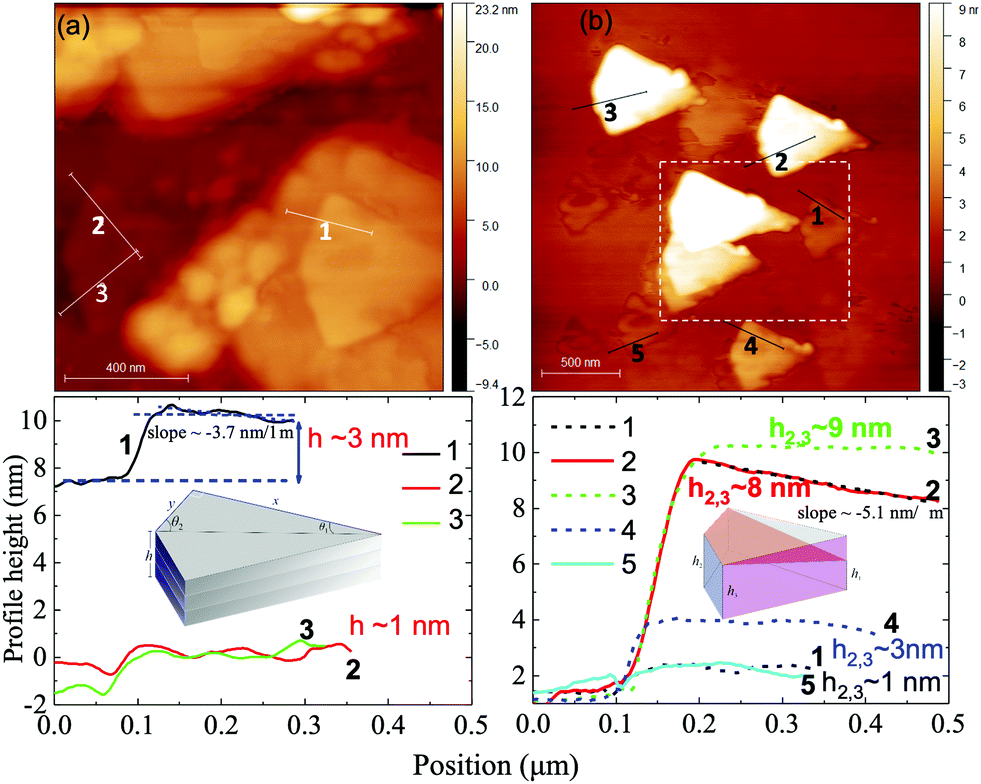 | ||
| Fig. 3 (a) and (b) upper panel: Two-dimensional AFM images showing individual nanoparticles of various thicknesses. Lower panel: Height profiles corresponding to the solid lines in the AFM image. The insets show the schematics of (a) a layered structure of right prisms with height h and (b) truncated right prisms with heights h1 (the minimum), and h2 = h3 (intermediate and maximum respectively) [see the ESI†]. | ||
Structural characterization
The IR spectra and p-XRD patterns of compound 3 and nanoparticles 5, 6 and 6exf are depicted in Fig. S8 and S9 (ESI†), respectively, which are in good agreement with the characterization of the already published compounds 1 and 2 and nanoparticle 4.71 Fig. S9 (ESI†) depicts also the gradual decrease of the peak intensity (3 → 5 → 6) attributed to the (002), (004) and (006) crystallographic planes. For the case of (002), almost complete disappearance of the peak is observed for nanoparticles 6exf indicating the presence of almost atomically thin 2D nanosheets.70 Fig. S10 (ESI†) shows the UV-Vis spectra in ethanol solution for the ligand and nanoparticles 4, 5 and 6. The bands presented around the region of 280 nm to 310 nm both in the ligand and nanoparticles’ spectra are attributed to the π–π* transitions of the ligand, while the absorptions at the region around 460 nm to 490 nm are assigned to the metal-to-ligand charge transfers between high spin FeII and 2-mpz. Fig. S11 (ESI†) presents the comparison of the UV-Vis spectra in water between nanoparticle 6 and its exfoliated fragments 6exf revealing no changes in the structure. No aging phenomena appeared on the structure/properties of the nanoparticles 6exf after one month, according to IR and UV-Vis spectra as well as p-XRD patterns (Fig. S12–S14, ESI†).The overall stability of the colloidal water dispersion was confirmed by observing the Tyndall effect presented in Fig. S15 (ESI†). Fig. S16 (ESI†) shows the DLS measurement for the colloidal aqueous dispersion of the exfoliated species 6exf. In the logarithmic scale there is a Gaussian peak located at 250 ± 8 nm showing its size distribution. Although DLS provides the hydrodynamic radius, Rh, of a hard sphere, which is not the actual morphology of the exfoliated sheets, it can be treated as an indicative value of the apparent size of the 2D sheets in the water dispersion. The same technique provides two other important parameters: (a) the polydispersity index (PDI), with a value of 0.21 suggesting a narrow particle size distribution and (b) a statistical distribution of the ζ-potential values measured within single nanoparticles. The mean ζ-potential value is estimated at −24.9 mV and is depicted in Fig. S17 (ESI†) declaring the surface charge density of the exfoliated species 6exf. The large negative value is also a direct proof of the excellent quality of the colloids in water.
Downsizing effect on the magnetic properties
The thermal dependence of the χMT product for bulk materials 1,71271 and 3 as well as for nanoparticles 4,715 and 6 is shown in Fig. 4 and 5, respectively, while the first derivative plots of the susceptibility curves are given in Fig. S18 (ESI†). As has been previously reported,71 upon cooling, abrupt thermal hysteresis with two-step SCO takes place for bulk materials 1 and 2 (Fig. 4, upper row). At 300 K the value of the χMT product is equal to 3.28 and 3.52 emu K mol−1 for 1 and 2, respectively which is typical for FeII in the HS state. The two steps appear at critical temperatures Tc1↓ = 182.5 K, Tc1↑ = 194 K and Tc2↓ = 169.5 K, Tc2↑ = 185 K for 1 with hysteresis loops ca 13 K and 15 K, respectively, while for 2 they appear at critical temperatures Tc1↓ = 184 K, Tc1↑ = 197 K and Tc2↓ = 173 K, Tc2↑ = 191.5 K with hysteresis loops ca. 13 K and 18 K, respectively (Fig. S17, ESI†). | ||
| Fig. 4 (upper row) Temperature dependence of the magnetic susceptibility data in the form of χMT (cm3 mol−1 K) vs. temperature (K) for the bulk 2D materials 1, 2, and 3 and the nanoparticles 4, 5, and 6. (middle row) The downsizing effect on the morphology of the SCO particles is shown graphically in the middle blue arrow (from left to right): almost tetragonal micro-crystals 3–5 μm (bulk 2D materials 1–3), two distinctive size distributions 300–600 nm and 50–150 nm of nano-plates (nanoparticles 4), a narrow particle's size distribution of nano-plates in the range of 250–350 nm (nanoparticles 5) and prismatic type formations where on top of those, thinner folded or crumbled plates are grown (nanoparticles 6). (lower row) Structural and AFM topography of the SCO particles (from left to right): View of the 2D-pillared interacting layers of the bulk compound 1 (see the text for details), AFM tomography of two SCO nanoparticles belonging to different particle's size distributions (nanoparticle 4), AFM tomography of nanoparticles (5), and AFM tomography of nanoparticles 6 (see the text for details). | ||
 | ||
| Fig. 5 (left) Comparison of the thermal dependence of the χMT product for nanoparticles 6 and 6exf with a rate of 0.5 K min−1. (upper right) Magnification of the high temp susceptibility data and (down right) the first derivatives of the susceptibility curves (solid lines for the heating and cooling modes of the nanoparticles 6, red cycles connected with blue line for the exfoliated 6exf). | ||
In the case of bulk material 3, upon cooling, an abrupt thermal hysteresis was observed with a pronounced shifted spin-transition to a higher temperature region. Quite remarkably, the two SCO steps, observed in compounds 1 and 2, disappeared and it seems that the different synthetic method applied for the isolation of [Fe(2-mpz)2Ni(CN)4] affects strongly the polymer's lattice and consequently its magnetic response. The presence of two 2-mpz lattice molecules in compound 3 (Table 1) seems to enhance the electron–lattice coupling effect leading to this shifted spin-transition to a higher temperature region while, quite surprisingly, the two SCO steps disappeared. At 300 K the value of the χMT product is equal to 3.49 emu K mol−1 for 3 which is typical for FeII in the HS state. The step, in the case of 3, appears at higher critical temperatures Tc↓ = 193 K and Tc↑ = 208 K with a wider hysteresis loop ca 15 K. The value of the χMT product at low temperatures is equal 0.12 emu K mol−1 for 3 indicating that spin transition is practically complete. Based on the above mentioned arguments, the presence of a small percentage (0.2) of 2-mpz molecules in the lattice of compound 2 (Table 1) seems to influence its magnetic behavior providing a moderate shift of the transition temperatures to higher values in comparison to compound 1 which is free of any lattice molecule.
Comparison of the magnetic data between bulk materials and nanoparticles 4, 5 and 6 showed different magnetic responses. Based on the literature of 2D SCO nanoparticles–nanocrystals19,43,76,77 it is difficult to rationalize the influence of composition of the compound on the cooperativity of the SCO phenomenon. Having in mind that the SCO is by origin a molecular phenomenon, its actual demonstration is adjusted by solid-state effects based on the special characteristics of each material. Factors such as the size of the micro-nano particles, the crystallinity degree, and the percentage of an amorphous phase may influence the critical temperatures of the SCO phenomenon, the symmetrical/asymmetrical features of the actual hysteresis, the multistep hysteretic behaviour and the molar fraction of inactive HS centres. Corroborating to the previous arguments, our magnetic findings preclude any influence of the percentage of 2-mpz lattice molecules in nanoparticles 4, 5 and 6 (0.8, 0.5 and 0.2, respectively) on their hysteretic behavior. In all cases (4, 5, and 6) there is no noticeable shift of the critical temperatures related to the number of 2-mpz lattice molecules. The actual hysteretic characteristics of nanoparticles 4, 5, 6 are related to size reduction effects. More explicitly the observed decrease of the cooperativity, wipeout of the hysteresis and the incomplete transformation of the SCO phenomenon are related mainly to the reduction in the number of interacting metallic centers.
Nanoparticles 4 adopted a platelet morphology with distinctive almost square faces and two size distribution regions, (a narrow one between 50 and 150 nm and a wider one between 300 and 600 nm), and it has been previously reported that upon cooling a gradual spin-transition with no step takes place. The χMT product at 300 K is equal to 3.44 emu K mol−1, while the transition temperatures are Tc↓ = 188 K and Tc↑ = 194 K (Fig. 4, Fig. S18, ESI†).
The further reducing effect of the nanosheets resulted in the preparation of well-shaped nanoparticles 5 with distinctive square faces and size distribution between 250 and 350 nm. The magnetic study emphasizes on their impressive gradual two-step SCO behavior (Fig. 4, and Fig. S18, ESI†) which is to the best of our knowledge the second example of multi-step behavior in nanoscale74 and the first one reported for Hofmann-type nanoparticles. The hysteretic behavior is still presented in the nanoparticles. The χMT product at 300 K is equal to 3.42 emu K mol−1, while the critical temperatures for 5 are estimated to be Tc1↓ = 188 K, Tc1↑ = 195 K and Tc2↓ = 177 K, Tc2↑ = 173 K with hysteresis loops ca. 7 K and 4 K, respectively. Although the multi-step SCO behavior of 2D coordination polymers in microscale has been adequately interpreted,78,79 the presence of similar behavior in nanoscale has been recorded once74 and is not fully understandable yet. There are theoretical suggestions that correlate the size effect with multiple-step thermal hysteresis on 2D SCO nanoparticles.80,81
Targeted attempts for further nanoparticle downsizing led to nanoparticles 6, with a peculiar aggregation form best described as right truncated thick prisms of [FeII(2-mpz)2Ni(CN)4] stacked in a vertical position on a rectangular base plate. Its magnetic behavior preserves the two-step SCO character although it can be considered as quite different since it is accompanied by a downshift of the transition temperatures probably due to the aggregation form of the nanoparticles (Fig. 2). More explicitly the χMT product at 300 K is equal to 3.56 emu K mol−1, while the critical temperatures for 6 are at Tc1↓ = 190K, Tc1↑ = 194 K and Tc2↓ = 159 K, Tc2↑ = 162 K with hysteresis loops ca 3 K. Similar structural and magnetic characteristics are also reported for the exfoliated 2D SCO material74 with formula {[Fe(1,3-bpp)2(NCS)2]2 (1,1,3-bpp = 1,3-di(4-pyridyl)-propane)}. However, its magnetic response is attributed to the ultrahigh surface sensitivity derived from the presence of different degrees of van der Waal interactions between the stacked heterostructures.
Extreme downsizing, using the LPE method, led to atomically thin right prisms nanoparticles, 6exf, of height ∼1 nm. In order to confirm the presence of the SCO phenomenon in the exfoliated nanoparticles 6exf thermal susceptibility measurements were recorded in the same thermal range as in the case of nanoparticles 6 (Fig. 5). More explicitly the χMT product at 300 K is equal to 3.45 emu K mol−1, while the critical temperature for 6exf is at Tc = 192 K. Due to this extreme downsizing there is a profound smearing of the SCO transition indicating the preservation of HS population in the low-temperature region (the χMT product at 150 K is equal to 2.4 emu K mol−1). As we pointed out, the increase of molar fraction of inactive HS centres is due to the extreme downsizing of the dimensions of the nanoparticle and the actual increase of the surface/volume ratio creating a large number of defects at the periphery where the FeII ions complete their axial coordination.76,77Table 2 presents a correlation between the nanoparticle size distribution and the characteristics emanated from thermal susceptibility measurements.
| NPs | Size and distribution | Critical temperatures | χMT at RT |
|---|---|---|---|
| 471 | 300(10)–600(10) nm; 50(10)–150(10) nm | Hysteresis: Tc↑= 194 K, Tc↓ = 188 K | 3.44 emu K mol−1 |
| 5 | 250(10)–350(10) nm | 2 step hysteresis: Tc1↑ = 195 K, Tc1↓ = 188 K Tc2↑ = 177 K, Tc2↓ = 173 K | 3.42 emu K mol−1 |
| 6 | Indefinable size | 2 step hysteresis: Tc1↑ = 194 K, Tc1↓ = 190 K Tc2↑ = 162 K, Tc2↓ = 159 K | 3.56 emu K mol−1 |
| 6exf | Thin prism (height 1–10 nm) | No hysteresis: Tc = 192 K | 3.45 emu K mol−1 |
Fig. S19 (ESI†) shows the DSC study along with the thermal dependence of the χMT product for nanoparticles 4–6. Comparison between the two techniques shows that the exothermic and endothermic peaks in DSC are in good agreement with the first order transitions at Tc1 critical temperatures derived from the thermal dependence of the χMT product (Table S4, ESI†). Unfortunately it was not possible to observe the exothermic/endothermic peaks of the Tc2 critical temperatures for nanoparticles 5 and 6 possibly due to the lack of pronounced enthalpy associated with the lower amount of active iron fractions involved in these thermal transitions.82 For the same reasons, the DSC peaks of 6exf are suffering from broadening effects (Fig. S20, ESI†) while the critical temperatures of the exothermic and endothermic peak do not coincide. Finally, the thermal stability of nanoparticles 4, 5, 6 and 6exf was also tested by repeating thermal cycles in DSC. It was found that after three thermal cycles the exothermic and endothermic peaks preserve their characteristics and the associated critical temperatures.
Conclusions
A detailed nano-synthetic study based on the reverse-micellar synthesis of the 2D Hofmann-type nanosized SCO [FeII(2-mpz)2Ni(CN)4] is presented as well as the rationalization of this method in order to produce nanoparticles with a well-controlled size and shape. The role of concentration and reaction's temperature is investigated with respect to the size, dispersion, morphology and magnetic properties of the nanoparticles. It was found that using a reaction ratio of (Fe:Ni:2-mpz) equal to (1:1:15) and a metal concentration of 0.05 M the synthesis of nanoparticles is controlled and the final products are nanoparticles with well-defined shapes, while the distribution of sizes is narrowed down. By involving two more experimental parameters, incubation temperature of the microemulsions and temperature mixing of the microemulsions, it was possible to obtain an interesting aggregation form of this 2D material best described as right truncated thick prisms of [FeII(2-mpz)2Ni(CN)4] stacked in a vertical position on a rectangular base plate. Following a facile LPE method it was possible to detach the thick prisms from the base plate and, eventually, exfoliate them to atomically thin right prisms of height ∼1 nm. The overall stability of the colloidal water dispersion for over a month was confirmed as well as the chemical integrity and SCO behavior of the exfoliated nanoparticles. According to AFM nano topographic study it was possible to propose a building model for the nano-growth of these nanoparticles.
Magnetic measurements revealed that the size reduction leads to the progressive downshift of abrupt thermal hysteresis with two-step SCO transition temperatures of the bulk [FeII(2-mpz)2Ni(CN)4] material to a gradual incomplete SCO behavior with no steps for the case of 2D nanoparticles with a wide distribution of sizes. On further reducing the size and/or their distribution of the 2D nanoparticles, it was possible to re-enter a gradual incomplete two step SCO behavior. However, the extreme downsizing to an almost single layer 2D [FeII(2-mpz)2Ni(CN)4] nanosheet using the LPE method leads to drastic smearing of the SCO transition in the same thermal range, indicating thus HS population at low temperatures and the significant reduction in the number of interacting metallic centers.
The role of 2D SCO particles at the nanometric scale as versatile nanoplatforms of spintronic devices is currently under intensive investigation. In a parallel manner, a promising research path seems to be the LPE processing of these 2D SCO materials towards nanosheets of atomic width preserving the hysteretic SCO character. We believe that the results presented in this study outline the importance of rationalization of synthetic protocols in order to investigate in depth the SCO behavior of 2D SCO nanoparticles, and emphasize the importance of LPE protocols for stable colloidal suspensions and consequently easy transfer of the nanoparticles to different substrates of technological relevance.
Conflicts of interest
There are no conflicts to declare.Acknowledgements
C. D. P. thanks the State Scholarships Foundation (IKY). This research is co-financed by Greece and the European Union (European Social Fund - ESF) through the Operational Programme Human Resources Development, Education and Lifelong Learning in the context of the project “Reinforcement of Postdoctoral Researchers - 2nd Cycle” (MIS-5033021), implemented by the State Scholarships Foundation (IKY). O. M. and M. P. would like to acknowledge the following projects: the Research Infrastructure NanoEnviCz, supported by the Ministry of Education, Youth and Sports of the Czech Republic under Project No. LM2018124, and also the ERDF/ESF project “Nano4Future” Development of pre-applied research in nanotechnology and biotechnology (no. CZ.02.1.01/0.0/0.0/17_048/0007323). We would like to thank the laboratory of X-ray Crystallography/Structural Biology at the Department of Biology, University of Patras and Malvern Panalytical for X-ray Powder Diffraction measurements employing the XPert Pro Malvern Panalytical diffractometer and software support. MT and ABD acknowledge University of Sussex strategic development fund.Notes and references
- H. A. Goodwin, Coord. Chem. Rev., 1976, 18, 293 CrossRef CAS.
- E. König, G. Ritter and S. K. Kulshreshtha, Chem. Rev., 1985, 85, 219 CrossRef.
- A. Hauser, Inorg. Chem., 1995, 17, 17 CAS.
- P. Gütlich, Struct. Bonding, 1981, 44, 83 CrossRef.
- P. Gütlich and A. Hauser, Angew. Chem., Int. Ed. Engl., 1994, 33, 2024 CrossRef.
- O. Sato, Acc. Chem. Res., 2003, 36, 692 CrossRef CAS PubMed.
- E. König, Struct. Bonding, 1991, 76, 151 CrossRef.
- J. A. Real, A. B. Gaspar, V. Niel and M. C. Muñoz, Coord. Chem. Rev., 2003, 236, 121 CrossRef CAS.
- J. A. Real, A. B. Gaspar and M. C. Muñoz, Dalton Trans., 2005, 2062 RSC.
- M. A. Halcrow, Polyhedron, 2007, 26, 3523 CrossRef CAS.
- M. A. Halcrow, Coord. Chem. Rev., 2009, 253, 2493 CrossRef CAS.
- P. Gütlich and H. A. Goodwin, Top. Curr. Chem., 2004, 233, 259 CrossRef.
- A. Bousseksou, G. Molnár, L. Salmon and W. Nicolazzi, Chem. Soc. Rev., 2011, 40, 3313 RSC.
- J. Olguin and S. Brooker, Coord. Chem. Rev., 2011, 255, 203 CrossRef CAS.
- A. B. Gaspar, V. Ksenofontov, M. Seredyuk and P. Gutlich, Coord. Chem. Rev., 2005, 249, 2661 CrossRef CAS.
- O. Kahn and C. J. Martinez, Science, 1998, 279, 44 CrossRef CAS.
- R. N. Muller, L. Vander and S. Laurent, J. Am. Chem. Soc., 2003, 125, 8405 CrossRef CAS PubMed.
- F. Volatron, L. Catala, E. Rivière, A. Gloter, O. Stephan and T. Mallah, Inorg. Chem., 2008, 47, 6584 CrossRef CAS PubMed.
- I. Boldog, A. B. Gaspar, V. Martinez, P. Pardo-Ibanez, V. Ksenofontov, A. Battacharjee, P. Gütlich and J. A. Real, Angew. Chem., Int. Ed., 2008, 47, 6433 CrossRef CAS PubMed.
- K. Otsubo, T. Haraguchi and H. Kitagawa, Chem. Rev., 2017, 346, 123 CAS.
- L. Salmon and L. Catala, C. R. Chim., 2018, 21, 1230 CrossRef CAS.
- J. F. Letard, P. Guionneau and L. Goux-Capes, Spin Crossover in Transition Metal Compounds III, Springer, Berlin, Heidelberg, 2004, vol. 235, pp. 221–249 Search PubMed.
- E. Coronado, J. R. Galan-Mascaros, M. Monrabal-Capilla, J. Garcia-Martinez and P. Pardo-Ibanez, Adv. Mater., 2007, 19, 1359 CrossRef CAS.
- T. Forestier, S. Mornet, N. Daro, T. Nishihara, S. I. Mouri, K. Tanaka, O. Fouche, E. Freysz and J. F. Létard, Chem. Commun., 2008, 4327 RSC.
- A. Tokarev, L. Salmon, Y. Guari, W. Nicolazzi, G. Molnar and A. Bousseksou, Chem. Commun., 2010, 42, 8011 RSC.
- A. Tokarev, L. Salmon, Y. Guari, G. Molnar and A. Bousseksou, New J. Chem., 2011, 35, 2081 RSC.
- J. R. Galan-Mascaros, E. Coronado, A. Forment-Aliaga, M. Monrabal-Capilla, E. Pinilla-Cienfuegos and M. Ceolin, Inorg. Chem., 2010, 49, 5706 CrossRef CAS PubMed.
- S. Titos-Padilla, J. M. Herrera, X. W. Chen, J. J. Delgado and E. Colacio, Angew. Chem., Int. Ed., 2011, 50, 3290 CrossRef CAS PubMed.
- L. Moulet, N. Daro, C. Etrillard, J. F. Letard, A. Grosjean and P. Guionneau, Magnetochemistry, 2016, 2, 1 CrossRef CAS.
- J. M. Herrera, A. Titos-Padilla, S. J. A. Pope, I. Berlanga, F. Zamora, J. J. Delgado, K. V. Kamenev, X. Wang, A. Prescimone, E. K. Brechin and E. Colacio, J. Mater. Chem. C, 2015, 3, 7819 RSC.
- I. A. Gural'skiy, C. M. Quintero, G. Molnar, I. O. Fritsky, L. Salmon and A. Bousseksou, Chem. – Eur. J., 2012, 18, 9946 CrossRef PubMed.
- G. Agusti, S. Cobo, A. B. Gaspar, G. Molnar, N. O. Moussa, P. A. Szilagyi, V. Palfi, C. Vieu, M. C. Munoz, J. A. Real and A. Bousseksou, Chem. Mater., 2008, 20, 6721 CrossRef CAS.
- F. J. Munoz-Lara, A. B. Gaspar, M. C. Munoz, M. Arai, S. Kitagawa, M. Ohba and J. A. Real, Chem. – Eur. J., 2012, 18, 8013 CrossRef CAS PubMed.
- R. Ohtani, M. Arai, A. Hori, M. Takata, S. Kitao, M. Seto, S. Kitagawa and M. J. Ohba, Inorg. Organomet. Polym., 2013, 23, 104 CrossRef CAS.
- L. Pineiro-Lopez, M. Seredyuk, M. C. Munoz and J. A. Real, Chem. Commun., 2014, 50, 1833 RSC.
- C. Bartual-Murgui, N. A. Ortega-Villar, H. J. Shepherd, M. C. Munoz, L. Salmon, G. Molnar, A. Bousseksou and J. A. Real, J. Mater. Chem., 2011, 21, 7217 RSC.
- Z. Arcis-Castillo, F. J. Munoz-Lara, D. Aravena, A. B. Gaspar, J. F. Sanchez-Royo, E. Ruiz, M. Ohba, R. Matsuda, S. Kitagawa and J. A. Real, Inorg. Chem., 2013, 52, 12777 CrossRef CAS PubMed.
- N. F. Sciortino, K. R. Scherl-Gruenwald, G. Chastanet, G. J. Halder, K. W. Chapman, J. F. Letard and C. J. Kepert, Angew. Chem., Int. Ed., 2012, 51, 10154 CrossRef CAS PubMed.
- L. Pineiro-Lopez, F. J. Valverde-Munoz, M. Seredyuk, M. Carmen Munoz, M. Haukka and J. A. Real, Inorg. Chem., 2017, 56, 7038 CrossRef CAS PubMed.
- C. Bartual-Murgui, L. Salmon, A. Akou, N. A. Ortega-Villar, H. J. Shepherd, M. Carmen-Munoz, M. G. Molnar, J. A. Real and A. Bousseksou, Chem. – Eur. J., 2012, 18, 5076 CrossRef PubMed.
- C. D. Polyzou and V. Tangoulis, J. Coord. Chem., 2019, 72, 389 CrossRef CAS.
- H. Peng, S. Tricard, G. Felix, G. Molnar, W. Nicolazzi, L. Salmon and A. Bousseksou, Angew. Chem., 2014, 126, 11074 CrossRef.
- J. Larionova, L. Salmon, Y. Guari, A. Tokarev, K. Molvinger, G. Molnar and A. Bousseksou, Angew. Chem., Int. Ed., 2008, 47, 8236 CrossRef CAS PubMed.
- Y. Raza, F. Volatron, S. Moldovan, O. Ersen, V. Hue, C. Martini, F. Brisset, A. Gloter, O. Stephan, A. Bousseksou, L. Catala and T. Mallah, Chem. Commun., 2011, 47, 11501 RSC.
- A. Tokarev, J. Long, Y. Guari, J. Larionova, F. Quignard, P. Agulhon, M. Robitzer, G. Molnar, L. Salmon and A. Bousseksou, New J. Chem., 2013, 37, 3420 RSC.
- V. Martinez, A. B. Gaspar, M. Carmen Munoz, G. V. Bukin, G. Levchencko and J. A. Real, Chem. – Eur. J., 2009, 15, 10960 CrossRef CAS PubMed.
- T. Kitazawa, Y. Gomi, M. Takahashi, M. Takeda, M. Enomoto, A. Miyazaki and A. Enoki, J. Mater. Chem., 1996, 6, 119 RSC.
- T. Kitazawa, M. Takahashi, M. Enomoto, A. Miyazaki, T. Enoki and M. Takeda, J. Radioanal. Nucl. Chem., 1999, 239, 285 CrossRef CAS.
- Y. M. Klein, N. F. Sciortino, F. Ragon, C. E. Housecroft, C. J. Kepert and S. M. Neville, Chem. Commun., 2014, 50, 3838 RSC.
- F. J. Valverde-Munoz, M. Seredyuk, M. Carmen Munoz, M. Seredyuk, M. Carmen Munoz, K. Znovjyak, I. O. Fritsky and J. A. Real, Inorg. Chem., 2016, 55, 10654 CrossRef CAS PubMed.
- N. F. Sciortino, K. A. Zenere, M. E. Corrigan, G. J. Halder, G. Chastanet, J. F. Letard, C. J. Kepert and S. M. Neville, Chem. Sci., 2017, 8, 701 RSC.
- M. Seredyuk, A. B. Gaspar, V. Ksenofontov, M. Verdaguer, F. Villain and P. Gutlich, Inorg. Chem., 2009, 48, 6130 CrossRef CAS PubMed.
- A. B. Gaspar, G. Levchenko, S. Terekhov, G. Bukin, J. Valverde-Munoz, F. J. Munoz-Lara, M. Seredyuk and J. A. Real, Eur. J. Inorg. Chem., 2014, 429 CrossRef CAS.
- R. Ohtani, M. Arai, H. Ohba, A. Hori, M. Takata, S. Kitagawa and M. Ohba, Eur. J. Inorg. Chem., 2013, 738 CrossRef CAS.
- K. Nakao, S. Hayami, M. Akita and K. Inoue, Chem. Lett., 2008, 37, 292 CrossRef CAS.
- M. J. Murphy, K. A. Zenere, F. Ragon, P. D. Southon, C. J. Kepert and S. M. Neville, J. Am. Chem. Soc., 2017, 139, 1330 CrossRef CAS PubMed.
- G. Agusti, M. Carmen Munoz and J. A. Real, Inorg. Chem., 2007, 46, 9646 CrossRef CAS PubMed.
- V. Martinez, A. B. Gaspar, M. Carmen Munoz, R. Ballesteros, N. Ortega-Villar, V. M. Ugalde-Saldivar, R. Moreno-Esparza and J. A. Real, Eur. J. Inorg. Chem., 2009, 303 CrossRef CAS.
- F. Ragon, K. Yaksi, N. F. Sciortino, G. Chastanet, J. F. Letard, D. M. Alessandro, C. J. Kepert and S. M. Neville, Aust. J. Chem., 2014, 67, 1563 CrossRef CAS.
- O. I. Kucheriv, S. I. Shylin, V. Ksenofontov, S. Dechert, M. Haukka, I. O. Fritsky and I. A. Gural'skiy, Inorg. Chem., 2016, 55, 4906 CrossRef CAS PubMed.
- W. Liu, L. Wang, Y.-J. Su, Y.-C. Chen, J. Tucek, R. Zboril, Z.-P. Ni and M.-L. Tong, Inorg. Chem., 2015, 17, 8711 CrossRef PubMed.
- K. A. Zenere, S. G. Duyker, E. Trzop, E. Collet, B. Chan, P. W. Doheny, C. J. Kepert and S. M. Neville, Chem. Sci., 2018, 9, 5623 RSC.
- N. F. Sciortino, F. Ragon, K. A. Zenere, P. D. Southon, G. J. Halder, K. W. Chapman, L. Pineiro-Lopez, J. A. Real, C. J. Kepert and S. M. Neville, Inorg. Chem., 2016, 55, 10490 CrossRef CAS PubMed.
- Y. Meng, Q. Q. Sheng, Md. Najbul Hoque, Y.-C. Chen, S. G. Wu, J. Tucek, R. Zboril, T. Liu, Z. P. Ni and M. L. Tong, Chem. – Eur. J., 2017, 42, 10034 CrossRef PubMed.
- E. Milin, V. Patinec, S. Triki, E. Bendeif, S. Pillet, M. Marchivie, G. Chastanet and K. Boukheddaden, Inorg. Chem., 2016, 55, 11652 CrossRef CAS PubMed.
- H. Fourati, E. Milin, A. Slimani, G. Chastanet, Y. Abid, S. Triki and K. Boukheddaden, Phys. Chem. Chem. Phys., 2018, 20, 10142 RSC.
- F.-L. Liu and J. Tao, Chem. – Eur. J., 2017, 23, 18252 CrossRef CAS PubMed.
- N. F. Sciortino and S. M. Neville, Aust. J. Chem., 2014, 67, 1553 CrossRef CAS.
- N. F. Sciortino and S. M. Neville, Aust. J. Chem., 2014, 67, 1553 CrossRef CAS.
- Y. Yang, X. Shen, H. Zhou, L. Lang, G. Zhu and Z. Ji, J. Magn. Magn. Mater., 2020, 496, 165938 CrossRef CAS.
- C. D. Polyzou, O. Malina, J. Tuček, R. Zbořil, N. Panagiotou, A. J. Tasiopoulos, N. Boukos, J. Parthenios, A. Kalarakis and V. Tangoulis, Inorg. Chem., 2019, 58, 13733 CrossRef CAS PubMed.
- R. Sakamoto, K. Takada, T. Pal, H. Maeda, T. Kambe and H. Nishihara, Chem. Commun., 2017, 53, 5781 RSC.
- P. Amo-Ochoa, L. Welte, R. Gonzalez-Prieto, P. J. Sanz Miguel, C. J. Gomez-Garcia, E. Mateo-Marti, S. Delgado, J. Gomez-Herrero and F. Zamora, Chem. Commun., 2010, 46, 3262 RSC.
- Y.-H. Luo, C. Chen, G.-W. Lu, D. Hong, X.-T. He, C. Wang, J.-Y. Wang and B.-W. Sun, J. Phys. Chem. Lett., 2018, 24, 7052 CrossRef PubMed.
- S. Suárez-Garcia, N. N. Adarsh, G. Molnár, A. Bousseksou, Y. Garcia, M. M. Dîrtu, J. Saiz-Poseu, R. Robles, P. Ordejón and D. Ruiz-Molina, ACS Appl. Nano Mater., 2018, 6, 2662 CrossRef.
- C. Bartual-Murgui, V. Rubio-Gimenez, M. Meneses-Sanchez, F. J. Valverde-Munoz, S. Tatay, C. Marti-Gastaldo, M. C. Munoz and J. A. Real, ACS Appl. Mater. Interfaces, 2020, 12, 29461–29472 CAS.
- M. Kelai, V. Repain, A. Tauzin, W. Li, Y. Girard, J. Lagoute, S. Rousset, E. Otero, P. Sainctavit, M. A. Arrio, M. L. Boillot, T. Mallah, C. Enachescu and A. Bellec, J. Phys. Chem. Lett., 2021, 12, 6152–6158 CrossRef CAS PubMed.
- N. Ortega-Villar, M. Muñoz and J. A. Real, Magnetochemistry, 2016, 2, 16 CrossRef.
- E. Trzop, D. Zhang, L. Piñeiro-Lopez, F. J. Valverde-Muñoz, M. Carmen Muñoz, L. Palatinus, L. Guerin, H. Cailleau, J. A. Real and E. Collet, Angew. Chem., Int. Ed., 2016, 55, 8675 CrossRef CAS PubMed.
- S. E. Allal, D. Sohier, T. Dufaud, C. Harlé, P. R. Dahoo and J. Linares, J. Phys., 2018, 012158 Search PubMed.
- M. Ndiaye and K. Boukheddaden, J. Phys. Soc. Jpn., 2020, 89, 014004 CrossRef.
- A. Tokarev, J. Long, Y. Guari, J. Larionova, F. Quignard, P. Agulhon, M. Robitzer, G. Molnár, L. Salmon and A. Bousseksou, New J. Chem, 2013, 37, 3420 RSC.
Footnote |
| † Electronic supplementary information (ESI) available: FTIR and UV/Vis spectroscopy, P-XRD patterns, differential scanning calorimetry (DSC), thermogravimetric analysis (TG), TEM microscopy, AFM microscopy, additional figures and tables. See DOI: 10.1039/d1tc03070a |
| This journal is © The Royal Society of Chemistry 2021 |