
 Open Access Article
 This Open Access Article is licensed under a Creative Commons Attribution-Non Commercial 3.0 Unported Licence
In situ coupled electrical/mechanical investigations of graphene coated cationized cotton yarns with enhanced conductivity upon mechanical stretching†
Léa
Maneval
,
Bienvenu
Atawa
 ,
Anatoli
Serghei
,
Nathalie
Sintes-Zydowicz
and
Emmanuel
Beyou
*
,
Anatoli
Serghei
,
Nathalie
Sintes-Zydowicz
and
Emmanuel
Beyou
*
Université de Lyon, UCBL, CNRS, IMP UMR 5223, F-69622, Villeurbanne Cedex, France. E-mail: beyou@univ-lyon1.fr
First published on 17th September 2021
Abstract
In situ coupled mechanical/electrical investigations on graphene coated cationized cotton yarns have been carried out upon cyclic loading, with simultaneous measurements of stress, strain and electrical conductivity. The conductive cotton yarns have been prepared by employing a dip-coating procedure in an aqueous graphene suspension following a cationization process applied to enhance the electrostatic interactions. An increase in the conductivity of the graphene coated yarns by up to four decades is reported upon mechanical stretching, leading to conductivity values as high as 1.1 S cm−1. Furthermore, we demonstrate that this enhancement effect is permanent and leads to reversible conductivity/stress curves after the first mechanical stretching. Our study opens thus new perspectives in the development of textile yarns with enhanced conductivity, with possible applications in the field of smart textile materials.
1. Introduction
The interest in smart textiles has grown over the past few years.1 These functional materials can be described as textiles that have the capability to interact with their environment or users by incorporation of new functionalities leading to various applications such as anti-static,2 anti-microbial,3 flame retardant,4 electrical conduction,5 self-cleaning,6 thermal regulation7 or UV protection.8 Electronic textiles (e-textiles) have a key role in the development of new intelligent technologies with various applications from aerospace to energy storage and wearable electronic devices and systems.9–16 Numerous techniques have been used to make textile-based fabrics, fibers or yarns electrically conductive. For instance, metal nanoparticles17–20 such as gold21 and silver22 were incorporated into wearable textiles by dipping leading to highly conductive materials with conductivity values reaching 90 S cm−1 and 16 S cm−1, respectively. However, these materials are expensive.23 Integrating conductive metal–organic frameworks (MOFs)24 into fabrics through direct solution self-assembly is a less expensive alternative but the corresponding electrical conductivities, ranging from 10−4 to 10−3 S cm−1, are not as high as expected. Conductive polymers (PEDOT derivates25,26 or polypyrrole27) have been used as well to obtain cotton fibers displaying good conductivity values (10 S cm−1 and 6.15 S cm−1, respectively). Carbon nanotubes (CNT) based solutions have been also employed for coating yarns and fabrics, leading to conductivities in the range of 0.1 to 3 S cm−1.28,29More recently, graphene has been incorporated in different types of polymeric materials to take advantage of its high electrical conductivity (104 S cm−1) and excellent mechanical properties30–38 (tensile strength of 125 GPa and elastic modulus of 1.1 TPa). The challenge in using graphene sheets is its poor affinity with usual textiles39 because of the absence of favourable interactions. The oxidated form of graphene (GO) is an alternative for producing textile coatings because it forms stable dispersions in polar and hydrophilic solvents allowing an efficient dipping procedure.40–49 Nevertheless, a subsequent reduction for partial restoration of the sp2 structure (rGO) is needed to recover the electrical conductivity.50 For example, Chatterjee et al.45 soaked woven and knitted cotton fabrics in 0.75, 1.5 and 2.25 wt% aqueous GO suspensions for 30 min at room temperature and reached a maximum conductivity of ∼10−4 S cm−1. Sahito et al.43 soaked cotton fabrics cationized with Bovine Serum Albumin (BSA) in a 1 wt% aqueous GO solution for 30 min at 80 °C and reported a conductivity of 0.6 S cm−1. The use of a cationic agent on cotton fabric usually improves the affinity with the graphene oxide, increasing thereby the conductivity. The reduction steps can be performed on GO-coated textiles (by chemical42 or UV-light40 reduction methods) while rGO can be directly used as a coating agent to avoid possible degradation during the reduction reaction. Pad-dry technique51 on cotton fabric or multi-coating cycles52 by dipping cotton yarns into aqueous rGO suspensions are promising scalable methods but the achieved conductivity are still rather low (10−4 to 10−5 S cm−1). Moreover, Yun et al.53 employed a combination of mercerization and dip-coating to coat the surface of cotton yarns by reduced GO sheets yielding highly flexible and mechanically stable rGO based cotton yarns with a good conductivity. Using graphene sheets allows one to avoid the loss of conductivity. Afroj et al.54 coated cotton fabric with a 100 mg mL−1 aqueous graphene ink and used compressing rollers with a gap of 100 μm as post treatment to increase the affinity with cotton and reached an electrical conductivity of 1.9 S cm−1. Ba et al.55 soaked repeatedly cotton fabrics in a 5 g L−1 aqueous graphene dispersion with karaya gum acting as an hydrophilic glue, followed by a thermal treatment at 200 °C. After 10 dipping cycles, they deposited 6 wt% of G onto the fabric and reached an electrical conductivity of 12 S cm−1. The electrical behavior upon mechanical deformation is a key factor for wearable textile materials, especially for assessing the tolerable range of maximum mechanical deformation allowed for preserving the electrical functionality. However, this important factor has been rarely studied in the scientific literature. Park56 and Cataldi57 stretched rubber yarns coated with graphene nanoplatelets and poly(vinyl alcohol) (PVA) or cotton fabrics coated with graphene and thermoplastic polyurethane and reported a decrease of the conductivity upon stretching due to the formation of cracks in the polymer layer. The same type of coating applied on wool fibers56 resulted in a 10% increase of the conductivity when stretched. The authors observed that the curled wool fibers became straightened and closer to each other inducing a subsequent improvement in the contact between the GNP-coated wool fibers.
Herein, we employ in situ coupled electrical/mechanical investigations of graphene coated cotton yarns and we report an enhancement effect by more than three orders of magnitude in the electrical conductivity of the conductive yarns upon mechanical stretching. We furthermore prove that this enhancement effect, to our best knowledge the largest reported in the scientific literature so far, has a permanent character and leads, after the first mechanical stretching, to fully reversible conductivity/stress curves upon repeated mechanical stretching cycles. Graphene coated cotton yarns with stable properties and conductivity values as high as 1.1 S cm−1 are thus obtained. Employing functionalized yarns with enhanced electrical properties instead of using conductive fabrics brings several essential advantages, in particular, related to their capacity of being weaved into e-textile materials at specific places and following specific patterns. This is expected to lead to a substantial cost reduction as compared to full fabric coating. However, the weaving process and the subsequent use of the functional textile material require stable properties upon mechanical deformation. Assessing the evolution and the persistence of the functional character of the conductive yarns upon mechanical deformation represents therefore one of the most important prerequisite for industrial applications.
2. Experimental methods
2.1. Materials
Graphene powder (G) was supplied by Graphene Production, France. (1-Hexadecyl)trimethylammonium bromide (CTAB, 98%) was purchased from Alfa Aesar, Germany. Brij® L23 (main component: tricosaethylene glycol dodecyl ether) was purchased from Sigma Aldrich, Spain. All reagents were used as received. Cotton yarn (2000 dtex) was supplied by Moulinage du Solier, France.2.2. Dispersion of graphene with surfactants
Graphene dispersions were prepared using surfactants and an ultrasonic bath:58 5 g of graphene, 11 g of CTAB (1.5 CMC) and 18 g of Brij® L23 (1.5 CMC) were added to 1 L of deionized (DI) water and the resulting dispersion was sonicated for 1 h in an ultrasonic bath.2.3. Determination of electric surface potential of the yarns
The streaming potential experiments33 were carried out by an Electro Kinetic Analyzer (SurPass) (Anton Paar GmbH, Graz, Austria) using the Cylindrical Cell (LAGEPP, University Lyon 1). The measuring cell was made of a glass cylinder with inlet and outlet tubes for the electrolyte solution. The electrolyte NaCl solution had a concentration of 10−3 mol L−1. The yarn sample was inserted between a pair of perforated Ag/AgCl disc electrodes. The electrodes were attached to movable pistons, allowing a variation of the distance between the two electrodes in order to adjust the packing density of the fiber sample.2.4. Coating of cotton yarns with graphene sheets
Cotton yarns with a length of 7 cm were attached to metallic supports and immersed into 70 mL of the aqueous graphene dispersion under sonication for 1 h (Fig. 1). The temperature of the dispersion was maintained to 20 °C. After the dipping procedure, the yarns were taken-off and dried at 60 °C in an oven. After drying, the yarns were stored in a desiccator at low humidity (RH < 20%). Several graphene coated yarns were prepared following the same procedure to validate the repeatability. A blank (US-cotton) was prepared by using a cotton yarn immersed into 70 mL of water under sonication for 1 h and then dried for 1 h at 60 °C. All cottons yarns samples in this study were stored in the same desiccator at low humidity for comparison purpose. | ||
| Fig. 1 Schematic representation of the device used for the coating of cotton yarns with graphene sheets. | ||
2.5. Characterization of Graphene powder and Graphene based yarns
Raman spectra were taken at 3 different locations on the graphene powder and mean values were calculated. The Raman spectroscopy experiments were carried out using a LabRAM HR spectrometer (HORIBA Jobin Yvon) operating with an excitation laser line at 532 nm. A FEI Quanta 250 environmental scanning electronic microscope (ESEM) was used to analyse the surface topography of the graphene powder and the graphene coated cotton yarns using an applied voltage of 1.00 kV. These experiments were carried-out before, during and after an imposed mechanical deformation. To this purpose, a device to stretch graphene coated cotton yarns in the chamber of the ESEM was developed. The device is entirely made of steel (10 cm long, 4 cm wide and 5 cm high) and composed of a vertical support fixed to the base and a removable second one. The yarn is attached between the two vertical supports and the stretching is controlled by moving the second support further from the first one (Fig. 2). Two positions were observed, at low stretching (3%) and at high stretching (10%).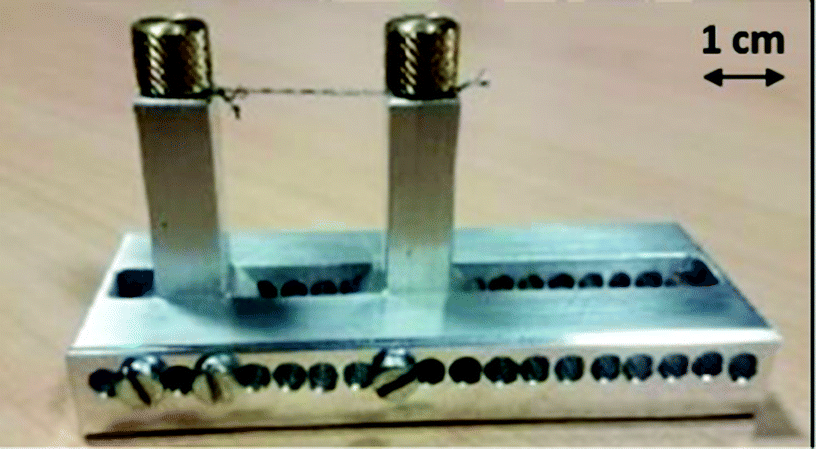 | ||
| Fig. 2 Picture of the lab-made device to stretch yarn for SEM observation. | ||
Thermogravimetric analysis (TGA) on Graphene powder, US-cotton yarns and G-coated cotton yarns was performed under nitrogen flow using a Mettler Toledo TGA, at a heating rate of 10 °C min−1 from 25 to 900 °C.
2.6. Mechanical measurements
Uniaxial tensile testing and cyclic loading were performed using a Shimadzu AG-X+ testing machine at room temperature and constant crosshead displacement velocity of 3 mm min−1. Samples were 30 mm long with a diameter of 1 mm. The strain ε is defined as| ε = ΔL/L0 | (1) |
| σmecnom = F/S0 | (2) |
2.7. Mechanical/electrical coupled experiments
The electrical properties of the graphene coated yarns (3 cm long with a diameter of 1 mm) were measured using a Keysight B2980A picoammeter. A voltage of 5 V was applied across the gauge length using brass electrodes. The mechanical/electrical set-up, schematized in Fig. 3, was developed in our laboratory.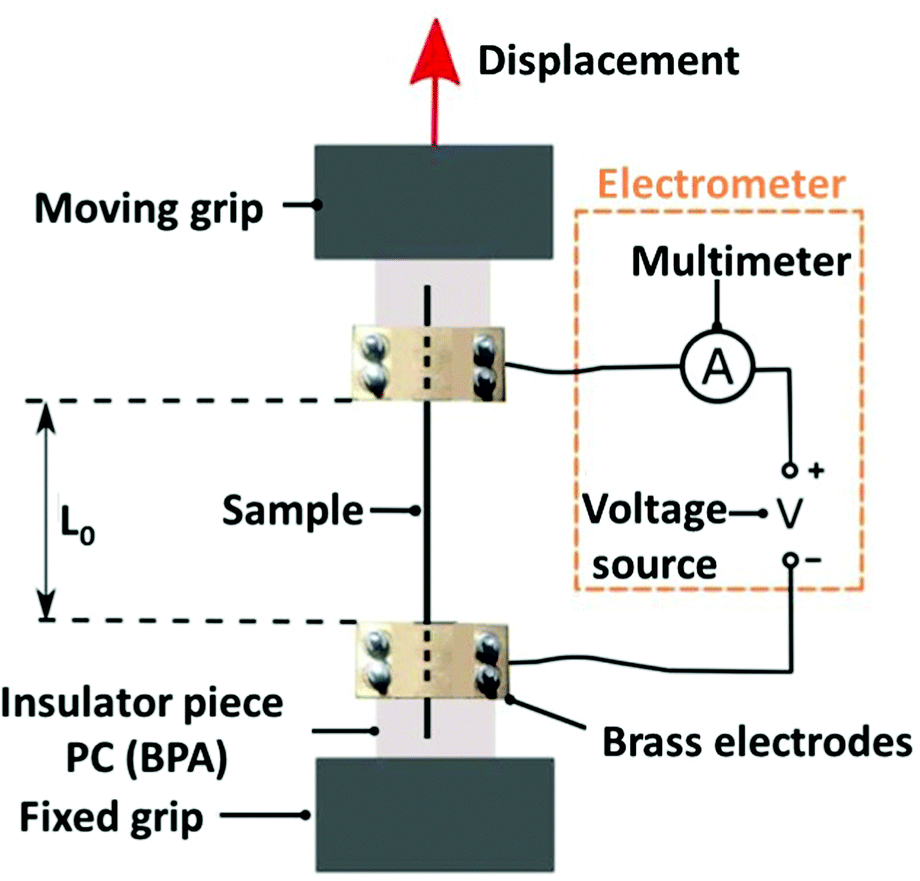 | ||
| Fig. 3 Schematic representation of the electrical and mechanical set-up used for simultaneous measurement of electrical and mechanical properties of yarns coated with graphene. | ||
The experiments were performed according to four different procedures:
Procedure 1: the electrical properties were first measured before any mechanical deformation (ε = 0%).
Procedure 2: the electrical properties were measured by applying a continuous deformation at 3 mm min−1 until yarn breaking.
Procedure 3: the electrical properties were measured during 30 cycles at successive strain εmax of 4, 8, 10 and 12% with unloading to εmin corresponding to F = 0.
Procedure 4: the electrical properties were measured upon increasing the strain by steps of 1% until yarn breaking. A stabilizing time of 1 min was allowed between each deformation step.
Electrical conductivity σelec was calculated from the electrical resistance by considering the initial cross section S0 of the sample as follows:
| σelec = L/(R × S0) | (3) |
3. Results and discussion
3.1. Characterization of the G powder
A typical Raman spectrum of G powder is presented in Fig. S4 (ESI†) and it displays the characteristic features of multilayer graphene, with a G band at ≈1570 cm−1 and an asymmetric 2D band at ≈2700 cm−1. The D band at ≈1340 cm−1 is known to correspond to the presence of defects59 (Fig. S4, ESI†). The ratio ID/IG gives quantitative information about the number of defects: the higher the ratio, the higher the disorder. Our G powder has a ratio of 0.01, indicating thus a low number of defects on the flakes. This is also confirmed by the TGA thermograms of our G powder which indicate a weight loss of only 0.7% under nitrogen at 700 °C (Fig. S5, ESI†).58 SEM images in topographic mode of the G powder at a magnification of 5000 shows G flakes piled up with a large distribution of laterall sizes: between 3 μm and 12 μm (Fig. S6, ESI†).3.2. Preparation of G coated cotton yarns
Contrary to GO and rGO, G has no oxygen-containing functional groups on its surface and therefore no polar interactions or hydrogen bonding with the hydroxyl groups of cotton yarns. Moreover, both G and cotton yarns exhibit a negative zeta potential which does not enable electrostatic attraction between them. To favour the adhesion between G and the surface of the cotton yarns, one efficient strategy is the use of surfactants to stabilize the aqueous suspensions and modify the surface charge of the cotton yarns. We first used the sodium dodecylsulphate (SDS) as a well-known anionic surfactant for dispersing G60 in water but the subsequent coating on cotton yarns was not successful: when touched or immersed in water, G was detached or desorbed instantly. To overcome this behavior, the cotton yarn was treated with a 3 × 10⁻² M solution of CTAB to change the negative zeta potential of the cotton yarn (−15 mV) to a positive value (+45 mV). The zeta potential of the cotton yarn cationized with CTAB remained positive during 3 washings cycles with a 10−3 M NaCl solution using the Electro Kinetic Analyzer (SurPass), indicating strong interactions between the yarn and CTAB. Then, the cotton yarn cationized with the CTAB surfactant was immersed in the G-water dispersion, leading to an enhanced affinity between the cotton yarn and the negatively charged G (−40 mV). A better adhesion was thus obtained after this treatment.The weight percentage of graphene sheets coated on the yarns was determined by TGA (Fig. S7, ESI†). At 600 °C the US-cotton yarns were fully carbonized, and an average residual weight percentage of 10.5 ± 0.4% was determined. Then, the deposited amount of graphene on the yarns was calculated by subtracting the residual cotton weight content at 600 °C from the residual content of G-coated cotton yarn at 600 °C using the following equation:
| Weight content % = (G coated yarn wt%600°C − 10.5) | (4) |
We obtained a G-weight content of 14.3 ± 0.9% which can be also expressed as 142 mg g−1. For comparison, Sahito and et al.61 modified the surface charge of a cotton fabric by using bovine serum albumin (BSA) as cationic agent and they deposited 5.2 mg g−1 of GO in the presence of a 0.1% solution of GO while an amount of 3.1 mg g−1 was obtained without BSA. Chatterjee et al.45 prepared graphene coated knitted and woven fabric by dipping the fabric into graphene solutions of GO with concentration varying from 0.75 to 2.25% followed by a reduction step. The amount of deposited GO was 3.9 mg g−1. Our higher G content on the yarn can be explained by the use of a more concentrated graphene-based solution for coating (0, 5%) and a better affinity with CTAB.
SEM images of the graphene coated yarns, at a magnification of 50, show a homogeneously coated cotton yarn (Fig. 4a). At higher magnifications, 250 (Fig. 4b) and 1000 (Fig. 4c), it can be observed a large quantity of G flakes (10 × 15 μm) on the yarn as discussed by Afroj et al.54 and Sahito et al.61
 | ||
| Fig. 4 SEM images of a G coated cotton yarn at ε = 0% at 3 magnifications: (a) 50×, (b) 250× and (c) 1000×. | ||
The deposition of graphene sheets onto the cotton yarn was also verified by Raman spectroscopy showing an increase of the ratio ID/IG which can be attributed to the presence of more defects after graphene adsorption probably due to the ultrasound treatment and the presence of surfactants on its surface58,60,62 (Fig. S4, ESI†)
3.3. Tensile properties of the G-coated yarns
Several studies showed a decrease of the polymerization degree (DP) of polysaccharides and more precisely cellulose under sonication63,64 while another study on natural fibers (coir, flax and hemp) demonstrated a loss of 4% to 9% of hemicellulose under sonication.65 To avoid degradation of the mechanical properties of the cotton yarns, our coating procedure has been carried-out for 1 h under sonication at the optimized temperature of 3 °C.The tensile strength results are summarized in Fig. 5 and 6.
 | ||
| Fig. 5 Strain as a function of stress for (a) raw cotton, (b) US-treated cotton (under ultrasounds condition) and (c) G-coated cotton yarns. | ||
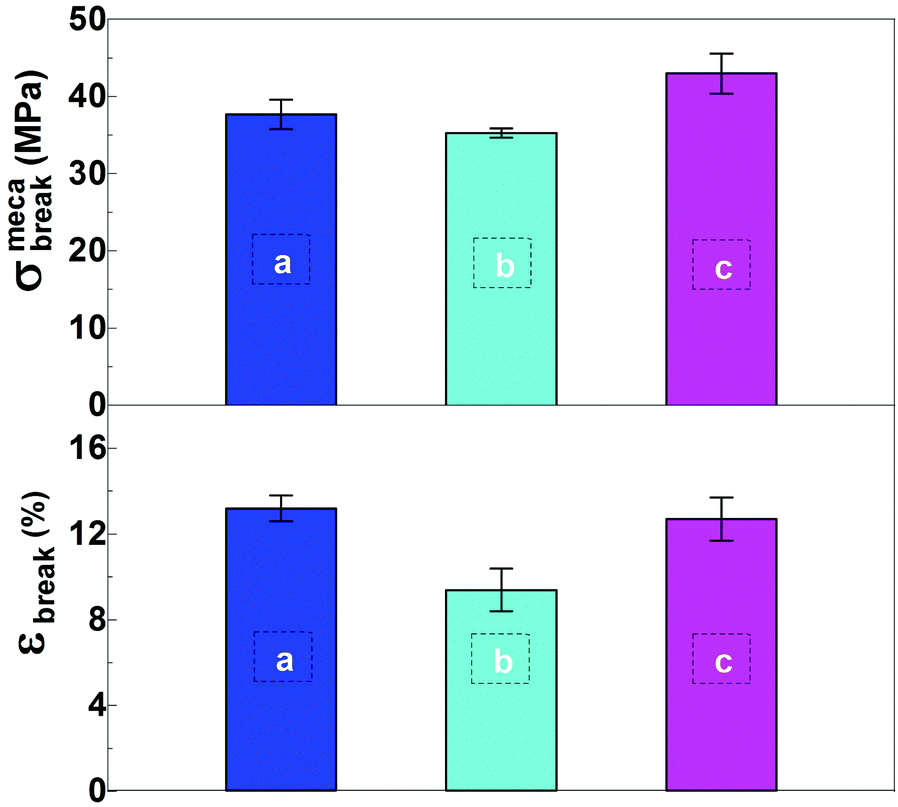 | ||
| Fig. 6 Average breaking stress and elongation at break for (a) raw cotton, (b) US-treated cotton (under ultrasound condition) and (c) G-coated cotton yarns. | ||
For raw cotton yarns, the breaking stress is 37.7 ± 1.9 MPa and the elongation at break is 13.2 ± 0.6%. Mechanical properties of cotton can also be expressed by using the tenacity in dependence on the linear density of the yarn in dtex. Our 2000 dtex cotton yarns have a tenacity of 1.47 ± 0.09 cN/dtex which corresponds to values obtained in the literature (2.06 ± 0.6 cN/dtex for a strain of 8.4 ± 0.3%66 and 1.9–3.1 cN/dtex for a strain of 7–10%67). Our better strain at break can be explained by a higher linear density (2000 dtex compared to 27 dtex and 3 dtex). After ultrasound treatment, US-treated cotton yarns show a significant decrease of its elongation at break (9.4 ± 1%) and a slight decrease of its breaking stress (35.3 ± 0.6 MPa) (Fig. 6). Indeed, it is suggested that even at low temperatures (3 °C) cotton degradation probably occurs explaining the decrease of the tensile properties. After addition of the G-coating on the yarns, the strain at break is increased by 34% in comparison with the US-treated one and reach 12.6 ± 1% (restoring the initial properties of raw cotton yarn) while the stress at break increases by 22% to reach 43 ± 2.6 MPa. (Fig. 6). Indeed, the adsorption of graphene sheets onto the surface of cotton yarns in presence of CTAB allows the sheets to transfer, localize and redistribute the penetrating stress under sonication leading to tremendous energy dissipation which promotes resistance to stretching. This behavior was also observed by Xie et al.68 with an increase of the tensile strength of over 25% for rGO-coated ramie fibers compared to pristine.
3.4. Electrical conductivity of G-coated cotton yarns
After coating and drying, the conductivity of G-coated cotton yarn was measured. First, samples were analysed following the procedure 1 (ε = 0%) to determine the initial conductivity of the G-coated cotton yarns. Ten samples were analyzed, and the measured conductivities were in the range from 7 × 10⁻⁵ to 4 × 10⁻² S cm−1 (Table S1, ESI†). The dispersity observed for the initial conductivity value of our G-coated cotton is attributed to the uneven rough twisted surface aspect of the cotton yarns that leads to a less efficient electrical percolation compared to smooth surfaces (Fig. 4a). Then, we studied the influence of the mechanical strain on the electrical conductivity. The G-coated yarns were strained at a constant speed (3 mm min−1) and the electrical properties were continuously measured according to Procedure 2. The results are presented in Fig. 7, showing the electrical conductivity, the surface resistance and the mechanical stress as a function of strain. | ||
| Fig. 7 Evolution of the electrical conductivity (red, top), the surface resistance (purple, bottom) and stress as a function of strain for a G coated cotton yarn. | ||
Three different regions are observed, corresponding to a change of slope of the conductivity as a function of strain. Between 0% and 2% (Fig. 7, region 1) the conductivity increases rapidly from 4 × 10⁻⁴ S cm−1 to 2 × 10⁻² S cm−1 (+98% i.e. 49% per 1% of strain); between 2% and 6% (Fig. 7, region 2) it increases from 2 × 10⁻² S cm−1 to 0.2 S cm−1 (+90% i.e. 22.5% per 1% of strain) and between 6% and rupture at 14% (Fig. 7, region 3), it increases from 0.2 S cm−1 to 0.93 S cm−1 (+79% i.e. 10% per 1% of strain). The increase in conductivity was more important in the first region because it corresponds to fibrils getting straighten out without being mechanically deformed (the stress practically did not increase) which improves the contact between the G flakes. Region 2 corresponds to fibrils getting reorganized to get closer: they start to lose the twisted aspect (Fig. S1b, ESI†) and stress slightly increases up to 10 MPa, improving thereby the contact between the G flakes. Region 3 is attributed to the mechanical deformation of the fibrils (definitive loss of the twisted aspect (Fig. S1c, ESI†) and high increase of the stress from 10 MPa to 40 MPa).
The experiments were realized on 10 different samples and the average value for the maximum of conductivity at rupture was 1.11 ± 0.39 S cm−1 (Table S1, ESI†). The elongation of the yarn results in more reproducible values of conductivities, the surface getting smoother. For rubber yarns coated with graphene nanoplatelets and poly(vinyl alcohol) (PVA)56 or cotton fabrics coated with graphene and thermoplastic polyurethane57 the electrical conductivity decreased during stretching. Cracks in the polymer layer were observed when the yarn was stretched. However, the same type of coating applied on wool fibers56 resulted in a 10% increase of the conductivity when stretched. The authors observed that the curled wool fibers became straightened and closer to each other inducing a better contact between the GNP-coated wool fibers.
The morphology of our G-coated yarns under mechanical stretching has been investigated by SEM (Fig. 8), using the lab-made device presented in Fig. 2.
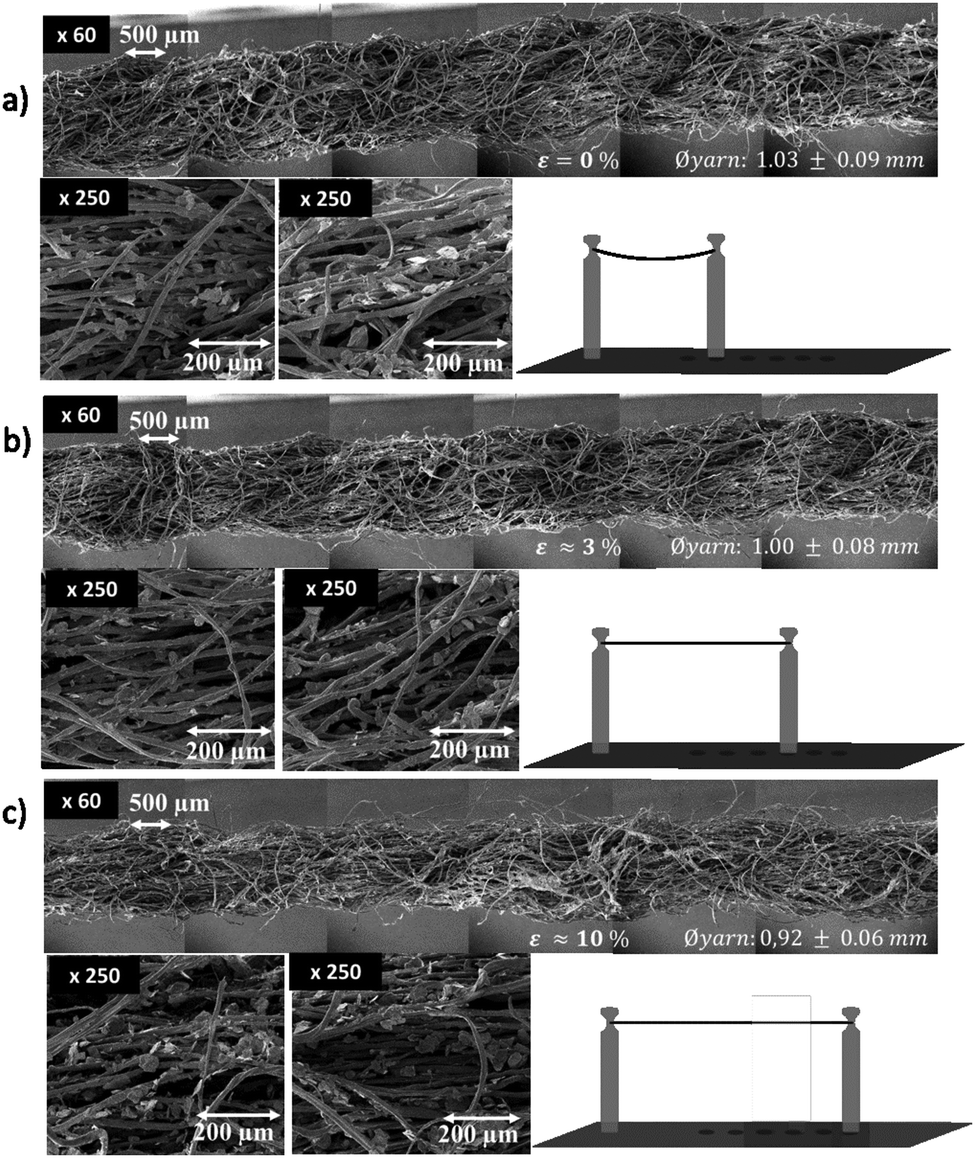 | ||
| Fig. 8 SEM images of G coated cotton yarn at (a) 0% strain, (b) a low strain: 3% and (c) a higher strain: 10%. | ||
For ε = 0%, the diameter of G coated cotton yarn is equal to 1.03 ± 0.09 mm and the twisted characteristic aspect of cotton yarns is observed (Fig. 8a). Subsequently, a low strain of ∼3% was applied on the yarn using our lab-made device (Fig. 3c). Neither the diameter (1.00 ± 0.08 mm) nor the twisted aspect changed (Fig. 8b) but when moving the detachable support to a ∼10% strain, a decreased of 10% is observed for the diameter and the twisted aspect is lost (Fig. 8c). Thus, our observations confirm that the fibrils got closer to one another during the stretching, favouring the percolation of the G flakes (percolation) and inducing the increase of conductivity.
3.5. Mechanical and electrical behaviors of G coated cotton yarn along extension cycling
In the previous section, an increase in the electrical conductivity of our G-coated cotton yarns under continuous stretching was demonstrated and a maximum of conductivity was obtained before yearn breaking. In the following, the evolution of conductivity and surface resistance upon cyclic loading is investigated at different strain values (4%, 8%, 10% and 12%). The results are given in Fig. 9. | ||
| Fig. 9 Mechanical and electrical properties of G coated cotton yarns under extension cycling (30 cycles): (a) 4%, (b) 8%, (c) 10% and (d) 12%. | ||
To test the mechanical and electrical properties of the yarns at these strains, we repeated the experiments for 30 cycles (procedure 3). For all investigated samples, it can be observed that the remaining deformation after removing the stress increases from 3% to 9% by increasing the initial strain from 4% to 12% (Fig. 9). Repeated stretching cycles initially caused a macro level structural consolidation due to a change in the arrangement of the fibers within the yarn. Any looseness in the yarn got evened out after 6 cycles reaching a plateau as one can see from the evolution of the elongation over time. For the sample stretched at 10%, the plateau is reached at a strain of 31 MPa (Fig. 9c). For the latter, the conductivity increased during the first cycle from σelecini = 4 × 10⁻⁵ S cm−1 to σelecmax = 0.21 S cm−1 at εmax = 10% and then decreased to σelecmin = 0.031 S cm−1 at εmin = 8% for F = 0 N. This behavior indicates that the fibers realigned irreversibly and got closer to each other favouring the contact between the G flakes and increasing the conductivity even at F = 0 N as discussed by Chattopadhyay et al.69 For the next 29 cycles, the variation between σelecmax and σelecmin may be explained by the partially reversible deformation of the yarn: the fibers were brought closer and further during the loading-unloading cycles. The conductivity varies between σelecmin at εmin and σelecmax at εmax without decreasing back to σelecini (Fig. 9c). The same behavior was observed for G coated yarns stressed at 4%, 8% and 12% (Fig. 9). The reversible behavior of the electrical conductivity during the stretching and the preservation of the enhanced conductivity during 30 cycles indicate a good resistance to repeated mechanical efforts.
Finally, the variation of the electric conductivity of G-coated cotton yarn was studied following procedure 4, i.e. successively increasing the strain by steps of 1% and keeping the strain constant during one minute between each stretching step (Fig. 10) to analyse the impact of relaxation phenomena on the evolution of the electrical conductivity at different strains.
 | ||
| Fig. 10 Electrical and mechanical properties of G coated cotton yarn upon successive increase in strain by steps of 1% with keeping the strain constant for 1 min between each stretching step. | ||
An increase of the conductivity with increasing εmin is observed. When the maximum strain εmax is kept constant, the stress still slightly increases leading to a slight increase of the conductivity as well. As previously observed, the increase in conductivity is lower at higher deformation (i.e. 29% for a yarn in the strain range from 0% to 1%, 15% in the strain range from 9% to 10% and 13% in the strain range from 10% to 11%). This approach demonstrates that the irreversible deformation of the cotton yarn increases with increasing the strain, leading consequently to an increase in the electrical conductivity of the released yarn.
SEM images of yarns deformed at strains of 4%, 8% and 12% and then released (Fig. S1, ESI†) show the same change in the structural aspect of the yarn previously discussed under continuous stretching. The fibrils remained closer and a decrease in diameter and loss of the twisted aspect is observed even when the strain applied was released, explaining the persistence of the enhancement effect of conductivity.
A maximum electrical conductivity of 1.1 S cm−1 was thus reached in the current study. With graphene, a similar conductivity (≈1.9 S cm−1) was only achieved for cotton fabric,54 but not for cotton yarns. For cotton yarns, comparable values of conductivity (≈2.8 S cm−1) were achieved using other types of dipping suspensions based on CNT.29 In a different study using graphene derived materials (rGO52), the achieved conductivity was far less important (≈3 × 10⁻⁵ S cm−1). An increase of conductivity upon stretching was also reported by Park et al.56 on wool yarn coated with graphene and PVA. However, they observed an increase of their conductivity of only 10% at maximum stretching of the wool yarn which is much less that the increase by more than three decades reported in the current study. Furthermore, the coupled evolution of the electrical and mechanical properties of graphene coated cotton yarns upon repeated loading/unloading cycles is reported in the current study, bringing important information, rarely discussed in the scientific literature, about the yarn resistance to repeated mechanical efforts.
4. Conclusions
A facile and efficient aqueous coating method to immobilize graphene sheets onto cotton yarns by using enhanced electrostatic interactions obtained via cationization has been demonstrated in the present study. Dipping cotton yarns in our graphene dispersions under ultrasounds at 3 °C during 1 h allowed a dry pick-up percentage of 14% of graphene on the cationized cotton yarns. The electrical conductivity of the graphene coated yarns was measured under uniaxial deformation. An increase in conductivity by up to four decades is reported under continuous mechanical stretching, leading to conductivity values as high as 1.1 S cm−1 before yarn breaking. Further in situ coupled electrical/mechanical investigations under cyclic loading/unloading demonstrated that the enhancement effect observed during the first deformation cyclic is irreversible, leading to permanent conductivity values that are much higher than the initial conductivity of the undeformed yarns. Furthermore, for a large range of deformation amplitudes, reversible conductivity/stress curves are obtained after the first deformation cycle, proving stable electrical and mechanical properties upon subsequent mechanical deformation. Pre-stretching represents thus an efficient treatment to irreversibly and permanently enhance the conductivity of graphene coated yarns and obtain stable properties. This can open new perspectives in the development of conductive textile yarns, with possible applications in the field of smart textile materials.Conflicts of interest
There are no conflicts to declare.Acknowledgements
We gratefully acknowledge the Common Center for Optical Micro-spectrometry (CECOMO) for Raman spectroscopy support, the Laboratory of Automatic Control, Chemical and Pharmaceutical Engineering (LAGEPP) for the use of the Electro Kinetic Analyzer, Science et Surface (a subsidiary of SERMA Technologies) for SEM microscopy images, the AURA region and the collaborators of the FILOGRAPH project.Notes and references
- V. Koncar, in Smart Textiles and Their Applications, Elsevier Inc., 2016, pp. 1–8 Search PubMed.
- T. Textor and B. Mahltig, Appl. Surf. Sci., 2010, 256, 1668–1674 CrossRef CAS.
- T. Harifi and M. Montazer, Carbohydr. Polym., 2012, 88, 1125–1140 CrossRef CAS.
- A. R. Horrocks, B. K. Kandola, P. J. Davies, S. Zhang and S. A. Padbury, Polym. Degrad. Stab., 2005, 88, 3–12 CrossRef CAS.
- E. Romero, J. Bonastre, F. Cases, A. I. del Río and J. Molina, Text. Res. J., 2011, 81, 909–911 CrossRef.
- L. Karimi, M. E. Yazdanshenas, R. Khajavi, A. Rashidi and M. Mirjalili, Cellulose, 2014, 21, 3813–3827 CrossRef CAS.
- X. X. Zhang, X. C. Wang, X. M. Tao and K. L. Yick, J. Mater. Sci., 2005, 40, 3729–3734 CrossRef CAS.
- G. Cai, Z. Xu, M. Yang, B. Tang and X. Wang, Appl. Surf. Sci., 2017, 393, 441–448 CrossRef CAS.
- Z. Chai, N. Zhang, P. Sun, Y. Huang, C. Zhao, H. J. Fan, X. Fan and W. Mai, ACS Nano, 2016, 10, 9201–9207 CrossRef CAS PubMed.
- T. L. Andrew, L. Zhang, N. Cheng, M. Baima, J. J. Kim, L. Allison and S. Hoxie, Acc. Chem. Res., 2018, 51, 850–859 CrossRef CAS PubMed.
- M. Bariya, H. Y. Y. Nyein and A. Javey, Nat. Electron., 2018, 1, 160–171 CrossRef.
- D. P. Hansora, N. G. Shimpi and S. Mishra, RSC Adv., 2015, 5, 107716–107770 RSC.
- M. Stoppa and A. Chiolerio, Sensors, 2014, 14, 11957–11992 Search PubMed.
- J. Molina, RSC Adv., 2016, 6, 68261–68291 RSC.
- G. B. Tseghai, B. Malengier, K. A. Fante, A. B. Nigusse and L. Van Langenhove, Sensors, 2020, 20, 1–28 Search PubMed.
- X. Li, R. Wang, L. Wang, A. Li, X. Tang, J. Choi, P. Zhang, M. L. Jin and S. W. Joo, Nanotechnol. Rev., 2020, 9, 1183–1191 CrossRef CAS.
- J. Cho, J. Moon, K. Jeong and G. Cho, Fibers Polym., 2007, 8, 330–334 CrossRef CAS.
- N. P. Fromme, Y. Li, M. Camenzind, C. Toncelli and R. M. Rossi, Adv. Electron. Mater., 2021, 7, 2001238 CrossRef CAS.
- Z. Hassan, F. Kalaoglu and O. Atalay, Text. Res. J., 2020, 90, 1792–1804 CrossRef CAS.
- V. Malm, F. Seoane and V. Nierstrasz, Materials, 2019, 12, 1–18 CrossRef PubMed.
- R. Wang, Q. Zhai, T. An, S. Gong and W. Cheng, Talanta, 2021, 222, 121484 CrossRef CAS PubMed.
- O. Nechyporchuk, J. Yu, V. A. Nierstrasz and R. Bordes, ACS Sustainable Chem. Eng., 2017, 5, 4793–4801 CrossRef CAS.
- Y. Atwa, N. Maheshwari and I. A. Goldthorpe, J. Mater. Chem. C, 2015, 3, 3908–3912 RSC.
- M. K. Smith and K. A. Mirica, J. Am. Chem. Soc., 2017, 139, 16759–16767 CrossRef CAS PubMed.
- N. Coppedè, G. Tarabella, M. Villani, D. Calestani, S. Iannotta and A. Zappettini, J. Mater. Chem. B, 2014, 2, 5620–5626 RSC.
- G. Mattana, P. Cosseddu, B. Fraboni, G. G. Malliaras, J. P. Hinestroza and A. Bonfiglio, Org. Electron., 2011, 12, 2033–2039 CrossRef CAS.
- J. Xu, D. Wang, L. Fan, Y. Yuan, W. Wei, R. Liu, S. Gu and W. Xu, Org. Electron., 2015, 26, 292–299 CrossRef CAS.
- P. Xue, K. H. Park, X. M. Tao, W. Chen and X. Y. Cheng, Compos. Struct., 2007, 78, 271–277 CrossRef.
- B. S. Shim, W. Chen, C. Doty, C. Xu and N. A. Kotov, Nano Lett., 2008, 8, 4151–4157 CrossRef CAS PubMed.
- Q. He, S. Wu, Z. Yin and H. Zhang, Chem. Sci., 2012, 3, 1764–1772 RSC.
- A. K. Geim, Science, 2009, 324, 1530–1534 CrossRef CAS PubMed.
- K. S. Novoselov, V. I. Fal’Ko, L. Colombo, P. R. Gellert, M. G. Schwab and K. Kim, Nature, 2012, 490, 192–200 CrossRef CAS PubMed.
- L. Ripoll, C. Bordes, P. Marote, S. Etheve, A. Elaissari and H. Fessi, Colloids Surf., A, 2012, 397, 24–32 CrossRef CAS.
- A. Guimont, E. Beyou, P. Alcouffe, G. Martin, P. Sonntag and P. Cassagnau, Polymer, 2013, 54, 4830–4837 CrossRef CAS.
- A. Guimont, E. Beyou, P. Alcouffe, P. Cassagnau, A. Serghei, G. Martin and P. Sonntag, Polymer, 2014, 55, 22–28 CrossRef CAS.
- A. Dhahri, A. Serghei, G. Farzi, M. H. V. Baouab and E. Beyou, Eur. Polym. J., 2016, 78, 153–162 CrossRef CAS.
- A. Pazat, E. Beyou, C. Barrès, F. Bruno and C. Janin, Appl. Surf. Sci., 2017, 396, 902–911 CrossRef CAS.
- A. Pazat, C. Barrès, F. Bruno, C. Janin and E. Beyou, Polym. Rev., 2018, 58, 403–443 CrossRef CAS.
- D. Kowalczyk, W. Fortuniak, U. Mizerska, I. Kaminska, T. Makowski, S. Brzezinski and E. Piorkowska, Cellulose, 2017, 24, 4057–4068 CrossRef CAS.
- K. Javed, C. M. A. Galib, F. Yang, C. M. Chen and C. Wang, Synth. Met., 2014, 193, 41–47 CrossRef CAS.
- B. Fugetsu, E. Sano, H. Yu, K. Mori and T. Tanaka, Carbon, 2010, 48, 3340–3345 CrossRef CAS.
- Y. J. Yun, W. G. Hong, W.-J. Kim, Y. Jun and B. H. Kim, Adv. Mater., 2013, 25, 5701–5705 CrossRef CAS PubMed.
- I. A. Sahito, K. C. Sun, A. A. Arbab, M. B. Qadir, Y. S. Choi and S. H. Jeong, J. Power Sources, 2016, 319, 90–98 CrossRef CAS.
- Z. Lu, C. Mao and H. Zhang, J. Mater. Chem. C, 2015, 3, 4265–4268 RSC.
- A. Chatterjee, M. Nivas Kumar and S. Maity, J. Text. Inst., 2017, 108, 1910–1916 CrossRef CAS.
- M. Tas, Y. Altin and A. Bedeloglu, J. Text. Inst., 2019, 110, 67–73 CrossRef CAS.
- M. K. Yapici, T. Alkhidir, Y. A. Samad and K. Liao, Sens. Actuators, B, 2015, 221, 1469–1474 CrossRef CAS.
- A. M. Abdelkader, N. Karim, C. Vallés, S. Afroj, K. S. Novoselov and S. G. Yeates, 2D Mater., 2017, 4, 035016 CrossRef.
- J. Molina, J. Fernández, J. C. Inés, A. I. Del Río, J. Bonastre and F. Cases, Electrochim. Acta, 2013, 93, 44–52 CrossRef CAS.
- S. Pei and H.-M. Cheng, Carbon, 2012, 50, 3210–3228 CrossRef CAS.
- N. Karim, S. Afroj, S. Tan, P. He, A. Fernando, C. Carr and K. S. Novoselov, ACS Nano, 2017, 11, 12266–12275 CrossRef CAS PubMed.
- S. Afroj, N. Karim, Z. Wang, S. Tan, P. He, M. Holwill, D. Ghazaryan, A. Fernando and K. S. Novoselov, ACS Nano, 2019, 13, 3847–3857 CrossRef CAS PubMed.
- Y. J. Yun, H. J. Lee, T. H. Son, H. Son and Y. Jun, Compos. Sci. Technol., 2019, 184, 107845 CrossRef CAS.
- S. Afroj, S. Tan, A. M. Abdelkader, K. S. Novoselov and N. Karim, Adv. Funct. Mater., 2020, 30, 2000293 CrossRef CAS.
- H. Ba, G. Giambastiani, C. Pham-Huu, L. Truong-Phuoc, V. Papaefthimiou, C. Sutter, S. Pronkin, A. Bahouka, Y. Lafue and L. Nguyen-Dinh, ACS Appl. Nano Mater., 2020, 3, 9771–9783 CrossRef CAS.
- J. J. Park, W. J. Hyun, S. C. Mun, Y. T. Park and O. O. Park, ACS Appl. Mater. Interfaces, 2015, 7, 6317–6324 CrossRef CAS PubMed.
- P. Cataldi, L. Ceseracciu, A. Athanassiou and I. S. Bayer, ACS Appl. Mater. Interfaces, 2017, 9, 13825–13830 CrossRef CAS PubMed.
- A. M. Díez-Pascual, C. Vallés, R. Mateos, S. Vera-López, I. A. Kinloch and M. P. S. Andrés, Soft Matter, 2018, 14, 6013–6023 RSC.
- A. C. Ferrari, J. C. Meyer, V. Scardaci, C. Casiraghi, M. Lazzeri, F. Mauri, S. Piscanec, D. Jiang, K. S. Novoselov, S. Roth and A. K. Geim, Phys. Rev. Lett., 2006, 97, 187401 CrossRef CAS PubMed.
- M. Poorsargol, M. Alimohammadian, B. Sohrabi and M. Dehestani, Appl. Surf. Sci., 2019, 464, 440–450 CrossRef CAS.
- I. A. Sahito, K. C. Sun, A. A. Arbab, M. B. Qadir and S. H. Jeong, Carbohydr. Polym., 2015, 130, 299–306 CrossRef CAS PubMed.
- S. Vadukumpully, J. Paul and S. Valiyaveettil, Carbon, 2009, 47, 3288–3294 CrossRef CAS.
- R. Cui and F. Zhu, Trends Food Sci. Technol., 2021, 107, 491–508 CrossRef CAS.
- M. Marx-Figini, Angew. Makromol. Chem., 1997, 250, 85–92 CrossRef CAS.
- S. Renouard, C. Hano, J. Doussot, J.-P. Blondeau and E. Lainé, Mater. Lett., 2014, 129, 137–141 CrossRef CAS.
- O. Harzallah, H. Benzina and J.-Y. Drean, Text. Res. J., 2010, 80, 1093–1102 CrossRef CAS.
- Z. Zupin and K. Dimitrovski, in Woven Fabric Engineering, ed. P. D. Dubrovski, Sciyo, 2010 Search PubMed.
- L. Xie, B. Shan, H. Xu, J. Li, Z. M. Li and Q. Zheng, ACS Appl. Nano Mater., 2018, 1, 2406–2413 CrossRef CAS.
- R. Chattopadhyay and S. K. Sinha, Fibers Polym., 2011, 12, 268–274 CrossRef CAS.
Footnote |
| † Electronic supplementary information (ESI) available. See DOI: 10.1039/d1tc03055h |
| This journal is © The Royal Society of Chemistry 2021 |