 Open Access Article
Creative Commons Attribution 3.0 Unported Licence
Increasing resonance energy transfer upon dilution: a counterintuitive observation in CTAB micelles†
Andrea
Delledonne
 a,
Judit
Morla-Folch
 bc,
Mattia
Anzola
a,
Francesco
Bertocchi
a,
Guillem
Vargas-Nadal
bc,
Mariana
Köber
bc,
Cristina
Sissa
bc,
Mattia
Anzola
a,
Francesco
Bertocchi
a,
Guillem
Vargas-Nadal
bc,
Mariana
Köber
bc,
Cristina
Sissa
 a,
Nora
Ventosa
*bc and
Anna
Painelli
 *a
*a
aDipartimento di Scienze Chimiche, della Vita e della Sostenibilità Ambientale, Università di Parma, Parco Area delle Scienze 17A, 43124, Parma, Italy. E-mail: anna.painelli@unipr.it
bInstitut Ciencia dels Materials de Barcelona (ICMAB-CSIC), Campus UAB, 08193, Cerdanyola, Spain. E-mail: ventosa@icmab.es
cCentro de Investigación Biomédica en Red CIBER-BBN, Barcelona, Spain
First published on 21st July 2021
Abstract
We present a comprehensive study of two indocarbocyanines, DiI (1,1′-dioctadecyl-3,3,3′3′-tetramethylindocarbocyanine perchlorate) and DiD (1,1′-dioctadecyl-3,3,3′,3′-tetramethylindodicarbocyanine perchlorate), in water suspensions in the presence of a CTAB surfactant both above and below the critical micellar concentration. The very good affinity of the two dyes with CTAB allows them to be brought into aqueous solutions minimizing aggregation phenomena. When the dyes are loaded inside the micelles, stable fluorescent nanostructures are formed that can be exploited for fundamental studies and for imaging applications. Of special interest are micelles loaded with both dyes: indeed, the large local dye concentration inside the micelles allows observing resonance energy transfer in systems where the global dye concentration is maintained at a low level, so that detailed and robust spectroscopic characterization is possible. Quite impressively, the efficiency of resonance energy transfer is boosted when diluting the sample below the critical micellar concentration. This counterintuitive result is explained in terms of the very large affinity between the dyes and CTAB which favors the dynamical formation of small molecular clusters containing both dyes. Fluorescent micelles are widely used in bioimaging and pharmacokinetic applications. More specifically, the observation of resonant energy transfer in micelles or more generally in nanostructures loaded with two dyes is routinely exploited as a way to assess the nanostructure integrity. In this context, our results demonstrate the importance of robust spectroscopic characterization of the relevant systems in different environments in order to safely assess the viability of the integrity test of nanoparticles based on resonant energy transfer.
A. Introduction
Cyanines are a well-known family of organic dyes exploited in a wide range of applications, from photography to photodynamic therapy,1–8 thanks to their intense and narrow absorption and fluorescence bands that can be tuned from the visible to the near-IR via careful chemical design.9 Cyanine dyes show a marked propensity to aggregate, indeed molecular aggregates were first reported in 1936 by Jelley, who described the intense red-shifted absorption of J-aggregates of PIC.10 Aggregation is often considered a detrimental feature, degrading the optical properties of dyes, blurring their spectra and possibly suppressing their fluorescence. However, in some systems, aggregation can be exploited to manipulate the optical properties of the material at hand, enhancing its performances for specific applications. This is precisely the case for J-aggregates of cyanine dyes, which historically played an important role in technological applications such as optical recording or color photography.11–14 Currently, cyanines are extensively exploited in biomedical applications, mainly as fluorescent tags for bioimaging, due to their high brightness, resulting from their very large molar extinction coefficient and good fluorescence quantum yield. A clever design of lateral groups of the core cyanine unit leads to effective and selective tags for specific biotargets, including DNA,15–18 proteins,19–22 nucleic acids23 and membranes.24–28Water-compatibility is a general problem that hinders the exploitation of organic dyes in several fields, including biomedicine, nutraceutics, cosmetics, inks, etc.29 In this respect, the aggregation of cyanine dyes in water represents a major problem. Several strategies are available to embed dyes in different nanoparticles, as to make them water-compatible. Typical examples are the inclusion of dyes in dendrimer-like structures,30,31 in silica nanoparticles,32–34 and in polymeric and lipidic nanostructures.35–45 Of particular interest are quatsomes, a family of highly stable non-liposomal nanovesicles, developed by Jaume Veciana and co-workers. Quatsomes are an innovative class of nanovesicles, where a quaternary ammonium surfactant (typically cetyltrimethylammonium bromide (CTAB)) self-assembles with sterols (i.e., cholesterol) to form closed bilayers with size tunable in the 80–100 nm range.46,47 Quatsomes show a high homogeneity in terms of size, morphology and lamellarity. Moreover, they are extremely stable upon dilution, with a shelf-life exceeding 3 years. Via a careful adjustment of the dye loading in quatsomes, brilliant, stable, and biocompatible fluorescent nano-tags have recently been obtained.48,49
Dye loaded nanoparticles are very interesting not just for applicative purposes, but also for fundamental studies. Stable nanoparticles can in fact be exploited for detailed spectroscopic studies of the physics of clusters of dyes, to address aggregation and resonance energy transfer (RET), without being hindered by the experimental problems related to spectroscopic measurements in highly concentrated solutions.
RET is a well-known process where an excited dye, the energy donor, transfers its energy to another dye, the energy acceptor. RET is an incoherent process, driven by intermolecular electrostatic interactions, and occurs for intermolecular distances in the 1–10 nm range. It requires a sizable overlap between the emission spectrum of the donor molecule and the absorption band of the acceptor dye. RET governs many natural phenomena, and specifically it is at the heart of photosynthesis.50,51 It is widely exploited in biomedical studies, where the large dependence of the RET efficiency on the distance between the energy donor and acceptor dyes is exploited to estimate distances at the nanoscale, making it a useful molecular ruler.52 RET also offers the possibility of investigating the stability of nanoparticles in different environments and over time, a useful feature for pharmacokinetics and drug-delivery studies.53
Here we investigate two dyes, DiI (1,1′-dioctadecyl-3,3,3′3′-tetramethylindocarbocyanine perchlorate) and DiD (1,1′-dioctadecyl-3,3,3′,3′-tetramethylindodicarbocyanine perchlorate) (Fig. 1) belonging to the family of indocarbocyanines. DiI and DiD are not soluble in water and their chromophoric core is decorated with two long alkyl chains (C18) in order to make their interaction with lipophilic environments favorable. For our purposes, the hydrocarbon tails of DiI and DiD are of interest as they favor the interaction of the dye with the alkyl chain of surfactants, like CTAB (see Fig. 1), a widely used amphiphilic molecular building block for colloidal nanoparticles. DiI and DiD have high extinction coefficients1 and are compatible dyes for RET, with DiI and DiD representing the energy donor and acceptor, respectively.54–56
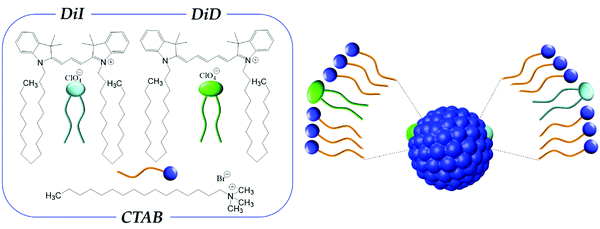 | ||
| Fig. 1 Left panel: molecular structures of CTAB, DiI and DiD. Right panel: schematic representation of a CTAB micelle loaded with DiI and DiD. | ||
In the first section, we study the behavior of CTAB micelles loaded with either DiI or DiD. Micellar nanostructures composed of amphiphilic molecules are thermodynamically stable colloidal structures. At variance with nanovesicles, such as quatsomes, CTAB micelles show a high critical micellar concentration (CMC),57 and are therefore easily destroyed upon dilution. A detailed spectroscopic analysis demonstrates a very good affinity of both dyes with the micellar environment, so that the dyes can be brought in aqueous environments without degrading their useful spectroscopic properties as expressed in organic solvents. Specifically, at CTAB concentrations above the CMC, marginal aggregation phenomena are observed. Below the CMC, when micelles are mostly dissociated, aggregation phenomena become important.
In the second section, we address RET in micellar systems loaded with both DiI and DiD. Above the CMC, RET is observed, suggesting that inside the micelles, intermolecular interactions are large enough to induce RET, but they are not sufficiently strong to drive aggregation. Indeed, RET may also occur as a result of short occasional encounters between the donor and acceptor dyes,58 while the observation of aggregation effects in optical spectra requires the formation of stable and strongly interacting aggregates. The most intriguing result however is the observation of an important increase of RET efficiency below the CMC. This somewhat counterintuitive result suggests that the affinity of the dyes with CTAB is so large as to allow for the proximity of two dyes in small CTAB clusters. More dramatically, our results demonstrate that a preliminary full characterization of RET in the different environments of interest is needed in order to reliably assess the nanoparticle integrity via RET studies. Molecular dynamics (MD) simulations support our main conclusions.
B. Results and discussion
B.1 Spectroscopic properties of CTAB micelles loaded with DiI or DiD
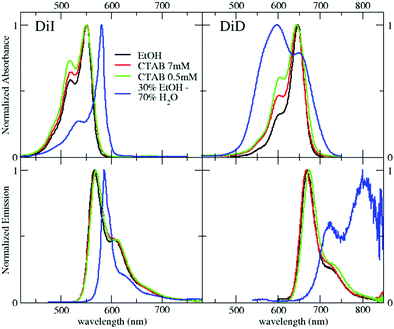
DiI and DiD were studied in different environments: (i) in ethanol, where they are soluble, (ii) in ethanol/water mixtures, and (iii) in water suspensions at different CTAB concentrations, below and above the critical micellar concentration (CMC). Details on the composition of the different formulations are reported in Table S1 (ESI†). Fig. 2 shows the absorption and emission spectra of DiI (left) and DiD (right), and relevant data are collected in Table 1. Both dyes are soluble in ethanol, with large extinction coefficients and high fluorescence quantum yields (Table 1). Water largely affects the optical properties of the dyes: both dyes aggregate in a 30/70 ethanol/water mixture (volume fractions). DiI forms J-aggregates, as demonstrated by the red-shifted absorption and emission bands, by the narrowing of the 0–0 band and the minimal Stokes shift. Conversely, DiD forms H-aggregates: the absorption spectrum blue-shifts and broadens, while emission is strongly suppressed and largely red-shifted thus generating a large Stokes shift.59,60 The different behavior of DiI and DiD forming emissive J-aggregates and poorly emissive H-aggregates, respectively, has been already reported in the literature.61,62 Further information about the characterization of DiI and DiD aggregates in ethanol/water is reported in the Supporting Information (Fig. S1 and Table S2, ESI†).| DiI | DiD | |||||
|---|---|---|---|---|---|---|
| Molar extinction coefficient (M−1 cm−1) at λmax | Fluorescence quantum yield (%) | Fluorescence lifetimed (ns) | Molar extinction coefficient (M−1 cm−1) at λmax | Fluorescence quantum yield (%) | Fluorescenced lifetime (ns) | |
| a From ref. 50. b Molar extinction coefficients are estimated from a linear regression of the absorbance measured for CTAB suspensions at concentrations of 7 mM, 2 mM and 1 mM. To minimize inner filter effects, the quantum yield is measured from the 1 mM CTAB suspension and 1 mM CTAB diluted with water to have a suspension with absorbance < 0.1 throughout the whole spectra. c Both the extinction coefficient and the quantum yield change with the concentration, and the reported values refer to 0.5 mM CTAB solution. The quantum yield of DiD, measured in a suspension with absorbance ≈0.15, can be slightly underestimated due to self-absorption phenomena. d Average lifetime and details about the fitting procedure are reported in Table S3 (ESI). | ||||||
| Ethanola | 140![[thin space (1/6-em)]](https://www.rsc.org/images/entities/char_2009.gif) 000 000 |
10 | 0.4 | 246![[thin space (1/6-em)]](https://www.rsc.org/images/entities/char_2009.gif) 000 000 |
37 | 1.31 |
| CTAB in water (above the CMC)b | 121![[thin space (1/6-em)]](https://www.rsc.org/images/entities/char_2009.gif) 000 000 |
11 | 0.55 | 194![[thin space (1/6-em)]](https://www.rsc.org/images/entities/char_2009.gif) 000 000 |
23 | 1.34 |
| CTAB in water (below the CMC)c | 108![[thin space (1/6-em)]](https://www.rsc.org/images/entities/char_2009.gif) 000 000 |
6 | 0.30 | 163![[thin space (1/6-em)]](https://www.rsc.org/images/entities/char_2009.gif) 000 000 |
5 | 0.65 |
It is important to devise easy strategies to bring DiI and DiD in aqueous environments without degrading their optical properties. Surfactants are often employed to bring lipophilic molecules in water.55,63,64 CTAB, one of the most extensively studied cationic surfactants, forms spherical micelles (diameter ∼2–3 nm) in water at concentrations larger than the critical micellar concentration (CMC) ≈ 0.9 mM, and above the Krafft temperature of 25 °C.57,65,66 At very large concentrations of CTAB (>100mM), wormlike structures are observed.67 A 7 mM CTAB suspension (well above the CMC) was prepared and highly concentrated DiI or DiD solutions in ethanol were added to the suspension (see the Technical section), resulting in a final dye concentration of 11 μM. DLS measurements (Fig. S2, ESI†) confirm the formation of micelles for CTAB concentrations above 1 mM. The micelle size, with mean diameters of 2–5 nm either in the presence and absence of DiI, is in line with previous studies.65,66
Absorption and emission spectra of the suspensions are shown in Fig. 2. The spectra of the two dyes in the micellar environment contrast sharply with the spectra of the dyes in the aqueous environment, demonstrating the encapsulation of the dye in the micelles. Moreover, the interactions among the dyes, which strongly affect the optical properties in ethanol/water mixtures, are marginal in the micellar environment. Indeed, the absorption spectra in the micellar environment are very similar to those obtained in ethanol solutions, showing only a modest increase of the relative intensity in the region of the 0–1 vibronic shoulder, a feature usually associated with the formation of weakly interacting H-aggregates.61 The optical properties of the suspensions are only marginally altered upon dilution to 1 mM CTAB (maintaining the concentration ratio between the dyes and CTAB constant), suggesting that the local environment of the dyes inside the micelles is barely affected, as long as the CTAB concentration is higher than the CMC (Fig. S3, ESI†).
The molar extinction coefficients of DiI and DiD in suspensions above the CMC are lower than in ethanol solutions, with a more pronounced effect for DiD (≈20% decrease) than for DiI (≈13% decrease). The fluorescence quantum yield of DiI is ≈10% either in ethanol or in 1 mM CTAB suspension. For DiD, the fluorescence quantum yield slightly decreases from 37% in ethanol to 23% in 1 mM CTAB suspension. These observations are in line with the formation of weak H-aggregates in micelles, an effect somewhat more important for cyanine dyes with longer conjugated structures,68 as already inferred from spectral bandshapes.48,49 The fluorescence lifetime of DiI slightly increases in CTAB suspensions compared to ethanol solutions, while it is barely affected for DiD, in agreement with the behavior observed in quatsomes49 and related systems.18,56
B.2 Anisotropy studies of CTAB micelles loaded with DiI or DiD
Fluorescence anisotropy offers additional valuable information on the dye encapsulation (details about fluorescence anisotropy measurements are reported in the Technical section). When the rotational motion of the dye competes with the fluorescence lifetimes, the fluorescence anisotropy decreases. The Perrin equation relates the anisotropy to the rotational correlation time, tc (which depends on the molecular volume, temperature and medium viscosity) and the fluorescence lifetime, t:69 | (1) |
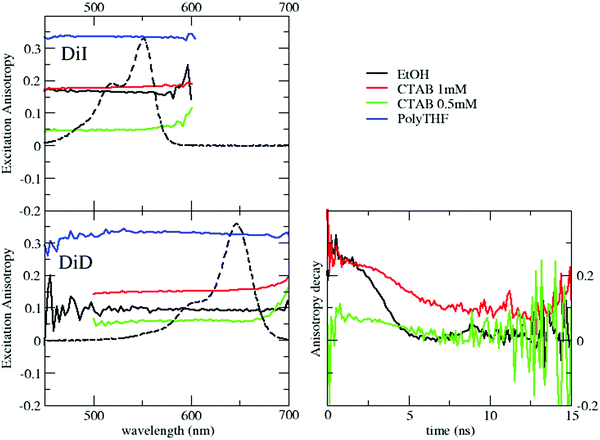
The fluorescence excitation anisotropy spectra of DiI and DiD in polyTHF, ethanol and micellar environments above and below the CMC are shown in Fig. 3. In all cases, the anisotropy is flat within the excitation band, suggesting that a single excited state is involved in the transition.
The anisotropies measured in ethanol for DiI and DiD amount to r ∼ 0.17 and 0.1, respectively. These values are much lower than those measured in polyTHF (r ∼ 0.33), as expected due to the fast rotational diffusion in the low viscosity solvent. Table 2 lists rotational correlation times, calculated using the Perrin eqn (1). We set the intrinsic anisotropy r0 to the value measured in polyTHF, assuming that in this viscous medium the rotational time is much longer than the fluorescence lifetime. For ethanol solutions and for micellar systems we get rotational times of the same order of magnitude as the fluorescence lifetime. In ethanol, in spite of its larger dimension, DiD has a lower r value than DiI due to its longer emission lifetime. Indeed a larger rotational correlation time is estimated for DiD than for DiI. In 1 mM CTAB suspensions, the excitation anisotropy is larger than in ethanol for either DiI or DiD. Since ethanol is more viscous than water, the larger r observed in water is attributed to a slower rotational diffusion (see Table 2), compatible with the encapsulation of the dyes inside the micelles. However, for micellar systems the estimated rotational time is an effective quantity that accounts for two independent motions: the motion of the dye inside the micelles and the rotation of the micelle itself: disentangling the two contributions is not trivial. The motion of dyes encapsulated in micelles is slower than in solution and the micelles themselves are big objects compared to molecules, with slower rotational diffusion (the modest increase in anisotropy observed for DiI in CTAB micelles when compared to the dye in ethanol is justified by the concomitant increase of lifetime). The marginal depolarization of DiI and DiD in the micellar environment confirms marginal interchromophore interactions inside the micelles, leading to negligible homo-energy transfer and aggregation phenomena for the dye loading under consideration.
| Sample | t c [ns] |
|---|---|
| DiI in EtOH | 0.38 |
| DiI in 1 mM CTAB | 0.64 |
| DiD in EtOH | 0.53 |
| DiD in 1 mM CTAB | 1.13 |
B.3 Spectroscopic properties of CTAB micelles loaded with DiI or DiD below the CMC
We now turn our attention to the behavior of dyes in CTAB suspensions below the CMC. Fig. 2 shows the absorption and emission spectra of DiI and DiD in 0.5 mM CTAB suspensions obtained upon dilution of the 7 mM CTAB suspension with distilled water (see Table S1, ESI†). The absorption intensity in the region of the 0–1 vibronic shoulder increases for both DiI and DiD below the CMC, suggesting a more important formation of aggregates (Fig. S4, ESI†). The emission profile of DiI and DiD is barely affected by dilution below the CMC, suggesting that in all cases the emission mainly comes from non-aggregated species: the concentration of J-aggregates is negligible. Moreover, the fluorescence lifetimes become shorter, and the quantum yield decreases both for DiI and DiD (Table 1). We ascribe these results to the formation of weak, poorly emissive H-aggregates. However, the aggregates formed in 0.5 mM CTAB suspensions are qualitatively different from those observed in mixed ethanol/water. In the first place, both dyes form weak H-aggregates, while DiI forms J-aggregates in ethanol/water mixture. Moreover, intermolecular interactions remain weak, with marginal spectroscopic effects, if compared with aggregates formed in mixed ethanol/water solutions. We underline that these weak H-aggregates are only obtained upon dilution of preformed micellar systems containing 11 μM dye concentration. Indeed, when adding DiI stock solutions to a 0.5mM CTAB suspension we obtain aggregates qualitatively similar to those obtained in ethanol/water mixtures (Fig. S5, ESI†).B.4 Anisotropy studies of CTAB micelles loaded with DiI or DiD below the CMC
Excitation anisotropy data further confirm the proposed interpretation. For both DiD and DiI in 0.5 mM CTAB suspensions r has a value even lower than that in ethanol, pointing to a highly depolarized emission (Fig. 3). Since the rotational motion of the dyes in water in the presence of CTAB cannot be substantially faster than in ethanol solutions, the observed large depolarization is safely ascribed to homo-RET processes that, allowing for the hopping of the excitation among different dyes, effectively depolarize the emission. Under these conditions, of course, rotational times cannot be estimated.Additional information is obtained from time resolved anisotropy of DiD in different environments (for DiI, its very short lifetime makes these measurements impossible). Data in Fig. 3 show that for DiD in ethanol and in the micellar environment (above the CMC) the initial anisotropy value, r = 0.3, is large and close to r0 as measured in polyTHF. Over time, r decays rapidly towards full depolarization (r = 0) in ethanol, and much more slowly in micelles, due to the different rotational times of the two systems, in agreement with the observed steady state emission anisotropy. The behavior observed below the CMC (green trace) is qualitatively different: the anisotropy is very low (r < 0.1) at the earliest accessible time (≈1 ns), confirming that depolarization in this case is due to homo-transfer processes. Overall, fluorescence anisotropy data fully support the hypothesis that in CTAB suspensions below the CMC, DiD and DiI form weak H-aggregates.
The micelles loaded with DiI and DiD are very stable at 7 mM CTAB concentration: after a few days from preparation, their absorption spectra show a marginal increase of the 0–0 vibronic transition at the expense of the 0–1, and a concomitant increase of the emission intensity (Fig. S6 and S7, ESI†). These results suggest that, over time, the weak H-aggregates formed just after the preparation tend to disappear. The stability of the system drastically decreases below the CMC: absorbance and emission intensities decrease after a few days, and the spectra suggest the progressive formation of aggregates, possibly accompanied by some degradation.
B.5 RET in micelles simultaneously loaded with DiI and DiD
Data presented in the previous section demonstrate the successful encapsulation of DiI or DiD in CTAB micelles, with marginal aggregation phenomena. The emission of DiI overlaps with the absorption of DiD (Fig. 2), making them an efficient RET-pair, as previously demonstrated in quatsomes49 and SDS micelles.55 CTAB micelles loaded with both DiI and DiD (1![[thin space (1/6-em)]](https://www.rsc.org/images/entities/char_2009.gif) :
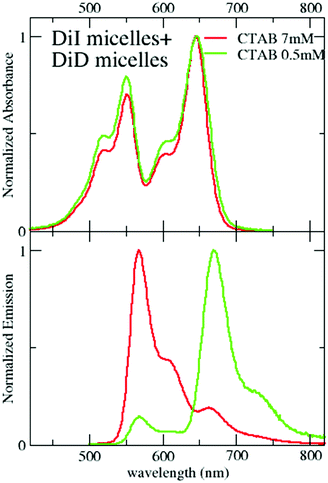
:![[thin space (1/6-em)]](https://www.rsc.org/images/entities/char_2009.gif) 1) have been prepared following the same procedure presented for single-dye loading (see the Technical section). The absorption spectra in Fig. 4 show a similar profile to that in ethanol with a minor increase of intensity in the blue side of the band. The similarity of these spectra with those measured in micelles loaded with either DiI or DiD suggests that the dyes experience a similar environment in the micelles, irrespective of the loading, confirming again the weak interchromophore interactions. Emission spectra collected from micelles simultaneously loaded with both dyes (Fig. 4) support efficient RET. By exciting the sample at 495 nm, where the absorption of the energy acceptor (DiD) is negligible, a sizeable emission of the acceptor is observed (for comparison, emission from a 1
1) have been prepared following the same procedure presented for single-dye loading (see the Technical section). The absorption spectra in Fig. 4 show a similar profile to that in ethanol with a minor increase of intensity in the blue side of the band. The similarity of these spectra with those measured in micelles loaded with either DiI or DiD suggests that the dyes experience a similar environment in the micelles, irrespective of the loading, confirming again the weak interchromophore interactions. Emission spectra collected from micelles simultaneously loaded with both dyes (Fig. 4) support efficient RET. By exciting the sample at 495 nm, where the absorption of the energy acceptor (DiD) is negligible, a sizeable emission of the acceptor is observed (for comparison, emission from a 1![[thin space (1/6-em)]](https://www.rsc.org/images/entities/char_2009.gif) :
:![[thin space (1/6-em)]](https://www.rsc.org/images/entities/char_2009.gif) 1 DiI
1 DiI![[thin space (1/6-em)]](https://www.rsc.org/images/entities/char_2009.gif) :
:![[thin space (1/6-em)]](https://www.rsc.org/images/entities/char_2009.gif) DiD ethanol solution is also reported, where RET is clearly negligible). The excitation spectra detected at 750 nm, where only the acceptor emits, confirm the absence of RET in ethanol and weak RET in micelles (Fig. S7, ESI†). Upon dilution with water (maintaining the relative CTAB and dye concentration constant), minor effects are observed above the CMC (Fig. S8, ESI†): RET signatures are similar for CTAB concentrations of 2 and 7 mM, and only slightly increase at 1 mM CTAB concentration (Fig. S8 and S9, ESI†), close to the CMC. The weak RET observed in micelles suggests that some micelles are loaded with at least two dyes (one DiI and one DiD), to guarantee interchromophore distances compatible with RET. The marginal dependence of RET upon dilution, at least above the CMC, demonstrates that the phenomenon is independent of the distance among micelles. Accordingly, we describe RET as an intramicellar phenomenon (Fig. 5). At the same time, the weak perturbation of absorption and emission spectra excludes the presence of strong excitonic interactions that indeed require short intermolecular distances, typically less than 1 nm. The fluorescence quantum yield of DiI (energy donor) decreases in the presence of DiD (energy acceptor), due to RET, and at the same time, the emission of DiD becomes sizeable, with a quantum yield larger than 10% (Table 3). The quantum yield of DiD in RET micelles measured upon direct excitation of DiD is similar to that in micelles only loaded with DiD (Table 1).
DiD ethanol solution is also reported, where RET is clearly negligible). The excitation spectra detected at 750 nm, where only the acceptor emits, confirm the absence of RET in ethanol and weak RET in micelles (Fig. S7, ESI†). Upon dilution with water (maintaining the relative CTAB and dye concentration constant), minor effects are observed above the CMC (Fig. S8, ESI†): RET signatures are similar for CTAB concentrations of 2 and 7 mM, and only slightly increase at 1 mM CTAB concentration (Fig. S8 and S9, ESI†), close to the CMC. The weak RET observed in micelles suggests that some micelles are loaded with at least two dyes (one DiI and one DiD), to guarantee interchromophore distances compatible with RET. The marginal dependence of RET upon dilution, at least above the CMC, demonstrates that the phenomenon is independent of the distance among micelles. Accordingly, we describe RET as an intramicellar phenomenon (Fig. 5). At the same time, the weak perturbation of absorption and emission spectra excludes the presence of strong excitonic interactions that indeed require short intermolecular distances, typically less than 1 nm. The fluorescence quantum yield of DiI (energy donor) decreases in the presence of DiD (energy acceptor), due to RET, and at the same time, the emission of DiD becomes sizeable, with a quantum yield larger than 10% (Table 3). The quantum yield of DiD in RET micelles measured upon direct excitation of DiD is similar to that in micelles only loaded with DiD (Table 1).
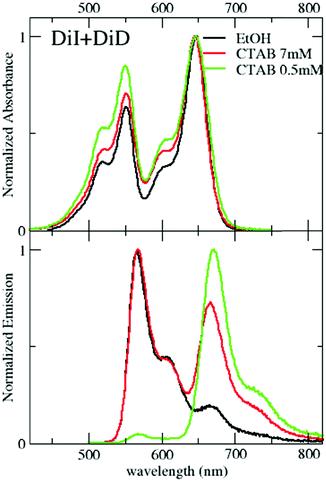 | ||
Fig. 4 Absorption and emission spectra (excitation wavelength: 495 nm) of solutions/suspensions of 1![[thin space (1/6-em)]](https://www.rsc.org/images/entities/char_2009.gif) : :![[thin space (1/6-em)]](https://www.rsc.org/images/entities/char_2009.gif) 1 DiI/DiD in different environments. 1 DiI/DiD in different environments. | ||
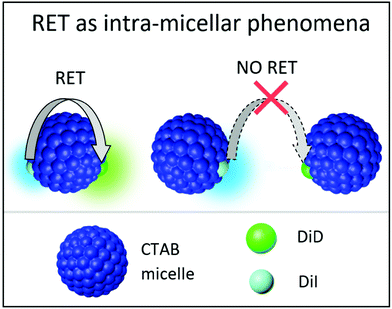 | ||
| Fig. 5 Schematic representation of RET as intramicellar phenomena when micelles are loaded with DiI and DiD at equimolar ratios. | ||
RET efficiency is estimated by comparing the fluorescence quantum yield measured for the donor dye in the presence ( , second column of Table 3) and in the absence of the acceptor (ϕD0 in Table 1):69
It is important to note that we cannot estimate RET efficiency by comparing the emission lifetime of the donor in the presence and in the absence of the acceptor, since the lifetime of the energy donor is very short and its variation (specifically its decrease) due to RET would be affected by very large errors.
We estimate a RET efficiency ∼36% above the CMC, a somewhat lower value than that observed in larger organic nanoparticles.44,49,70 Most probably, this is due to the smaller number of dyes that enter each micelle in comparison with larger nanoparticles.
An interesting and somewhat counterintuitive behavior is observed when the sample is diluted below the CMC: the RET efficiency considerably increases, reaching 88% yield, a value comparable to that measured in quatsomes.49 Indeed data in Fig. 4 and Fig. S9 (ESI†) show a strongly suppressed emission of the energy donor and a sizable increase of intensity in the emission of the acceptor. Specifically, below the CMC, the quantum yield of the energy donor, DiI, becomes lower than 1%, while the emission yield of the acceptor, DiD, increases to 16%. Weak (homo)aggregates of DiD are also formed, as suggested by the reduced quantum yield of DiD observed also in the absence of DiI and by the shape of the excitation spectra in Fig. S8 (ESI†). When selectively exciting the energy acceptor DiD at 600 nm, a larger quantum yield is measured compared to the results in Table 1 at the same CTAB concentration. This may be due to a reduced formation of homo-aggregates (the DiD concentration is halved when compared to that of the micelles loaded only with DiD), but we should also keep in mind that the DiD quantum yield in Table 1 is possibly underestimated due to inner filter effects caused by the large absorbance (A ≈ 0.15) of the solution. As discussed later, also with the support of MD simulations, the counterintuitive observation of increased RET efficiency below the CMC can be understood as due to the large affinity of both DiI and DiD dyes with CTAB. Indeed, in the large and stable micelles formed above the CMC, the dyes are well solvated by CTAB, decreasing the possibility of RET. Below the CMC, when micelles disaggregate, the dyes more easily meet around small CTAB clusters, favoring RET.
Steady state fluorescence excitation anisotropy spectra in Fig. 6, obtained by selectively collecting DiD emission, confirm the occurrence of RET both above and below the CMC. Above the CMC, the excitation anisotropy is almost constant within the excitation band of DiD, with a similar value, r ∼ 0.17, to that in DiD-loaded micelles. The anisotropy decreases sharply in the region of the DiI absorption, a clear signature of RET-driven depolarization. The behavior below the CMC is qualitatively similar, but with lower anisotropy values, further confirming the increased RET efficiency and the presence of homo-aggregates.
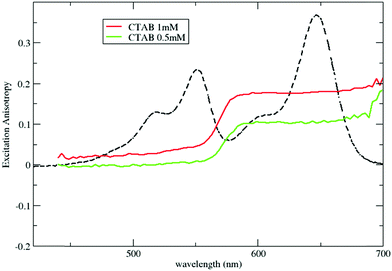 | ||
| Fig. 6 Excitation anisotropy spectra of micelles loaded with both DiI and DiD. Anisotropy is collected selectively by detecting the emission of DiD at 750 nm. | ||
The stability of the dye-loaded micelles under ambient conditions was monitored for one week (see Fig. S10, ESI†). Above the CMC, the dye-loaded micelles are very stable, as attested by marginal changes observed in the absorption spectra of samples with CTAB concentrations of 7 mM and 1 mM. In the most concentrated suspension (7 mM), RET decreases over time, a behavior in line with the observation of a slight reduction of aggregation phenomena in micelles loaded with either DiI or DiD (Fig. S6 and S7, ESI†). Below the CMC, the stability decreases, with major effects in absorption that suggest dye degradation, particularly for DiD.
The CMC increases with temperature,71 so we can move below the CMC by maintaining the CTAB concentration constant, but increasing the temperature. Fig. 7 shows the temperature dependence of the emission spectra of micelles loaded with both DiI and DiD. Above 45 °C, the DiI emission sizably decreases, pointing to increased RET efficiency (see also the excitation spectra in Fig. S11, ESI†). The breakdown of micelles promoted by either increasing the temperature or by decreasing the CTAB concentration is in any case responsible for increased RET efficiency.
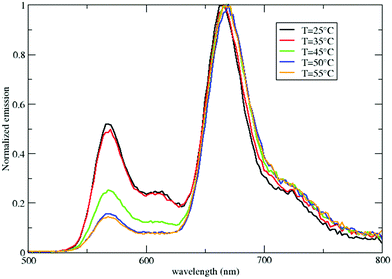 | ||
| Fig. 7 Emission spectra of micelles loaded with both DiI and DiD (CTAB 1 mM) as a function of temperature. | ||
RET is not observed upon mixing suspensions of micelles separately loaded with DiI and DiD for CTAB concentrations larger than CMC (Fig. 8). This result, validated up to 7 days from the sample preparation (Fig. S13, ESI†), confirms that the dye-loaded micelles are stable above the CMC, and the dyes do not show any tendency to aggregate once they are successfully encapsulated in the micelles. On the contrary, when the same mixed suspension is diluted below the CMC, efficient RET is observed (Fig. 8 and Fig. S12, ESI†) with similar results as when diluting micelles simultaneously loaded with both dyes. One possible explanation of this counterintuitive observation is that other clusters, different from micelles, composed of DiI, DiD and CTAB are formed below the CMC, where RET is promoted by the short distance among the dyes in the RET pair.
B.6 Molecular dynamics simulations
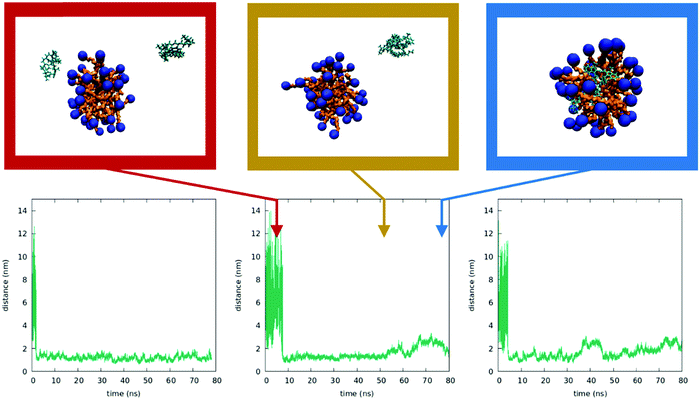
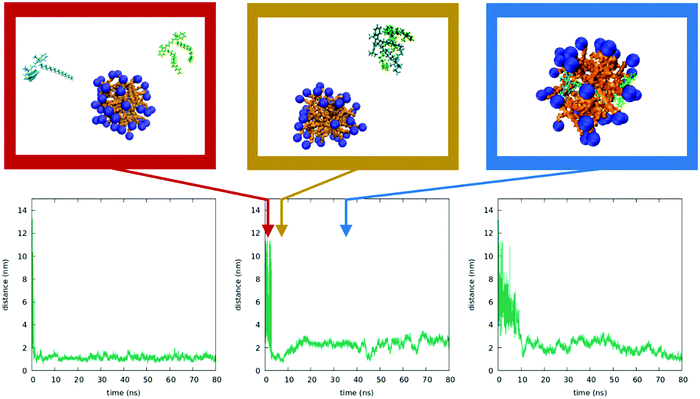
To better understand the behavior of dyes in the micellar environment, we run MD simulations (see the Technical section for the computational protocol). Due to the limitations in the dimensions of the simulation box, we cannot reproduce the experimental conditions in terms of CTAB concentrations and relative CTAB/dye concentrations. In spite of this, MD simulation results are in line with the proposed interpretation of experimental data. As described in the ESI,† we were able to form a stable micelle, comprising a number of CTAB units in line with the literature data.72 We then run three independent simulations by adding two DiI molecules in random positions in the same water box containing the preformed micelles (results of analogous calculations with DiD are reported in the ESI†). Fig. 9 shows the temporal evolution of the distance between the centers of the dyes as obtained in the three simulations (see ESI† for details). For one of the dynamics a few representative snapshots are also shown. In all three runs, the two dyes meet in water (a result probably related to the large dye concentration in the simulation). The bimolecular cluster so formed, characterized by intermolecular distances of the order of 1 nm, does not encounter the micelle in the dynamics in the left panel of Fig. 9. In the two other simulations, the cluster enters the micelle. Once inside the micelle, the dyes are quickly solvated by CTAB and the cluster dissociates, so that intermolecular distances reach values in the 2–3 nm range. At these distances, the electrostatic intermolecular interactions are very weak (see the ESI†). Remarkably, even when the intermolecular distances are more or less stable, the calculated interactions fluctuate strongly, since they depend on the interchromophore distance as well as on the relative orientation of the dyes. These weak and fluctuating interactions marginally affect the absorption spectra of the system, in line with experimental results.Fig. 10 shows the results from three independent simulations obtained by inserting a DiI and a DiD dye in random positions in the box containing the micelle. Again, the dyes initially form a bimolecular cluster in water. In all three trajectories, the cluster encounters the micelle and the dyes enter the micelles. Weak and fluctuating intermolecular interactions are observed (see the ESI†), which, having marginal effects on the absorption spectra, can however explain the observed RET.
From these simulations we learn that the dyes in water are very mobile and, when they get close, they form bound pairs as to minimize the strongly repulsive interactions with water. When the bound pair enters the micelle, the strong interaction of the dyes with CTAB drives a quick dissociation of the pair, and a stable situation is reached when the two dyes are located at distances of the order of 1–2 nm. The solubilization of DiI and DiD in CTAB micelles is different from what was observed in the cholesterol/CTAB membrane (e.g. in quatsome nanovesicles). There DiI and DiD form a pair for the duration of the simulation (ca 40 ns).73,74 In the case of CTAB micelles, our MD simulations offer an easy interpretation of the phenomena observed: indeed, the very low dye-concentration would suggest, on a statistical basis, that each micelle is loaded by at most a single dye, which then minimizes RET. However, when the dyes are added to the micellar suspension a few of them may form small clusters before they enter the micelles. Very quickly, these mini-clusters will dissolve inside the micelles, leading to the weak and fluctuating interactions responsible for the very weak aggregation features observed experimentally and, more impressively, for RET.
C. Conclusions
A comprehensive experimental study of DiI and DiD photophysics in a micellar environment, above and below the CMC of the CTAB surfactant, is presented. This study, also supported by MD simulations, demonstrates a very good affinity of both dyes with CTAB. For CTAB concentrations above the CMC, stable micelles are obtained that can be easily loaded with either DiI or DiD. Marginal aggregation signatures in the optical spectra of micelles loaded with either of the dyes suggest that a few dyes aggregate before reaching the micelles, so that a few micelles containing two or more dyes are formed. These aggregates however tend to dissolve over time (days) due to the redistribution of the dyes in the micelles (the relative concentration of dyes vs CTAB concentration is low enough to expect not more than a single dye per micelle). This interpretation is fully in line with the observation of RET in freshly prepared micelles simultaneously loaded with both dyes, and with the steady decrease of RET with time (days). The stability of the dye-loaded micelles above the CMC is confirmed upon mixing two solutions containing micelles loaded with either DiI or DiD: signatures of RET are not observed over several days. Below the CMC, when micelles are no longer stable, aggregation phenomena become important. However, the good affinity between CTAB and the dyes prevents the formation of the strong aggregates observed in ethanol/water mixtures.The most important result of this work is the counterintuitive observation of very efficient RET when micelles loaded with DiI and DiD are brought below the CMC. This result can be rationalized again in terms of rapid disaggregation of micelles below the CMC and the formation of clusters composed of CTAB, DiI and DiD. Under these conditions, the donor and acceptor dyes are brought together in CTAB clusters that offer a much more favorable environment to the dyes with respect to water. Indeed, below the CMC, the system is highly disordered, and the dynamical motion of CTAB and dyes may open effective channels for RET along similar lines as discussed in ref. 58.
In conclusion, we demonstrated an easy way to bring DiD and DiI dyes into an aqueous environment by exploiting CTAB, a widely used surfactant. Fluorescent stable micelles are formed above the CMC. An easy strategy to obtain micelles showing RET is also presented, offering an interesting tool to tune the emission of the fluorescent labels and increase the Stokes shift for reduced noise in microscopy applications. The counterintuitive observation of increased RET in micellar systems below the CMC raises an important warning for the widespread use of RET to assess the stability of nanoparticles over time and/or in different environments. Indeed, these studies can reach reliable conclusions only if a preliminary extensive spectroscopic study is performed on RET in the specific nanoparticle system also upon its disaggregation in different media, as to exclude that RET can be observed in disaggregated systems as a result of media effects and/or due to the presence of fragments of the nanoparticle of interest.
D. Technical section
D.1 Preparation of samples
1,1′-Dioctadecyl-3,3,3′,3′-tetramethyl-indocarbocyanine perchlorate (DiI) and 1,1′-dioctadecyl-3,3,3′,3′-tetramethyl-indodicarbocyanine perchlorate (DiD) were purchased from ThermoFisher (Invitrogen). Hexadecyltrimethylammonium bromide (CTAB, AnalaR NORMAPUR ≥99.0%) was obtained from VWR Chemicals. All chemicals were used without further purification. Spectra grade or HPLC solvents were used to prepare solutions.D.2 Preparation of DiI or DiD aggregates in 30 volumes of EtOH and 70 volumes of water mixture
Two solutions with 65 μM DiI or DiD in ethanol were prepared. 1.5 mL of each solution were diluted by adding 3.5 mL of bi-distilled water. The resulting solutions, with a DiI or DiD final concentration of 20 μM, were vigorously stirred for 1 minute.D.3 Preparation of CTAB micelles
A 7.8 mM suspension of CTAB micelles was prepared by dissolving CTAB in bi-distilled water. The suspension was heated at ∼38 °C for 30 minutes before use.D.4 Preparation of micelles loaded with DiI or DiD
3 ml of a solution with 100 μM DiI or DiD in ethanol was prepared. The solution was heated at ∼38 °C for 10 minutes and then it was slowly added to 25 mL of the CTAB micelle suspension (7.8 mM CTAB concentration). In the resulting suspension (11% V/V ethanol/water) the CTAB concentration is 7 mM and the dye concentration is 11 μM. All diluted suspensions (named CTAB 2 mM, CTAB 1 mM, CTAB 0.5 mM and CTAB 0.25 mM) were obtained by diluting the original 7 mM suspension with bi-distilled water.D.5 Preparation of micelles loaded with DiI and DiD
3 mL of a solution with 50 μM DiD and 50 μM DiI was prepared in ethanol. The solution was heated at ∼38 °C for 10 minutes and then slowly added to 25 mL of the CTAB micelle suspension at 7.8 mM CTAB concentration. The resulting suspension (11% V/V ethanol/water) contains CTAB 7 mM and the two dyes (DiI + DiD) with a total concentration of 11 μM. All subsequent suspensions (CTAB 2 mM, CTAB 1 mM, CTAB 0.5 mM and CTAB 0.25 mM) were obtained by diluting the original 7 mM CTAB/11 μM dye suspension with bi-distilled water.D.6 Preparation of mixture of micelles loaded with DiI and micelles loaded with DiD
The mixture of DiI and DiD loaded micelles was obtained by mixing equal volumes of the solutions containing micelles loaded with either DiI or DiD.D.7 Spectroscopic Measurements
UV-Vis absorption spectra were recorded with a PerkinElmer Lambda650 spectrophotometer, while fluorescence and steady-state anisotropy measurements were performed with a FLS1000 Edinburgh fluorometer, equipped with automatic polarizers. Lifetime decays have been collected by exciting the sample with pulsed diode lasers (pulse duration < 200 ps) at a repetition rate of 1 MHz, exciting at 405 nm and collecting the emission at 570 nm for DiI and exciting at 375 nm and collecting the emission at 650 nm for DiD. Fluorescence spectra are corrected for the excitation intensity and detector sensitivity. For solutions/suspensions with absorbance higher than 0.1, fluorescence spectra were collected with a cuvette having an optical path of 1.5 mm to minimize the inner filter effects. For fluorescence quantum yield measurements, a cuvette with 1 cm optical path was used, and in case of absorbance > 0.1, the solution was diluted with a CTAB solution having the same concentration of the solution under investigation in order to reduce the dye concentration while not affecting the micellar environment. Fluorescein in NaOH 0.1 M was used as a fluorescence standard (fluorescence quantum yield: 0.9).D.8 Fluorescence anisotropy measurements
Fluorescence anisotropy is measured upon excitation with linearly polarized light in the ratio:where I‖ and I⊥ represent the intensity of the emitted light with parallel and orthogonal polarization to the exciting beam, respectively. Experimentally, the different sensitivity of the detection system for vertically and horizontally polarized light is accounted for, measuring the G factor:
where the subscripts H and V in IHV indicate the orientation of the excitation and emission polarizers, respectively.
Experimental fluorescence anisotropy is determined as follows:
Fluorescence anisotropy is measured at a fixed excitation wavelength as a function of emission frequency, and fluorescence excitation anisotropy is measured as a function of excitation frequency at a fixed emission frequency.
In viscous solvents or solid matrices, when the molecular orientational motion is much slower than the fluorescence lifetime, one measures the intrinsic anisotropy r0, that offers a reliable indication about the angle formed by the transition dipole moment relevant to the absorption and emission processes, β:
The intrinsic anisotropy r0 ranges from 0.4, for a parallel arrangement of transition dipoles, to −0.2, for perpendicular arrangement. We set r0 to the value measured in PolyTHF (average molecular weight: 250 g mol−1).
Time-resolved anisotropy spectra were acquired with a Fluoromax-3 Horiba Jobin-Yvon instrument, exciting the sample with a pulsed nanoLED at 591 nm (pulse duration 1.5 ns), i.e. within the first absorption band of DiD, and detecting the emission at 675 nm. The proposed analysis of time-resolved anisotropy does not rely on the very early time dynamics, so that the 1.5 ns pulse excitation is fully reliable.
D.9 Molecular dynamics simulations
Force fields were obtained according to the following procedure for all molecules (CTAB, DiI, DiD):75,76 (1) ground state geometry optimization (B3LYP functional, basis set 6-31g(d,p)); (2) RESP calculation (HF, basis set 6-31g(d,p)); (3) conversion to GAFF force field using antechamber tools. Gaussian 16 software was used for ground state optimization and RESP calculation.77All MD simulations were performed using the GROMACS software,78,79 starting with a preliminary energy minimization, followed by long (>30 ns) dynamics at constant number of particles, volume and temperature (NVT). Dynamics are run with a timestep of 1 fs, using a velocity Verlet algorithm for integration and a V-rescale thermostat at 300 K. Since both CTAB and cyanine molecules are cations, all simulations are performed by adding a suitable number of chloride ions to ensure the charge neutrality of the whole system. VMD software80 was used to visualize the results of MD simulations.
Conflicts of interest
There are no conflicts to declare.Acknowledgements
This work is dedicated to Concepció Rovira and Jaume Veciana, inspiring scientists in the field of functional molecular materials. Working with them is a prized privilege and the basis for a solid friendship. AD, MA, FB, CS and AP benefited from the equipment and support of the COMP-HUB Initiative, funded by the “Departments of Excellence” program of the Italian Ministry for Education, University and Research (MIUR, 2018–2022) and acknowledge the support from the high performance computing center at Parma University. JMF, GVN, MK and NV acknowledge support from MINECO through the Severo Ochoa Programme FUNFUTURE (SEV-2015-0496 and CEX2019-000917-S), and the Ministry of Science and Innovation of Spain through the grant PID2019-105622RB-I00 (Mol4Bio), and gratefully acknowledge the financial support received from European Union's Horizon 2020 research and innovation program under the Marie Skłodowska-Curie grant agreement No. 712949 (TECNIOspring PLUS) and from the Agency for Business Competitiveness of the Government of Catalonia.References
- A. Mishra, R. K. Behera, P. K. Behera, B. K. Mishra and G. B. Behera, Chem. Rev., 2000, 100, 1973–2011 CrossRef CAS PubMed.
- W. Sun, S. Guo, C. Hu, J. Fan and X. Peng, Chem. Rev., 2016, 116, 7768–7817 CrossRef CAS PubMed.
- M. Levitus and S. Ranjit, Q. Rev. Biophys., 2011, 44, 123–151 CrossRef CAS PubMed.
- J. Atchison, S. Kamila, H. Nesbitt, K. A. Logan, D. M. Nicholas, C. Fowley, J. Davis, B. Callan, A. P. McHale and J. F. Callan, Chem. Commun., 2017, 53, 2009–2012 RSC.
- P. C. Ayya, G. Sivaraman, R. N. Priyanka, S. O. Raja, K. Ponnuvel, J. Shanmugpriya and A. Gulyani, Coord. Chem. Rev., 2020, 411, 213233 CrossRef.
- S. M. Usama, S. Thavornpradit and K. Burgess, ACS Appl. Bio Mater., 2018, 1(4), 1195–1205 CrossRef CAS.
- R. C. Benson and H. A. Kues, J. Chem. Eng. Data, 1977, 22, 379–383 CrossRef CAS.
- K. Klehs, C. Spahn, U. Endesfelder, S. F. Lee, A. Fürstenberg and M. Heilemann, Chem. Phys. Chem., 2014, 15, 637–641 CrossRef CAS PubMed.
- J. L. Bricks, A. D. Kachkovskii, Y. L. Slominskii, A. O. Gerasov and S. V. Popov, Dyes Pigm., 2015, 121, 238–255 CrossRef CAS.
- E. E. Jelley, Nature, 1937, 139, 631–632 CrossRef CAS.
- B. I. Shapiro, Russ. Chem. Rev., 1994, 63, 231–255 CrossRef.
- J. L. Bricks, Y. L. Slominskii, I. D. Panas and A. P. Demchenko, Methods Appl. Fluoresc., 2017, 6, 012001 CrossRef PubMed.
- T. Kobayashi, Q. Shang, J. Xiang, Q. Yang and Y. Tang, J-Aggregates, 2012, 155–180 Search PubMed.
- A. H. Herz, Adv. Colloid Interface Sci., 1977, 8, 237–298 CrossRef CAS.
- B. A. Armitage, Top. Curr. Chem., 2005, 253, 55–76 CrossRef CAS.
- M. C. Murphy, I. Rasnik, W. Cheng, T. M. Lohman and T. Ha, Biophys. J., 2004, 86, 2530–2537 CrossRef CAS PubMed.
- E. M. S. Stennett, N. Ma, A. van der Vaart and M. Levitus, J. Phys. Chem. B, 2014, 118, 152–163 CrossRef CAS PubMed.
- M. E. Sanborn, B. K. Connolly, K. Gurunathan and M. Levitus, J. Phys. Chem. B, 2007, 111, 11064–11074 CrossRef CAS PubMed.
- J. Kim, A. Watson, M. Henary and G. Patonay, Heterocycl. Polymethine Dye., 2008, 31–39 CAS.
- M. Grabolle, J. Pauli and R. Brehm, Dyes Pigm., 2014, 103, 118–126 CrossRef CAS.
- S. E. D. Webb, S. K. Roberts, S. R. Needham, C. J. Tynan, D. J. Rolfe, M. D. Winn, D. T. Clarke, R. Barraclough and M. L. Martin-Fernandez, Biophys. J., 2008, 94, 803–819 CrossRef CAS PubMed.
- H. Wallrabe and A. Periasamy, Curr. Opin. Biotechnol, 2005, 16, 19–27 CrossRef CAS PubMed.
- S. Dash, M. Panigrahi, S. Baliyarsingh, P. K. Behera, S. Patel and B. K. Mishra, Curr. Org. Chem., 2011, 15, 2673–2689 CrossRef CAS.
- N. Nakashima and T. Kunitake, J. Am. Chem. Soc., 1982, 104, 4261–4262 CrossRef CAS.
- A. Waggoner, J. Membr. Biol., 1976, 27, 317–334 CrossRef CAS PubMed.
- F. García-Jiménez, M. I. Khramov, R. Sánchez-Obregón and O. Collera, Chem. Phys. Lett., 2000, 331, 42–46 CrossRef.
- R. R. Gullapalli, M. C. Demirel and P. J. Butler, Phys. Chem. Chem. Phys., 2008, 10, 3548–3560 RSC.
- B. S. Packard and D. E. Wolf, Biochemistry, 1985, 24, 5176–5181 CrossRef CAS PubMed.
- D. Horn and J. Rieger, Angew. Chem., Int. Ed., 2001, 40, 4330 CrossRef CAS PubMed.
- A. Sourdon, M. Gary-Bobo, M. Maynadier, M. Garcia, J.-P. Majoral, A.-M. Caminade, O. Mongin and M. Blanchard-Desce, Chem. – Eur. J., 2019, 25, 3637–3649 CrossRef CAS PubMed.
- A.-M. Caminade, A. Hameau and J.-P. Majoral, Chem. – Eur. J., 2009, 15, 9270–9285 CrossRef CAS PubMed.
- S. Palantavida, R. Tang, G. P. Sudlow, W. J. Akers, S. Achilefu and I. Sokolov, J. Mater. Chem. B, 2014, 2, 3107–3114 RSC.
- E.-B. Cho, D. O. Volkov and I. Sokolov, Small, 2010, 6, 2314–2319 CrossRef CAS PubMed.
- I. Sokolov and S. Naik, Small, 2008, 4, 934–939 CrossRef CAS PubMed.
- S. K. Yang, X. Shi, S. Park, T. Ha and C. S. Zimmerman, Physiol. Behav., 2016, 176, 139–148 Search PubMed.
- L. D. Patsenker, A. L. Tatarets, O. P. Klochko and E. A. Terpetschnig, Conjugates, Complexes, and Interlocked Systems Based on Squaraines and Cyanines, in Advanced Fluorescence Reporters in Chemistry and Biology II. Springer Series on Fluorescence (Methods and Applications), ed. A. Demchenko, Springer, Berlin, Heidelberg, 2010, vol. 9 Search PubMed.
- X. Wang, N. Anton, P. Ashokkumar, H. Anton, T. K. Fam, T. Vandamme, A. S. Klymchenko and M. Collot, ACS Appl. Mater. Interfaces, 2019, 11, 13079–13090 CrossRef CAS PubMed.
- I. Texier, M. Goutayer, A. Da Silva, L. Guyon, N. Djaker, V. Josserand, E. Neumann, J. Bibette and F. Vinet, J. Biomed. Opt., 2009, 14, 054005 CrossRef PubMed.
- E. Arunkumar, C. C. Forbes and B. D. Smith, Eur. J. Org. Chem., 2005, 4051–4059 CrossRef CAS.
- I. Miletto, A. Gilardino, P. Zamburlin, S. Dalmazzo, D. Lovisolo, G. Caputo, G. Viscardi and G. Martra, Dyes Pigm., 2010, 84, 121–127 CrossRef CAS.
- G. Pan, H. Jia, Y. Zhu, W. Sun, X. Cheng and F. Wu, ACS Appl. Nano Mater., 2018, 1(6), 2885–2897 CrossRef CAS.
- A. Reisch and A. S. Klymchenko, Small, 2016, 12, 1968–1992 CrossRef CAS PubMed.
- T. Behnke, C. Würth, E.-M. Laux, K. Hoffmann and U. Resch-Genger, Dyes Pigm., 2012, 94, 247–257 CrossRef CAS.
- W. Anil, J. Faidat, M. Sanku, Q. Steven, L. Estelle and L. Benedict, Small, 2013, 9, 2129–2139 CrossRef PubMed.
- A. S. Klymchenko, E. Roger, N. Anton, H. Anton, I. Shulov, J. Vermot, Y. Mely and T. F. Vandamme, RSC Adv., 2012, 2, 11876–11886 RSC.
- N. Grimaldi, F. Andrade, N. Segovia, L. Ferrer-Tasies, S. Sala, J. Veciana and N. Ventosa, Chem. Soc. Rev., 2016, 45, 6520–6545 RSC.
- L. Ferrer-Tasies, E. Moreno-Calvo, M. Cano-Sarabia, M. Aguilella-Arzo, A. Angelova, S. Lesieur, S. Ricart, J. Faraudo, N. Ventosa and J. Veciana, Langmuir, 2013, 29, 6519–6528 CrossRef CAS PubMed.
- A. Ardizzone, S. Kurhuzenkau, S. Illa-Tuset, J. Faraudo, M. Bondar, D. Hagan, E. W. Van Stryland, A. Painelli, C. Sissa, N. Feiner, L. Albertazzi, J. Veciana and N. Ventosa, Small, 2018, 1703851 CrossRef PubMed.
- J. Morla-Folch, G. Vargas-Nadal, T. Zhao, C. Sissa, A. Ardizzone, S. Kurhuzenkau, M. Köber, M. Uddin, A. Painelli, J. Veciana, K. D. Belfield and N. Ventosa, ACS Appl. Mater. Interfaces, 2020, 12, 20253–20262 CrossRef CAS PubMed.
- F. Fassioli, R. Dinshaw, P. C. Arpin and G. D. Scholes, Interface, 2014, 11, 20130901 Search PubMed.
- E. C. Wu, E. A. Arsenault, P. Bhattacharyya, N. H. C. Lewis and G. R. Fleming, Faraday Discuss., 2019, 216, 116–132 RSC.
- L. Stryer, Annu. Rev. Biochem., 1978, 47, 819–846 CrossRef CAS PubMed.
- X. Sun, G. Wang, H. Zhang, S. Hu, X. Liu, J. Tang and Y. Shen, ACS Nano, 2018, 12, 6179–6192 CrossRef CAS PubMed.
- P. Zou, H. Chen, H. J. Paholak and D. Sun, Mol. Pharmaceutics, 2013, 10, 4185–4194 CrossRef CAS PubMed.
- S. L. Efimova, A. V. Sorokin, A. N. Lebedenko, Y. V. Malyukin and E. N. Obukhova, J. Appl. Spectrosc., 2006, 73, 164–170 CrossRef CAS.
- A. Iqbal, S. Arslan, B. Okumus, T. J. Wilson, G. Giraud, D. G. Norman, T. Ha and D. M. J. Lilley, Proc. Natl. Acad. Sci. U. S. A., 2008, 105, 11176–11181 CrossRef CAS PubMed.
- S. P. Moulik, M. E. Haque, P. K. Jana and A. R. Das, J. Phys. Chem., 1996, 100, 701–708 CrossRef CAS.
- M. Anzola, C. Sissa, A. Painelli, A. A. Hassanali and L. Grisanti, J. Chem. Theory Comput., 2020, 16(12), 7281–7288 CrossRef CAS PubMed.
- M. Anzola, F. Di Maiolo and A. Painelli, Phys. Chem. Chem. Phys., 2019, 21, 19816–19824 RSC.
- F. C. Spano, Acc. Chem. Res., 2010, 43, 429–439 CrossRef CAS PubMed.
- H. v. Berlepsch and C. Böttcher, J. Phys. Chem. B, 2015, 119, 11900–11909 CrossRef PubMed.
- P. Debnath, S. Chakraborty, S. Deb, J. Nath, B. Dey, D. Bhattacharjee and S. A. Hussain, J. Lumin., 2016, 179, 287–296 CrossRef CAS.
- A. R. Tehrani-Bagha and K. Holmberg, Materials, 2013, 6, 580–608 CrossRef CAS PubMed.
- G. B. Behera, P. K. Behera and B. K. Mishra, J. Surf. Sci. Technol., 2007, 23, 1–31 CAS.
- V. Patel, N. Dharaiya, D. Ray, V. K. Aswal and P. Bahadur, Colloids Surf., A, 2014, 455, 67–75 CrossRef CAS.
- R. Dorshow, J. Briggs, C. A. Bunton and D. F. Nicoli, J. Phys. Chem., 1982, 86, 2388–2395 CrossRef CAS.
- N. C. Das, H. Cao, H. Kaiser, G. T. Warren, J. R. Gladden and P. E. Sokol, Langmuir, 2012, 28(33), 11962–11968 CrossRef CAS PubMed.
- Y. Kawabe and S. Kato, Dyes Pigm., 2012, 95, 614–618 CrossRef CAS.
- Joseph R. Lakowicz, Principles of Fluorescence Spectroscopy, Springer US, Boston, MA, 2006 Search PubMed.
- S. W. Morton, X. Zhao, M. A. Quadir and P. T. Hammond, Biomaterials, 2014, 35, 3489–3496 CrossRef CAS PubMed.
- G. A. Cookey and C. C. Obunwo, IOSR J. Appl. Chem., 2014, 7(12), 23–38 CrossRef.
- S. Illa-Tuset, D. C. Malaspina and J. Faraudo, Phys. Chem. Chem. Phys., 2018, 20, 26422–26430 RSC.
- L. Ferrer-Tasies, E. Moreno-Calvo, M. Cano-Sarabia, M. Aguilella-Arzo, A. Angelova, S. Lesieur, S. Ricart, J. Faraudo, N. Ventosa and J. Veciana, Langmuir, 2013, 29, 6519–6528 CrossRef CAS PubMed.
- S. Illa-Tuset, Molecular modelling of quatsome nanovesicles, PhD thesis, Universitat Autònoma de Barcelona, 2019 Search PubMed.
- J. Wang, W. Wang, P. A. Kollman and D. A. Case, J. Mol. Graphics Modell., 2006, 25, 247–260 CrossRef CAS PubMed.
- J. Wang, R. M. Wolf, J. W. Caldwell, P. A. Kollman and D. A. Case, J. Comput. Chem., 2004, 25, 1157–1174 CrossRef CAS PubMed.
- M. J. Frisch, G. W. Trucks, H. B. Schlegel, G. E. Scuseria, M. A. Robb, J. R. Cheeseman, G. Scalmani, V. Barone, G. A. Petersson, H. Nakatsuji, X. Li, M. Caricato, A. V. Marenich, J. Bloino, B. G. Janesko, R. Gomperts, B. Mennucci, H. P. Hratchian, J. V. Ortiz, A. F. Izmaylov, J. L. Sonnenberg, D. Williams-Young, F. Ding, F. Lipparini, F. Egidi, J. Goings, B. Peng, A. Petrone, T. Henderson, D. Ranasinghe, V. G. Zakrzewski, J. Gao, N. Rega, G. Zheng, W. Liang, M. Hada, M. Ehara, K. Toyota, R. Fukuda, J. Hasegawa, M. Ishida, T. Nakajima, Y. Honda, O. Kitao, H. Nakai, T. Vreven, K. Throssell, J. A. Montgomery, Jr., J. E. Peralta, F. Ogliaro, M. J. Bearpark, J. J. Heyd, E. N. Brothers, K. N. Kudin, V. N. Staroverov, T. A. Keith, R. Kobayashi, J. Normand, K. Raghavachari, A. P. Rendell, J. C. Burant, S. S. Iyengar, J. Tomasi, M. Cossi, J. M. Millam, M. Klene, C. Adamo, R. Cammi, J. W. Ochterski, R. L. Martin, K. Morokuma, O. Farkas, J. B. Foresman and D. J. Fox, Gaussian 16, Revision C.01, Gaussian, Inc., Wallingford CT, 2016 Search PubMed.
- E. Lindahl, B. Hess and D. van der Spoel, J. Mol. Model., 2001, 7, 306–317 CrossRef CAS.
- M. Bekker, H. Berendsen, H. J. C. Dijkstra, E. J. Achterop, S. Vondrumen, R. Vanderspoel, D. Sijbers, A. Keegstra and H. Renardus, in 4th International Conference on Computational Physics (PC 92), 1993.
- W. Humphrey, A. Dalke and K. Schulten, J. Mol. Graphics, 1996, 14, 33–38 CrossRef CAS PubMed.
Footnote |
| † Electronic supplementary information (ESI) available. See DOI: 10.1039/d1tc02888j |
| This journal is © The Royal Society of Chemistry 2021 |

