
 Open Access Article
 This Open Access Article is licensed under a
 Creative Commons Attribution 3.0 Unported Licence
Accumulation of the photonic energy of the deep-red part of the terrestrial sun irradiation by rare-earth metal-free E–Z photoisomerization†
Aleksey
Vasilev
ab,
Ralitza
Dimitrova
c,
Meglena
Kandinska
a,
Katharina
Landfester
 b and
Stanislav
Baluschev
*bc
b and
Stanislav
Baluschev
*bc
aUniversity of Sofia “Saint Kliment Ohridski”, Faculty of Chemistry and Pharmacy, Sofia 1164, Bulgaria
bMax Planck Institute for Polymer Research, Ackermannweg 10, Mainz 55128, Germany
cUniversity of Sofia “Saint Kliment Ohridski”, Faculty of Physics, Sofia 1164, Bulgaria. E-mail: balouche@phys.uni-sofia.bg
First published on 13th May 2021
Abstract
Large scale solar energy storage in the form of E–Z photoisomerisable organic materials requires avoidance of applying rare earth metals at any stage of the process used. Here, drastic shortening of the synthetic route of crown ether functionalized hemicyanine dyes, suitable for efficient E–Z photoisomerization under extremely low excitation light intensities compared with unconcentrated sunlight is reported. The higher energetic form was successfully stabilized by rare earth free cations – in this case by styryl dye-Ba2+ complexes. For the first time E–Z photoisomerization was demonstrated and was observed directly by excitation with light substantially red-shifted compared to the absorption spectrum of the trans-to-cis active moieties via the process of triplet–triplet annihilation upconversion.
Introduction
The initial idea of storing solar energy in molecular systems via valence isomerisation dates back to the late 1950s. However, in the last two decades a number of molecular organic solar-thermal (MOST) energy storage systems based on stilbene, azobenzene, anthracene, tetracarbonyl-fulvalene-diruthenium and dihydroazulene have been explored.1,2 One of these systems, a laboratory “closed cycle” continuous flow MOST-device,4 based on [3,3′-bis(1,1-dimethyltridecyl)fulvalene]dirutheniumtetracarbonyl (Ru2Fv) was successfully demonstrated.The favoured MOST systems have to simultaneously fulfil a chain of material requirements: (1) bearing in mind the global shortage of precious- and rare-earth-metals, the identified MOST-system must avoid or actively reduce their usage, (2) the absorption band of the parent compound must overlap optimally with the most intense terrestrial solar spectral part (i.e., the visible light spectrum), (3) they should demonstrate a high photoisomerization quantum yield (QY), realized at a low excitation intensity, (4) the spectral overlap between the parent compound and the photoisomer must be as small as possible, (5) having a highly endergonic reaction profile together with a high activation energy for the reverse reaction3 will ensure a long lifetime of the stored optical energy, and (6) the MOST system should have the parent compounds with an as low as possible molecular weight in order to maximize the sunlight storage density.3
Merging the technologies of low molecular weight and precious/rare-earth metal-free MOST systems with triplet–triplet annihilation photon energy upconversion (TTA–UC) opens new perspectives for realistic industrial applications of the proposed sunlight energy storage schemes. In this work, the synthetic route, together with the optical characteristics and energy storage parameters, including lifetime and cycling properties of the precious/rare-earth metal-free MOST systems excited directly by the TTA–UC device will be reported in detail.
Results and discussion
Synthesis
In a recently published work,5 one of the possible strategies for the synthesis of target dyes 4a–4d (Scheme 1) was described. In the published procedure,5 the first reaction step was quaternization of benzothiazoles with the corresponding alkane sultones, and the reaction was carried out in the absence of a solvent. Such reaction conditions have their advantages, but a major drawback is the accumulation of an insoluble product in the reaction volume, and after a certain point it is difficult to complete the quaternization. The addition of small amounts of the N-methyl-2-pyrrolidone (NMP) with a high boiling point to the mixture (Scheme 1A) ensured good solubility during the entire process and the prolonged reaction time (30 min) provided almost quantitative reaction yields (Scheme 1A). | ||
| Scheme 1 (A) Quaternization of 2-methylbenzothiazoles with alkane sultones. (B) Synthesis of 4-(aza-15-crown-5)benzocarbaldehyde (3). (C) Synthesis of dyes 4a–4d.5 | ||
In the same work5 on the synthesis of 4-(aza-15-crown-5) benzocarbaldehyde (3), the use of a modified four step synthetic procedure was described.6 Led by the will to create an economical, reproducible and simple synthetic scheme through the combination of a few known methods,5–8 in this work a new, more robust, easy-to-implement, cost-effective and only two-step procedure was created for the preparation of intermediate 3 (Scheme 1B). The crucial optimisation step in this procedure is the neutralization of the reaction mixture after the Vilsmeier–Haack–Arnold reaction, with the milder reagent, sodium acetate instead of the aggressive sodium hydroxide8 which is reported to cause ring opening and damage of the crown functionality (TLC monitoring, NMR). Another seminal advance is the conversion of the target crown ether-aldehyde 3 (Scheme 1B) into the corresponding sodium perchlorate complex-salt, which allowed easy and successful recrystallization of the product, instead of needing the expensive chromatographic purification methods used up to now. These optimisations provide a possibility for straightforward up-scale synthesis of these types of precious- and rare-earth metal-free MOST-dyes.
Z-Photoisomerization of dyes 4a–4c performed by extremely low intensity VIS-light
In order to reveal the temporal evolution of the process of E–Z photoisomerization, the pump–probe experimental setup shown in Fig. 1 was used. The pump-channel uses as excitation sources temperature and current stabilized, single mode diode lasers, mounted on Thorlabs TCLDM9 laser heads, and operating either at λ = 450 nm (for direct E–Z photoisomerization), or at λ = 635 nm (for indirect E–Z photoisomerization via the TTA–UC process). Both lasers were collimated to a mutually uniform spot with an aspect ratio of ∼1.2 by applying cylindrical telescopes. The temperature and current control of all the diode lasers was performed on a Thorlabs PRO8000 8-Slot Modular Rack Chassis supporting Thorlabs laser current control units LDC8002 and LDC8010 and Thorlabs laser diode temperature control module (TCM) TED8040. The probe channel consisted of a “white light source” (LED flood lights, SL 20 W 5500 K) with current and temperature stabilized power supply and adjustable light intensity. In addition, a Melles Griot 03 FIV 044 band-pass filter with a central wavelength of λ = 550 nm and the spectral width of Δλ = 40 nm (FWHM) was used to modify the spectrum of the probe channel (Fig. 3a, the grey line). For all measurements, the intensity (less than 1 μW × cm−2) of the probe beam was kept constant, thus its E–Z photoisomerization activity was negligible. | ||
| Fig. 1 Experimental setup for the real time observation of E–Z photoisomerization. | ||
The emission spectra were obtained using a Hamamatsu PMA-50 optical multichannel analyser (OMA) with absolute wavelength calibration and corrected spectral response. Because E–Z photoisomerization is a relatively slow process, the integration time of Δt = 100 ms was more than sufficient. Using a Chroma Technology HQ455LP edge filter, designed for λ = 455 nm, or a Semrock NF03-633E-25 notch filter for λ = 633 nm it was possible to suppress more than 104 times the intensity of the excitation laser.
All measurements were performed in Starna Scientific Q 23-3.45 fluorescent quartz cuvettes with an optical quality base (dimensions 3 × 3 × 40 mm, four windows and base polished). In order to reduce the convection of the MOST-fluid the cuvette was placed horizontally. As shown in Fig. 1, the pump and probe beams were mutually perpendicular. Complete spatial overlapping of the pump and the probe beams with the studied sample was achieved by placing the cuvette (including the temperature modulation unit) on a Newport M-UMR5.16 double-row ball micropositioning XYZ-stage. This ensures that the probe beam will only travel through the optically-excited medium. The temperature of the sample was actively controlled by an Electron Dynamics Peltier-based TCM). It is important to mention that only after reaching a stationary temperature signal from the Pt100 sensor placed on top of the quartz cuvette, were the optical measurements performed.
A typical experimental procedure for the determination of the time-resolved dependence of the E–Z photoisomerization on the excitation intensity, temperature and sample composition is shown in Fig. 2 (for the structure 4b). The absorption of neat 4b in acetonitrile (ACN) is shown in Fig. 2a (the green line). Furthermore, the addition of Ba(ClO4)2 to the ACN solution of the 4b-dye induced a significant decrease of the local absorption maximum (at λ = 523 nm) and a substantial hypsochromic shift of the absorption maximum (at λmax = 438 nm). These changes in the absorption spectra of 4b after addition of Ba2+ ions revealed intensive ion-complexation by the azacrown ether group of the chromo-ionophore. The absorption spectrum shown in Fig. 2a (the blue line) refers to the formation of the trans-dye-Ba2+ complex.5
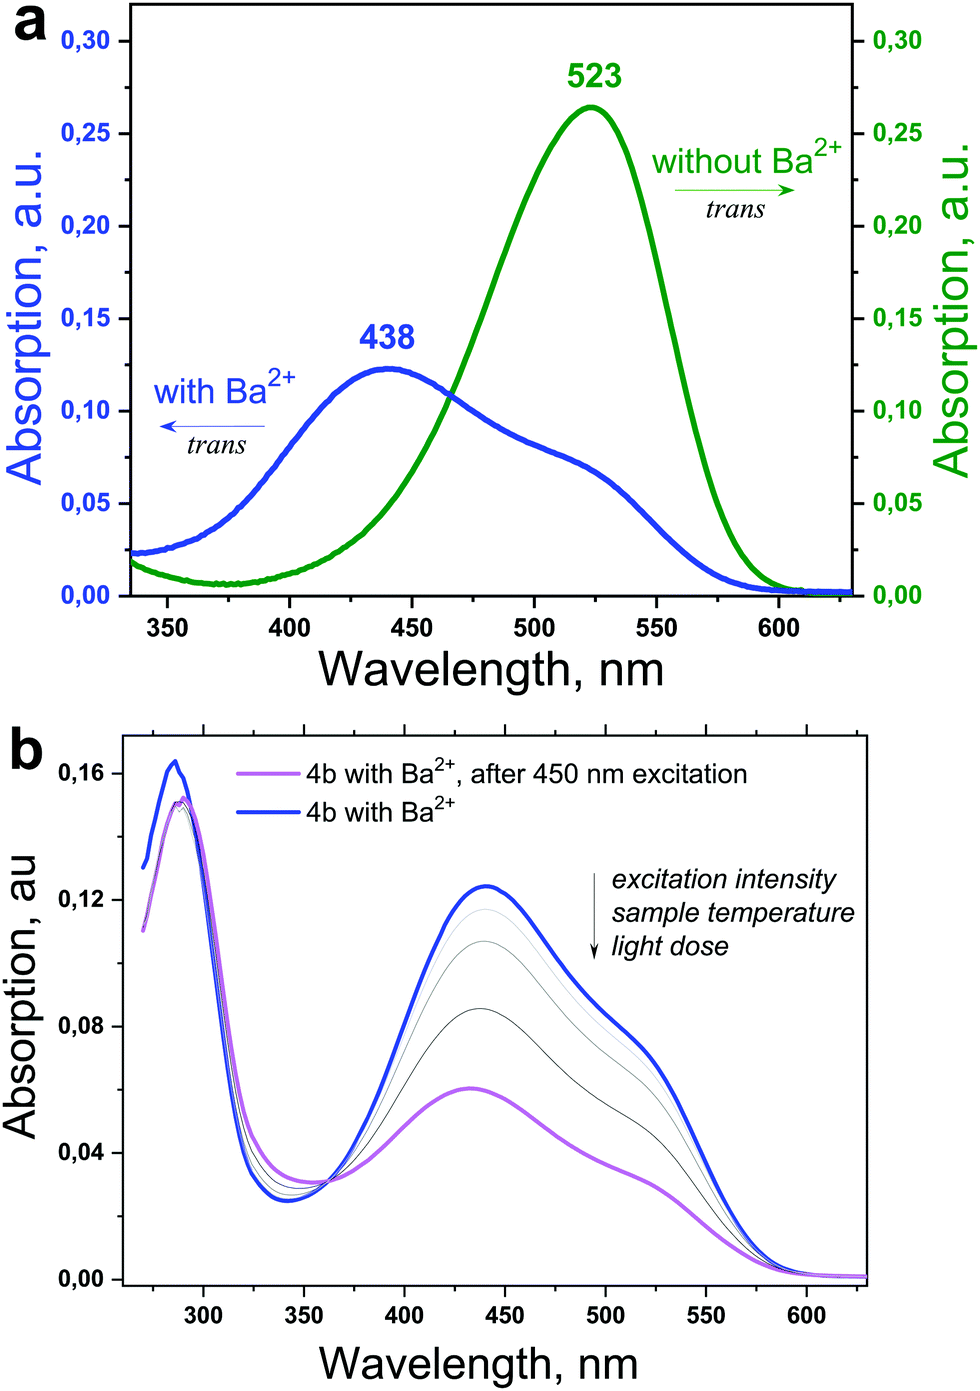 | ||
| Fig. 2 (a) The absorption spectra of the 4b-dye (the green line) and the trans-4b-Ba2+ complex (the blue line). (b) The decrease of the total absorption of the trans-4b-Ba2+ complex under optical excitation (the violet line). | ||
As is shown in Fig. 2b, the formation of cis-dye-Ba2+ isomers caused a monotonic decrease of the visible sample absorption. It is important to mention that this is an integral response with optical excitation, and is predetermined by the excitation intensity, light dose and/or sample temperature and material composition. To distinguish the importance of these experimental factors was a partial objective of this work.
The pump wavelength (λexc = 450 nm) performing trans-to-cis photoisomerization predominantly excited the trans-dye-Ba2+ complex (Fig. 3a, the blue line represents the absorption of the trans-4b-Ba2+ complex). Experimentally, because of the degree of cis-dye-Ba2+ isomerisation, the transmittance of the probe beam (Fig. 3a, the grey line) was used. In Fig. 3a, the fluorescence spectrum (the red line) of 4b with a maximum at λfl = 602 nm is shown.
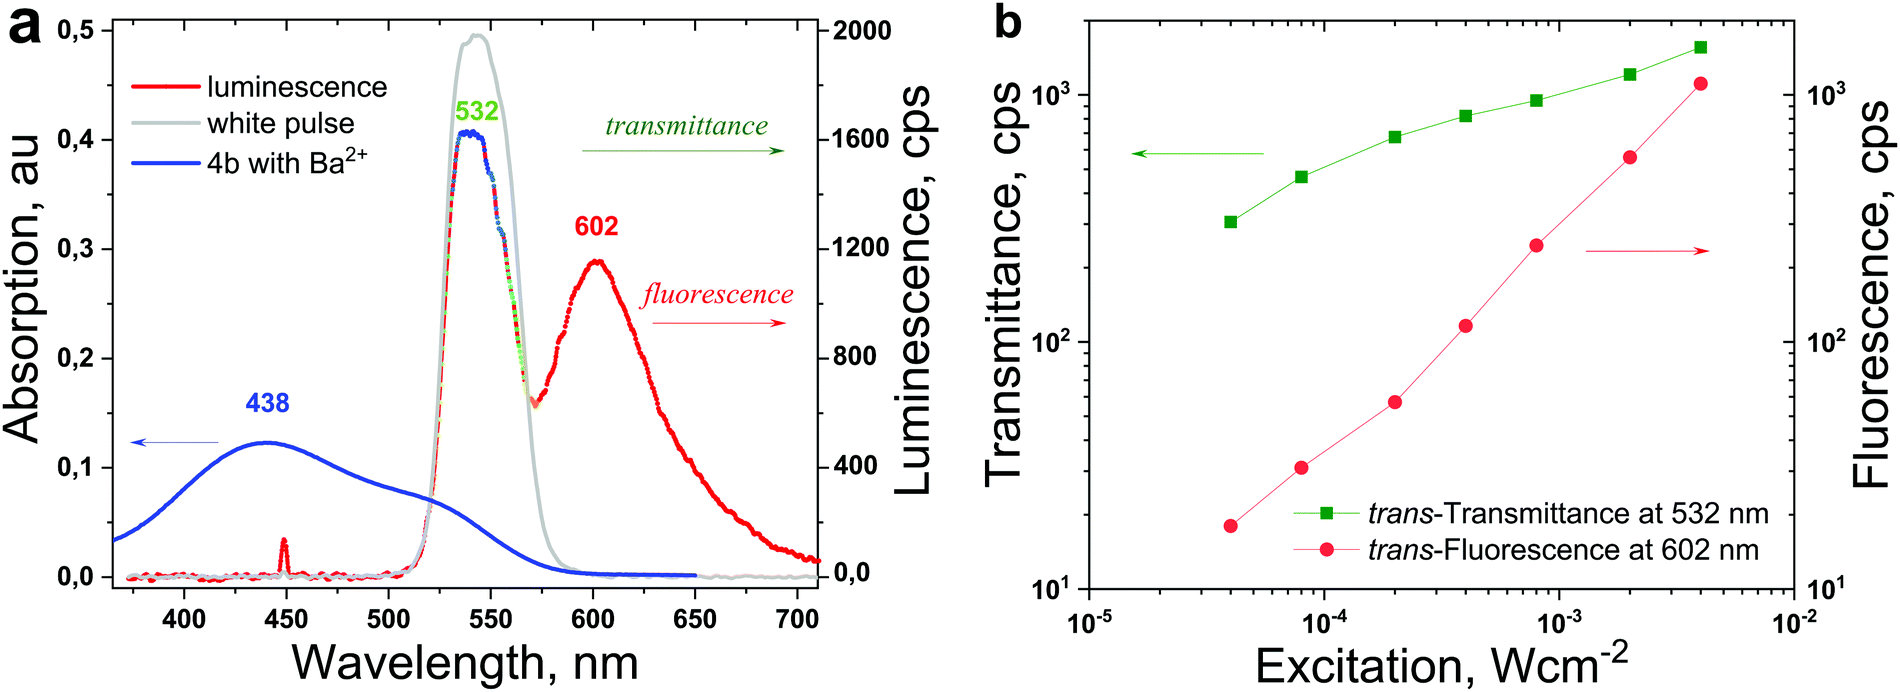 | ||
| Fig. 3 (a) The optical signal obtained from the trans-dye-Ba2+ complex excited simultaneously with a pumping beam (λexc = 450 nm) and a probe beam (λprobe = 532 nm), the continuous wave (cw) registration is the multicoloured line. (b) Dependence of sample transmittance and fluorescence on the intensity of the pump beam; conditions: intensity of the probe beam is constant, 1 μW × cm−2, sample temperature T = 22 °C, excitation duration Δt = 90 s; 4b (1 × 10⁻⁴ M)/concentration of Ba2+ ions, 2 × 10⁻¹ M. | ||
The probe beam had a vanishing intensity of Iprobe = 1 μW × cm−2, therefore for the specific excitation times (in the order of 100 s) the isomerisation activity of the probe beam can be neglected. The maximum of the probe beam spectrum is λprobe = 532 nm, therefore the temporal evolution of this wavelength shows the trans-to-cis status of the sample, as shown in Fig. 4a (the green line).
 | ||
| Fig. 4 (a) The temporal evolution of the trans-transmittance (green line) and trans-fluorescence (red line) for the 4b at the sample temperature T = 35 °C. (b) The temperature dependence of the temporal evolution of the trans-transmittance for the 4b compound at T = 15 °C (blue line) and at T = 35 °C (blue line); conditions: intensity of the probe beam is constant, 1 μW × cm−2, excitation duration Δt = 90 s; dye (1 × 10⁻⁴ M)/concentration of Ba2+ ions 2 × 10⁻¹ M, pump beam intensity Ipump = 4 mW × cm−2. The vertical black line is a guide for the eye. | ||
In addition, the studied crown ether contained a styryl dye core with a non-zero fluorescence QY and this fact was used as a second measurement, revealing the cis-dye-Ba2+ isomers formation (Fig. 4a, the red line). Because the evolution of the trans-transmittance simultaneously represents the measurement for the degree of E–Z photoisomerization and the stability parameters of the cis-form, all the future optical experiments will use this process.
As shown in Fig. 5, the structure 4b demonstrates a better ability for cis-state formation, together with a longer cis-life time. The probable reasons for the observed phenomenon with dye 4b is due to a combination of the optimum spacer length separating the anchor group from the chromophore, and the presence of a methyl group directing the spacer and the anchor sulfo-group to the Ba2+-crown ether complex. During the excitation, E–Z photoisomerization simultaneously leads to an increase of the trans-state transmittance and to a decrease of the trans-state fluorescence.
 | ||
| Fig. 5 The temporal evolution of the trans-transmittance for the 4a–4d compounds at a constant temperature of T = 15 °C. Conditions: the intensity of the probe beam is constant, 1 μW × cm−2, excitation duration Δt = 90 s, dye (1 × 10⁻⁴ M)/concentration of Ba2+ ions 2 × 10⁻¹ M, pump beam intensity Ipump = 4 mW × cm−2. The vertical black line is a guide for the eye. | ||
Nevertheless, at given Ba2+ concentration the concentration of the cis-forms depends substantially on the excitation intensity and sample temperature, and the importance of these parameters will be revealed using the 4b-compound as an example. As shown in Fig. 6a, the excitation intensity increase causes a substantial increase of the degree of E–Z photoisomerization, and simultaneously the life-time of the cis-form was not strongly affected. On the contrary, a relatively moderate increase of the sample temperature strongly affected the stability of the dye-metal ion complex in the cis-state and lead to a remarkable decrease (more than six times) of the life-time of the cis-form (Fig. 6b).
 | ||
| Fig. 6 (a) The dependence of the temporal evolution of the trans-transmittance for 4b on the excitation intensity, with a constant temperature, T = 15 °C. (b) The dependence of the temporal evolution of the trans-transmittance for 4b on the sample temperature. Pump beam intensity Ipump = 4 mW × cm−2. Conditions: intensity of the probe beam is constant, 1 μW × cm−2, excitation duration Δt = 90 s, dye (1 × 10⁻⁴ M)/concentration of Ba2+ ions 2 × 10⁻¹ M. The vertical black line is a guide for the eye. | ||
It is important to emphasize that the E–Z photoisomerization occurred at extremely low excitation intensities (as low as 40 μW × cm−2 and moderate excitation times). Such excitation intensities were much lower than the intensity of 1 sun (AM1.5). The unusual sensitivity of the photochemical reaction studied was further demonstrated by direct E–Z photoisomerization of the trans-styryl dye-Ba2+ complex by the process of TTA–UC. This proved that the proposed styryl dye-Ba2+ complex materials were optimally suited for the TTA–UC accelerated MOST-systems. The cycling stability of the styryl dye-Ba2+ complex was very high, and the time-resolved spectra of trans-fluorescence and trans-absorption, measured for six successive scans are shown in Fig. S1 (ESI†).
Triplet–triplet annihilation photon energy upconversion driven E–Z photoisomerization of dyes 4a–4d
The TTA–UC process is the only upconversion process realized up to now with non-coherent, ultra-low intensity sunlight.9 The TTA–UC-based upconverter can effectively harvest the sub-band gap terrestrial sunlight photons and transfer their energy to a photon flux with an optimal spectrum for the optically coupled MOST-device. A key advantage of using the TTA–UC technique is that the conversion processes and devices can be considered and optimized independently, without affecting the operational properties of the photochemical material or device architectures.The TTA–UC takes place in multi-chromophore systems consisting of energetically optimized pairs of emitter molecules (typically aromatic hydrocarbons) and sensitizer molecules (usually, metalled macrocycles, such as porphyrins and phthalocyanines), as shown in Fig. 7a. The photon energy absorbed by a sensitizer is stored in its metastable triplet state, formed in the process of intersystem crossing (ISC). This energy is then transferred to an emitter triplet state via the process of triplet–triplet transfer (TTT). Next, the excited triplet states of two emitter molecules undergo TTA, in which one emitter molecule returns back to its singlet ground state and the other molecule gains the energy of both triplet states and is excited to the higher singlet state. As the singlet state emitter decays radiatively back to the ground state, a delayed fluorescence photon (the blue arrow, Fig. 7a) bearing a higher energy than that of the excitation photons is emitted.
 | ||
| Fig. 7 (a) Simplified energetic scheme of the TTA–UC process in a multicomponent organic system in a molecular oxygen-free environment. Insets: Left: Structure of the sensitizer (PdTBP), right: Structure of the emitter (perylene). (b) Dependence of the UC-intensity on the excitation intensity. Experimental conditions: UC-couple, PdTBP (2 × 10⁻⁵ M)/perylene (4 × 10⁻⁴ M), sensitizer/emitter ratio (CS/C) = 1/20, room temperature, sample thickness: 1000 μm, single mode laser diode, λexc = 635 nm, optical registration: via a gated PMT, integration time: 5 ms, excitation beam diameter dEXC = 1600 μm, Vitrotube® glass sample, sealed in nitrogen filled glove-box, residual oxygen < 2 ppm, solvent: 98 vol% phenyl-di-(3-buten-1-yl)-phosphate/2 vol% toluene, QYTTA–UC = 0.098 (following the IUPAC definition). | ||
Merging the technologies for E–Z photoisomerization, stabilized by complexation with precious metal-free cations (direct excitation of the MOST-dyes:  = 400–530 nm and the TTA–UC (indirect excitation of the MOST-dyes via the TTA–UC process,
  = 580–730 nm11) allowed substantial broadening of the solar spectrum available for effective energy storage. The emission spectrum of the standard perylene emitter molecule coincided optimally with the absorption spectrum of the trans-dye-Ba2+ complex (Fig. 3a), and therefore the well-studied PdTBP/perylene/organophosphate was applied as the UC-system. The sub-quadratic dependence of the UC-fluorescence on the excitation intensity, demonstrated for many UC-systems,10 dissolved in organic solvents in oxygen-free conditions is reproduced here for the UC-systems dissolved in organophosphates (Fig. 7b).
The experimental data approximated well with a power law  , where the parameter b = 1.18.
The acceptance angle for the upconversion light was relatively small – less than π/8 (Fig. 8a, the section marked as 1), therefore only a tiny part of the generated UC-fluorescence can be launched to the interaction zone of the MOST-materials (Fig. 8a, the section marked as 2). In the reported experiment the focusing and collection of the TTA–UC light was not optimized, therefore nearly 1% of the generated UC-fluorescence was guided to the MOST-interaction zone, and the intensity of the UC-fluorescence at the MOST-interaction zone was estimated to be 25 μW × cm−2. In Fig. 8b the temporal evolution of the trans-transmittance for dyes 4a–4d is shown, and this was obtained only by excitation with upconverted light. As far as is known this is the first experimental demonstration of E–Z photoisomerization observed directly by excitation with light substantially red-shifted compared to the absorption spectrum of the trans-to-cis active moieties.
 | ||
| Fig. 8 (a) Photograph of the working MOST-system excited with unconverted light generated by a TTA–UC device. (b) Temporal evolution of the trans-transmittance for dyes 4a–4d. Experimental conditions: excitation wavelength λ = 635 nm, temperature T = 20 °C, pumping pulse duration t = 300 s, MOST-dyes concentration 1 × 10⁻⁴ M/Ba2+ ions 2 × 10⁻¹ M (4a, 4b, 4c) and 1 × 10⁻⁴ M/Ba2+ ions 1 M for 4d, excitation diameter of the MOST-device dMOST = 1500 μm, excitation intensity for the TTA–UC device IUC = 40 mW × cm−2. The vertical black line is a guide for the eye. | ||
Experimental
All the solvents used in the present work were commercially available (HPLC grade). The starting materials 1a, 1b, 2a, and 2b were commercially available and were used as supplied. The melting points were determined on a Kofler apparatus and are uncorrected. The NMR spectra of the samples in DMSO-d6, were obtained on a Bruker Avance III 500 DRX 600 MHz spectrometer. The MALDI-TOF/TOF spectra were measured on a Bruker rapifleX platform at the MPIP, Mainz, Germany. The UV-VIS spectra were measured on a Unicam 530 UV–VIS spectrophotometer in conventional quartz cells of 1 cm path length. The spectral bandwidth and the scan rate were Δl = 1 nm and Δl = 140 nm min−1, respectively. Stock solutions of each compound were prepared in spectroscopic grade acetonitrile (ACN) and all the experiments were carried out in red light and at room temperature. Complex formation of dyes with Ba(ClO4)2 was studied by spectrophotometric titration. In the experiment aliquots of a solution containing known concentrations of dyes and of Ba(ClO4)2 were added to a solution of dyes alone at the same concentration. So, the absorption spectra were recorded for solutions with identical total dye concentration (1 × 10⁻⁵ M) and variable total Ba(ClO4)2 concentration ranging from 1 × 10⁻⁵ M to 5 × 10⁻¹ M in ACN. The emission spectra were recorded on a HORIBA Jobin Yvon FluoroLog 3-221, spectrofluorometer with a Quanta-φ accessory having a large 150 mm integrating sphere for the quantum yield measurements. All the spectra were recorded using quartz cells with a 1 cm path length. The solution concentrations were chosen to give an absorbance A ≤ 0.05 at the excitation wavelengths of λ = 440 nm and λ = 488 nm.Synthesis of quaternary benzothiazolium salts 2a–2d
The appropriate 2-methylbenzothiazole 1a or 1b (0.01 mol) and 0.01 mol of 1,3-propane sultone (1c) or 0.01 mol 1,4-butane sultone (1d) were dissolved in 3 ml of NMP and heated in an argon atmosphere at 145 °C for 3 h. After cooling to room temperature, the reaction work-up was performed as has already been described.5Synthesis of N-phenylaza-15-crown-5 (2g)
In a 500 ml three-neck round-bottom flask, equipped with an electromagnetic stirrer, a reflux condenser and two dropping funnels, a solution of 1.81 g (0.01 mol) of N-phenyldiethanolamine in 100 ml of THF and a solution of 4.59 g (0.01 mol) of triethylene glycol ditosylate in 100 ml of THF were added simultaneously, dropwise to a solution of 1 g of sodium hydride, (NaH, 0.036 mol of 60% suspension) in 150 ml of THF for 3 h. After the addition was completed, the reaction mixture was refluxed for a further 4 h, cooled to room temperature and then filtered. The filtrate was concentrated to dryness and 1.36 g (0.01 mol) of sodium perchlorate in 50 ml of methanol was added, and the mixture was refluxed for 10 min. Ethyl acetate (100 ml) was added and the mixture concentrated to a 10 ml volume. The resulting white precipitate was filtered off, washed with ethyl acetate and dried. The yield was 70%, and the Mp was 159–161 °C (literature: 156–159 °C). The complex was destroyed by extraction with dichloromethane![[thin space (1/6-em)]](https://www.rsc.org/images/entities/char_2009.gif) :water = 1:1. The organic layer was dried with calcium dichloride and evaporated to dryness. The Tm = 44–45 °C (literature: 44–45 °C).7
:water = 1:1. The organic layer was dried with calcium dichloride and evaporated to dryness. The Tm = 44–45 °C (literature: 44–45 °C).7
Synthesis of 4-aza-15-crown-5-benzaldehyde (3)
N-Phenylaza-15-crown-5 (2g) (2 g, 0.0068 mol) was dissolved in 6 ml of dimethylformamide (DMF). After cooling to −10 °C, the amount of 1.04 g (0.62 ml, 0.0068 mol) phosphohenoxy chloride were added dropwise and the reaction mixture was stirred for 1 h at room temperature and for 4 at 70 °C. The reaction mixture was cooled and poured onto ice, then neutralized with 2 M sodium acetate and extracted with dichloromethane. The extract was washed with water, dried with sodium sulfate and concentrated to dry. The resulting oil was dissolved in 50 ml of methanol, and 0.83 g (0.0068 mol) of sodium perchlorate was added. The solution was refluxed for 10 min and concentrated almost to dryness, and then 30 ml of ethyl acetate was added. The obtained precipitate was filtered off and dried. The aldehyde sodium complex was developed as described previously. Yield 67%. Tm = 85–87 °C (literature: 86–87 °C8). 1H-NMR (500 MHz, CDCl3, TMS, δ (ppm)): 3.52–3.72 m (16H, CH2O), 3.78–3.80 t (4H, NCH2), 6.71 d (2H, J3HH = 8.7 Hz, Ar), 7.70 d (2H, J3HH = 8.5 Hz, Ar), 9.73 s (1H, CHO).Synthesis of dyes 4a–4d
The dyes 4a–4d were prepared by a previously described procedure.5 All the analytical data completely corresponded to that already published.Conclusions
A sustainable and cost-effective synthetic protocol for the preparation of the valuable crown ether functionalized styryl hemicyanine dyes 4a–4d, which completely avoids the step of chromatographic purification, was developed. It was experimentally demonstrated that accumulation of the photonic energy of the deep-red part of the terrestrial sun irradiation applying E–Z photoisomerization was realized at extremely low excitation light intensities, lower than 4 sun (AM1.5). The higher energetic form was successfully stabilized using precious- and rare-earth metal-free cations. The temporal evolution of the sample trans-transmittance as a function of the excitation intensity and sample temperature was measured in a real time system. For the first time E–Z photoisomerization observed directly by excitation with light substantially red-shifted compared to the absorption spectrum of the trans-to-cis active moieties via the process of triplet–triplet annihilation upconversion was demonstrated experimentally.Author contributions
The authors participated equally in this work.Conflicts of interest
The authors declare no competing financial interests or other potential conflict of interests.Acknowledgements
S. Baluschev thanks the KΠ-06-H37/15-06.12.19 SunUp-project of the Bulgarian National Science Fund for financial support.Notes and references
- V. A. Bren, A. D. Dubonosov, V. I. Minkin and V. A. Chernoivanov, Russ. Chem. Rev., 1991, 60(5), 451–469 CrossRef.
- A. Lennartson, A. Roffey and K. Moth-Poulsen, Tetrahedron Lett., 2015, 56, 1457–1465 CrossRef CAS.
- A. Lennartson, A. Lundin, K. Boerjesson, V. Gray and K. Moth-Poulsen, Dalton Trans., 2016, 45, 8740–8744 RSC.
- K. Börjesson, D. Dzebo, B. Albinsson and K. Moth-Poulsen, J. Mater. Chem. A, 2013, 8521–8524 RSC.
- M. I. Kandinska, S. M. Kitova, V. S. Videva, S. S. Stoyanov, S. B. Yordanova, S. B. Baluschev, S. E. Angelova and A. A. Vasilev, Beilstein J. Org. Chem., 2019, 15, 1096–1106 CrossRef CAS PubMed.
- Q. Li, G.-L. Lin, B.-X. Peng and Z.-X. Li, Dyes Pigm., 1998, 38, 211–218 CrossRef CAS.
- M. P. Vladimirova, S. D. Simova, E. R. Stanoeva and M. Mitewa, Dyes Pigm., 2001, 50, 157–162 CrossRef CAS.
- N. Mateeva, T. Deligeorgiev, M. Mitewa and S. Simova, Dyes Pigm., 1992, 20, 271–278 CrossRef CAS.
- H. Goudarzi and P. E. Keivanidis, ACS Appl. Mater. Interfaces, 2017, 9(1), 845–885 CrossRef CAS PubMed; V. Gray, K. Moth-Poulsen, B. Albinsson and M. Abrahamsson, Coord. Chem. Rev., 2018, 362, 54–71 CrossRef; J. Pedrini and A. Monguzzi, J. Photonics Energy, 2017, 8(2), 022005 Search PubMed; Y. Murakami, S. K. Das, Y. Himuro and S. Maeda, Phys. Chem. Chem. Phys., 2017, 19, 30603–30615 RSC; L. G. von Reventlow, M. Bremer, B. Ebenhoch, M. Gerken, T. W. Schmidt and A. Colsmann, J. Mater. Chem. C, 2018, 6, 3845–3848 RSC; T. Ogawa, M. Hosoyamada, B. Yurash, T. Q. Nguyen, N. Yanai and N. Kimizuka, J. Am. Chem. Soc., 2018, 140(28), 8788–8796 CrossRef PubMed; K. A. E. Roz and F. N. Castellano, Chem. Commun., 2017, 53, 11705–11708 RSC; M. A. Filatov, E. Heinrich, D. Busko, I. Z. Ilieva, K. Landfester and S. Baluschev, Phys. Chem. Chem. Phys., 2015, 17, 6501–6510 RSC.
- Y. Murakami, H. Kikuchi and A. Kawai, J. Phys. Chem. B, 2013, 117, 2487–2494 CrossRef CAS PubMed; T. F. Schulze, J. Czolk, Y.-Y. Cheng, B. Fückel, R. W. MacQueen, T. Khoury, M. J. Crossley, B. Stannowski, K. Lips, U. Lemmer, A. Colsmann and T. W. Schmidt, J. Phys. Chem. C, 2012, 116, 22794–22801 CrossRef; V. Gray, D. Dzebo, M. Abrahamsson, B. Albinsson and K. Moth-Poulsen, Phys. Chem. Chem. Phys., 2014, 16(22), 10345–10352 RSC; S. Baluschev, K. Katta, Yu. Avlasevich and K. Landfester, Mater. Horiz., 2016, 3, 478–486 RSC; S. H. C. Askes and S. Bonnet, Nat. Rev. Chem., 2018, 2(12), 437–452 CrossRef.
- E. Heinrich, Y. Avlasevich, K. Landfester and S. Baluschev, J. Photonics Energy, 2018, 8(2), 022002 Search PubMed.
Footnote |
| † Electronic supplementary information (ESI) available. See DOI: 10.1039/d1tc01257f |
| This journal is © The Royal Society of Chemistry 2021 |