 Open Access Article
Creative Commons Attribution 3.0 Unported Licence
DFT and experimental studies of iron oxide-based nanocomposites for efficient electrocatalysis†
Oluwafunmilola
Ola
 a,
Habib
Ullah
 b,
Yu
Chen
c,
Kunyapat
Thummavichai
 d,
Nannan
Wang
 d and
Yanqiu
Zhu
 *c
*c
aFaculty of Engineering, The University of Nottingham, University Park, Nottingham, NG7 2RD, UK
bRenewable Energy Group, College of Engineering, Mathematics and Physical Sciences, University of Exeter, Penryn Campus, Cornwall TR10 9FE, UK
cCollege of Engineering, Mathematics and Physical Sciences, University of Exeter, EX4 4QF, UK. E-mail: Y.Zhu@exeter.ac.uk; Tel: +44 1392 723620
dKey Laboratory of New Processing Technology for Nonferrous Metals and Materials, Ministry of Education, School of Resources, Environment and Materials, Guangxi University, Nanning, China
First published on 6th April 2021
Abstract
The synthesis of iron oxide nanoparticles coated with graphitic carbon nitride (Fex-NC), and their improved electrochemical stability and corrosion resistance in an acidic electrolyte environment are reported. Our results show that the Fex-NC nanocomposites exhibit enhanced activity and long-term stability for the HER in a 0.5 M H2SO4 aqueous solution, with an onset potential of 73 mV and Tafel slope of 69 mV dec−1. Furthermore, DFT calculations are carried out to represent our experimental system. Both theory and experiment strongly correlate with each other, where gC3N4@FeO has superior performance to the pristine gC3N4. It is found that the electrocatalytic activity of gC3N4@FeO arises from the electron transfer from FeO particles to the gC3N4, which form an electrostatic interaction, leading to a decreased local work function on the surface of gC3N4. The resulting graphitic carbon nitride shells prevented direct contact between the iron oxide nanoparticles and acidic electrolyte (H2SO4), so that improved stability and corrosion resistance could be achieved. This work sheds light on new efficient and durable electrocatalysts for applications in acidic environments.
Introduction
Water electrolysis has attracted wide attention as a promising approach for generating high energy density hydrogen at high conversion efficiencies with zero CO2 emissions. The hydrogen evolution reaction (HER) represents the cathodic half reaction of water electrolysis requiring electrocatalysts to simultaneously increase the reaction rate and efficiency, while lowering the overpotential. Among many electrocatalysts, the platinum group of metals remains as the first choice due to their fast kinetics, almost thermoneutral hydrogen binding energy (G ∼ 0) and hydrogen evolution at values close to the reaction's equilibrium potential.1 However, the high cost and scarcity of platinum-based materials have intensified the research of alternative low-cost electrocatalysts, to drive the transition to a viable hydrogen economy. Recent progress has focused on the development of traditional electrocatalysts and corresponding hybrids using metal/non-metal compounds of nitrides, selenides, phosphides, and carbides. The synthesis of low-cost, yet effective HER catalysts remains a major challenge. Some of the strategies for improving HER catalytic activity include heteroatom doping, particle size and morphology modification and incorporation of metal/oxide nanoparticles in carbon-based materials. Although much progress has been made in promoting higher HER activity, most of these materials are unstable under acidic and alkaline conditions, since they mainly rely on the interaction of metal–H bonds for the HER.2The encapsulation of nanosized electrocatalysts by carbon-based materials such as graphene has been proposed as a means of improving catalytic activity, efficiency, and stability, because graphitic carbon shells have high electrical conductivity, large surface area, good chemical stability, excellent structural tunability and particularly good insolubility in many solvents. These features are linked to improved electron transfer at exposed catalytic active sites under extreme operational conditions.2 Furthermore, these graphitic carbon shells have also been reported to enhance HER activities by altering the Gibbs free energy of hydrogen adsorption through interaction between metal/metal oxide compounds and the surrounding carbon shell. These carbon shells can effectively prevent direct contact between metal atoms and electrolytes, so that the stability and corrosion resistance of electrocatalysts can be improved. Further introduction of single or multiple heteroatoms of nitrogen (N),3 phosphorus (P),4 and boron (B)5 into the carbon shells can tune the electronic conductivity by offering improved charge transfer, thus influencing the electrocatalytic performance.
Iron and its derivatives are attractive for electrocatalysis due to their low cost and relative abundance.6–9 However, their catalytic activity is limited due to instability and deactivation resulting from leaching of active nanoparticles from the reaction medium. Encapsulating iron and its derivatives in heteroatom-doped carbon shells prepared by the chemical vapor deposition and self-templating technique can influence the catalytic activity, while facilitating improved electron transfer, faster hydrogen desorption and better stability.2 Herein, we use melamine as a nitrogen and carbon source to create such sheathed iron–oxide nanoparticles for electrocatalysis. The new process is an inexpensive and scalable method, which is realized via simple carbonization under an inert atmosphere. Experimental results show that iron oxide nanoparticles encapsulated in a graphitic carbon nitride shell can work as an efficient HER catalyst in an acidic medium with activities that are comparable to other reported carbon-encapsulated catalysts.
Experimental
Preparation of Fex-NC nanocomposites
Fex-NC samples were prepared via dip coating and carbonization. Varying amounts of Fe(C5H5)2 (Sigma Aldrich) precursor were dissolved in ethanol (Sigma Aldrich) to obtain homogeneous solutions. Melamine-formaldehyde (MF) sodium bisulfite foams (Avocation Ltd) were then dip-coated in the precursor solutions of different concentrations (0.02–0.1 M). The dip-coated foams were dried overnight at 80 °C and then carbonized at 800 °C under a continuous argon flow of 50 mL min−1. Approximately 50 mL min−1 of hydrogen gas was introduced into the furnace at the target temperature of 800 °C for 30 min to obtain the final samples. The as-prepared samples were denoted as Fex-NC, where x represents the concentration of Fe, such that the precursor solution concentration varied at 0.02 M, 0.05 M, and 0.1 M, and the samples were named Fe2-NC, Fe5-NC and Fe10-NC, respectively.Characterization and electrochemical testing
The morphology and structures of the samples were characterized using scanning electron microscopy (Hitachi S3200N, Oxford instrument – SEM-EDS) operated at 20 kV, and JEOL-2100 high-resolution transmission electron microscopy (HR-TEM) operated at 200 kV. X-ray diffraction (XRD) patterns were acquired on a Bruker D8 Advance diffractometer (operated at 40 kV and 40 mA), with Cu Kα radiation, at a step size and dwell time of 0.02° and 1 s respectively. Raman spectra were recorded on a Renishaw RA800 series benchtop system with a 532 nm excitation length under a laser power of 6 mW. X-ray photoelectron spectra (XPS) were recorded using a VG ESCALab Mark II spectrometer with a non-monochromatic Al-anode X-ray source (1486.6 eV), operated at a 12 kV anode potential and a 20 mA filament emission current. N2 adsorption/desorption was determined by Brunauer–Emmett–Teller (BET) measurements using a Quantachrome Autosorb-IQ surface area analyser. Information on the chemical bonding was obtained using attenuated total reflectance-Fourier transform infrared spectroscopy (ATR-FTIR, Bruker) over a wavelength of 400–4000 cm−1. A CHI-760D electrochemical workstation with a three-electrode system was used to evaluate the electrocatalytic activity of the nanocomposites. The CHI-760D workstation was coupled with a rotating disk electrode (RDE) system where the reference, counter and working electrodes were Ag/AgCl/KCl, platinum wire and glassy carbon electrode (GCE) covered with catalyst ink, respectively. The catalyst ink was prepared via ultrasonification of a mixture of 5 μL of Nafion solution, 1 mL of ethanol/water solution and 3 mg of Fex-NC sample. The measurements (cyclic voltammograms, linear sweep voltammograms and impedance spectroscopy) were carried out in a 0.5 M H2SO4 (Sigma Aldrich) electrolyte solution at different potentials and scan rates varying from 0 to −0.8 V and 10–100 mV, respectively. The electrode was calibrated by a reversible hydrogen electrode (RHE) and acquired data were corrected for iR losses. The optimal sample was further subjected to a stability test for 5000 cycles.Computational methodology
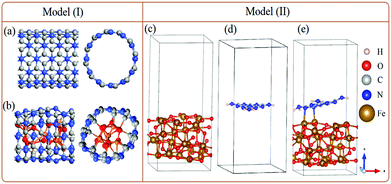
In order to support our experimental data, DFT simulation was performed on a QuantumATK,10 while visualizations were achieved on a VESTA and vnl Version 2019.12.11 To model the experimentally g-C3N4-encapsulated FeOx nanoparticles, two different strategies are employed; (I) g-C3N4 is built where mixtures of Fe3O4 and Fe2O3 (collectively denoted as FeO) are encapsulated to form g-C3N4@FeO (Fig. 1a and b), and (II) a single layer of g-C3N4 is incorporated on the surface of Fe3O4 (Fig. 1c–e).Results and discussion
Structural and physicochemical properties
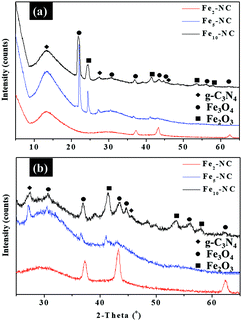
Fex-NC samples were evaluated by XRD to determine the phase purity and crystalline structure. Fig. 2 show the XRD patterns that confirm the presence of graphitic carbon nitride (g-C3N4) and iron oxide. Two characteristic peaks of g-C3N4 at 13.6° and 27.4° are indexed to the (100) and (002) planes, which are linked to the in-planar structure of the tri-s-triazine ring and interplanar stacking peak of C–N systems, respectively.15 Besides g-C3N4, diffraction peaks of Fex-NC samples are in good agreement with the standard pattern of cubic spinel Fe3O4 (PDF 2107249). The XRD profile shows the complete phase transformation of Fe(C5H5)2 to α-Fe2O3 after thermal decomposition at 800 °C. Further phase transformation of α-Fe2O3 to Fe3O4 was observed for Fe2-NC, with mixtures of rhombohedral α-Fe2O3 (PDF 1011267) and cubic Fe3O4 being observed for Fe5-NC and Fe10-NC samples prepared at higher precursor concentrations. The presence of zero valent iron or iron carbide species was not observed.Besides g-C3N4, diffraction peaks of Fex-NC samples are in good agreement with the standard pattern of cubic spinel Fe3O4 (PDF 2107249). The XRD profile shows the complete phase transformation of Fe(C5H5)2 to α-Fe2O3 after thermal decomposition at 800 °C. Further phase transformation of α-Fe2O3 to Fe3O4 was observed for Fe2-NC, with mixtures of rhombohedral α-Fe2O3 (PDF 1011267) and cubic Fe3O4 being observed for Fe5-NC and Fe10-NC samples prepared at higher precursor concentrations. The presence of zero valent iron or iron carbide species was not observed.
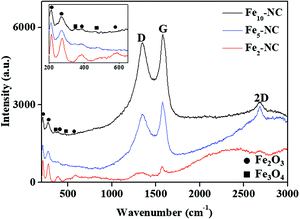
The Raman spectra of Fex-NC samples, presented in Fig. 3, show the characteristic peaks of graphene, α-Fe2O3 and Fe3O4, and further confirm the successful formation of Fex-NC nanocomposites. For carbon, the identified peaks of the D peak (∼1350 cm−1), G peak (∼1580 cm−1) and 2D peak (∼2690 cm−1) are linked to defects, bond stretching of sp2 graphitic carbon atom and a high-energy second-order process of graphene, respectively. The peak intensity ratios of the D band to G band are calculated to be 0.89, 0.88 and 0.94 for Fe2-NC, Fe5-NC and Fe10-NC, respectively. The higher peak intensity ratio of Fe10-NC depicts the presence of higher structural defects compared with other Fex-NC samples. Characteristic peaks of Fe2O3 and Fe3O4 were also observed and marked in the spectra. Raman shifts at ∼212, 274, 389 and 586 cm−1 are assigned to A1g and Eg modes of Fe2O3.13 The two additional peaks at 329 and ∼497 cm−1 confirmed the presence of Fe3O4.6
The ATR-FTIR spectra of Fe5-NC are shown in Fig. S1 (ESI†). Absorption peaks at the 2115 and 2350 cm−1 regions were observed, which were due to the C![[triple bond, length as m-dash]](https://www.rsc.org/images/entities/char_e002.gif) N stretching.17,18 The 1994 cm−1 peak is linked to bridge carbonyl groups.16 The prominent bands at 462, 550 and 602 cm−1 are attributed to Fe–O vibrational modes in α-Fe2O3.19 The weak peak at 630 cm−1 is attributed to the stretching vibration mode of the Fe–O bonds in the crystalline lattice of Fe3O4.20
N stretching.17,18 The 1994 cm−1 peak is linked to bridge carbonyl groups.16 The prominent bands at 462, 550 and 602 cm−1 are attributed to Fe–O vibrational modes in α-Fe2O3.19 The weak peak at 630 cm−1 is attributed to the stretching vibration mode of the Fe–O bonds in the crystalline lattice of Fe3O4.20
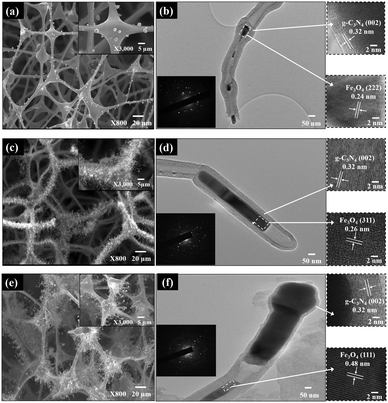
The SEM and TEM images of Fex-NC samples are displayed in Fig. 4. As shown in the SEM images (Fig. 4a, c and e), the Fex-NC consists of nanotubes of several micrometers in length with varying diameters, which were grown on the surface of carbon foams. Based on SEM elemental analysis, all Fex-NC samples are composed of C, N, O and Fe elements, which are uniformly distributed. TEM images of single Fex-NC nanocomposites prepared with varying precursor concentrations are shown in Fig. 4b, d and f. The outer diameter of the nanotubes was measured at about 47–117 nm with a wall thickness of 8.1–30 nm. The inner/outer diameter and wall thickness of the nanotubes were observed to decrease with increased precursor concentrations.
The enlarged TEM image shows that nanoparticles are encapsulated within the nanotubes (Fig. 4b, d and f).
The high-resolution TEM (HRTEM) image shows that the outer layer of the nanotubes consists of graphitic layers with an interlayer spacing of 0.32 nm linked to the (002) plane of g-C3N4. Individual spots seen in the SAED patterns also indicate that Fex-NC samples consist of mainly iron oxide nanoparticles. The HRTEM images of the nanoparticles marked with rectangles show lattice fringes with d-spacing of 0.24, 0.26 and 0.48 nm corresponding to the (222), (311) and (111) planes of Fe3O4 nanoparticles for Fe2-NC, Fe5-NC and Fe10-NC, respectively.6,21,22 Based on the above analyses, we believe that the crystalline Fe3O4 nanoparticles were encapsulated in multi-walled nanotubes and the size of the encapsulated nanoparticles varies from a few to hundreds of nanometers.
The presence and distribution of C, N, O and Fe elements were also confirmed by TEM elemental mapping in Fig. 5. All the elements were well distributed in Fe10-NC. The atomic contents of the Fe10-NC sample quantified by TEM-EDS are 90, 0.4, 2.5 and 7.1 at% for C, N, O and Fe, respectively, which shows an Fe![[thin space (1/6-em)]](https://www.rsc.org/images/entities/char_2009.gif) :
:![[thin space (1/6-em)]](https://www.rsc.org/images/entities/char_2009.gif) O ratio close to 3
O ratio close to 3![[thin space (1/6-em)]](https://www.rsc.org/images/entities/char_2009.gif) :
:![[thin space (1/6-em)]](https://www.rsc.org/images/entities/char_2009.gif) 1. Indeed, the XRD and Raman results (Fig. 2 and 3) confirmed that the nanoparticles in Fex-NC could exist as either Fe2O3 or Fe3O4 species. As shown in Fig. 5, highly uniformly distributed C and N species existed around the iron oxide particles at the nanoscale, confirming that the iron oxides were completely encapsulated in the carbon/nitrogen shell. BET and pore size distribution analyses were conducted, and the resulting specific surface areas of Fe2-NC, Fe5-NC and Fe10-NC were 368, 476 and 223 m2 g−1, respectively. The mesoporous features of the samples are shown in Fig. S2 (ESI†).
1. Indeed, the XRD and Raman results (Fig. 2 and 3) confirmed that the nanoparticles in Fex-NC could exist as either Fe2O3 or Fe3O4 species. As shown in Fig. 5, highly uniformly distributed C and N species existed around the iron oxide particles at the nanoscale, confirming that the iron oxides were completely encapsulated in the carbon/nitrogen shell. BET and pore size distribution analyses were conducted, and the resulting specific surface areas of Fe2-NC, Fe5-NC and Fe10-NC were 368, 476 and 223 m2 g−1, respectively. The mesoporous features of the samples are shown in Fig. S2 (ESI†).
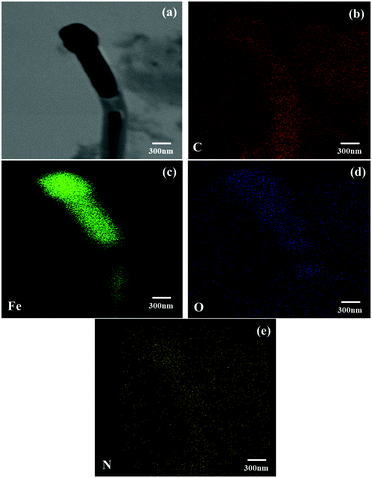 | ||
| Fig. 5 (a) A TEM image of sample Fe10-NC and (b–e) its corresponding EDS elemental mappings for C, Fe, O and N, as marked. | ||
The surface bonding configurations and chemical compositions of the samples were evaluated by XPS, and the results are shown in Fig. S3, S4 and S6 (ESI†). The survey spectrum confirms the presence of C, N, O and Fe in all samples, in accordance with the SEM and TEM-EDS results. The compositions of C, N, O and Fe are 83, 2, 7 and 8 wt% for Fe5-NC, respectively (Fig. S3a, ESI†). The results of other Fex-NC samples investigated by XPS are summarized in Table S1 (ESI†). Comparison of the relative N and Fe elemental abundances indicates that Fe10-NC contains ∼4 wt% N and ∼14 wt% Fe on the surface.
As shown in Fig. S3b (ESI†), the XPS spectra of C 1s are fitted into five components, assigned to C–C (284.5 eV), C![[double bond, length as m-dash]](https://www.rsc.org/images/entities/char_e001.gif) N (285 eV), C
N (285 eV), C![[double bond, length as m-dash]](https://www.rsc.org/images/entities/char_e001.gif) O (287.6 eV), O–C
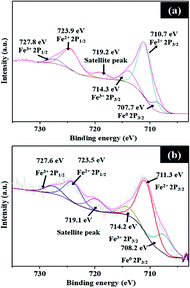
O (287.6 eV), O–C![[double bond, length as m-dash]](https://www.rsc.org/images/entities/char_e001.gif) O (289.4 eV), and C π (291.3 eV).23 The main peak at 284.5 eV is linked to sp2 carbon, which shows that the carbon content of the samples is predominantly graphitic in nature. As shown in Fig. 6a, the high-resolution XPS spectra of Fe show peaks at 711.3 and 714.2 eV, which can be assigned to the binding energies of the 2p3/2 orbitals of Fe2+ and Fe3+ species, respectively. For the 2p1/2 orbital, the peaks at 723.5 and 727.6 eV are attributed to the binding energy of Fe2+ and Fe3+ species, respectively. The peak at 719.1 eV is a satellite peak, while an additional peak at 708.2 eV is linked to metallic Fe. The Fe 2p3/2 peak at 711.3 eV indicates Fe–N bonding as Fe ions are coordinated to N.24 XPS studies of Fe5-NC before and after testing in Fig. 6b show similar peaks; however, a negligible change in relative proportion of Fe species on the active Fe5-NC electrode after cyclic HER studies is observed.
O (289.4 eV), and C π (291.3 eV).23 The main peak at 284.5 eV is linked to sp2 carbon, which shows that the carbon content of the samples is predominantly graphitic in nature. As shown in Fig. 6a, the high-resolution XPS spectra of Fe show peaks at 711.3 and 714.2 eV, which can be assigned to the binding energies of the 2p3/2 orbitals of Fe2+ and Fe3+ species, respectively. For the 2p1/2 orbital, the peaks at 723.5 and 727.6 eV are attributed to the binding energy of Fe2+ and Fe3+ species, respectively. The peak at 719.1 eV is a satellite peak, while an additional peak at 708.2 eV is linked to metallic Fe. The Fe 2p3/2 peak at 711.3 eV indicates Fe–N bonding as Fe ions are coordinated to N.24 XPS studies of Fe5-NC before and after testing in Fig. 6b show similar peaks; however, a negligible change in relative proportion of Fe species on the active Fe5-NC electrode after cyclic HER studies is observed.
Deconvolution of the high-resolution XPS O 1s peak confirmed the presence of oxygen related to the iron oxide catalyst (529.8 eV) and some carboxylic and hydroxyl species on the surface of the Fe5-NC sample at 533.1 and 531.5 eV, respectively (Fig. S3c, ESI†). N 1s spectra were deconvoluted into three peaks, which were assigned to the pyridinic N (398.3 eV), graphitic N (401.0 eV), and quarternary N+–O− (402.8 eV) with atomic contents of 26, 57 and 16 at% (Fig. S3d, ESI†), respectively. Pyridinic N served as metal-coordination sites due to its lone-pair electrons, while graphitic N was reported as catalytically active sites for electrocatalysis.25 These two types of N species are of high content in Fex-NC samples, which potentially lead to a high catalytic activity.
First principles electronic properties
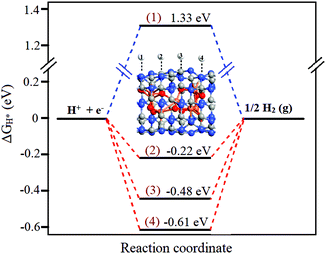
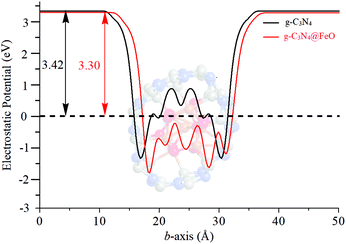
The density of states (DOS) of pristine g-C3N4 is compared with that of g-C3N4@FeO and shown in Fig. 8, where the interaction of Fe–C, Fe–N, O–C, and O–N in g-C3N4@Fe can be identified. DOS of g-C3N4@FeO is enhanced especially near the valence band (0 to −1.8 eV), which is due to the interaction of C and N atoms with FeO clusters and exhibits extra features near the Fermi level. Moreover, charge transfer also occurred from the FeO cluster to the g-C3N4, which raises the Fermi level by about 0.12 eV. This effect is further illustrated by the electron difference density (EDD) distribution as shown in the inset of Fig. 8. The charge transfer creates a local dipole near the interface, which consequently decreases the local work function and increases the chemical reactivity of the functionalized region of the g-C3N4@FeO exterior. So, this accounts for the optimum value of ΔGH* (hydrogen adsorption) over the C in the region where FeO is sitting below and has no direct contact. Finally, this can further increase the DOS near the Fermi level and reduce the work function of the doped g-C3N4 (see Fig. 9).
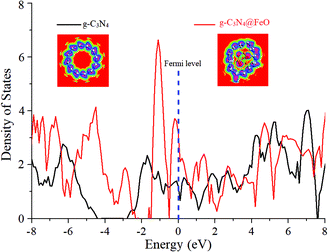 | ||
| Fig. 8 Comparative density of states plots of g-C3N4 and g-C3N4@FeO. The Fermi energy level is aligned at 0 eV. Insets show the electron difference density (EDD) of pristine SWNCNT and g-C3N4@FeO. | ||
| ΔEad = EFe3O4@g-C3N4 − (Eg-C3N4 + EFe3O4) | (1) |
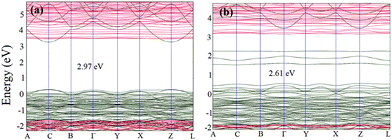
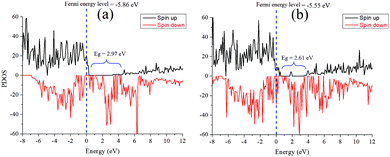
The bandgaps of these species are simulated from the PDOS as well, as shown in Fig. 11. Comparative analysis of the band structures of both pristine Fe3O4 and Fe3O4@g-C3N4 shows that g-C3N4 produces some extra bands in the bandgap of Fe3O4. These extra bands can be called flat bands, which work as charge trapping centres and consequently increase the overall catalytic performance of Fe3O4@g-C3N4. Interestingly, in either spin states, the Fermi energy level is diffused in the valence band (Fig. 10).
The simulated electrostatic potential maps of Fe3O4, g-C3N4, and Fe3O4@g-C3N4 along the Z-direction are displayed in Fig. 12, where the g-C3N4 monolayer has shared its electronic cloud density with a surface of Fe3O4 in Fe3O4@g-C3N4. The work functions of Fe3O4, g-C3N4, and Fe3O4@g-C3N4 are 5.86, 4.24, and 5.55 eV, respectively. We can see that the heterojunction Fe3O4@g-C3N4 has optimum work; lower than that of Fe3O4 but higher than that of g-C3N4. So, the HER performance of the Fe3O4@g-C3N4 heterojunction can be calculated from the difference of work functions. It is also inferred that charge transfer occurred between Fe3O4 and g-C3N4. Finally, this type of charge transfer creates a local dipole near the interface, decreases the work function (from 5.86 to 5.55 eV) and enhances the HER activity over the surface of g-C3N4@FeO.
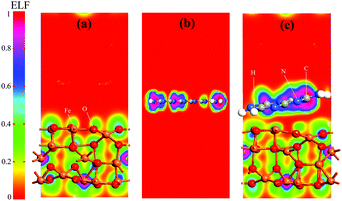 | ||
| Fig. 12 Electrostatic potential maps of (a) Fe3O4, (b) a monolayer of g-C3N4, and (c) Fe3O4@g-C3N4 heterojunction. | ||
The charge transferring phenomenon at the Fe3O4@g-C3N4 heterojunction is calculated from the electron difference density (EDD) of the heterostructure, and the results are shown in Fig. 13 and Fig. S7 (ESI†). In Fig. 13, the charge difference at the interface is clearly depicted where the green and yellow shaded areas represent the charge accumulation and depletion, respectively. It is found that charge distribution mainly occurs at the interface region of the Fe3O4@g-C3N4 heterostructure, whereas almost no perturbation was observed in the rest of Fe3O4@g-C3N4, especially in those parts, which are far away from the interface. We can predict that this type of charge distribution may result in a non-bonding interaction,27 between g-C3N4 and Fe3O4 (vide supra). A slice of the planar-averaged EDD along the Z-direction of Fe3O4 and Fe3O4@g-C3N4 is depicted in Fig. 13 and the electron density (ED) maps are shown in Fig. S7 (ESI†). The charge redistribution at the interface of the Fe3O4@g-C3N4 heterostructure leads us to conclude the charge separation of electrons and holes. The amount of charge density is calculated from Bader charge analysis, which is about 0.068 electrons. Furthermore, this charge accumulation and donation may result in an electric field at the interface of the Fe3O4@g-C3N4 heterostructure, which is further responsible for the separation of electrons and holes.
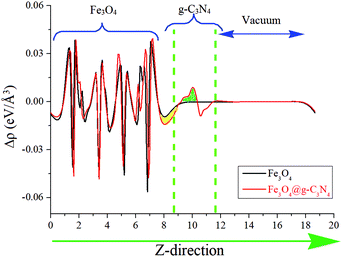 | ||
| Fig. 13 Average electron density differences (Δρ) along the Z-direction for Fe3O4 and Fe3O4@g-C3N4. The green and yellow shaded areas indicate electron accumulation and donation, respectively. | ||
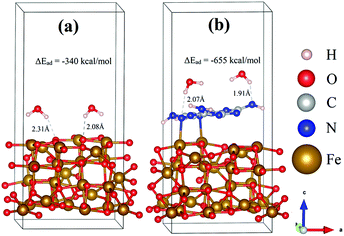
To determine and compare the HER performance of Fe3O4 and Fe3O4@g-C3N4, two water molecules were interacted on their surfaces, and optimized the resulting systems. The relaxed geometric structures of Fe3O4/H2O and Fe3O4@g-C3N4/H2O are shown in Fig. 14, where H atoms of H2O have built inter-hydrogen bonding with O of Fe3O4 and N of Fe3O4@g-C3N4, respectively.
The adsorption energy of a water molecule was calculated by subtracting the energies of the optimized water molecule and adsorbent-bare slab (Esurface), from the optimized water-slab complex (surface@H2O), using eqn (2).
| ΔEad = Esurface@H2O − (EH2O + Esurface) | (2) |
The strength of hydrogen bonding in these species is calculated from inter-bonding distance and adsorption energy. As can be visualized from Fig. 14, only one of the hydrogens in water interacts with the surface atoms of either Fe3O4 or Fe3O4@g-C3N4/H2O. In the case of Fe3O4/H2O, the average hydrogen bonding distance is about 2.20 Å, while the energy of this bonding is about −339.91 kcal mol−1. On the other hand, the average hydrogen bonding distance in Fe3O4@g-C3N4/H2O is about 1.99 Å, which is shorter than that of the Fe3O4/H2O system. Moreover, the adsorption energy of a water molecule in the Fe3O4@g-C3N4/H2O system is about −655.15 kcal mol−1, which is almost double that of Fe3O4/H2O. The stronger the hydrogen bonding, the higher the water splitting ability will be. The high adsorption energy of water can be correlated to the experimentally lower overpotential of the HER. In summary, Fe3O4@g-C3N4 has higher catalytic activity (in terms of strong water adsorption energy) than that of pristine Fe3O4. Again, these results and discussion strongly corroborate our experimental data, presented below.
Electrochemical properties
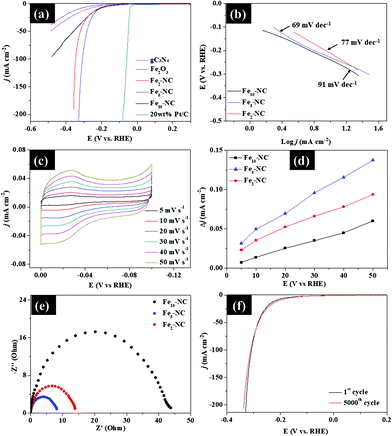
As shown in Fig. 15a, Fe5-NC exhibits a small onset potential of 73 mV and low overpotential (η ∼ 10) of 191 mV to achieve a current density of 1 and 10 mA cm−2, respectively, which is lower than the onset potentials and overpotentials of both Fe2-NC and Fe10-NC samples. Fe2-NC and Fe10-NC require overpotentials of 215 mV and 233 mV, respectively, to reach 10 mA cm−2. The LSV curves also indicate that Fe5-NC exhibits better activity with higher catalytic currents compared with those of the other samples. These results are comparable to recently reported metal-encapsulated nanocomposites of P-doped Ni@CNTs/NF, FNC-MoS2 and Co/Co2P@ACF/CNT HNCs.4,28,29Corresponding Tafel plots derived from polarization curves were used to deduce the HER mechanism of the samples (Fig. 15b). Fe5-NC has a small Tafel slope of 69 mV dec−1, compared to that of Fe2-NC (77 mV dec−1) and Fe10-NC (91 mV dec−1), which indicates its faster kinetics towards the HER. Based on the Tafel slope values, the HER with Fex-NC samples likely proceeded via the Volmer–Heyrovsky mechanism in which the rate limiting step is usually the electrochemical discharge step. The Tafel slope of the Volmer reaction (H2O + e− → Hads + OH−), which represents the initial discharge step is 120 mV dec−1, while the electrochemical desorption, Heyrovsky reaction (Hads + H2O + e− → H2 + OH−) and recombination (Tafel reaction: → Hads + Hads → H2) occur at lower values of 40 and 30 mV dec−1, respectively.30 Tafel slopes of the Fex-NC samples lie within this range, which suggests that the Volmer–Heyrovsky mechanism must have occurred during hydrogen evolution.
Cyclic voltammetry at different scan rates (5–50 mV s−1) was applied to study the electrochemical properties of the Fex-NC samples and the results are presented in Fig. 15c. The reaction profile was capacitive rather than faradaic during the volumetric scan within the range of −0.1–0 V (vs. RHE). The electrochemically active surface areas (ESCAs) of the three samples were evaluated by measuring the double layer capacitance (Cdl) obtained from fitting of the difference in current densities versus the scan rates. From Fig. 15d, the Cdl values of Fe2-NC, Fe5-NC and Fe10-NC were determined to be 11.12, 23, and 15 mF cm−2, respectively. The improved Cdl value for Fe5-NC is linked to its improved electrocatalytic performance due to the presence of intrinsically more catalytically active sites. The reaction kinetics of the Fex-NC samples at the electrode/electrolyte interface was evaluated by EIS. The Nyquist plots in Fig. 15e reveal that the charge transfer resistance (Rct) of Fe5-NC (8 Ω) is much lower than that of the other samples (Fe2-NC, 14 Ω and Fe10-NC, 44 Ω), which indicates a faster kinetics and reaction process, due to easier charge transfer at the electrode/electrolyte interface. Stability of Fe5-NC was measured by chronoamperometric curves and taking continuous linear potential sweeps on the electrode at a scan rate of 50 mV s−1 for 5000 cycles. As shown in Fig. 15f, the current density of Fe5-NC exhibits negligible changes after 5000 cycles compared with the initial curve, with only minimal loss of activity at a current density of 10 mA cm−2. The chronoamperometric curve recorded at −0.3 V in Fig. S9 (ESI†) also indicates that Fe5-NC retains 94% of its relative current density after 5 hours of testing. This result demonstrates the improved stability of Fe5-NC as a HER electrocatalyst. Although Fe5-NC shows good stability, the dissolution of Fe ion concentration in electrolyte cannot be ruled out and will be investigated via inductively coupled plasma mass spectrometry in the future to further validate its long-term stability. The morphology and crystal structure of Fe5-NC exhibit negligible changes after 5000 cycles (Fig. S8, ESI†), which is indicative of its good stability. These results confirm that the present carbon nitride shell indeed can protect the oxides from acidic bubble corrosion during the cycling test, which highlights its application potential.
To sum up, the enhanced catalytic activity of Fe5-NC can be attributed to the following reasons: (1) synergy between iron oxide nanoparticles and the graphitic carbon nitride shell, which promotes HER activity by facilitating faster charge transfer and weakening strong hydrogen adsorption to obtain improved hydrogen desorption; (2) uniform distribution of all elements and creation of abundant defect sites from the N-doping into carbon frameworks, which would improve interfacial adsorption and electronic interaction, while creating catalytically active sites for HER activity; (3) the introduction of high ESCA, which allows for enhanced accessibility of exposed active sites for the HER; and (4) the smaller charge transfer resistance linked to the faster kinetics and higher current density.
Conclusions
Fex-NC nanocomposites were successfully prepared via a simple method using melamine as the simultaneous nitrogen and carbon source. The resulting Fex-NC consists of iron oxide nanoparticles sheathed by graphitic carbon nitride shells of 8.1–30 nm thickness. The observed data of g-C3N4 encapsulated iron oxide nanoparticles were successfully reproduced with the help of periodic density functional theory (DFT) simulations. Both theory and experiment strongly correlate to each other, where the g-C3N4@FeO has superior performance compared to pristine g-C3N4 and Fe3O4. It is found that the catalytic activity of g-C3N4@FeO arises from the electron transfer from FeO particles to the g-C3N4, which forms an electrostatic interaction, leading to a decreased local work function on the surface of g-C3N4, which consequently enhanced the HER activity.Conflicts of interest
The authors have no competing interest to declare.Acknowledgements
O. Ola is grateful for the support from the Leverhulme Trust Early Career Fellowship, ECF-2018-376.References
- F. Safizadeh, E. Ghali and G. Houlachi, Int. J. Hydrogen Energy, 2015, 40, 256–274 CrossRef CAS.
- J. Lu, S. Yin and P. K. Shen, Electrochem. Energy Rev., 2019, 2, 105–127 CrossRef CAS.
- G. Hu, J. Li, P. Liu, X. Zhu, X. Li, R. N. Ali and B. Xiang, Appl. Surf. Sci., 2019, 463, 275–282 CrossRef CAS.
- S. Jing, D. Wang, S. Yin, J. Lu, P. K. Shen and P. Tsiakaras, Electrochim. Acta, 2019, 298, 142–149 CrossRef CAS.
- Y. Yao, H. Chen, J. Qin, G. Wu, C. Lian, J. Zhang and S. Wang, Water Res., 2016, 101, 281–291 CrossRef CAS PubMed.
- Y. G. Zhu, J. Xie, G. S. Cao, T. J. Zhu and X. B. Zhao, RSC Adv., 2013, 3, 6787–6793 RSC.
- M. Huck, L. Ring, K. Küpper, J. Klare, D. Daum and H. Schäfer, J. Mater. Chem. A, 2020, 8, 9896–9910 RSC.
- B. H. Suryanto, Y. Wang, R. K. Hocking, W. Adamson and C. Zhao, Nat. Commun., 2019, 10, 1–10 CrossRef PubMed.
- M. Wang, C. Zhang, T. Meng, Z. Pu, H. Jin, D. He, J. Zhang and S. Mu, J. Power Sources, 2019, 413, 367–375 CrossRef CAS.
- AtomistixToolKit, http://www.quantumwise.com.
- VirtualNanoLab, http://www.quantumwise.com.
- M. Iizumi, T. Koetzle, G. Shirane, S. Chikazumi, M. Matsui and S. Todo, Acta Crystallogr., Sect. A: Found. Crystallogr., 1982, 38, 2121–2133 CrossRef.
- A. H. Larsen, M. Vanin, J. J. Mortensen, K. S. Thygesen and K. W. Jacobsen, Phys. Rev. B: Condens. Matter Mater. Phys., 2009, 80, 195112 CrossRef.
- G. Kresse and D. Joubert, Phys. Rev. B: Condens. Matter Mater. Phys., 1999, 59, 1758 CrossRef CAS.
- X. Guo, G. Yue, J. Huang, C. Liu, Q. Zeng and L. Wang, ACS Appl. Mater. Interfaces, 2018, 10, 26118–26127 CrossRef CAS PubMed.
- G. Raj, A. Bhagi and V. Jain, Group theory and Symmetry in Chemistry, Krishna Prakashan Media, 2010 Search PubMed.
- A. Ferrari, S. Rodil and J. Robertson, Phys. Rev. B: Condens. Matter Mater. Phys., 2003, 67, 155306 CrossRef.
- A. Stolz, S. Le Floch, L. Reinert, S. M. Ramos, J. Tuaillon-Combes, Y. Soneda, P. Chaudet, D. Baillis, N. Blanchard and L. Duclaux, Carbon, 2016, 107, 198–208 CrossRef CAS.
- A. Rufus, N. Sreeju and D. Philip, RSC Adv., 2016, 6, 94206–94217 RSC.
- L. Nalbandian, E. Patrikiadou, V. Zaspalis, A. Patrikidou, E. Hatzidaki and C. N. Papandreou, Curr. Nanosci., 2016, 12, 455–468 CrossRef CAS.
- Y. He, L. Huang, J.-S. Cai, X.-M. Zheng and S.-G. Sun, Electrochim. Acta, 2010, 55, 1140–1144 CrossRef CAS.
- E. Liu, H. Yuan, Z. Kou, X. Wu, Q. Xu, Y. Zhai, Y. Sui, B. You, J. Du and H. Zhai, Sci. Rep., 2015, 5, 11164 CrossRef PubMed.
- Y. Hou, B. Zhang, Z. Wen, S. Cui, X. Guo, Z. He and J. Chen, J. Mater. Chem. A, 2014, 2, 13795–13800 RSC.
- Z.-Y. Wu, X.-X. Xu, B.-C. Hu, H.-W. Liang, Y. Lin, L.-F. Chen and S.-H. Yu, Angew. Chem., Int. Ed., 2015, 54, 8179–8183 CrossRef CAS PubMed.
- H.-F. Li, F. Wu, C. Wang, P.-X. Zhang, H.-Y. Hu, N. Xie, M. Pan, Z. Zeng, S. Deng, M. H. Wu, K. Vinodgopal and G.-P. Dai, Nanomaterials, 2018, 8, 700 CrossRef PubMed.
- J. Nørskov and T. Bligaard, J. Electrochem. Soc., 2005, 152, J23 CrossRef.
- J. Liu, J. Phys. Chem. C, 2015, 119, 28417–28423 CrossRef CAS.
- F. Wang, L. Hu, R. Liu, H. Yang, T. Xiong, Y. Mao, M. S. Balogun, G. Ouyang and Y. Tong, J. Mater. Chem. A, 2019, 7, 11150–11159 RSC.
- X. Wang, S. Fei, S. Huang, C. Wu, J. Zhao, Z. Chen, K. Uvdal and Z. Hu, Carbon, 2019, 150, 363–370 CrossRef CAS.
- Y. Wang, Y. Zhu, S. Afshar, M. W. Woo, J. Tang, T. Williams, B. Kong, D. Zhao, H. Wang and C. Selomulya, Nanoscale, 2019, 11, 3500–3505 RSC.
Footnote |
| † Electronic supplementary information (ESI) available. See DOI: 10.1039/d1tc01022k |
| This journal is © The Royal Society of Chemistry 2021 |

