
Chemical tuning of molecular quantum materials κ-[(BEDT-TTF)1−x(BEDT-STF)x]2Cu2(CN)3: from the Mott-insulating quantum spin liquid to metallic Fermi liquid
Yohei
Saito
a,
Roland
Rösslhuber
 a,
Anja
Löhle
a,
Miriam
Sanz Alonso
a,
Maxim
Wenzel
a,
Atsushi
Kawamoto
b,
Andrej
Pustogow
ac and
Martin
Dressel
*a
a,
Anja
Löhle
a,
Miriam
Sanz Alonso
a,
Maxim
Wenzel
a,
Atsushi
Kawamoto
b,
Andrej
Pustogow
ac and
Martin
Dressel
*a
a1. Physikalisches Institut, Universität Stuttgart, Pfaffenwaldring 57, D-70569 Stuttgart, Germany. E-mail: dressel@pi1.physik.uni-stuttgart.de; Fax: +49 711 68564886; Tel: +49 711 68564946
bDepartment of Physics, Graduate School of Science, Hokkaido University, Sapporo 060-0810, Japan. E-mail: atkawa@phys.sci.hokudai.ac.jp; Fax: +81 11 706 4926; Tel: +81 11 706 4423
cInstitut für Festkörperphysik, Technische Universität Wien, Wiedner Hautptstr. 8-10, A-1040 Wien, Austria. E-mail: pustogow@ifp.tuwien.ac.at; Fax: +43 1 58 801 13199; Tel: +43 1 58 801 13128
First published on 2nd June 2021
Abstract
The electronic properties of molecular conductors can be readily varied via physical or chemical pressure as it enlarges the bandwidth W. This enables them to cross the Mott insulator-to-metal phase transition by reducing electronic correlations U/W. Here we introduce an alternative path by spatially expanding the molecular orbitals when partially replacing sulfur by selenium in the constituting bis-(ethylenedithio)-tetrathiafulvalene (BEDT-TTF) molecules of the title compound. We characterize how the insulating quantum-spin-liquid state is tuned via a Mott transition to the metallic Fermi-liquid state crossing a narrow region of superconductivity. The transport, dielectric, and optical measurements reveal that at this first-order phase transition, metallic regions coexist in the insulating matrix leading to pronounced percolative effects, which are most obvious in the strong enhancement of the dielectric constant at low temperatures.
1 Introduction
Materials with novel and exciting properties rarely emerge by chance; commonly it takes a long struggle and joint effort of a dedicated group, such as the Molecular Nanoscience and Organic Materials Research Unit (NANOMOL) at the Institut de Ciència de Materials de Barcelona (ICMAB-CSIC), led by Jaume Veciana and Concepció Rovira. Their focus is on molecule-based compounds because these materials are particularly versatile and specific at the same time; their methods of production are well understood and scalable, except when single crystals are required; where available, organic materials outscore inorganic compounds quickly. The research tasks are distributed among the team of synthetic chemists responsible for the creation of novel products and materials, experimental and theoretical solid-state physicists necessary for exploration and understanding the behavior, and materials scientists for optimizing the properties in the view of possible applications. This concept worked successfully for half a century, but can it be prolonged as molecular quantum materials shift into the focus of future research and applications?About five years ago, the notion of “Quantum Materials” became popular, evidenced, for example, by editorials and special issues of Nature Physics and Nature Materials.1–7 These compounds exhibit either strong electronic interactions where often some type of electronic order occurs, such as superconductivity, magnetism, density waves, or their electronic properties are determined by non-generic quantum effects, such as topological insulators and Dirac and Weyl electron systems. In prototypical strongly correlated materials, such as heavy fermions or transition metal compounds, f- and d-electrons with their rather narrow bands govern the electronic properties. Often the Fermi surface is very complex and multiple bands compete. Materials composed of organic molecules, on the other side, are characterized by delocalized π-electrons that are distributed over the extended molecule. In most cases, only one electronic band cuts the Fermi energy, leading to rather simple Fermi surfaces. By now, organic conductors are recognized as versatile molecular quantum materials, which exhibit numerous exciting and unprecedented features.8 In comparison to inorganic compounds, it is cleaner and easier to tune molecular conductors by chemical and physical means, hence they are well established as model compounds for the investigation of several fundamental problems. Eventually, these molecular compounds might bring quantum materials and their emergent phenomena to our daily life.
In the following, we will present an outstanding example of tuning a molecular quantum material. By chemical substitution in the organic molecule, the molecular transfer integrals are extended resulting in larger wave function overlap (sketched at top of Fig. 1). This is the most direct way to vary the electronic bandwidth and, hence, to diminish the effect of electronic correlations; the Mott insulator eventually becomes a Fermi liquid. Along this avenue, we can elucidate the fundamental nature of the Mott insulator-metal transition (IMT) that has remained the subject of controversy and debate for decades. Early theories9–11 favored a robust first-order scenario but apart from hysteresis effects, it has been proven difficult to identify conclusive experimental evidence for the expected phase-coexistence region.12–17 Alternative viewpoints envision a more continuous crossover at finite temperatures featuring aspects of quantum criticality.18–21 Recently, quantum-spin-liquid candidates have been recognized as the best suited materials for studying the pristine Mott state in the absence of a magnetic order,22 and its low-temperature transition to a Fermi liquid.21
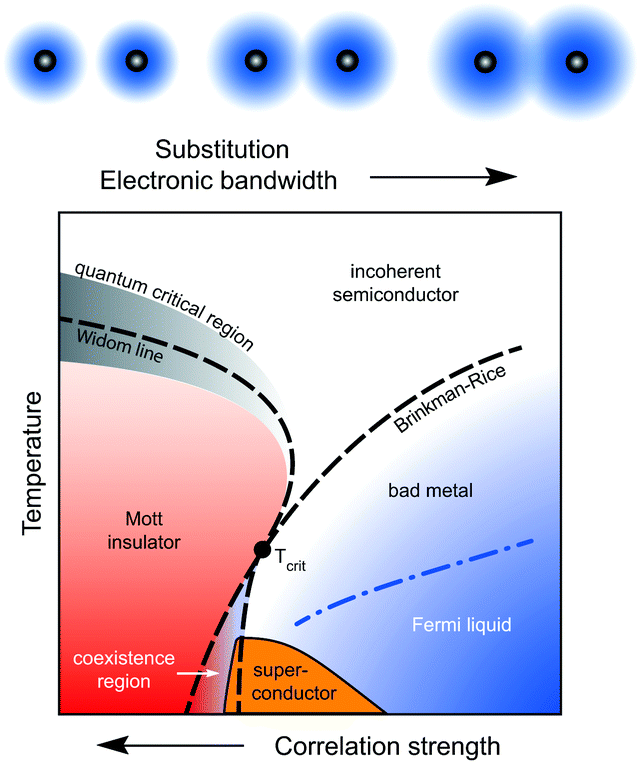 | ||
| Fig. 1 Upon increasing the molecular orbitals via chemical substitution (upper sketches) the electronic wavefunction overlap t ∝ W increases. The enlarged bandwidth W reduces the effect of electronic correlations U/W (U is the on-site Coulomb interaction). For a fully frustrated system with no magnetic order, dynamical mean-field theory predicts a first-order transition from a paramagnetic Mott insulator to a correlated metal up to a critical endpoint Tcrit (main frame).10 The range, where metallic and insulating phases coexist, gives rise to unprecedented phenomena that have shifted into the focus only very recently. Above that, a fan-shaped quantum-critical regime associated with the quantum Widom line is expected at higher temperatures.19,23 The metallic state is confined by the Brinkman–Rice temperature,24,25 identified by a maximum in ρ(T); the coherent Fermi-liquid regime occurs at lower temperatures. When thermal fluctuations exceed the bandwidth W and interaction strength U, semiconducting behavior prevails; neither a gap nor a quasiparticle peak is stabilized. A series of studies on the quantum-spin-liquid candidate κ-(BEDT-TTF)2Cu2(CN)3 provided experimental and theoretical confirmation of this scenario.21,22,26–29 | ||
Since most molecular solids are rather soft, their electronic properties can readily be tuned by a relatively low hydrostatic pressure.30–34 Nevertheless, many experiments become cumbersome, inaccurate or even impossible when confined to pressure cells, hence alternative methods are desirable. In the case of charge-transfer salts, reducing the size of anions acts like chemical pressure that brings the organic donor molecules closer together. This approach is frequently applied to quasi-one-dimensional TMTTF or quasi-two-dimensional BEDT-TTF salts.30–33,35 Already in the 1970s it has been realized by Bechgaard and others that replacing sulfur by selenium in the fulvalene-type central unit TTF increases the orbital overlap of adjacent molecules and thus the bandwidth, eventually leading to superconductivity in (TMTSF)2PF6.36Fig. 1 displays a generic phase diagram of an electron system with a half-filled conduction band subjected to strong electron–electron interactions. When the effect of electronic correlations increases, the metal turns into a Mott insulator. A superconducting phase is often observed around metal–insulator transitions and quantum critical points. This may be related to the fact that quasiparticles constituting a Fermi liquid are on the verge of destruction.
Here, we apply this approach to quasi-two-dimensional BEDT-TTF salts, where we replace two out of the four inner sulfur atoms by selenium as depicted in Fig. 2(a), resulting in BEDT-STF, in contrast to the so-called BETS molecule (BEDT-TSF, bis-ethylene-dithio-tetraselenafulvalene) which contains four selenium atoms in the fulvalene unit.39 While κ-(BEDT-TTF)2Cu2(CN)3 is a Mott insulator, considered as the most promising realization of a quantum spin liquid,17 κ-(BEDT-STF)2Cu2(CN)3 is a good conductor in the entire temperature regime. Performing the substitution on the donor molecules ensures that the polymeric anion network and the crystal symmetry remain unaffected, which is crucial for highly frustrated compounds. By this way, we can cross the Mott transition from a paramagnetic insulator – potentially a quantum spin liquid – to a paramagnetic metal, without any indications of a magnetic order down to lowest temperatures. Despite the similarities, this approach is distinct from the incremental substitution previously used in the case of κ-(BEDT-TTF)2Cu[N(CN)2]BrxCl1−x, where the antiferromagnetic Mott insulator κ-(BEDT-TTF)2Cu[N(CN)2]Cl is turned into the metallic superconductor κ-(BEDT-TTF)2Cu[N(CN)2]Br by chemical pressure.40–42
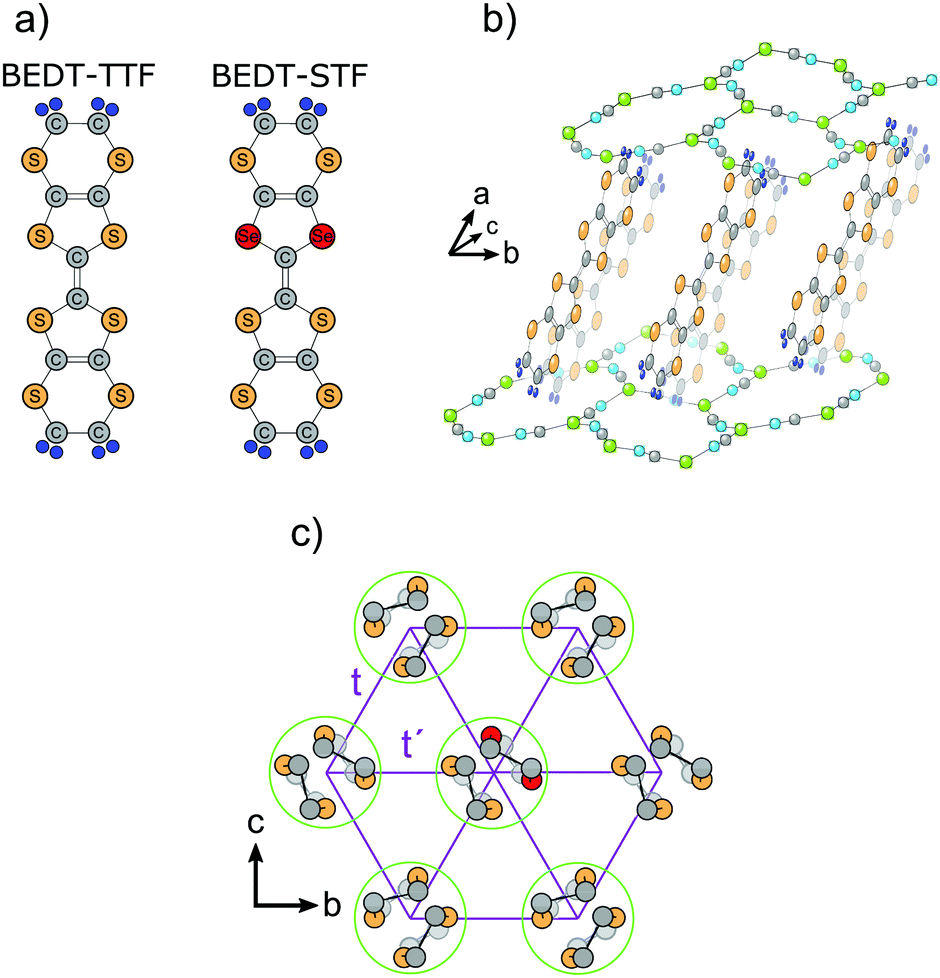 | ||
| Fig. 2 (a) Organic donor molecules bis-(ethylenedithio)-tetrathiafulvalene, called BEDT-TTF and bis-(ethylenedithio)-diseleniumdithiafulvalene, abbreviated BEDT-STF. In the latter case, two sulfur atoms of the inner rings are replaced by selenium. (b) The crystal structure contains dimers of the donor molecules forming layers in the bc-plane which are separated by the Cu2(CN)3 anion sheets. (c) The dimers are arranged in a triangular pattern with transfer integrals t′/t = 0.83 close to complete frustration. The STF-substitution, which is randomly distributed in space, leads to a local extension of the transfer integrals due to the larger molecular orbitals. | ||
In the present study, we focus on the electronic properties and investigate the coexistence regime at the first-order phase transition by transport, optical and dielectric methods. We observe a divergency in the permittivity as the hallmark of a percolative transition; in other words, we prove the insulator–metal phase coexistence below the critical endpoint Tcrit ≈15–20 K.
2 Experimental details
Single crystals of κ-[(BEDT-TTF)1−x(BEDT-STF)x]2Cu2(CN)3 with various stoichiometry (x = 0, 0.04, 0.1, 0.12, 0.16, 0.19, 0.21, 0.25, 0.28, 0.44, 0.78 and 1) were prepared at Hokkaido University in Sapporo following the standard procedure of electrochemical oxidation.43 The size of the single crystals rarely exceeds 2 mm, and typical samples used for the present study range from 250 to 500 μm in lateral dimensions and 20 to 100 μm in thickness. For the alloying series, the number of donor molecules, BEDT-TTF and BEDT-STF, was preselected. For each batch the actual substitution value x was determined a posteriori by energy-dispersive X-ray spectroscopy and using κ-(BEDT-TTF)2Cu2(CN)3 as a reference we compared the intensity of S atoms to that of Se atoms.44The structure consists of bc layers of strongly dimerized BEDT-TTF or BEDT-STF molecules, with each dimer oriented approximately perpendicular to its nearest neighbors (Fig. 2). Overall, it is assumed that the compounds crystallize in the monoclinic and centrosymmetric P21/c space group. Based on an X-ray study of the parent compound, Foury-Leylekian et al. recently suggested a triclinic symmetry P![[1 with combining macron]](https://www.rsc.org/images/entities/char_0031_0304.gif) with two non-equivalent dimers in the unit cell;38 however, the charge imbalance among the sites is minuscule. Upon sulfur substitution, the unit-cell volume slightly increases (less than 2%) in a linear fashion without any change in symmetry. In Table 1 we list the unit cell parameters for the limiting cases, assuming both, P21/c and P space group symmetry.
with two non-equivalent dimers in the unit cell;38 however, the charge imbalance among the sites is minuscule. Upon sulfur substitution, the unit-cell volume slightly increases (less than 2%) in a linear fashion without any change in symmetry. In Table 1 we list the unit cell parameters for the limiting cases, assuming both, P21/c and P space group symmetry.
for the analysis of the X-ray scattering results. Data for the former compound are taken from studies by Pinterić et al.37 and Foury-Leylekian et al.38
| κ-(BEDT-TTF)2Cu2(CN)3 | κ-(BEDT-STF)2Cu2(CN)3 | |||
|---|---|---|---|---|
| P21/c |
P |
P21/c |
P |
|
| a | 16.0920(4) Å | 16.1221(10) Å | 16.2965(8) Å | 16.5625(8) Å |
| b | 8.5813(2) Å | 8.591(6) Å | 8.6082(5) Å | 8.6292(3) Å |
| c | 13.3904(4) Å | 13.412(8) Å | 13.3985(6) Å | 13.4025(5) Å |
| α | 90° | 89.99(2)° | 90° | 90.00° |
| β | 113.381(3)° | 113.43(2)° | 113.1300(16)° | 115.0115(14)° |
| γ | 90° | 90.01(2)° | 90° | 90.00° |
| V | 1697.25 Å3 | 1704.46 Å3 | 1728.5 Å3 | 1735.87 Å3 |
| Z | 2 | 2 | 2 | 2 |
Electrical transport was measured parallel to the crystallographic c-axis using a standard four-probe technique, cooling from room temperature down to T = 1.8 K. The contacts were made from thin gold wires attached using carbon paste. Furthermore, we measured the complex electrical impedance as a function of temperature and frequency in order to obtain the dielectric permittivity ![[small epsilon, Greek, circumflex]](https://www.rsc.org/images/entities/i_char_e107.gif) = ε1 + iε2. Here, gold wires were attached to opposite crystal surfaces and the data were recorded using an impedance analyzer in the frequency range from f = 40 Hz to 10 MHz covering temperatures down to T = 5 K. The applied ac voltage was set to 0.5 V, making sure that we operate in the Ohmic regime.27
= ε1 + iε2. Here, gold wires were attached to opposite crystal surfaces and the data were recorded using an impedance analyzer in the frequency range from f = 40 Hz to 10 MHz covering temperatures down to T = 5 K. The applied ac voltage was set to 0.5 V, making sure that we operate in the Ohmic regime.27
The optical properties of several single crystals have been studied by reflectivity measurements using standard Fourier-transform spectroscopy from the far-infrared up to the near-infrared and visible range.45 The light was polarized along the two principal optical axes, i.e. E‖b and E‖c, on the as-grown surfaces. Besides regular in-plane experiments, we also probed the polarization perpendicular to the conducting planes, a direction which couples to the most charge-sensitive infrared-active intramolecular vibrational mode ν27(b1u). The sample was cooled down to T = 10 K by using a helium-cooled optical cryostat. In addition, the high-frequency properties (up to 35![[thin space (1/6-em)]](https://www.rsc.org/images/entities/char_2009.gif) 000 cm−1) were determined by spectroscopic ellipsometry under ambient conditions. The optical conductivity was calculated via Kramers–Kronig analysis using a constant reflectivity extrapolation at low frequencies and temperatures for the Mott insulators, while a Hagen-Rubens behavior was assumed for elevated temperatures and substitution values of x > 0.12 where metallic properties prevail.46,47
000 cm−1) were determined by spectroscopic ellipsometry under ambient conditions. The optical conductivity was calculated via Kramers–Kronig analysis using a constant reflectivity extrapolation at low frequencies and temperatures for the Mott insulators, while a Hagen-Rubens behavior was assumed for elevated temperatures and substitution values of x > 0.12 where metallic properties prevail.46,47
3 DC transport
Fig. 3 displays the c-axis dc resistivity ρ(T) as a function of temperature for all samples in our substitution series from x = 0 to 1. The room-temperature values increase from approximately 0.03 Ω cm for x = 1 to around 1 Ω cm for x = 0. For x = 0.12 and higher the systems turn metallic at low temperatures; the temperature range of metallic conductivity increases for larger substitution and exceeds T = 300 K for x ≥ 0.44. No hysteresis is observed in ρ(T) confirming previous reports. The quantum Widom line indicates the crossover from the more-metallic to the more-insulating regime and is defined as the inflection point of log{ρ} as a function of substitution or pressure.22 The maximum in ρ(T) defines the Brinkman–Rice temperature TBR that increases upon alloying.24,25,27,29 For very low temperatures, the metallic properties are clearly characterized by a ρ(T) ∝ T2 behavior, which is the hallmark of electron–electron interaction. A detailed analysis of the Fermi-liquid properties and the crossover to the bad metallic regime is provided elsewhere.29 Also the superconducting state that can be identified for x = 0.10 and 0.12 will be the subject of a separate publication48 where we compare it to similar observations of the pristine κ-(BEDT-TTF)2Cu2(CN)3 under pressure.17,21,43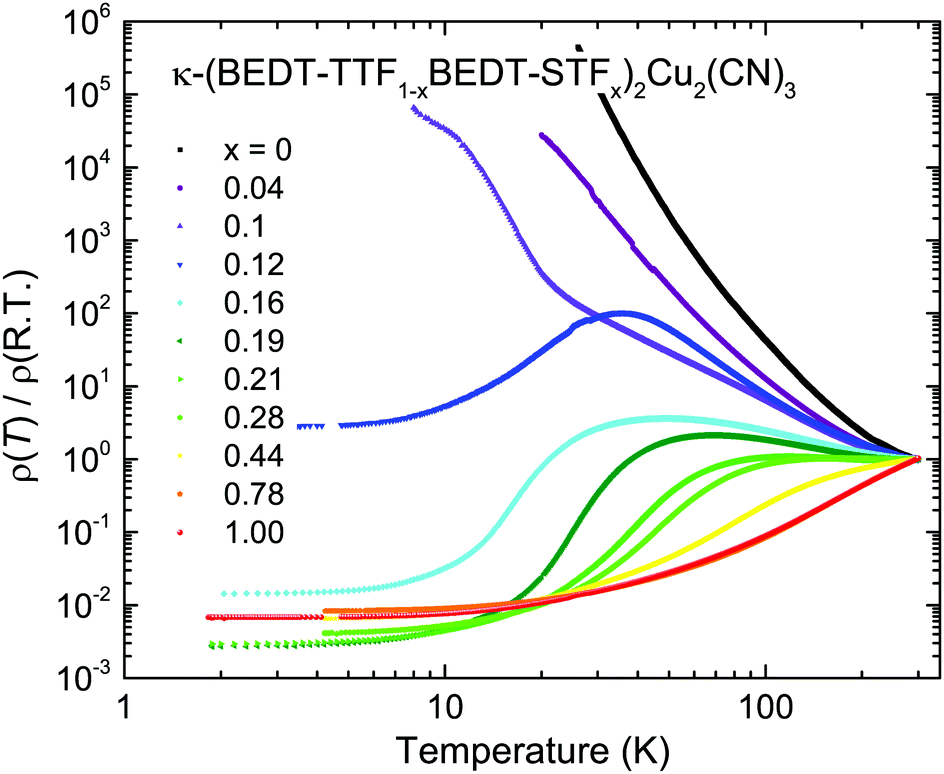 | ||
| Fig. 3 DC resistivity of κ-[(BEDT-TTF)1−x(BEDT-STF)x]2Cu2(CN)3 for various substitution values x measured as a function of temperature along the highly conducting c-axis and normalized to the room-temperature values. The substitution spans the full range from the insulating x = 0 to the metallic side. | ||
4 Optical properties
The in-plane optical conductivity σ1(ω) of κ-[(BEDT-TTF)1−x(BEDT-STF)x]2Cu2(CN)3 is shown in Fig. 4 for crystals of varying substitution values 0 ≤ x ≤ 1. The data are measured for the in-plane directions E‖b and E‖c from room temperature down to T = 5 K. The properties are rather similar for both polarizations indicating electronically isotropic behavior within the bc-plane.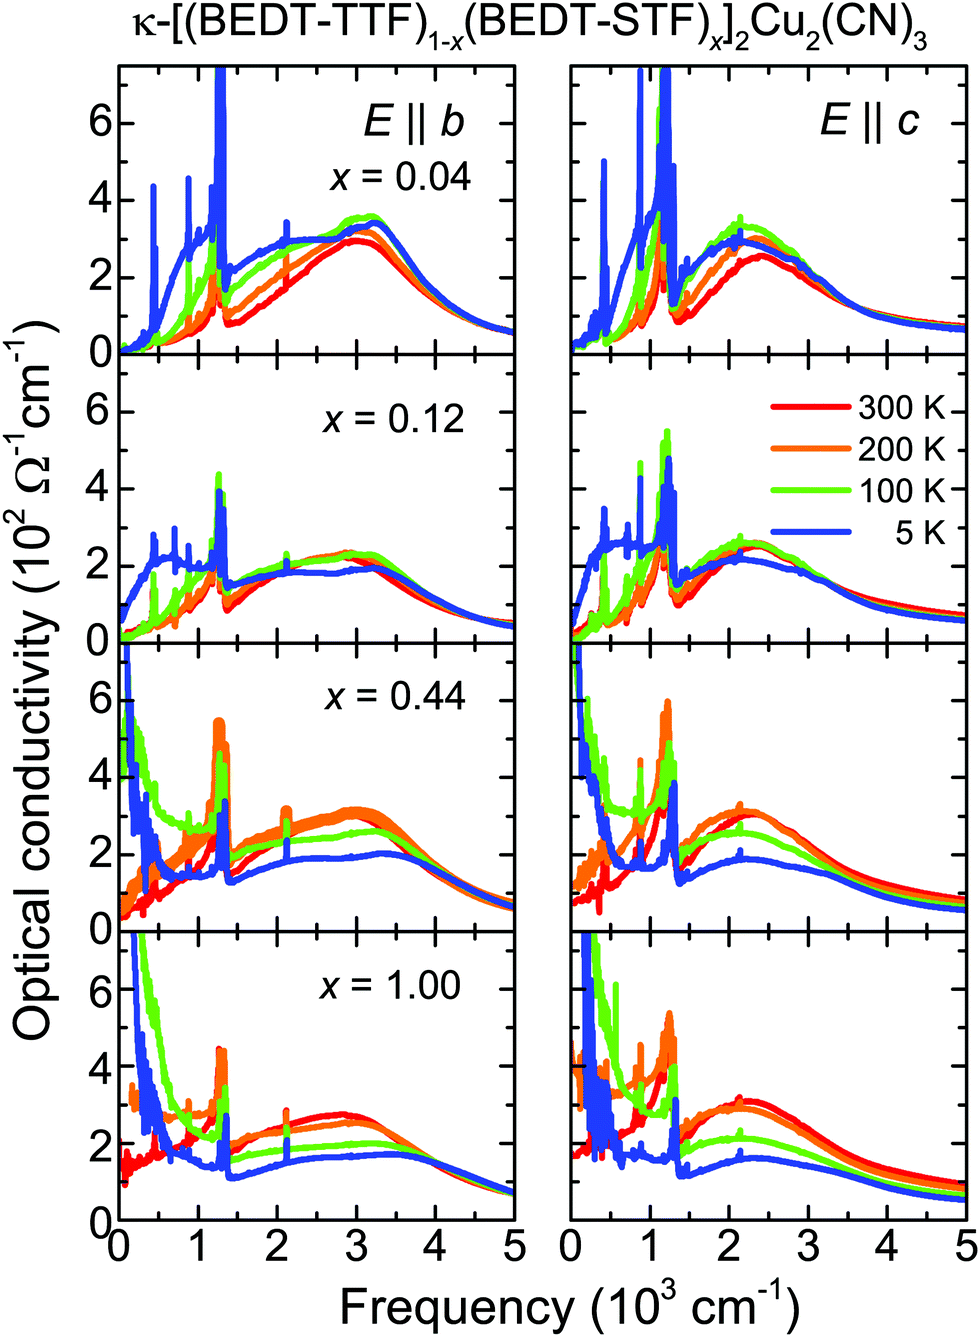 | ||
| Fig. 4 Frequency dependent conductivity of κ-[(BEDT-TTF)1−x(BEDT-STF)x]2Cu2(CN)3 for several substitution values x = 0.04, 0.12, 0.44, and x = 1 recorded for the two polarizations within the plane (left column E‖b; right column E‖c) at different temperatures as indicated in the legend. | ||
For BEDT-STF substitutions, x < 0.1, the compounds remain insulating at all temperatures; but no Mott gap develops upon cooling. In contrast, similar to the pristine crystals,22,46,49 a pronounced in-gap absorption is present that becomes enhanced as T is reduced or x increases. In these cases we enter the coexistence regime of metallic and insulating regions expected for first-order phase transitions; the increasing metallic fraction increasingly contributes to the optical properties. Eventually, the alloys exhibit a Drude-like contribution to the optical conductivity, indicating the metallic properties in accordance with the dc results presented in Fig. 3. An extended Drude analysis of the optical conductivity and an in-detail discussion of the temperature and frequency dependence of the scattering rate are presented elsewhere.29
In Fig. 4 we also see that the mid-infrared peak consists of two contributions: intra-dimer excitations and transitions between the lower and the upper Hubbard bands, which almost coincide when probed along the c-axis. This has been observed in most κ-phase BEDT-TTF compounds and confirmed by ab initio calculations.40,41,46,50–52 We focus on the low-temperature spectra (T = 5 K, E‖c) where we assign the maximum of the mid-infrared peak to the transitions between the lower and the upper Hubbard bands separated by U. The half-width of the conductivity band in σ1(ω) corresponds to the electronic bandwidth W, as illustrated in the inset of Fig. 5.53
 | ||
| Fig. 5 Dependence of the electronic repulsion U (open diamonds), the bandwidth W (open squares), and the effective Coulomb interaction U/W (red solid dots, right axis) on the substitution x in κ-[(BEDT-TTF)1−x(BEDT-STF)x]2Cu2(CN)3 as determined from low-temperature optical conductivity. The inset explains the estimation of U from the mid-infrared maximum in σ1(ω) and W from the half-width at half maximum. The three sketches above illustrate how the substitution x gradually tunes κ-(BEDT-TTF)2Cu2(CN)3 to κ-(BEDT-STF)2Cu2(CN)3; the lines of increasing thickness indicate the enhancement of transfer integrals t (solid blue), t′ (dashed blue) and td (dotted black). | ||
The electronic repulsion U slightly increases as a function of STF-substitution x due to the larger intra-dimer overlap td as the orbitals extend further. From Fig. 5 we see that the increase of the bandwidth W is even more pronounced, resulting from the increase of the transfer integrals t and t′ between adjacent dimers. Most importantly, however, the ratio U/W – as it measures the effect of correlations – decreases with increasing x, providing evidence that the metallic compound κ-(BEDT-STF)2Cu2(CN)3 is much less correlated compared to the Mott insulator κ-(BEDT-TTF)2Cu2(CN)3. Fig. 5 shows that the variation is far from linear; a dramatic decrease of U/W is found for x < 0.2, while for larger x, the ratio saturates around U/W ≈ 1.3. Overall, from these optical experiments, the Mott insulator-to-metal transition can be located around x ≈ 0.1 in agreement with the dc resistivity.
5 Vibrational spectroscopy
By now, it is well established that most of the dimerized BEDT-TTF salts, such as κ-(BEDT-TTF)2Cu[N(CN)2]Cl, κ-(BEDT-TTF)2Cu2(CN)3, or κ-(BEDT-TTF)2Ag2(CN)3 do not possess sizeable charge disproportionation within the dimers,47,54,55 with a few exceptions, like κ-(BEDT-TTF)2Hg(SCN)2Cl.56–58 Raman and infrared spectroscopies are the best suited tools to locally probe the charge per molecule by inspecting the intramolecular vibrations that are known to be extremely sensitive to the amount of charge residing on the molecule.45,59–61 Here we addressed the question of whether charge imbalance occurs when sulfur is replaced by selenium in the alloys κ-[(BEDT-TTF)1−x(BEDT-STF)x]2Cu2(CN)3.To this end, we recorded the optical properties perpendicular to the planes. In Fig. 6 the out-of-plane conductivity of κ-(BEDT-TTF)2Cu2(CN)3 is compared to that of κ-(BEDT-STF)2Cu2(CN)3 in the finger-print spectral region where the most charge-sensitive molecular vibrations of the central C![[double bond, length as m-dash]](https://www.rsc.org/images/entities/char_e001.gif) C occur.
C occur.
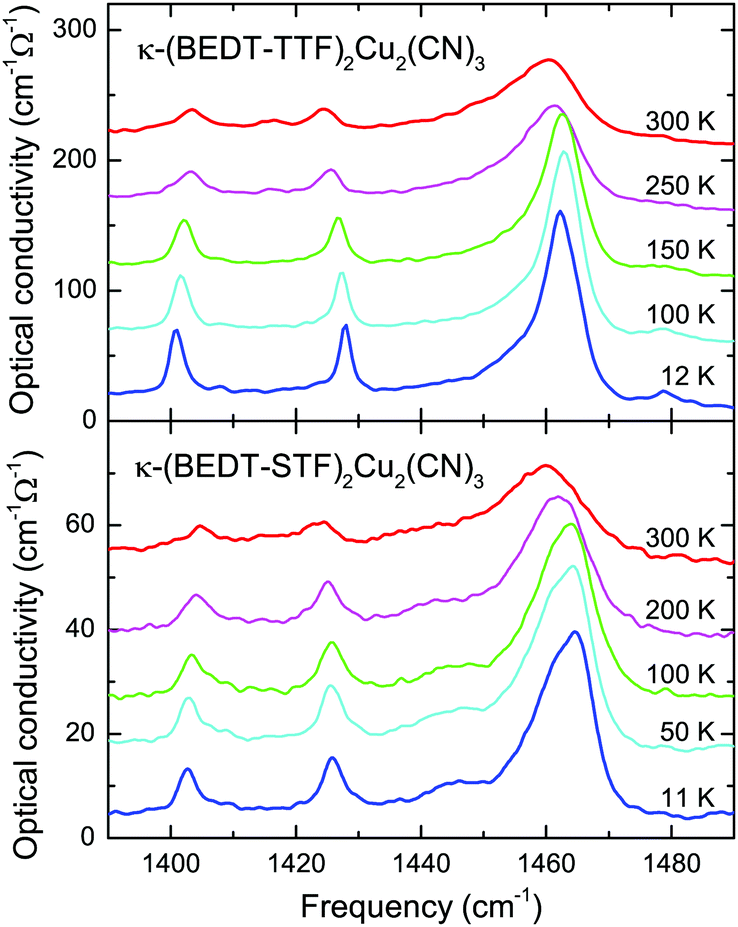 | ||
| Fig. 6 Optical conductivity of κ-(BEDT-TTF)2Cu2(CN)3 and κ-(BEDT-STF)2Cu2(CN)3 recorded for the out-of-plane polarization E‖a. The curves for the different temperatures are displaced for clarity reasons. The strong CC vibrational mode ν27(B1u) around 1460 cm−1 sharpens upon cooling but does not exhibit any severe modifications or splitting, as expected if strong charge disproportionation would occur. The data for κ-(BEDT-TTF)2Cu2(CN)3 were discussed previously.47 | ||
The dominant mode ν27(B1u) alters only slightly upon STF-substitution. If we focus on the limiting cases x = 0 and x = 1, we see that both compounds exhibit basically the same temperature dependence; a typical sharpening and slight hardening upon cooling. This behavior is explained by the fact that the sulfur/selenium atoms in the pentagonal inner ring are basically not involved in these modes. It can best be seen from the vibrational analysis and animations62 that these vibrations are well confined to the CC bonds. Most importantly, since we do not observe any pronounced mode splitting in the κ-[(BEDT-TTF)1−x(BEDT-STF)x]2Cu2(CN)3 series, we conclude the absence of any significant charge imbalance among the donor molecules.
6 Dielectric properties
The metal–insulator transition is commonly defined by the change in conductivity, which can be probed by dc transport, dielectric or optical measurements. Equally, in some cases even more sensitive, however, are the dielectric properties, i.e. the dielectric constant. The low-frequency ε1 is positive for an insulator and negative values indicate a metallic response. Along this line, we have analyzed the measured reflectivity spectra and obtained the complex dielectric permittivity(ω, T, x) as a function of frequency, temperature and substitution by using the Kramers–Kronig transformation.63Fig. 7 shows the real part ε1(ω) for the different κ-[(BEDT-TTF)1−x(BEDT-STF)x]2Cu2(CN)3 crystals recorded at the lowest temperature T = 5 K. In the Mott-insulating state (x ≤ 0.1), the dielectric constant is basically frequency-independent and acquires a small, positive value. With increasing values of substitution, x, the quasi-static permittivity ε1(ω → 0) first increases before it rapidly reduces to large negative values. After crossing the Mott insulator-to-metal transition, the system becomes conductive; the strong screening of the coherent quasiparticles drives ε1 negative. A similar observation was reported for the Mott transition of VO2, where the low-frequency permittivity diverges as a function of temperature. Near-field optical microscopy revealed that this behavior stems from the phase coexistence of metallic puddles in an insulating matrix.64
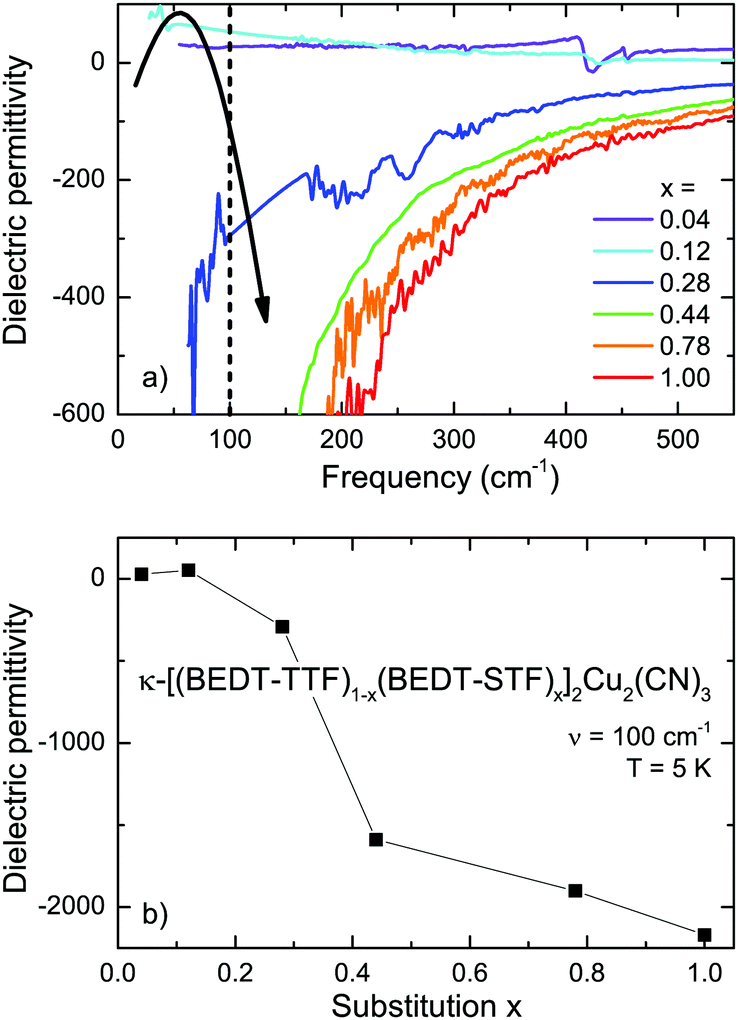 | ||
| Fig. 7 Despite continuously increasing conductivity, in the low-frequency limit, the dielectric permittivity ε1(x) exhibits a peak around the Mott transition, reminiscent of a percolative-type coexistence of metallic and insulating regions. Panel (a) displays the real part of the dielectric permittivity ε1(x) as obtained from far-infrared reflectivity measurements for E‖c at T = 5 K for κ-[(BEDT-TTF)1−x(BEDT-STF)x]2Cu2(CN)3 with various substitutions, x, as indicated. To better follow the substitutional dependence, panel (b) displays the dielectric permittivity taken at ν = ω/2πc = 100 cm−1 indicated by the dashed line in panel (a). | ||
In general, the divergency of the dielectric permittivity ε1(x) is a hallmark of percolative phase transitions in microemulsions,65–69 composites70–72 or and percolating metal films.73–77
Since audio- and radio-frequency experiments are more suitable for exploring the dielectric behavior at the insulator–metal transition, we have conducted dielectric experiments down to 7.5 kHz. Fig. 8 summarizes the dielectric response of κ-(BEDT-TTF)2Cu2(CN)3 and how it is affected by moving across the Mott IMT via STF-substitution. We plot the real part of the permittivity ε1 as a function of temperature T for selected frequencies f and substitution values, x, as indicated. The pronounced peak dominating the temperature dependence of ε1(T) in the insulating state (x ≤ 0.1) was discovered by Abdel-Jawad et al.78 and subsequently confirmed by other groups.28,37,55,79,80 When probed at f = 7.5 kHz, the maximum is observed around T = 30 K in the case of κ-(BEDT-TTF)2Cu2(CN)3 [Fig. 8(a)], with a slight sample-to-sample dependence, in agreement with previous reports. The peak shifts to higher temperatures as the frequency increases and at the same time, however, it gets less pronounced. This behavior resembles the well-known phenomenology of relaxor ferroelectrics.81
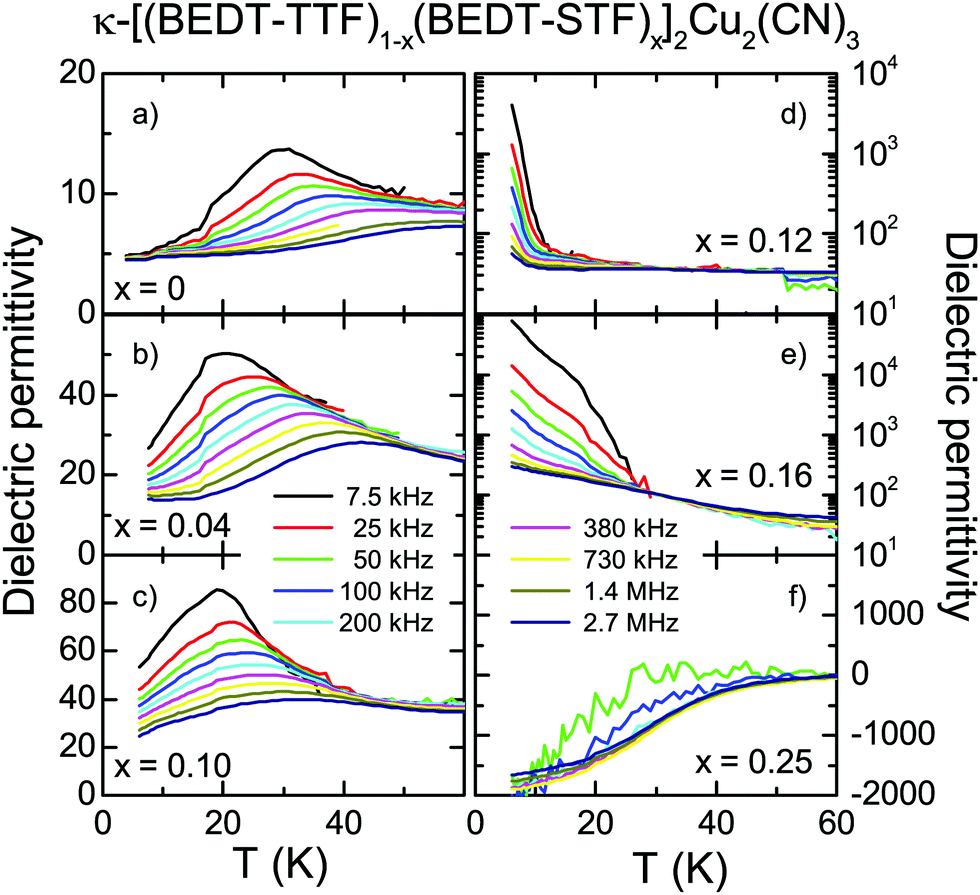 | ||
| Fig. 8 The dielectric permittivity of κ-[(BEDT-TTF)1−x(BEDT-STF)x]2Cu2(CN)3 is shown for substitutions x = 0, 0.04, 0.10, 0.12, 0.16 and 0.25 as a function of temperature for different frequencies. (a–c) A relaxor–ferroelectric response is observed for the insulating compounds (x ≤ 0.10) below T = 50 K. Upon reducing the measurement frequency, the feature becomes more pronounced and shifts to lower temperatures. On approaching x = 0.10, ε1(T) is strongly enhanced up to 105 and the peak moves to lower temperatures. (d and e) As a result of coexistence of spatially separated metallic and insulating regions at the IMT, ε1 reaches values of 105, with a pronounced frequency dependence. (f) Well above the percolation threshold, from x > 0.2 up to x = 1, the dielectric constant acquires negative values for x > 0.2 as the sample turns metallic. Note the different ordinates of the various panels. | ||
Already the minimal substitutions of x = 0.04 and 0.1 have enhanced the dielectric permittivity significantly with the maximum ε1(f = 7.5 kHz) ≈ 50 and 80. This strong increase of ε1(T) and the concomitant shift of the peak to lower temperatures when we approach the IMT are in full accordance with our pressure-dependent dielectric studies,28 where an extensive and detailed analysis is given. As we approach the phase transition further (x = 0.12 and 0.16), the dielectric constant drastically diverges, reaching values up to 105 in the static low-temperature limit. A divergency in ε1(x) is the fingerprint of a percolative phase transition where metallic regions form in an insulating matrix.9,82,83 When crossing the percolation threshold, the system acts like a metal, characterized by a negative dielectric permittivity, ε1 < 0. With an increase in x the sign change of the dielectric constant traces the Brinkman–Rice temperature, as it was identified by the maximum in ρ(T) (Fig. 1 and 3).27 These results confirm the observations we extracted from the optical response in Fig. 7.
In order to illustrate the evolution of the low-frequency (f = 100 kHz) dielectric properties with increasing substitution x, in Fig. 9 we plot the permittivity ε1(T) and conductivity σ1(T) of κ-[(BEDT-TTF)1−x(BEDT-STF)x]2Cu2(CN)3 as a function of temperature for the example of E‖a. While the optical conductivity monotonously increases with substitution, the low-temperature dielectric constant ε1(x) first increases up to x = 0.16 before it decreases to a negative value when the metallic regions percolate. The use of a logarithmic scale underlines that the behavior is much stronger compared to the optical response plotted in Fig. 7. The comparison of the dielectric permittivity in the optical and radio-frequency regimes (Fig. 7 and 9) makes unambiguously clear that closing of the Mott gap has a minor effect on the dielectric properties while the effects of phase coexistence and percolation dominate.
 | ||
| Fig. 9 Temperature dependence of the dielectric properties of κ-[(BEDT-TTF)1−x(BEDT-STF)x]2Cu2(CN)3 probed at f = 100 kHz and for various substitution levels x as indicated. (a) Upon increasing x, a strong enhancement in ε1(T) is observed below 30 K, shifting to higher temperatures as x increases. (b) Simultaneously, the conductivity σ1(T) increases by several orders of magnitude. At x = 0.25 a decrease in ε1(T) to negative values indicates a purely metallic behavior. Note the logarithmic scale. | ||
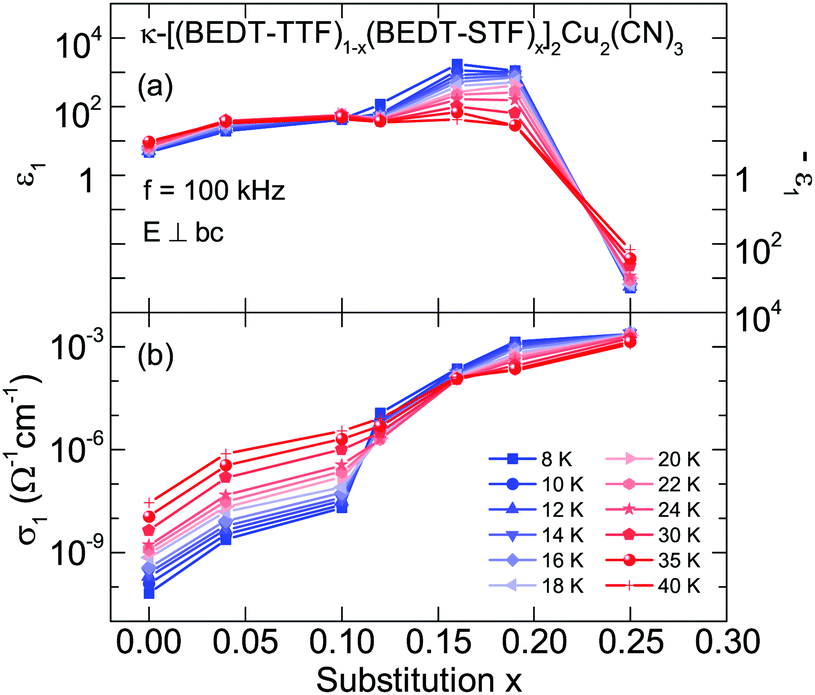 | ||
| Fig. 10 Dielectric properties of κ-[(BEDT-TTF)1−x(BEDT-STF)x]2Cu2(CN)3 in dependence of the substitution level x, recorded perpendicular to the bc-plane at a fixed frequency f = 100 kHz at different temperatures as indicated. Note the logarithmic scales. (a) The permittivity ε1(x) forms a pronounced maximum followed by a rapid decrease to negative values, corresponding to the right scale. (b) The conductivity σ1(x) exhibits a step-like increase at x = 0.12, indicating the Mott transition. The observed behavior matches the signature of a percolating system. At the IMT, the nucleation and growth of metallic puddles sets in, which are spatially separated in an insulating matrix. Upon increasing x, the metallic filling fraction grows until the metallic state is completely established at x = 0.25. With an increasing temperature, the features diminish in amplitude and step size, respectively, consistent with the change from the first-order IMT to the crossover region at elevated temperatures. | ||
For better comparison, we plot ε1(x) and σ1(x) for the complete series κ-[(BEDT-TTF)1−x(BEDT-STF)x]2Cu2(CN)3 in Fig. 10 measured at various temperatures T. Increasing the STF-content results in a strong enhancement of the dielectric constant up to 103, whereas for x = 0.25 a decrease to large negative values of the order of ε1(x) ≈ −103 is observed. Concurrently, σ1(x) increases by several orders of magnitude: the rapid decrease at x ≈ 0.12 indicates the crossing of the phase boundary into the metallic regime.
7 Discussion and conclusions
In a complementary study28 the dielectric properties of κ-(BEDT-TTF)2Cu2(CN)3 have been measured as a function of hydrostatic pressure. This is an alternative way to shift the Mott insulator through the first-order phase transition until the Fermi-liquid state is reached above p≈1 kbar. The behavior observed by the pressure-dependent investigations is in full accordance with the dielectric response observed here in the substitutional series; both can be well described using dynamical mean-field theory on the single-band Hubbard model when combined with percolation theory.27The fact that both approaches reach very much the same results provides firm evidence for a percolative Mott transition. Substituting BEDT-STF molecules increases the intra- and inter-dimer transfer integrals on a local scale, but this effect is smeared out. Local strain does not alter the crystal symmetry; the substitution results in a slightly larger unit cell as seen from Table 1. Since the organic molecules are rather large, diffusion within the crystal is prohibited, ruling out the formation of BEDT-STF clusters or domains of extended size beyond the stochastic occurrence. As depicted in Fig. 5, STF-substitution results in a gradual decrease of effective correlation strength U/W.
Our findings are summarized in Fig. 11 where the dielectric permittivity ε1 is plotted as a function of temperature and STF-substitution x producing a contour plot that constitutes the corresponding phase diagram. We conclude that the discovery of the enormous divergency in the low-temperature quasi-static dielectric permittivity ε1(x) indicates that metallic regions coexist with the insulating matrix. The reduction of electronic interactions U/W due to increasing x leads to a spatial phase separation that is confined to temperatures below the critical endpoint Tcrit ≈ 15–20 K. With an increasing metallic fraction, the resistivity decreases, as can be well understood by effective medium models.84 At large substitutions, metallic fluctuations dominate the electronic response. This range is well distinct by the negative and very large permittivity; its boundary trails the Brinkman–Rice temperature for the onset of metallic conductivity. The complete electrodynamical properties of this correlated electron system including the percolative aspect of the first-order Mott transition can be reproduced by the hybrid approach of dynamical mean-field theory amended with percolation theory.27 Finally, we would like to point out that the novel path of tuning the effective correlations by increasing the molecular orbitals when partially replacing BEDT-TTF by the selenium-containing BEDT-STF molecules can be applied to other charge-transfer salts as well, providing an interesting alternative to physical pressure and chemical modification of the anions.
 | ||
| Fig. 11 Contour plot of the dielectric permittivity ε1 recorded at f = 380 kHz as a function of temperature and STF-substitution, x. We observe a strong increase of ε1 up to 2500, centered around x = 0.15–0.2 and below T ≈ 15–20 K, close to the first-order Mott transition. We ascribe this to the phase coexistence around the first-order Mott transition hosting spatially separated metallic and insulating regions, in agreement with state-of-the-art dynamical-mean-field-theory.19,27 See text for more details. | ||
Author contributions
M. D. and A. P. guided and conceived the experimental work. Crystals were grown and characterized by Y. S. and A. K. Dc transport measurements were performed by A. L. and Y. S. Dielectric spectroscopy was carried out by M. W. and R. R. Optical experiments were conducted by M. S. A. and A. P., and supported by Y. S.; M. D., A. P. and R. R. analyzed the results and wrote the paper with contributions from all authors.Conflicts of interest
There are no conflicts to declare.Acknowledgements
We acknowledge support by the Deutsche Forschungsgemeinschaft (DFG) and the Alexander von Humboldt Foundation.References
- Editorial, Nat. Phys., 2016, 12, 105 Search PubMed.
- B. Keimer and J. E. More, Nat. Phys., 2017, 13, 1045–1055 Search PubMed.
- N. Samarth, Nat. Mater., 2017, 16, 1068–1076 Search PubMed.
- D. N. Basov, R. D. Averitt and D. Hsieh, Nat. Mater., 2017, 16, 1077–1088 Search PubMed.
- Y. Tokura, M. Kawasaki and N. Nagaosa, Nat. Phys., 2017, 13, 1056–1068 Search PubMed.
- K. A. Moler, Nat. Mater., 2017, 16, 1049–1052 Search PubMed.
- N. Gedik and I. Vishik, Nat. Phys., 2017, 13, 1029–1033 Search PubMed.
- M. Dressel and S. Tomić, Adv. Phys., 2020, 69, 1–120 Search PubMed.
- N. Mott, Metal–Insulator Transitions, 2nd edn, Taylor & Francis, 1990 Search PubMed.
- A. Georges, G. Kotliar, W. Krauth and M. J. Rozenberg, Rev. Mod. Phys., 1996, 68, 13–125 Search PubMed.
- D. Vollhardt, Ann. Phys., 2012, 524, 1–19 Search PubMed.
- M. Imada, A. Fujimori and Y. Tokura, Rev. Mod. Phys., 1998, 70, 1039–1263 Search PubMed.
- S. Lefebvre, P. Wzietek, S. Brown, C. Bourbonnais, D. Jérome, C. Mézière, M. Fourmigué and P. Batail, Phys. Rev. Lett., 2000, 85, 5420–5423 Search PubMed.
- P. Limelette, P. Wzietek, S. Florens, A. Georges, T. A. Costi, C. Pasquier, D. Jérome, C. Mézière and P. Batail, Phys. Rev. Lett., 2003, 91, 016401 Search PubMed.
- P. Limelette, A. Georges, D. Jérome, P. Wzietek, P. Metcalf and J. M. Honig, Science, 2003, 302, 89–92 Search PubMed.
- F. Kagawa, T. Itou, K. Miyagawa and K. Kanoda, Phys. Rev. B: Condens. Matter Mater. Phys., 2004, 69, 64511 Search PubMed.
- Y. Kurosaki, Y. Shimizu, K. Miyagawa, K. Kanoda and G. Saito, Phys. Rev. Lett., 2005, 95, 177001 Search PubMed.
- T. Senthil, Phys. Rev. B: Condens. Matter Mater. Phys., 2008, 78, 045109 Search PubMed.
- J. Vučičević, H. Terletska, D. Tanasković and V. Dobrosavljević, Phys. Rev. B: Condens. Matter Mater. Phys., 2013, 88, 75143 Search PubMed.
- T. Furukawa, K. Miyagawa, H. Tanigchi, R. Kato and K. Kanoda, Nat. Phys., 2015, 11, 221–224 Search PubMed.
- T. Furukawa, K. Kobashi, Y. Kurosaki, K. Miyagawa and K. Kanoda, Nat. Commun., 2018, 9, 307 Search PubMed.
- A. Pustogow, M. Bories, A. Löhle, R. Rösslhuber, E. Zhukova, B. Gorshunov, S. Tomić, J. A. Schlueter, R. Hübner, T. Hiramatsu, Y. Yoshida, G. Saito, R. Kato, T.-H. Lee, V. Dobrosavljević, S. Fratini and M. Dressel, Nat. Mater., 2018, 17, 773–777 Search PubMed.
- H. Terletska, J. Vučičević, D. Tanasković and V. Dobrosavljević, Phys. Rev. Lett., 2011, 107, 026401 Search PubMed.
- M. M. Radonjić, D. Tanasković, V. Dobrosavljević, K. Haule and G. Kotliar, Phys. Rev. B: Condens. Matter Mater. Phys., 2012, 85, 85133 Search PubMed.
- X. Deng, J. Mravlje, R. Žitko, M. Ferrero, G. Kotliar and A. Georges, Phys. Rev. Lett., 2013, 110, 086401 Search PubMed.
- A. Pustogow, Y. Saito, E. Zhukova, B. Gorshunov, R. Kato, T.-H. Lee, S. Fratini, V. Dobrosavljević and M. Dressel, Phys. Rev. Lett., 2018, 121, 056402 Search PubMed.
- A. Pustogow, R. Rösslhuber, Y. Tan, E. Uykur, A. Böhme, M. Wenzel, Y. Saito, A. Löhle, R. Hübner, A. Kawamoto, J. A. Schlueter, V. Dobrosavljević and M. Dressel, npj Quantum Mater., 2021, 6, 9 Search PubMed.
- R. Rösslhuber, A. Pustogow, E. Uykur, A. Böhme, A. Löhle, R. Hübner, J. Schlueter, Y. Tan, V. Dobrosavljević and M. Dressel, Phys. Rev. B: Condens. Matter Mater. Phys., 2021, 103, 125111 Search PubMed.
- A. Pustogow, Y. Saito, A. Löhle, M. S. Alonso, A. Kawamoto, V. Dobrosavljević, M. Dressel and S. Fratini, Nat. Commun., 2021, 12, 1571 Search PubMed.
- T. Ishiguro, K. Yamaji and G. Saito, Organic superconductors, 2nd edn, Springer-Verlag, Berlin, 1998 Search PubMed.
- N. Toyota, M. Lang and J. Müller, Low-Dimensional Molecular Metals, Springer-Verlag, Berlin, 2007 Search PubMed.
- The physics of organic superconductors and conductors, ed. A. Lebed, Springer-Verlag, Berlin, 2008 Search PubMed.
- T. Mori, Electronic Properties of Organic Conductors, Springer, Tokyo, 2016 Search PubMed.
- S. Yasuzuka and K. Murata, Sci. Techn. Adv. Mater., 2009, 10, 024307 Search PubMed.
- TTF Chemistry, ed. J. Yamada and T. Sugimoto, Springer-Verlag, Berlin, 2004 Search PubMed.
- D. Jérome, A. Mazaud, M. Ribault and K. Bechgaard, J. Phys. (Paris) Lett., 1980, 41, L95–L98 Search PubMed.
- M. Pinterić, M. Čulo, O. Milat, M. Basletić, B. Korin-Hamzić, E. Tafra, A. Hamzić, T. Ivek, T. Peterseim, K. Miyagawa, K. Kanoda, J. A. Schlueter, M. Dressel and S. Tomić, Phys. Rev. B: Condens. Matter Mater. Phys., 2014, 90, 195139 Search PubMed.
- P. Foury-Leylekian, V. Ilakovac, V. Balédent, P. Fertey, A. Arakcheeva, O. Milat, D. Petermann, G. Guillier, K. Miyagawa, K. Kanoda, P. Alemany, E. Canadell, S. Tomić and J.-P. Pouget, Crystals, 2018, 8, 158 Search PubMed.
- H. Kobayashi, H. Cui and A. Kobayashi, Chem. Rev., 2004, 104, 5265–5288 Search PubMed.
- D. Faltermeier, J. Barz, M. Dumm, M. Dressel, N. Drichko, B. Petrov, V. Semkin, R. Vlasova, C. Meźière and P. Batail, Phys. Rev. B: Condens. Matter Mater. Phys., 2007, 76, 165113 Search PubMed.
- M. Dumm, D. Faltermeier, N. Drichko, M. Dressel, C. Mézière and P. Batail, Phys. Rev. B: Condens. Matter Mater. Phys., 2009, 79, 195106 Search PubMed.
- S. Yasin, M. Dumm, B. Salameh, P. Batail, C. Meźière and M. Dressel, Eur. Phys. J. B, 2011, 79, 383–390 Search PubMed.
- U. Geiser, H. H. Wang, K. D. Carlson, J. M. Williams, H. A. Charlier, J. E. Heindl, G. A. Yaconi, B. J. Love, M. W. Lathrop, J. E. Schirber, D. Overmyer, J. Ren and M.-H. Whangbo, Inorg. Chem., 1991, 30, 2586–2588 Search PubMed.
- Y. Saito, T. Minamidate, A. Kawamoto, N. Matsunaga and K. Nomura, Phys. Rev. B, 2018, 98, 205141 Search PubMed.
- M. Dressel and N. Drichko, Chem. Rev., 2004, 104, 5689 Search PubMed.
- S. Elsässer, D. Wu, M. Dressel and J. A. Schlueter, Phys. Rev. B: Condens. Matter Mater. Phys., 2012, 86, 155150 Search PubMed.
- K. Sedlmeier, S. Elsässer, D. Neubauer, R. Beyer, D. Wu, T. Ivek, S. Tomić, J. A. Schlueter and M. Dressel, Phys. Rev. B: Condens. Matter Mater. Phys., 2012, 86, 245103 Search PubMed.
- Y. Saito, A. Löhle, A. Kawamoto, A. Pustogow and M. Dressel, will be published in Crystals.
- I. Kézsmárki, Y. Shimizu, G. Mihály, Y. Tokura, K. Kanoda and G. Saito, Phys. Rev. B: Condens. Matter Mater. Phys., 2006, 74, 201101 Search PubMed.
- J. Merino, M. Dumm, N. Drichko, M. Dressel and R. H. McKenzie, Phys. Rev. Lett., 2008, 100, 086404 Search PubMed.
- M. Dressel, D. Faltermeier, M. Dumm, N. Drichko, B. Petrov, V. Semkin, R. Vlasova, C. Méziere and P. Batail, Phys. B, 2009, 404, 541–544 Search PubMed.
- J. Ferber, K. Foyevtsova, H. O. Jeschke and R. Valentí, Phys. Rev. B: Condens. Matter Mater. Phys., 2014, 89, 205106 Search PubMed.
- Due to the metallic contribution at low frequencies, we determined the bandwidth W from the high-frequency half-width at half maximum of the Hubbard bands as sketched in the inset of Fig. 5. As a matter of course, the resulting Mott–Hubbard band parameters of κ-(BEDT-TTF)2Cu2(CN)3 are slightly different than those obtained previously.22 The qualitative behavior, however, is unaffected by the particular procedure.
- M. Pinterić, P. Lazić, A. Pustogow, T. Ivek, M. Kuveždić, O. Milat, B. Gumhalter, M. Basletić, M. Čulo, B. Korin-Hamzić, A. Löhle, R. Hübner, M. Sanz Alonso, T. Hiramatsu, Y. Yoshida, G. Saito, M. Dressel and S. Tomić, Phys. Rev. B, 2016, 94, 161105 Search PubMed.
- S. Tomić and M. Dressel, Rep. Prog. Phys., 2015, 78, 096501 Search PubMed.
- N. Drichko, R. Beyer, E. Rose, M. Dressel, J. A. Schlueter, S. A. Turunova, E. I. Zhilyaeva and R. N. Lyubovskaya, Phys. Rev. B: Condens. Matter Mater. Phys., 2014, 89, 075133 Search PubMed.
- A. Löhle, E. Rose, S. Singh, R. Beyer, E. Tafra, T. Ivek, E. I. Zhilyaeva, R. N. Lyubovskaya and M. Dressel, J. Phys.: Condens. Matter, 2016, 29, 055601 Search PubMed.
- T. Ivek, R. Beyer, S. Badalov, M. C. Čulo, S. Tomić, J. A. Schlueter, E. I. Zhilyaeva, R. N. Lyubovskaya and M. Dressel, Phys. Rev. B, 2017, 96, 085116 Search PubMed.
- T. Yamamoto, M. Uruichi, K. Yamamoto, K. Yakushi, A. Kawamoto and H. Taniguchi, J. Phys. Chem. B, 2005, 109, 15226–15235 Search PubMed.
- A. Girlando, J. Phys. Chem. C, 2011, 115, 19371–19378 Search PubMed.
- A. Girlando, M. Masino, S. Kaiser, Y. Sun, N. Drichko, M. Dressel and H. Mori, Phys. Status Solidi B, 2012, 249, 953–956 Search PubMed.
- M. Dressel, P. Lazić, A. Pustogow, E. Zhukova, B. Gorshunov, J. A. Schlueter, O. Milat, B. Gumhalter and S. Tomić, Phys. Rev. B, 2016, 93, 081201 Search PubMed.
- M. Dressel and G. Grüner, Electrodynamics of solids, Cambridge University Press, Cambridge, 2002 Search PubMed.
- M. M. Qazilbash, M. Brehm, B.-G. Chae, P.-C. Ho, G. O. Andreev, B.-J. Kim, S. J. Yun, A. V. Balatsky, M. B. Maple, F. Keilmann, H.-T. Kim and D. N. Basov, Science, 2007, 318, 1750–1753 Search PubMed.
- D. M. Grannan, J. C. Garland and D. B. Tanner, Phys. Rev. Lett., 1981, 46, 375–378 Search PubMed.
- M. A. van Dijk, G. Casteleijn, J. G. H. Joosten and Y. K. Levine, J. Chem. Phys., 1986, 85, 626–631 Search PubMed.
- M. T. Clarkson and S. I. Smedley, Phys. Rev. A: At., Mol., Opt. Phys., 1988, 37, 2070–2078 Search PubMed.
- M. T. Clarkson, Phys. Rev. A: At., Mol., Opt. Phys., 1988, 37, 2079–2090 Search PubMed.
- Y. Alexandrov, N. Kozlovich, Y. Feldman and J. Texter, J. Chem. Phys., 1999, 111, 7023–7028 Search PubMed.
- C. Pecharromán and J. S. Moya, Adv. Mater., 2000, 12, 294–297 Search PubMed.
- C. Pecharromán, F. Esteban-Betegón, J. F. Bartolomé, S. López-Esteban and J. S. Moya, Adv. Mater., 2001, 13, 1541–1544 Search PubMed.
- C.-W. Nan, Y. Shen and J. Ma, Annu. Rev. Mater. Res., 2010, 40, 131–151 Search PubMed.
- S. Berthier, J. Peiro, S. Fagnent and P. Gadenne, Phys. A, 1997, 241, 1–5 Search PubMed.
- M. Hövel, B. Gompf and M. Dressel, Phys. Rev. B: Condens. Matter Mater. Phys., 2010, 81, 035402 Search PubMed.
- M. Hövel, B. Gompf and M. Dressel, Thin Solid Films, 2011, 519, 2955–2958 Search PubMed.
- S. De Zuani, T. Peterseim, A. Berrier, B. Gompf and M. Dressel, Appl. Phys. Lett., 2014, 104, 241109 Search PubMed.
- S. De Zuani, M. Rommel, B. Gompf, A. Berrier, J. Weis and M. Dressel, ACS Photonics, 2016, 3, 1109–1115 Search PubMed.
- M. Abdel-Jawad, I. Terasaki, T. Sasaki, N. Yoneyama, N. Kobayashi, Y. Uesu and C. Hotta, Phys. Rev. B: Condens. Matter Mater. Phys., 2010, 82, 125119 Search PubMed.
- M. Pinterić, T. Ivek, M. Čulo, O. Milat, M. Basletić, B. Korin-Hamzić, E. Tafra, A. Hamzić, M. Dressel and S. Tomić, Phys. B, 2015, 460, 202–207 Search PubMed.
- S. Sasaki, S. Iguchi, N. Yoneyama and T. Sasaki, J. Phys. Soc. Jpn., 2015, 84, 074709 Search PubMed.
- L. E. Cross, Relaxor Ferroelectrics, Springer-Verlag, Berlin, Heidelberg, 2008, pp. 131–155 Search PubMed.
- S. Kirkpatrick, Rev. Mod. Phys., 1973, 45, 574–588 Search PubMed.
- A. L. Efros and B. I. Shklovskii, Phys. Status Solidi B, 1976, 76, 475–485 Search PubMed.
- T. C. Choy, Effective Medium Theory: Principles and Applications, 2nd edn, Oxford University Press, Oxford, 2015 Search PubMed.
| This journal is © The Royal Society of Chemistry 2021 |