 Open Access Article
Ag2ZnSnS4–ZnS core–shell colloidal quantum dots: a near-infrared luminescent material based on environmentally friendly elements†
Avijit
Saha
 a and
Gerasimos
Konstantatos
*ab
aICFO-Institut de Ciencies Fotoniques, The Barcelona Institute of Science and Technology, 08860 Castelldefels (Barcelona), Spain. E-mail: gerasimos.konstantatos@icfo.es
bICREA-Institució Catalana de Recerca i Estudis Avancats, Passeig Lluís Companys 23, 08010 Barcelona, Spain
First published on 6th April 2021
Abstract
Low cost, multinary colloidal quantum dots (QDs) based on environmentally friendly elements, with bright, narrow-width, tunable near-infrared (NIR) luminescence are promising alternatives to Cd and Pb chalcogenide QDs for in vivo bio-imaging, LED and sensing applications. Herein, we demonstrate Pb/Cd free solution-processed colloidal luminescent Ag2ZnSnS4–ZnS (AZTS–ZnS) core–shell QDs with precise control over the ZnS shell thickness and thereby its optical properties. Unlike indium based multinary (I–III–VI group) core–shell QDs these nanocrystals show a narrow photoluminescence (PL) full width at half maximum (fwhm) of 105–110 meV in the first NIR window. By monitoring the starting AZTS core size, we achieve tunable emission over a small NIR window in these QDs with the best PL quantum yield (PLQY) of 17.4%.
Introduction
Microstructural engineering of colloidal QDs has given rise to an unprecedented class of emissive materials in the fields of display,1,2 bio-imaging3,4 and sensing,5 thanks to their tunable optical and high luminescence properties and excellent solution processability. Cd and Pb based chalcogenide materials are on the front line in this field of research. However, due to the presence of highly toxic heavy metals (Cd/Pb), the widespread industrial deployment of these materials has raised regulatory concerns. Consequently, there is an increased effort towards the development of heavy metal-free RoHS compliant low-cost luminescence phosphors as an alternative.6 As a result indium/gallium based III–V group QDs such as InAs, InSb, GaAs7–10 and I–III–VI group QDs such as CuIn(S/Se)2, AgIn(Se/Te)211–14 with NIR emission have attracted significant interest. Yet, the scarcity of indium/gallium in the Earth's crust may prevent their large-scale commercial adaptation. Silver chalcogenide nanocrystals such as Ag2S15 and Ag2Se3,16 also exhibit size dependent PL in the second NIR window, however, like the I–III–VI group QDs11 these QDs show broad PL spectra.Kesterite based materials (Ag,Cu)2ZnSn(S,Se)4 and Ag2ZnSn(S/Se)4 with a small band gap have shown NIR luminescence in films17,18 and QDs19,20 and could be a potential alternative in this field of research. The realization of the full potential of kesterite based QDs has been hindered due to underdeveloped synthetic approaches of solution-processed QDs and has not been explored as much as their bulk and thin film counterparts. Recently, environmentally friendly AZTS QDs have been reported to demonstrate size-dependent optical absorption and tunable NIR PL properties due to the quantum confinement effect.20 Unfortunately, like the indium based III–V core-only QDs, these QDs also suffer from low PLQY (<1%). This low PLQY is mainly due to (i) dangling bonds on the surface (ii) oxidation of surface cations that also affects the stability of the QDs and (iii) the antisite disorder present in kesterite materials,21–23 and all of the above lead to non-radiative recombination. A well-known strategy to improve the PLQY and stability is the growth of an epitaxial layer of a wider band gap semiconductor that removes the dangling bonds, corresponding defects from the core and protects its surface from oxidation while confining the electron and hole wavefunctions mostly inside the core favoring radiative recombination.24–26
ZnS or ZnSe could be a suitable material in the search for RoHS compliant shell materials. However, the lattice parameters and the band offsets (valence and conduction bands) of both the core and shell materials are crucial factors to form heterostructure QDs. While the lattice mismatch between the core and shell gives rise to interfacial strain resulting defects at the interface, which eventually limits the shell thickness, the band offsets positions determine the formation of the type of heterostructure interface that controls the confinement of electron and hole wavefunctions inside the heterostructure QDs.25 Here, we have chosen wurtzite ZnS as the shell matrix which has a moderate (6.7%) lattice mismatch with AZTS and forms a type-I core–shell heterostructure according to the bulk band structure of the materials.
Core–shell heterostructures of various binary and ternary QDs that emit NIR PL have been studied in the previous literature.6,9,10,12 However, core–shell heterostructures of quaternary QDs have rarely been explored27,28 due to synthetic impediments. Herein, we present the thiol free synthesis of bright tunable NIR luminescent AZTS–ZnS core–shell QDs with controlled growth of shell thickness. The PLQY was improved by optimizing the shell thickness while the emission energy was tuned over a small range in the first NIR window by the selection of different AZTS core sizes.
Experimental methods
Materials
Silver(I) acetate (AgOAc) 99.99%, tin(II) acetate (Sn(OAc)2), zinc(II) acetate, dihydrate (Zn(OAc)2, 2H2O), 98%, oleic acid (OA, 90%), 1-octadecene (ODE, 90%), sulfur powder (99.5%), and hexamethyldisilathiane (HMS) were purchased from Sigma Aldrich. Oleylamine (OLAM, 90%) was purchased from Acros Organics. All these chemicals were used without further purification. HMS is a toxic and malodorous colorless liquid, and must be handled using appropriate protective equipment to avoid physical contact, and should be stored in a dry and well-ventilated place. 0.2 molar sulfur stock solution was prepared by dissolving 64.1 mg (2 mmol) of S powder in 10 ml of dried ODE and stored in a degassed vial.![[thin space (1/6-em)]](https://www.rsc.org/images/entities/char_2009.gif) ×
× ![[thin space (1/6-em)]](https://www.rsc.org/images/entities/char_2009.gif) 10−10 mbar) equipped with a monochromatic Kα X-ray source (1486.74 eV). The pass energy value used was 10 eV for the high-resolution spectrum. The intensities were estimated by calculating the integral of each peak, determined by subtracting the Shirley-type background and fitting the experimental curve to a combination of Lorentzian and Gaussian lines of variable proportions. UPS measurements were carried out on a SPECS PHOIBOS 150 electron spectrometer using monochromated He I radiation (21.2 eV).
10−10 mbar) equipped with a monochromatic Kα X-ray source (1486.74 eV). The pass energy value used was 10 eV for the high-resolution spectrum. The intensities were estimated by calculating the integral of each peak, determined by subtracting the Shirley-type background and fitting the experimental curve to a combination of Lorentzian and Gaussian lines of variable proportions. UPS measurements were carried out on a SPECS PHOIBOS 150 electron spectrometer using monochromated He I radiation (21.2 eV).
Results and discussion
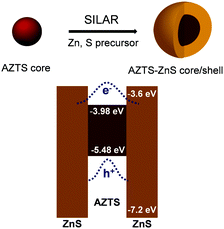
AZTS cores of different sizes were synthesized using a hot injection technique by modulating the reaction temperature and annealing time following our previous work.20 Following this, ZnS was overcoated using SILAR technique (Fig. 1). Though the brief method of synthesis is discussed in the Experimental methods, it is important to note that the initial shell growth (1st ZnS shell) was performed at a comparatively lower temperature (150 °C) to stop the growth of the core. We collected the samples after each Zn and S cycle with different thicknesses of ZnS overcoating, which is henceforth depicted as AZTS–nZnS where n is the number of Zn and S cycles. | ||
| Fig. 1 Schematic representation of synthesis and band alignment of the AZTS–ZnS core/shell heterostructure QDs. Band edge positions of AZTS were calculated from ultraviolet photoelectron spectroscopy (UPS) measurements and the absorption Tauc plot (Fig. S1, ESI†) while the ZnS band edge positions were adopted from the literature. | ||
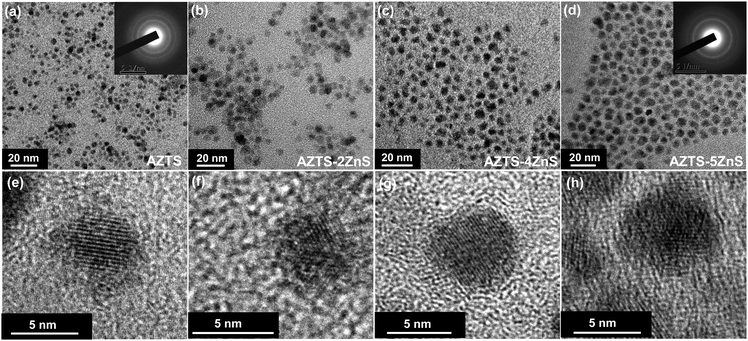
Fig. 2 shows the low magnification transmission electron microscopy (TEM) and high resolution TEM (HRTEM) images at various stages of ZnS growth of these QDs. AZTS core QDs shown in Fig. 2a have quasi-spherical morphology with an average size of 5.8 nm (±0.75). At HRTEM (Fig. 2e) the lattice fringes are visible in which the interplanar (011) distance is 0.31 Å. TEM size analysis (Fig. S2, ESI†) as a function of the growth of the ZnS matrix around the AZTS core ranges from the 5.8 ± 0.75 nm core (Fig. 2a and e) to 7 ± 0.70 nm, 8.5 ± 0.77 nm and 9.2 ± 0.80 nm for different AZTS–nZnS core–shell QDs (Fig. 2b–d and f–h) respectively. The HRTEM images and selected area electron diffraction (SAED) pattern (inset of Fig. 2a and d) for both AZTS and AZTS–nZnS QDs show that all these QDs are crystalline in nature.
However, using both TEM and HRTEM images the core and the shell part in these QDs cannot be conclusively distinguished as there is no drastic difference in the TEM contrast and lattice parameter between AZTS and ZnS. It is clear from the figure that the particles have a nearly spherical morphology with nearly uniform distribution of the nanocrystals with the injection of Zn and S cycle while annealing. The unaltered morphology, uniform growth of the QDs and the absence of any other separate size distribution suggests the formation of a ZnS shell on the AZTS core. The high quality of these nanocrystals observed from HRTEM images suggests the epitaxial growth of the ZnS shell.
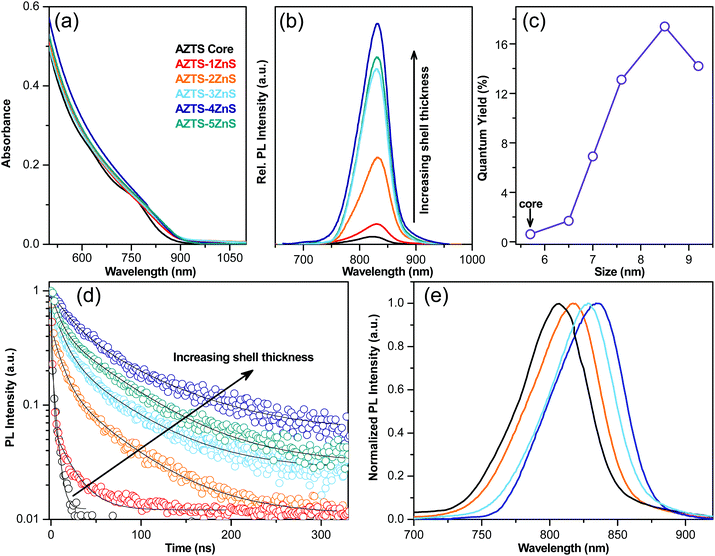
The optical properties of these core–shell QDs are characterised using UV-Vis absorption, steady state and time resolved PL studies. The qualitative difference in the nature of optical absorption with the ZnS shell growth was studied using absorption spectra as displayed in Fig. 3a. According to the bulk band structure AZTS–ZnS core–shells have a typical type-I semiconductor heterostructure as shown in Fig. 1. Therefore, along with the surface passivation the absorption spectra should not redshift with the formation of the ZnS shell. On the contrary, Fig. 3a shows that the AZTS core absorption spectra shift a little towards the longer wavelength with ZnS overcoating. The red shift in both absorption (Fig. 3a) and PL spectra (Fig. 3b) suggests the possibility of electron wavefunction spreading through the small energy barrier of the shell and formation of a slight quasi-type-II heterostructure as shown in Fig. 1. This kind of red shift due to the leakage of the electron wavefunction was previously observed in the literature.29–32
The evolution of the emission spectra of the QDs during the growth of the ZnS shell on the AZTS cores is shown in Fig. 3b. All these nanocrystals emit in the first NIR window. While the PLQY of the core AZTS was poor (∼0.6%), it improved with the growth of ZnS layer leading to an almost ∼30-fold increase of PLQY (17.4 ± 0.87%), in the case of AZTS–4ZnS as shown in Fig. 3b and c. Moreover, bare AZTS QDs have poor colloidal and optical stability, while AZTS–ZnS core–shell QDs retain both colloidal as well as PL stability for months as shown in Fig. S3 (ESI†). In addition to that, the PL linewidths (FWHM) of these QDs are significantly low (105–110 meV) and invariant to ZnS shell growth as depicted in Fig. S4 (ESI†). Notably, the PLQY decays down slowly with further growth of the ZnS shell as observed in the case of AZTS–5ZnS in Fig. 3b and c which might be due to the increase of interfacial strain29,33 and more importantly due to the spatial separation of excitons, as the electron gets delocalized in both the core and the shell part, while holes are localized inside the core. The extent of surface defects and the type of heterostructure was characterised by time resolved fluorescence spectroscopy at the emission maxima. The PL lifetime of AZTS core-only QDs is characterized by a multiexponential fast decay (Fig. 3d) due to the presence of surface defects, which act as nonradiative decay channels accelerating the PL lifetime resulting in poor PLQY. In Fig. 3d, PL decay curves are fitted with a bi-exponential fit, and the fitting components with the ZnS shell growth are tabulated in Table S1 (ESI†). With the growth of the ZnS shell the decay curves show an overall suppression of nonradiative fast components of the QD lifetime. However, most strikingly, the average lifetime increases from 1 ns to 57.5 ns due to the suppression of defects on the AZTS surface. To achieve tunability from these core–shell QDs with improved PLQY (>14%) we exploited the quantum confinement effect of AZTS core QDs as observed earlier.20 In different sets of reactions, we start with various sizes of the core (5.3 nm and 5.8 nm) to obtain various-sized AZTS–ZnS core–shell QDs emitting at different wavelengths over a small window in the NIR region as shown in Fig. 3e. However, the tunability was not observed over a wide range because similar to the other well-known quasi type-II core–shell systems (e.g. CdSe/CdS)2,34 the emission red shifts more with shell growth in the case of small sized QDs29 due to the larger band gap of the core as observed in Fig. S5 (ESI†).
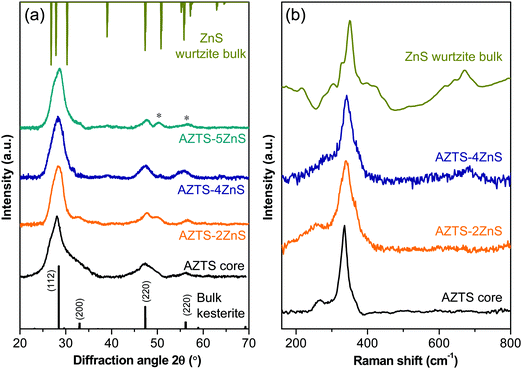
We now turn to the material characterization of the core–shell QDs. The crystal structure and compositional purity of the AZTS core and AZTS–ZnS core shell QDs have been studied using XRD and Raman spectroscopy. The evolution of the crystal structure during ZnS shell growth on AZTS is shown in Fig. 4a. Although, initially, with the growth of ZnS shell as in the case of AZTS–2ZnS, the XRD pattern looks very similar to AZTS, with further ZnS overcoating we observe the formation of wurtzite ZnS along with the AZTS diffraction peaks due to the existence of the core–shell structure. In addition to that, comparatively narrower and well-structured peaks in AZTS–ZnS core–shell QDs with respect to the AZTS core indicates the increase in the crystal domain size, which further supports the epitaxial shell growth. Fig. 4(b) shows the Raman spectra of the AZTS core and AZTS–nZnS core shell QDs with different shell thicknesses. The Raman spectra of AZTS QDs in Fig. 4b show peaks at 265 cm−1 and 334 cm−1 and are in good agreement with the vibrational mode of bulk AZTS (RRUFID: R061016) without any other secondary phase. However, a comparison with the bulk ZnS Raman spectra shows that with ZnS shell growth the 334 cm−1 peak shifts toward the right side (342 cm−1) indicating the formation of ZnS in the system.
 | ||
| Fig. 4 (a) XRD patterns and (b) Raman spectra of AZTS core QDs and AZTS–ZnS core–shell QDs with different shell thicknesses. The presence of separate ZnS diffraction peaks shown with * in (a). | ||
Energy-dispersive X-ray (EDX) spectroscopy elemental analysis from all these samples at different stages and the average sizes obtained from TEM have been tabulated in Table 1. As expected, the Zn percentage increases with the increase of average particle size indicating ZnS shell growth. However, EDX gives information from all over the particles under the probing area, so it cannot be conclusively determined that ZnS grows as a shell. We therefore performed X-ray photoelectron spectroscopy (XPS) as it is known to give information mostly from the surface of the nanocrystals, because of its small penetration depth, to study the surface elemental composition of these QDs. The high resolution XPS scan of all the constituent elements (Ag, Zn, Sn, S) showing a comparison between the AZTS core and the AZTS–ZnS core–shell is depicted in Fig. S6 (ESI†). The results from elemental analysis obtained from the ratio between the integrated intensity of all the elements are tabulated in Table S1 (ESI†). It is noteworthy that the AZTS QDs are cation rich/terminating as we use oleic acid as the ligand which bind with the surface cations. Now as XPS gives mostly surface information, the results from XPS (41.0%) slightly underestimate the S content in the AZTS core compared to EDX (46.2%) as depicted in Table 1. It is evident from the results that in the case of AZTS–4ZnS, the Zn and S amounts on the surface have increased from 1.37 (17.3%) to 2.04 (19.4%) in the case of Zn and from 3.25 (41.0%) to 4.88 (46.4%) in the case of S, while normalizing with respect to Sn indicating the formation of the ZnS shell on the AZTS core. In addition to that, a visual inspection of the overview of whole XPS spectra (Fig. S7, ESI†) for both AZTS and AZTS–4ZnS QDs shows a significant increase in Zn and S peaks supporting the core–shell formation.
| Sample | Avg. size (TEM) (nm) | Ag (%) | Zn (%) | Sn (%) | S (%) | |
|---|---|---|---|---|---|---|
| The values in brackets from XPS results represent the ratio of the elements after normalizing to Sn. | ||||||
| EDX | AZTS core | 5.8 | 26.1 | 13.9 | 12.8 | 46.2 |
| AZTS–2ZnS | 7.0 | 22.0 | 20.1 | 9.4 | 48.5 | |
| AZTS–3ZnS | 7.6 | 26.1 | 17.5 | 9.3 | 47.1 | |
| AZTS–4ZnS | 8.5 | 25.1 | 28.8 | 7.6 | 38.5 | |
| AZTS–5ZnS | 9.2 | 20.1 | 26.3 | 8.1 | 45.5 | |
| XPS | AZTS core | 5.8 | 29.1 (2.3) | 17.3 (1.37) | 12.6 (1) | 41.0 (3.25) |
| AZTS–4ZnS | 8.5 | 24.7 (2.6) | 19.4 (2.04) | 9.5 (1) | 46.4 (4.88) | |
Conclusions
In conclusion, the synthesis of environmentally friendly, low cost, NIR luminescent AZTS–ZnS core–shell heterostructure QDs and their photophysical properties have been introduced in this study. With the controlled growth of the ZnS shell, these core shell QDs show narrow width (105–110 meV), bright and tunable emission in the first biological window. The optical properties were tuned by controlling the shell thickness and exploiting the quantum confinement effect of the AZTS core. With the growth of the ZnS shell thickness, the absorption and PL emission shifts towards a longer wavelength depending on the core size due to the tunneling of excited electrons. Hence, a quasi-type-II nature of the carrier was observed from steady state and time resolved PL-dynamics. To the best of our knowledge, we demonstrate the first example of AZTS–ZnS core–shell QDs with tunable NIR luminescence and expand the material availability of environmentally friendly, bio- and RoHS-compatible colloidal QDs.Conflicts of interest
The authors declare no competing financial interest.Acknowledgements
The authors acknowledge the financial support from the European Research Council (ERC) under the European Union's Horizon 2020 research and innovation programme (grant agreement no. 725165), the Spanish Ministry of Economy and Competitiveness (MINECO), the ‘Fondo Europeo de Desarrollo Regional’ (FEDER) through grant TEC2017-88655-R and EQC2019-005797-P (AEI/FEDER UE). The authors also acknowledge the financial support from the program CERCA and from the Spanish Ministry of Economy and Competitiveness through the ‘Severo Ochoa’ Programme for Centres of Excellence in R&D.References
- Y.-H. Won, O. Cho, T. Kim, D.-Y. Chung, T. Kim, H. Chung, H. Jang, J. Lee, D. Kim and E. Jang, Nature, 2019, 575, 634–638 CrossRef CAS PubMed
.
- A. Saha, K. V. Chellappan, K. S. Narayan, J. Ghatak, R. Datta and R. Viswanatha, J. Phys. Chem. Lett., 2013, 4, 3544–3549 CrossRef CAS
.
- Y.-P. Gu, R. Cui, Z.-L. Zhang, Z.-X. Xie and D.-W. Pang, J. Am. Chem. Soc., 2012, 134, 79–82 CrossRef CAS PubMed
.
- T. Deng, Y. Peng, R. Zhang, J. Wang, J. Zhang, Y. Gu, D. Huang and D. Deng, ACS Appl. Mater. Interfaces, 2017, 9, 11405–11414 CrossRef CAS PubMed
.
- Y. Liu, Q. Guo, X. Qu and Q. Sun, ACS Appl. Mater. Interfaces, 2018, 10, 30662–30669 CrossRef CAS PubMed
.
- G. Xu, S. Zeng, B. Zhang, M. T. Swihart, K.-T. Yong and P. N. Prasad, Chem. Rev., 2016, 116, 12234–12327 CrossRef CAS PubMed
.
- M. Ginterseder, D. Franke, C. F. Perkinson, L. Wang, E. C. Hansen and M. G. Bawendi, J. Am. Chem. Soc., 2020, 142, 4088–4092 CrossRef CAS PubMed
.
- T. Zhao, N. Oh, D. Jishkariani, M. Zhang, H. Wang, N. Li, J. D. Lee, C. Zeng, M. Muduli, H.-J. Choi, D. Su, C. B. Murray and C. R. Kagan, J. Am. Chem. Soc., 2019, 141, 15145–15152 CrossRef CAS PubMed
.
- L. K. Sagar, G. Bappi, A. Johnston, B. Chen, P. Todorović, L. Levina, M. I. Saidaminov, F. P. García de Arquer, S. Hoogland and E. H. Sargent, Chem. Mater., 2020, 32, 2919–2925 CrossRef CAS
.
- J. P. Park, J.-j. Lee and S.-W. Kim, J. Am. Chem. Soc., 2016, 138, 16568–16571 CrossRef CAS PubMed
.
- A. C. Berends, M. J. J. Mangnus, C. Xia, F. T. Rabouw and C. de Mello Donega, J. Phys. Chem. Lett., 2019, 10, 1600–1616 CrossRef CAS PubMed
.
- T. Kameyama, H. Yamauchi, T. Yamamoto, T. Mizumaki, H. Yukawa, M. Yamamoto, S. Ikeda, T. Uematsu, Y. Baba, S. Kuwabata and T. Torimoto, ACS Appl. Nano Mater., 2020, 3, 3275–3287 CrossRef CAS
.
- T. Kameyama, Y. Ishigami, H. Yukawa, T. Shimada, Y. Baba, T. Ishikawa, S. Kuwabata and T. Torimoto, Nanoscale, 2016, 8, 5435–5440 RSC
.
- Y. Ma, Y. Zhang and W. W. Yu, J. Mater. Chem. C, 2019, 7, 13662–13679 RSC
.
- P. Jiang, Z.-Q. Tian, C.-N. Zhu, Z.-L. Zhang and D.-W. Pang, Chem. Mater., 2012, 24, 3–5 CrossRef CAS
.
- C.-N. Zhu, P. Jiang, Z.-L. Zhang, D.-L. Zhu, Z.-Q. Tian and D.-W. Pang, ACS Appl. Mater. Interfaces, 2013, 5, 1186–1189 CrossRef CAS PubMed
.
- T. Gershon, Y. S. Lee, P. Antunez, R. Mankad, S. Singh, D. Bishop, O. Gunawan, M. Hopstaken and R. Haight, Adv. Energy Mater., 2016, 6, 1502468 CrossRef
.
- T. Gershon, K. Sardashti, O. Gunawan, R. Mankad, S. Singh, Y. S. Lee, J. A. Ott, A. Kummel and R. Haight, Adv. Energy Mater., 2016, 6, 1601182 CrossRef
.
- A. Singh, S. Singh, S. Levcenko, T. Unold, F. Laffir and K. M. Ryan, Angew. Chem., Int. Ed., 2013, 52, 9120–9124 CrossRef CAS PubMed
.
- A. Saha, A. Figueroba and G. Konstantatos, Chem. Mater., 2020, 32, 2148–2155 CrossRef CAS
.
- D. Cherns, I. J. Griffiths, L. Jones, D. M. Bishop, M. A. Lloyd and B. E. McCandless, ACS Appl. Energy Mater., 2018, 1, 6260–6267 CrossRef
.
- N. A. Kattan, I. J. Griffiths, D. Cherns and D. J. Fermín, Nanoscale, 2016, 8, 14369–14373 RSC
.
- Z.-K. Yuan, S. Chen, H. Xiang, X.-G. Gong, A. Walsh, J.-S. Park, I. Repins and S.-H. Wei, Adv. Funct. Mater., 2015, 25, 6733–6743 CrossRef CAS
.
- P. Reiss, M. Protière and L. Li, Small, 2009, 5, 154–168 CrossRef CAS PubMed
.
- J. M. Pietryga, Y.-S. Park, J. Lim, A. F. Fidler, W. K. Bae, S. Brovelli and V. I. Klimov, Chem. Rev., 2016, 116, 10513–10622 CrossRef CAS PubMed
.
- A. Saha, S. Chattopadhyay, T. Shibata and R. Viswanatha, J. Mater. Chem. C, 2014, 2, 3868–3872 RSC
.
- A. Irkhina, S. Levcenko, L. Xie, K. Leifer and T. Unold, J. Mater. Chem. C, 2019, 7, 6129–6133 RSC
.
- J. Song, C. Ma, W. Zhang, X. Li, W. Zhang, R. Wu, X. Cheng, A. Ali, M. Yang, L. Zhu, R. Xia and X. Xu, ACS Appl. Mater. Interfaces, 2016, 8, 24826–24836 CrossRef CAS PubMed
.
- X. Peng, M. C. Schlamp, A. V. Kadavanich and A. P. Alivisatos, J. Am. Chem. Soc., 1997, 119, 7019–7029 CrossRef CAS
.
- G. S. Selopal, H. Zhao, Z. M. Wang and F. Rosei, Adv. Funct. Mater., 2020, 30, 1908762 CrossRef CAS
.
- K. P. Acharya, H. M. Nguyen, M. Paulite, A. Piryatinski, J. Zhang, J. L. Casson, H. Xu, H. Htoon and J. A. Hollingsworth, J. Am. Chem. Soc., 2015, 137, 3755–3758 CrossRef CAS PubMed
.
- M. Protière and P. Reiss, Nanoscale Res. Lett., 2006, 1, 62 CrossRef
.
- A. V. Baranov, Y. P. Rakovich, J. F. Donegan, T. S. Perova, R. A. Moore, D. V. Talapin, A. L. Rogach, Y. Masumoto and I. Nabiev, Phys. Rev. B: Condens. Matter Mater. Phys., 2003, 68, 165306 CrossRef
.
- L. Wang, K. Nonaka, T. Okuhata, T. Katayama and N. Tamai, J. Phys. Chem. C, 2018, 122, 12038–12046 CrossRef CAS
.
Footnote |
| † Electronic supplementary information (ESI) available: UPS data for AZTS QDs, TEM size distribution, PLQY stability, PL spectra, components of lifetime decay, XPS data for AZTS and AZTS–ZnS core–shell QDs. See DOI: 10.1039/d1tc00421b |
| This journal is © The Royal Society of Chemistry 2021 |


