 Open Access Article
Creative Commons Attribution 3.0 Unported Licence
Pyrolyzed chitin nanofiber paper as a three-dimensional porous and defective nanocarbon for photosensing and energy storage†
Luting
Zhu
 ,
Yintong
Huang
,
Yoshitaka
Morishita
,
Kojiro
Uetani
,
Yintong
Huang
,
Yoshitaka
Morishita
,
Kojiro
Uetani
 ,
Masaya
Nogi
and
Hirotaka
Koga
 *
*
The Institute of Scientific and Industrial Research (SANKEN), Osaka University, 8-1 Mihogaoka, Ibaraki, Osaka 567-0047, Japan. E-mail: hkoga@eco.sanken.osaka-u.ac.jp; Fax: +81-6-6879-8444; Tel: +81-6-6879-8442
First published on 26th March 2021
Abstract
The design of the three-dimensional (3D) porous and defective molecular structure of nanocarbons can potentially enhance their functionalities for advanced electronic applications by providing a large working volume, rapid transport of electrolytes and reactants, and active sites for electrochemical reactions. Here, we report successful fabrication of 3D porous and defective nanocarbons by direct pyrolysis of crab shell-derived chitin nanofiber paper. The pyrolyzed chitin nanofiber paper has tunable electrical resistivity (1013 to 10−2 Ω cm), 3D porous structures with layered nanofiber networks, and defective nitrogen-doped carbon molecular structures. The pyrolyzed chitin nanofiber paper shows good performance as a photosensor and an energy-storage supercapacitor electrode, proving that the tailored 3D porous and defective carbon structures play key roles in the drastic improvement of the performance. This pioneering approach can be used for fabrication of chitin nanofiber-derived nanocarbons with excellent multiple functions for future sustainable electronics.
Introduction
Recent years have seen remarkable progress in tailoring of the porous and molecular structures of nanocarbons to enhance their functionalities for advanced electronic applications. In particular, nanocarbons with three-dimensional (3D) porous structures have received increasing interest as promising electronic nanomaterials owing to their many advantages, such as high electrical conductivity, large working volume, multiplexed conduction networks, and rapid transport of electrolytes and reactants.1,2 Furthermore, defective carbon molecular structures, such as disordered graphitic edges, in-plane vacancies, and doped heteroatoms, have been introduced into 3D porous nanocarbons to tailor their electronic properties and produce more active sites for electrochemical reactions.3 The resulting 3D porous and defective nanocarbons have shown great promise in a wide range of applications, such as sensing,4,5 electrocatalysis6,7 and energy storage.8,9The 3D porous nanocarbons have been prepared by pyrolyzing various precursors, including synthetic polymer-based electrospun nanofiber networks and biomass.10,11 To introduce defective carbon molecular structures, doping of heteroatoms, such as nitrogen (N), into the 3D porous nanocarbons has proved to be an efficient method.12 The N-doped 3D porous nanocarbons have frequently been obtained by post-treatment with synthetic reagents such as ammonia13,14 and amines.15 Thus, the conventional preparation technique for 3D porous and defective nanocarbons frequently requires a complicated process. From the viewpoint of sustainable development, it is desirable to prepare 3D porous and defective nanocarbons from biomass-derived precursors by a facile process without post-treatment.
Among the variety of biomass resources, chitin (β-(1–4)-linked 2-acetamido-2-deoxy-D-glucopyranose), which mainly originates from marine creatures such as shrimps and crabs,16 is one of the most abundant and renewable biopolymers on earth.17 Chitin intrinsically contains a considerable amount of N (∼6.9 wt%) derived from its N-acetyl groups, providing the opportunity to dope N atoms to produce defective carbon molecular structures. There are previous reports concerning the preparation of N-doped defective nanocarbons by pyrolyzing chitin.18–21 While 3D porous nanostructures have been also introduced into the pyrolyzed chitin, the previous method essentially required the post-treatment, such as the removal of a silica template18 and the activation by potassium hydroxide and the following washing with hydrochloric acid.21 Chitin can be extracted as high aspect-ratio nanofibers with nanoscale widths and microscale lengths by chemical and/or physical methods.22,23 If the layered chitin nanofiber networks could be tailored to the 3D porous structure, they could be an ideal precursor to prepare 3D porous nanocarbons. Thus, simple pyrolysis of tailored chitin nanofiber-network structures could be a facile and promising way to prepare 3D porous and defective nanocarbons. There are a few reports about pyrolysis of chitin nanofiber materials.24,25 However, their electrical properties have been insufficiently investigated. In other words, there has been limited progress in exploring the electrical properties and functions of chitin nanofiber-derived carbon materials to expand their device applications.
Here, we report pyrolyzed chitin nanofiber paper as a 3D porous and defective nanocarbon with multiple functions for electronic applications. Chitin nanofibers were first fabricated into a paper with tailored porous structures derived from the layered nanofiber networks, and the paper was then simply pyrolyzed. The 3D porous nanostructures, defective carbon structures, and electrical resistivities of the pyrolyzed chitin nanofiber papers were evaluated. The potential applicability of the pyrolyzed chitin nanofiber papers for photosensing and energy storage was also investigated, while discussing the positive effect of their 3D porous nanostructures and defective carbon molecular structures.
Experimental section
Materials
An aqueous suspension of chitin nanofibers (BiNFi-s chitin, raw material: crabs) was purchased from Sugino Machine Ltd, Toyama, Japan. The reagents t-butyl alcohol and potassium hydroxide were purchased from Nacalai Tesque, Inc., Kyoto, Japan.Preparation of the chitin nanofiber papers
First, an aqueous suspension of chitin nanofibers (0.2 wt%, 200 mL) was dewatered on a membrane filter (H020A090C, hydrophilic polytetrafluoroethylene membrane, 0.2 μm pore diameter, Advantec Toyo Kaisha, Ltd, Tokyo, Japan) under vacuum filtration (KST-47, Advantec Toyo Kaisha, Ltd, Tokyo, Japan). Next, 200 mL of t-butyl alcohol was slowly poured onto the wet sheet followed by suction filtration. The resulting sheet was then peeled off from the membrane filter and immersed in liquid nitrogen for 1 min, followed by freeze drying (EYELA FDU-2200, Tokyo Rikakikai Co., Ltd, Tokyo, Japan) to prepare the chitin nanofiber paper. The chitin nanofiber paper without t-butyl alcohol treatment was prepared by hot-press drying at 1 MPa and 110 °C for 20 min (AYSR-5, Shinto Metal Industries, Ltd., Osaka, Japan), or by freeze drying.Pyrolysis of the chitin nanofiber papers
The chitin nanofiber paper was cut into square pieces (1.5 cm × 1.5 cm) and pyrolyzed at different temperatures (300, 500, 700, 900, and 1100 °C) for 1 h in N2 gas (KDF75, Denken-Highdental Co., Ltd, Kyoto, Japan). The heating and cooling speeds were set to 2 °C min−1, and the N2 flux was set to 0.5 L min−1.Evaluation of the photosensing performance
The photosensing performance was measured by a precision source/measure unit (B2902A, Keysight Technologies, California, USA). The pyrolyzed chitin nanofiber paper was placed on a glass slide and covered with two copper plates for current detection, followed by simulated solar light irradiation on the paper. The light was provided by a 300 W xenon lamp with controlled light intensity (HAL-320W, Asahi Spectra Co. Ltd, Tokyo, Japan). The time–current curve was obtained under voltage of 5 V. An infrared camera (FLIR ETS320, FLIR Systems Inc., Tokyo, Japan) was used to monitor the surface temperature of the pyrolyzed chitin nanofiber paper.Evaluation of the capacitive properties as supercapacitor electrodes
The supercapacitor electrode performance was evaluated with an electrochemical workstation (ModuLab XM, Solartron Analytical-AMETEK Advanced Measurement Technology Inc., Berkshire, UK). In the three-electrode system, the pyrolyzed chitin nanofiber paper (ca. 3–5 mg) was directly used as the working electrode, which was covered by nickel foam for connection to the electrochemical workstation. A platinum wire was used as the counter electrode, Hg/HgO electrode was used as the reference electrode, and 6 M KOH aqueous solution was used as the liquid electrolyte. The galvanostatic cycling test was performed at different current densities from 0.5 to 10 A g−1. Cyclic voltammetry (CV) was performed at a scan rate of 10 mV s−1. The EIS measurements were performed with a 5 mV amplitude in the frequency range 0.1–100 kHz. The gravimetric capacitance (C, F g−1) for a single electrode was calculated by the following equation:| C = IΔt/(mΔV) | (1) |
| η = tD/tC × 100% | (2) |
Characterization
The surface and cross-section observations were performed with field-emission scanning electron microscope (FE-SEM) at an accelerate voltage of 2 kV (SU-8020, Hitachi High-Tech Science Corp., Tokyo, Japan). Platinum sputtering of the original and pyrolyzed chitin nanofiber paper was performed before FE-SEM observation. The electrical resistivity values of the original chitin nanofiber paper and chitin nanofiber papers pyrolyzed at 300 and 500 °C were measured using a resistivity meter with a ring-type probe (Hiresta-UX, MCP-HT800, Mitsubishi Chemical Analytech Co., Ltd, Tokyo, Japan). The electrical resistivity values of the chitin nanofiber papers pyrolyzed at 700, 900, and 1100 °C were measured with a four-probe resistivity meter (Loresta-GP, MCP-T610, Mitsubishi Chemical Analytech Co., Ltd, Tokyo, Japan). The X-ray photoelectron spectra (XPS) were recorded with a JPS-9010 photoelectron spectrometer (JEOL Ltd, Tokyo, Japan), using monochromatic Al Kα (1486.6 eV) radiation as the excitation source. The X-ray diffraction (XRD) patterns were recorded with an Ultima IV X-ray diffractometer (Rigaku Corp., Tokyo, Japan) using Ni-filtered Cu Kα radiation (1.5418 Å) and a scanning angle (2θ) range of 5°–80° at 30 kV and 40 mA. The Raman spectra were recorded with a laser wavelength of 532 nm (RAMAN-touch VIS-NIR-OUN, Nanophoton Corp., Osaka, Japan). The nitrogen physisorption measurements were performed at 77 K with a surface area and pore size analyzer (NOVA 4200e, Quantachrome Instruments, Kanagawa, Japan). Brunauer–Emmett–Teller (BET) analysis was performed for relative vapor pressures of 0.01–0.3. Elemental analysis was performed with an organic trace element analysis device (JM10, J-Science Lab Co., Ltd, Kyoto, Japan). The UV-vis spectra were recorded with a UV-vis-NIR spectrophotometer (UV-3600 Plus, Shimadzu Corp., Kyoto, Japan).Results and discussion
3D porous nanostructures of the pyrolyzed chitin nanofiber papers
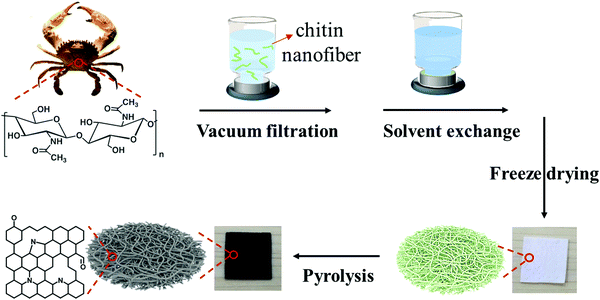
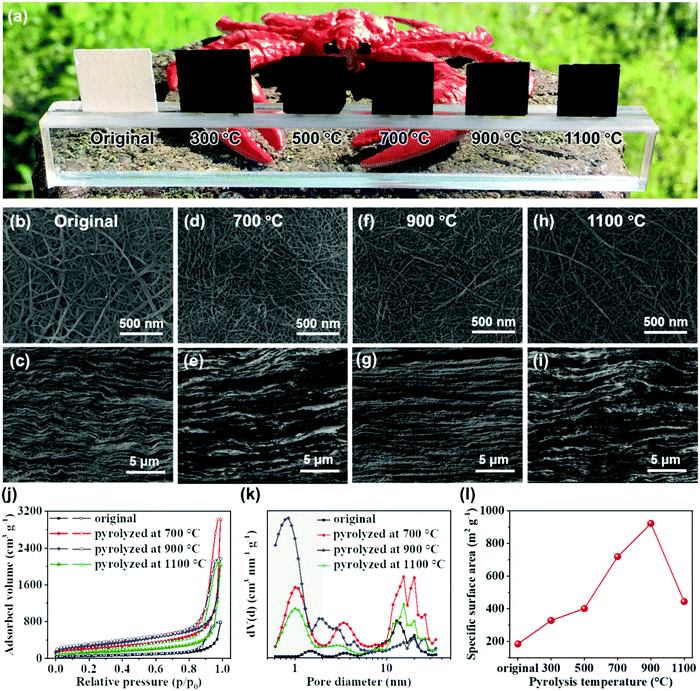
Preparation and pyrolysis of the chitin nanofiber paper were performed by the sequential procedures shown in Fig. 1. In brief, an aqueous dispersion of chitin nanofibers was dewatered by vacuum filtration, followed by solvent exchange with t-butyl alcohol, freeze drying, and then pyrolysis at different temperatures. The original chitin nanofiber paper shrank by pyrolysis. While the original chitin nanofiber paper was flexible, the pyrolyzed chitin nanofiber paper was somewhat brittle. However, the pyrolyzed chitin nanofiber paper was free-standing to enable easy handling for evaluation and applications (Fig. 2a, see also Fig. S1, ESI†). To generate 3D porous nanostructures in the pyrolyzed chitin nanofiber papers, we investigated freeze drying with t-butyl alcohol treatment before pyrolysis. In the presence of water, the chitin nanofibers inevitably aggregated during the drying process owing to the high surface tension of water, leading to difficulty in making porous structures (Fig. S2, ESI†). However, freeze drying with t-butyl alcohol treatment suppressed aggregation of the chitin nanofibers owing to the low surface tension of t-butyl alcohol.26,27 The resulting chitin nanofiber paper contained porous nanofiber networks and layered structures, leading to 3D porous nanostructures with thickness of ca. 355 μm (Fig. 2b and c). The chitin nanofiber paper could maintain such unique nanostructures even after pyrolysis (Fig. 2d–i). The chitin nanofiber paper pyrolyzed at 1100 °C possessed 3D porous nanostructures with thickness of ca. 135 μm. To further evaluate the existence of nanoscale pores within the pyrolyzed chitin nanofibers, the pyrolyzed chitin nanofiber papers were subjected to N2 adsorption analysis. The N2 adsorption and desorption isotherms of the pyrolyzed chitin nanofiber papers showed rapidly increasing N2 adsorption at low relative pressure and a hysteresis loop at high relative pressure, indicating the existence of micropores (<2 nm, typical character of a type I isotherm) and mesopores (2–50 nm, typical character of a type IV isotherm), respectively (Fig. 2j).28 While mesopores were observed even in the original chitin nanofiber paper, the micropores were confirmed upon pyrolysis (Fig. 2k). These results suggested that the micropores formed within the chitin nanofibers by the progress of pyrolysis. The micropore volume and concomitant specific surface area increased with increasing pyrolysis temperatures until 900 °C (328, 401, 719, and 923 m2 g−1 at pyrolysis temperatures of 300, 500, 700, and 900 °C, respectively) (Fig. 2l). However, they decreased at a pyrolysis temperature of 1100 °C, possibly because of gradual closing of the micropores at very high pyrolysis temperatures.29 Thus, the pyrolyzed chitin nanofiber papers with tailored nanofiber networks possessed 3D porous nanostructures, as well as micropores within the nanofibers.Defective carbon molecular structures of the pyrolyzed chitin nanofiber papers
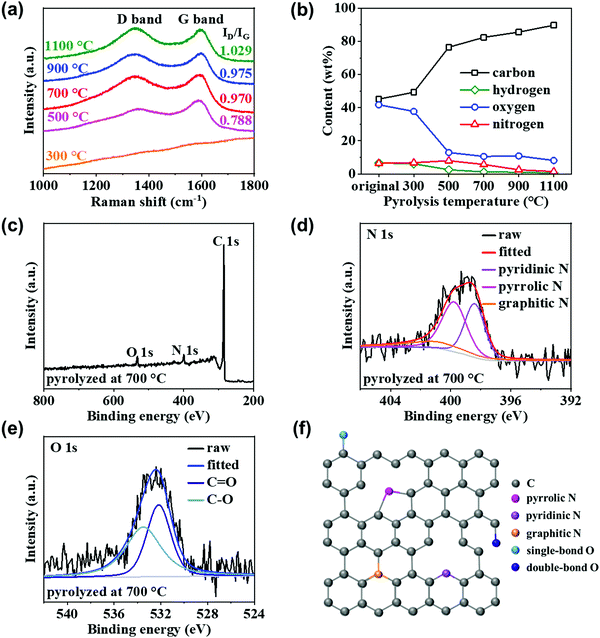
The molecular structures of the pyrolyzed chitin nanofiber papers were then evaluated (Fig. 3). From the Raman spectrometry results (Fig. 3a), the G band at ca. 1580 cm−1 was confirmed at pyrolysis temperatures above 500 °C, indicating formation of graphitic carbon structures upon pyrolysis of the chitin nanofiber paper.30 The appearance of the D band at ca. 1340 cm−1 suggested that there were also defective carbon structures, such as disordered graphitic edges and in-plane imperfections, in the pyrolyzed chitin nanofiber papers.30 Then, the intensity ratio between the D and G band peaks (ID/IG) increased with increasing pyrolysis temperature. From the results of XRD analyses, the graphitic carbon structures were gradually grown upon pyrolysis of the chitin nanofiber paper (see Fig. S3, ESI†). Considering these results together with the previous report,31 it was suggested that the number and size of the graphitic carbon structures, which were still separated by defective regions, were increased in the chitin nanofiber paper upon the progress of pyrolysis.To elucidate the defective carbon structures, elemental and XPS analyses were then performed. Elemental analysis suggested that the pyrolyzed chitin nanofiber paper contained carbon (C), oxygen (O), hydrogen (H), and N. The C content in the pyrolyzed chitin nanofiber paper increased to ca. 90% with increasing pyrolysis temperature, indicating that O, H, and N were gradually removed from the chitin nanofibers upon the progress of pyrolysis (Fig. 3b). The N content increased from that of the original chitin nanofibers (6.43 wt%) as the pyrolysis temperature increased to 500 °C (6.83 and 8.02 wt% at 300 and 500 °C, respectively), and decreased at higher pyrolysis temperatures (5.74, 2.53, and 1.47 wt% at 700, 900, and 1100 °C, respectively). The XPS spectrum of the chitin nanofiber paper pyrolyzed at 700 °C indicated the existence of C, O and N elements with typical peaks at ∼285, ∼532, and ∼399 eV, respectively (Fig. 3c).14 The N 1s spectrum (Fig. 3d) can be deconvoluted into three peaks: pyrrolic N (N-5, 399.8 eV), pyridinic N (N-6, 398.4 eV), and graphitic N (N-Q, 401.0 eV).32,33 Among the three types of N, pyridinic N and pyrrolic N were dominant. Moreover, the O 1s spectrum can be deconvoluted into two peaks: C![[double bond, length as m-dash]](https://www.rsc.org/images/entities/char_e001.gif) O (532.2 eV) and C–O (533.5 eV) (Fig. 3e).21 These results suggested that the chitin nanofiber paper pyrolyzed at 700 °C contained N,O-doping in the graphitic carbon structures shown in Fig. 3f. At pyrolysis temperatures above 900 °C, the N 1s spectrum could hardly be detected for the pyrolyzed chitin nanofiber papers (Fig. S4, ESI†), which was consistent with the results of elemental analysis (Fig. 3b), indicating removal of N upon the progress of pyrolysis.
O (532.2 eV) and C–O (533.5 eV) (Fig. 3e).21 These results suggested that the chitin nanofiber paper pyrolyzed at 700 °C contained N,O-doping in the graphitic carbon structures shown in Fig. 3f. At pyrolysis temperatures above 900 °C, the N 1s spectrum could hardly be detected for the pyrolyzed chitin nanofiber papers (Fig. S4, ESI†), which was consistent with the results of elemental analysis (Fig. 3b), indicating removal of N upon the progress of pyrolysis.
Based on these results, the pyrolyzed chitin nanofiber paper possessed both graphitic carbon structures and defective carbon molecular structures, such as N-doped carbons and O-containing functional groups, although such carbon molecular structures changed by the pyrolysis temperature. Thus, facile fabrication of 3D porous and defective nanocarbons was successfully demonstrated by simple pyrolysis of chitin nanofiber paper with tailored nanofiber networks.
Electrical resistivities of the pyrolyzed chitin nanofiber papers
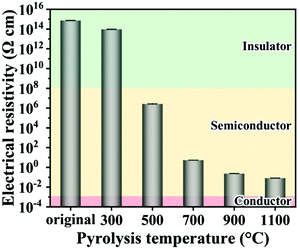
The electrical resistivity of the chitin nanofiber paper dramatically changed upon pyrolysis (Fig. 4). The original chitin nanofiber paper showed very high electrical resistivity of ca. 7.34 × 10¹⁴ Ω cm. The electrical resistivity gradually decreased from ca. 1014 to 10−2 Ω cm with increasing pyrolysis temperature, that is, the electrical resistivity could be tuned from the insulator level to the semiconductor or even quasiconductor level by controlling the pyrolysis temperature (see also Fig. S5, ESI†). The gradual decrease of the electrical resistivity was possibly because of removal of N, O, and H (Fig. 3b) and growth of electrically conductive graphitic carbon structures (sp2-hybridized carbon domains) within the pyrolyzed chitin nanofibers (see Fig. S3, ESI†). Owing to such widely tunable electrical resistivity in combination with 3D porous and defective carbon structures, the pyrolyzed chitin nanofiber papers show promise for a variety of electronic applications.Application as a photosensor
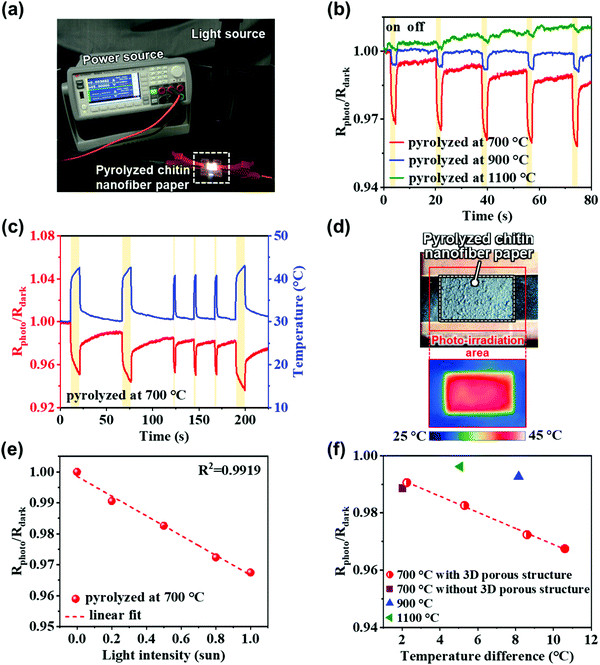
The promising applications of the pyrolyzed chitin nanofiber papers in electronics were explored. Then, we found that the pyrolyzed chitin nanofiber paper possesses photosensing performances (Fig. 5). The change in the electrical resistance of the pyrolyzed chitin nanofiber paper upon exposure to simulated solar light (light intensity of 1 sun (0.1 W cm−2)) was measured (Fig. 5a). For the chitin nanofiber papers pyrolyzed at low temperatures (300 and 500 °C), the electrical resistance could not be measured owing to their highly insulating properties and the detection limit of the apparatus used for evaluation of the photosensing performance. The change in the electrical resistance of the chitin nanofiber papers pyrolyzed at 700, 900, and 1100 °C was detected, and their resistance values rapidly decreased upon solar light irradiation for 2 s (Fig. 5b). Thus, these pyrolyzed chitin nanofiber papers successfully acted as photosensors. It was then also confirmed that the temperature of the pyrolyzed chitin nanofiber paper increased upon solar light irradiation owing to the photothermal heating phenomenon (Fig. 5c and d), in which the defective carbon molecular structures could promote excited electron relaxation through predominantly nonradiative transitions, thus releasing energy as heat.34,35 Therefore, the photosensing performance of the pyrolyzed chitin nanofiber papers would be derived from their temperature increase upon light irradiation. The temperature increase could enhance the carrier transport in the pyrolyzed chitin nanofiber papers with semiconductor-level electrical properties. It should be noted that the chitin nanofiber paper pyrolyzed at 700 °C showed the largest resistance change (Rphoto/Rdark). The highest sensitivity of the chitin nanofiber paper pyrolyzed at 700 °C would be ascribed to its highest electrical resistivity (Fig. 4) and its highest photothermal heating performance (Fig. S6 and S7, ESI†). This is because higher resistivity materials generally show larger resistivity change (decrease) against the temperature increase due to the enhanced carrier transport, and higher photothermal heating performance provides higher temperature increase upon photo irradiation. The higher photothermal heating performance of the chitin nanofiber paper pyrolyzed at 700 °C would be owing to its higher light absorption (Fig. S7a, ESI†) and higher photothermal conversion ability, which were derived from its 3D porous nanostructures and molecular structures. The chitin nanofiber papers pyrolyzed at 900 and 1100 °C also possessed the 3D porous nanostructures (Fig. 2f–i). Thus, more defective carbon molecular structures of the chitin nanofiber paper pyrolyzed at 700 °C would be mainly ascribed to its higher photothermal conversion ability, leading to its higher photosensitivity. The chitin nanofiber paper pyrolyzed at 700 °C showed sufficient sensitivity to detect solar light down to intensity less than 0.2 sun, indicating the acceptable photosensing performance for a wide range of light intensities (0–1 sun) (Fig. 5e, see also Fig. S8, ESI†). Then, it was also demonstrated that the chitin nanofiber paper pyrolyzed at 700 °C can provide higher sensitivity than those pyrolyzed at 900 and 1100 °C even under a similar temperature change (Fig. 5f).To demonstrate the effect of the 3D porous nanostructures on the photosensing performance, pyrolyzed chitin nanofiber paper without 3D porous nanostructures was also prepared (Fig. S9, ESI†). The pyrolyzed chitin nanofiber paper without 3D porous nanostructures showed inferior sensitivity to that with 3D porous nanostructures. The poor sensitivity was because of its lower temperature increase, which is ascribed to the higher reflectance and lower absorbance of the pyrolyzed chitin nanofiber paper without 3D porous nanostructures than that with 3D porous nanostructures. In other words, the 3D porous structures promoted solar light absorption and thus photothermal heating, enhancing the photosensing performance. Thus, the pyrolyzed chitin nanofiber paper with a 3D porous and defective carbon structure could be applied as a rapid response photosensor.
Application as a supercapacitor electrode
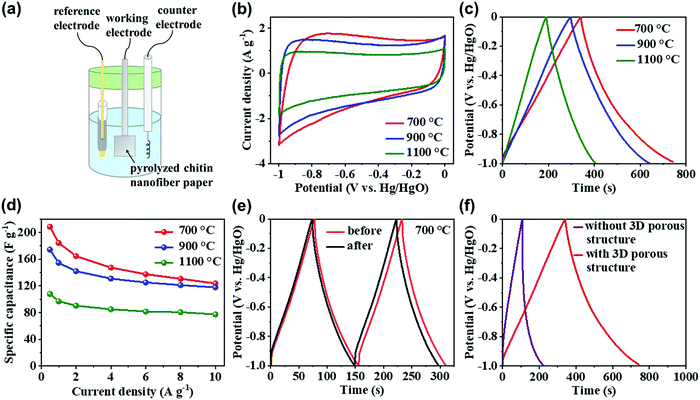
The pyrolyzed chitin nanofiber papers were then applied as energy-storage electrodes for supercapacitors (Fig. 6). It has been reported that 3D porous and defective nanocarbon electrodes, such as reduced graphene oxide-derived carbon nanofibers, show higher specific capacitance in aqueous electrolytes than in organic or ionic liquid electrolytes; alkali metal ions can be strongly solvated in an aqueous solution, providing higher mobility and diffusion coefficients for fast ion diffusion within the electrode/electrolyte interface.36 Therefore, the electrochemical measurements were performed with a conventional three-electrode system using a 6 M KOH aqueous electrolyte (Fig. 6a). While the previously-reported chitin-based porous carbons frequently require the use of additives, such as a polytetrafluoroethylene binder and a conductive acetylene black,21,37 the chitin nanofiber papers pyrolyzed at 700, 900, and 1100 °C, which had relatively high electrical conductivity, could be used as a free-standing and 3D conductive electrode even without a binder or a conductive additive. The pyrolyzed chitin nanofiber paper electrodes showed rectangular-shaped CV curves with distortion (Fig. 6b) and somewhat nonlinear charge–discharge curves (Fig. 6c), indicating electric double-layer capacitor behavior with redox pseudocapacitance. According to the previous report,38 the coulombic efficiency of the pyrolyzed chitin nanofiber paper electrodes was calculated to estimate their pseudocapacitance. Then, the coulombic efficiencies at a current density of 0.5 A g−1 of the chitin nanofiber papers pyrolyzed at 700, 900, and 1100 °C were 117.3, 116.5, and 113.7%, respectively. The coulombic efficiency was over 100% in each sample, indicating the redox pseudocapacitance owing to the presence of N and O.38 Based on the charge–discharge curves, the specific capacitance values were plotted as a function of the current density (Fig. 6d). It is worth noting that the chitin nanofiber paper electrode pyrolyzed at 700 °C showed the highest specific capacitance of up to 208.4 F g−1 at current densities ranging from 0.5 to 10 A g−1, although it showed higher charge-transfer resistance at the electrode–electrolyte interface and higher diffusion resistance of electrolyte ions in the electrode than the chitin nanofiber paper electrodes pyrolyzed at 900 and 1100 °C (Fig. S10, ESI†). The higher charge-transfer resistance and higher electrolyte-diffusion resistance of the chitin nanofiber paper electrode pyrolyzed at 700 °C would be owing to its higher electrical resistivity (Fig. 4) and its lower electrolyte-diffusion efficiency in its porous structures, respectively. Since the coulombic efficiencies of the pyrolyzed chitin nanofiber paper electrodes were almost the same (113.7–117.3%), there was no large difference of their redox pseudocapacitance. In addition, the specific surface area of the chitin nanofiber paper pyrolyzed at 700 °C was lower than that of the paper pyrolyzed at 900 °C (Fig. 2h). These results suggested that the highest specific capacitance of the chitin nanofiber paper pyrolyzed at 700 °C would be mainly derived from its more defective carbon molecular structures with relatively high N and O content (Fig. 3b), which can provide effective adsorption sites for electrolyte ions, due to the increased charge density by doping of N and O with higher electronegativity than C. As shown in Fig. 6e, chitin nanofiber paper pyrolyzed at 700 °C also showed excellent charge–discharge cyclic durability, and the retention of the specific capacitance was 95.5% (from 173.0 to 165.2 F g−1) at a current density of 2 A g−1 after 1000 cycles (over 41 h). Compared with the pyrolyzed chitin nanofiber paper without 3D porous nanostructures (specific surface area of ca. 293 m2 g−1), the paper with 3D porous nanostructures showed much higher specific capacitance, suggesting that the 3D porous nanostructures and resulting high specific surface area (ca. 719 m2 g−1) allow effective diffusion and adsorption of electrolyte ions (Fig. 6f and Fig. S11, ESI†). The pyrolyzed chitin nanofiber paper with 3D porous and defective carbon structures also showed higher specific capacitance than those of the previously-reported chitin-based N-doped carbon nanosphere,37 carbonized cellulose nanocrystal/cellulose nanofibril film,39 cellulose-based N-doped porous carbon prepared with the urea treatment,40 cotton-based N-doped carbon,41 and lignin-,42 starch-,43 and alginate-derived porous carbons44 (Table S1, ESI†). Thus, the pyrolyzed chitin nanofiber paper is expected as a sustainable, facilely prepared, and high-performance energy-storage electrode for supercapacitor.Conclusion
We have demonstrated that facile pyrolysis of chitin nanofiber paper with designed fiber-network structures is a promising strategy to prepare 3D porous and defective nanocarbon materials. The pyrolyzed chitin nanofiber paper was successfully applied as photosensor and supercapacitor electrode. Its tailored 3D porous nanostructures and intrinsically N-doped carbon molecular structures played essential roles in the drastic improvement of the photosensing and energy-storage performance for these applications. Chitin is one of the most abundant and renewable bioresources on the earth. Thus, this strategy will facilitate effective use of chitin resources in electronic applications, opening a new avenue for future sustainable electronics.Author contributions
L. Z. and H. K. designed this work and mainly wrote the manuscript. L. Z. prepared the samples. L. Z., H. Y., and Y. M. carried out the experiments. L. Z., K. U., M. N., and H. K. analyzed the results and discussed the manuscript during the preparation. All authors discussed the results and implications and commented on the manuscript at all stages.Conflicts of interest
There are no conflicts to declare.Acknowledgements
This work was partially supported by Grants-in-Aid for Scientific Research (Grant No. 20J11624 to L. Z., 18H02256 and 20K21334 to H. K.) from the Japan Society for the Promotion of Science, by the Cooperative Research Program “CORE Lab” of the Network Joint Research Center for Materials and Devices: Dynamic Alliance for Open Innovation Bridging Human, Environment and Materials (Grant No. 20186002 to H. K.), by the “Nanotechnology Platform Project (Nanotechnology Open Facilities in Osaka University)” of the Ministry of Education, Culture, Sports, Science and Technology, Japan (No. S-19-OS-0044 to H. K.), and by the Japan Prize Heisei Memorial Research Grant Program (H. K.). We wish to thank Ms Yuki Yoshida for her experimental assistance. We also thank the members of the Comprehensive Analysis Center, SANKEN, Osaka University, for elemental analysis and XPS analysis.References
- S. Xin, Y.-G. Guo and L.-J. Wan, Acc. Chem. Res., 2012, 45, 1759–1769 CrossRef CAS PubMed.
- L. Zhang, Y. Shi, Y. Wang and N. R. Shiju, Adv. Sci., 2020, 7, 1902126 CrossRef CAS PubMed.
- J. Zhu and S. Mu, Adv. Funct. Mater., 2020, 30, 2001097 CrossRef CAS.
- X. Zhang, D. Liu, B. Yu and T. You, Sens. Actuators, B, 2016, 224, 103–109 CrossRef CAS.
- T. Yan, Z. Wang, Y.-Q. Wang and Z.-J. Pan, Mater. Des., 2018, 143, 214–223 CrossRef CAS.
- Y. Gao, Z. Xiao, D. Kong, R. Iqbal, Q.-H. Yang and L. Zhi, Nano Energy, 2019, 64, 103879 CrossRef CAS.
- D. Yan, S. Dou, L. Tao, Z. Liu, Z. Liu, J. Huo and S. Wang, J. Mater. Chem. A, 2016, 4, 13726–13730 RSC.
- W. Kang, L. Fan, N. Deng, H. Zhao, Q. Li, M. Naebe, J. Yan and B. Cheng, Chem. Eng. J., 2018, 333, 185–190 CrossRef CAS.
- J. Tan, Y. Han, L. He, Y. Dong, X. Xu, D. Liu, H. Yan, Q. Yu, C. Huang and L. Mai, J. Mater. Chem. A, 2017, 5, 23620–23627 RSC.
- E. Azwar, W. A. W. Mahari, J. H. Chuah, D.-V. N. Vo, N. L. Ma, W. H. Lam and S. S. Lam, Int. J. Hydrogen Energy, 2018, 43, 20811–20821 CrossRef CAS.
- M. Inagaki, Y. Yang and F. Kang, Adv. Mater., 2012, 24, 2547–2566 CrossRef CAS PubMed.
- P. P. Sharma, J. Wu, R. M. Yadav, M. Liu, C. J. Wright, C. S. Tiwary, B. I. Yakobson, J. Lou, P. M. Ajayan and X. Zhou, Angew. Chem., 2015, 127, 13905–13909 CrossRef.
- D. Hulicova-Jurcakova, M. Kodama, S. Shiraishi, H. Hatori, Z. H. Zhu and G. Q. Lu, Adv. Funct. Mater., 2009, 19, 1800–1809 CrossRef CAS.
- L.-F. Chen, Z.-H. Huang, H.-W. Liang, W.-T. Yao, Z.-Y. Yu and S.-H. Yu, Energy Environ. Sci., 2013, 6, 3331–3338 RSC.
- A. J. Rodriguez, M. E. Guzman, C.-S. Lim and B. Minaie, Carbon, 2010, 48, 3256–3259 CrossRef CAS.
- J. You, M. Li, B. Ding, X. Wu and C. Li, Adv. Mater., 2017, 29, 1606895 CrossRef PubMed.
- J. You, L. Zhu, Z. Wang, L. Zong, M. Li, X. Wu and C. Li, Chem. Eng. J., 2018, 344, 498–505 CrossRef CAS.
- T.-D. Nguyen, K. E. Shopsowitz and M. J. MacLachlan, J. Mater. Chem. A, 2014, 2, 5915–5921 RSC.
- L. Gao, D. Ying, T. Shen, Y. Zheng, J. Cai, D. Wang and L. Zhang, ACS Sustainable Chem. Eng., 2020, 8, 10881–10891 CAS.
- R. Hao, Y. Yang, H. Wang, B. Jia, G. Ma, D. Yu, L. Guo and S. Yang, Nano Energy, 2018, 45, 220–228 CrossRef CAS.
- J. Zhou, L. Bao, S. Wu, W. Yang and H. Wang, Carbohydr. Polym., 2017, 173, 321–329 CrossRef CAS PubMed.
- S. Ifuku, M. Nogi, K. Abe, M. Yoshioka, M. Morimoto, H. Saimoto and H. Yano, Biomacromolecules, 2009, 10, 1584–1588 CrossRef CAS PubMed.
- Y. Fan, T. Saito and A. Isogai, Biomacromolecules, 2008, 9, 1919–1923 CrossRef CAS PubMed.
- B. Ding, S. Huang, K. Pang, Y. Duan and J. Zhang, ACS Sustainable Chem. Eng., 2018, 6, 177–185 CrossRef CAS.
- M. Nogi, F. Kurosaki, H. Yano and M. Takano, Carbohydr. Polym., 2010, 81, 919–924 CrossRef CAS.
- T. I. Baskin, T. J. Orr, M. Jercinovic and M. Yoshida, Micros. Today, 2014, 22, 36–39 CrossRef CAS.
- T. Inoue and H. Osatake, Arch. Histol. Cytol., 1988, 51, 53–59 CrossRef CAS PubMed.
- L. Gao, L. Xiong, D. Xu, J. Cai, L. Huang, J. Zhou and L. Zhang, ACS Appl. Mater. Interfaces, 2018, 10, 28918–28927 CrossRef CAS PubMed.
- C. L. Burket, R. Rajagopalan and H. C. Foley, Carbon, 2008, 46, 501–510 CrossRef CAS.
- Y. Li, B. Zou, C. Hu and M. Cao, Carbon, 2016, 99, 79–89 CrossRef CAS.
- R. S. Dey, S. Hajra, R. K. Sahu, C. R. Raj and M. K. Panigrahi, Chem. Commun., 2012, 48, 1787–1789 RSC.
- T. Lin, I.-W. Chen, F. Liu, C. Yang, H. Bi, F. Xu and F. Huang, Science, 2015, 350, 1508–1513 CrossRef CAS PubMed.
- M. Wang, Z. Yang, W. Li, L. Gu and Y. Yu, Small, 2016, 12, 2559–2566 CrossRef CAS PubMed.
- Y. Weng, S. Guan, L. Wang, H. Lu, X. Meng, G. I. N. Waterhouse and S. Zhou, Small, 2020, 16, 1905184 CrossRef CAS PubMed.
- M. Gao, L. Zhu, C. K. Peh and G. W. Ho, Energy Environ. Sci., 2019, 12, 841–864 RSC.
- K. O. Oyedotun, T. M. Masikhwa, S. Lindberg, A. Matic, P. Johansson and N. Manyala, Chem. Eng. J., 2019, 375, 121906 CrossRef CAS.
- S. Zheng, Y. Cui, J. Zhang, Y. Gu, X. Shi, C. Peng and D. Wang, RSC Adv., 2019, 9, 10976–10982 RSC.
- X. Xia, Q. Hao, W. Lei, W. Wang, H. Wang and X. Wang, J. Mater. Chem., 2012, 22, 8314–8320 RSC.
- Z. Li, K. Ahadi, K. Jiang, B. Ahvazi, P. Li, A. O. Anyia, K. Cadien and T. Thundat, Nano Res., 2017, 10, 1847–1860 CrossRef CAS.
- Z. Chen, X. Peng, X. Zhang, S. Jing, L. Zhong and R. Sun, Carbohydr. Polym., 2017, 170, 107–116 CrossRef CAS PubMed.
- L. Chen, T. Ji, L. Mu and J. Zhu, Carbon, 2017, 111, 839–848 CrossRef CAS.
- W. Zhang, H. Lin, Z. Lin, J. Yin, H. Lu, D. Liu and M. Zhao, ChemSusChem, 2015, 8, 2114–2122 CrossRef CAS PubMed.
- L. Pang, B. Zou, Y. Zou, X. Han, L. Cao, W. Wang and Y. Guo, Colloids Surf., A, 2016, 504, 26–33 CrossRef CAS.
- W. Chen, M. Luo, K. Yang and X. Zhou, Int. J. Biol. Macromol., 2020, 158, 265–274 CrossRef CAS PubMed.
Footnote |
| † Electronic supplementary information (ESI) available: Volume and weight retention of chitin nanofiber papers pyrolyzed at different temperatures; top-view FE-SEM image of chitin nanofiber paper without t-butyl alcohol exchange for freeze drying; XRD spectra and crystallite sizes of the graphene fragment for the pyrolyzed chitin nanofiber papers; full-scale XPS spectra of the chitin nanofiber papers pyrolyzed at 900 °C and 1100 °C; effect of the pyrolysis time and the heating/cooling speed on the electrical resistivity of the chitin nanofiber paper pyrolyzed at 700 °C; photosensing performance and temperature difference of the chitin nanofiber papers at different pyrolysis temperatures; UV-vis-NIR absorption spectra and temperature difference during light irradiation at 1 Sun without applied voltage; photosensing performance of the chitin nanofiber paper pyrolyzed at 700 °C at different light intensities; top-view FE-SEM image, photosensing performance, and UV-vis spectrum of the chitin nanofiber paper pyrolyzed at 700 °C without a 3D porous structure; EIS measurements of the chitin nanofiber papers pyrolyzed at different temperatures; CV and Nyquist plots of the chitin nanofiber papers pyrolyzed at 700 °C with and without a 3D porous structure; specific capacitance values of biomass-derived nanocarbon materials. See DOI: 10.1039/d0tc05799a |
| This journal is © The Royal Society of Chemistry 2021 |

