 Open Access Article
Creative Commons Attribution 3.0 Unported Licence
Comparing different geometries for photovoltaic-thermoelectric hybrid devices based on organics†
José P.
Jurado
,
Bernhard
Dörling
 ,
Osnat
Zapata-Arteaga
 ,
Alejandro R.
Goñi
 and
Mariano
Campoy-Quiles

Materials Science Institute of Barcelona (ICMAB-CSIC), Campus UAB, 08193 Bellaterra, Spain. E-mail: mcampoy@icmab.es; m.campoy@csic.es
First published on 11th January 2021
Abstract
Coupling thermoelectrics (TE) with photovoltaics (PV) has emerged as an approach to solid-state solar harvesting, directly converting light and infrared heat into electricity. In this work, we compare PV-TE hybrid devices based on organic semiconductors in three different geometries: a reflection geometry, a non-contact transmission geometry, and a contact transmission geometry. The temperature rises of films of common organic thermoelectric materials, including poly(3,4-ethylenedioxythiophene) polystyrene sulfonate (PEDOT:PSS), single-walled carbon nanotubes (swCNT), and poly[2,5-bis(3-tetradecylthiophen-2-yl)thieno[3,2-b]thiophene] (PBTTT), were measured in configurations representative of the proposed geometries. Because organic semiconductors possess broadband light absorption and low thermal conductivities, a significant rise in temperature was observed under illumination for all geometries. We find, however, that the best configuration is, in fact, the transmission contact mode because it sums two effects. Operating under 1 sun illumination, the temperature of a commercial organic PV module increased by ≈30 K, which leads to an enhancement in OPV performance compared to room temperature. After attaching a thermoelectric to the OPV module, losses from convection are reduced, and the OPV module heats up even more, further increasing its efficiency while additionally enabling thermoelectric generation. Finally, we calculate theoretical thermoelectric efficiencies for the materials and their respective power densities.
1. Introduction
Solar cells can convert incident solar radiation into electricity, with reported efficiencies well over 25% for silicon- and perovskite-based solar cells and 18% for organic solar cells.1–5 A large amount of solar radiation is also converted into thermal energy, due to the thermalization of high-energy photons and parasitic absorption of photons with sub-bandgap energies. This thermal energy is considered a source of losses in solar cells, and in some cases detrimental to performance. Furthermore, not all photons are absorbed by the active layer like the ones with energies below the gap, which are absorbed at the electrodes, causing additional heating of cells. Photons can also be reflected or transmitted by the cell.6In the case of solar cells based on inorganic materials, it is well-known that performance decreases with temperature due to the increase in recombination rate.7 Much interest has been devoted to find strategies to cool down solar cells during operation.8–10 Furthermore, there has been work on developing hybrid devices that simultaneously cool solar cells and make use of the generated waste heat.11–16 In one such approach, a thermoelectric generator (TEG) can be coupled to a solar cell to either actively cool the solar cell or harvest energy from the waste heat produced by the solar cell, the former via the Peltier effect and the latter via the Seebeck effect.13–19 In another approach, a hybrid PV-TE device based on inorganic materials incorporating a spectral beam splitter has been proposed.20
Organic photovoltaics (OPVs) have a number of important differences with respect to their inorganic counterparts. First, it has been recently shown that organic solar cells can actually perform better at higher temperatures due to an increase in the temperature-activated charge transport and enhanced charge extraction, resulting in an improved fill factor and short circuit current.21–25 Moreover, thermal conductivities of most organic materials, as well as plastic substrates and encapsulating materials, are very low (1 W m−1 K−1 or lower cf. ca. 150 W m−1 K−1 for crystalline silicon), which slows heat dissipation and could eventually result in a substantial increase in OPV cell temperature during operation.26–31 Finally, OPVs can be, and often are, fabricated in a semitransparent geometry, letting not just part of the visible light pass through, but also most of the IR region of the solar spectrum.
The tuneable electronic and optical properties of organic semiconductors have made them particularly appealing for thermoelectric and photovoltaic devices. OPV devices typically have a bulk heterojunction active layer composed of at least two organic semiconductors that is sandwiched between an electron and hole transport layer, and a transparent front electrode and a metallic back electrode. Traditionally, PV devices are opaque, because of the metallic back electrodes. As a result, light entering through the transparent front electrode interferes with light reflected from the metallic back electrode. Recently, semi-transparent organic solar cells, which use only transparent electrodes, have gained interest as solar window applications.32,33 To compensate for the lost back reflection from the bottom metallic electrode, semi-transparent organic solar cells have thicker active layers.34
Organic solar cells tend to be thin to maximize charge collection, which is hampered by the limited charge carrier mobilities, thus leading to a large portion of the light being transmitted through the solar cell.35 Light management techniques have been proposed to trap more light in solar cells.36,37 Additionally, ternary blends and non-fullerene acceptors have been proposed as routes to further boost the absorption of single-junction devices.38 Alternatively, tandem devices have been investigated to harvest separate parts of the solar spectrum.39,40
Recently, it has been shown that solar OTEGs (SOTEGs) can be used to harvest the sun's energy with little to no concentration.28 SOTEGs can transform solar radiation into heat and convert heat into electricity via the Seebeck effect. SOTEGs might be able to attractively complement organic solar cells, as they can make use of waste light and heat from the solar cell, yet there has been little research carried out on a completely organic-based hybrid PV-TE device. In one such work, Lee et al. fabricated an organic hybrid PV-TE device with a single PEDOT:PSS film as the OTEG, reporting a 0.01 percentage point increase in efficiency.16
Inspired by this work and similar works using inorganic materials, we report on different geometries of hybrid photovoltaic–themoelectric (PV-TE) solid-state devices based on organic semiconductors and investigate their photothermal properties with the aim to provide insight on optimal geometries for such devices. As reference organic thermoelectric materials, we use conducting polymers, doped semiconducting polymers, carbon nanotubes and mixtures of carbon nanotubes with bacterial cellulose. As photovoltaic systems, we explore a large range of organic materials, most of them used in OPVs, with varying bandgaps.
2. Experimental details
2.1 Materials
eDIPS CNTs were bought from Meijo Nano Carbon. An aqueous dispersion of poly(3,4-ethylenedioxythiophene) polystyrene sulfonate (PEDOT:PSS Heraeus Clevios Al 4083) was bought from Heraeus. Sodium dodecylbenzenesulfonate (SDBS), poly(3-hexylthiophene-2,5-diyl) (P3HT), poly(sodium-4-styrene sulfonate) (pNaSS), Triton X-100, poly(9,9-dioctylfluorene-alt-benzothiadiazole) (PFBT), dimethyl sulfoxide (DMSO), chlorobenzene (>99%), and dichlorobenzene (>99%) were purchased from Sigma-Aldrich. 2,3,5,6-Tetrafluoro-7,7,8,8-tetracyanoquinodimethane (F4TCNQ) was purchased from TCI Chemicals. The ZnO nanoparticles dispersion was obtained from Avantama. Silicon solar cells were purchased from AOSHIKE and commercial organic solar cells were purchased from infinity PV. Poly[2-methoxy-5-(2-ethylhexyloxy)-1,4-phenylenevinylene] (MEH-PPV), poly[(2,6-(4,8-bis(5-(2-ethylhexyl)thiophen-2-yl)-benzo[1,2-b:4,5-b′]dithiophene))-alt-(5,5-(1′,3′-di-2-thienyl-5′,7′-bis(2-ethylhexyl)benzo[1′,2′-c:4′,5′-c′]dithiophene-4,8-dione)] (PBDB-T or PCE12), poly[(2,6-(4,8-bis(5-(2-ethylhexyl-3-fluoro)thiophen-2-yl)-benzo[1,2-b:4,5-b′]dithiophene))-alt-(5,5-(1′,3′-di-2-thienyl-5′,7′-bis(2-ethylhexyl)benzo[1′,2′-c:4′,5′-c′]dithiophene-4,8-dione)] (PBDBT-T-2F or PCE13) and poly[2,5-bis(3-tetradecylthiophen-2-yl)thieno[3,2-b]thiophene] (PBTTT-C14) were purchased from 1-material. Poly[[2,3-bis(3-octyloxyphenyl)-5,8-quinoxalinediyl]-2,5-thiophenediyl] (TQ1), poly[4,8-bis(5-(2-ethylhexyl)thiophen-2-yl)benzo[1,2-b;4,5-b′]dithiophene-2,6-diyl-alt-(4-(2-ethylhexyl)-3-fluorothieno[3,4-b]thiophene-)-2-carboxylate-2-6-diyl)] (PTB7-Th or PCE10), poly[(5,6-difluoro-2,1,3-benzothiadiazol-4,7-diyl)-alt-(3,3′′′-di(2-octyldodecyl)-2,2′;5′,2′′;5′′,2′′′-quaterthiophen-5,5′′′-diyl)] (PffBT4T-2OD or PCE11), poly([N,N′-bis(2-octyldodecyl)-naphthalene-1,4,5,8-bis(dicarboximide)-2,6-diyl]-alt-5,5′-(2,2′-bithiophene)) (N2200), poly(9,9-di-n-octylfluorenyl-2,7-diyl) (PFO) and indium tin oxide (ITO) substrates were purchased from Ossila.2.2 Preparation of the pure eDIPS and eDIPS:cellulose films
eDIPS single-walled CNTs (swCNTs) were dispersed in an aqueous solution of SDBS. 50 mL SDBS solutions with an initial concentration of 1 mg mL−1 were mixed with 10 mg of CNTs. The dispersions were sonicated at 15 ± 5 °C in a bath sonicator and then centrifuged at 6000 rpm for 6 h. The supernatant was filtered through porous filter paper (PVDF membranes with a 0.2 μm pore size) to achieve thick buckypaper films. Buckypaper thicker than ≈5 μm can easily be removed from the supporting filter paper, giving freestanding samples. The preparation of bacterial cellulose CNT composites is explained in detail elsewhere.29 Briefly, bacterial cellulose fibers are grown in an aqueous medium, in the presence of dispersed swCNTs, forming well-intermixed films. After washing and drying, the ≈10 μm films resemble buckypapers, yet contain only about 10 wt% CNTs, and correspondingly have lower electrical and thermal conductivities.2.3 Preparation of the free-standing DMSO-treated PEDOT:PSS film
DMSO was added directly (5%, v/v) to the aqueous PEDOT:PSS dispersion. Thick, freestanding films (>5 μm) were prepared by drop-casting the aqueous DMSO/PEDOT:PSS dispersion onto PET substrates and allowing them to dry. Due to the poor adhesion of PEDOT:PSS on PET substrates, freestanding films of PEDOT:PSS can be achieved by carefully peeling the dried PEDOT:PSS films thicker than 5 μm from the PET substrates.2.4 Preparation of the F4TCNQ-Doped PBTTT film
Freestanding films were fabricated from a solution of 20 mg of PBTTT dissolved in a mixture 1![[thin space (1/6-em)]](https://www.rsc.org/images/entities/char_2009.gif) :
:![[thin space (1/6-em)]](https://www.rsc.org/images/entities/char_2009.gif) 1 vol% of chlorobenzene and dichlorobenzene. 100 μL were drop-casted at reduced pressure onto a preheated glass substrate at 60 °C using a custom-built chamber. The dry film was immersed in a water bath at 50 °C to detach the polymer film from the glass substrate and picked up in a metal washer. Finally, the film was dried under vacuum at a constant temperature of 60 °C for 20 min. For doping, approximately 5 mg of F4TCNQ were placed on the bottom of the custom-built chamber and heated to 180 °C.30 Then, the polymer film was fixed face-down to the lid of the chamber and simultaneously heated to 130 °C. The chamber was then closed and left undisturbed for 20 min.
1 vol% of chlorobenzene and dichlorobenzene. 100 μL were drop-casted at reduced pressure onto a preheated glass substrate at 60 °C using a custom-built chamber. The dry film was immersed in a water bath at 50 °C to detach the polymer film from the glass substrate and picked up in a metal washer. Finally, the film was dried under vacuum at a constant temperature of 60 °C for 20 min. For doping, approximately 5 mg of F4TCNQ were placed on the bottom of the custom-built chamber and heated to 180 °C.30 Then, the polymer film was fixed face-down to the lid of the chamber and simultaneously heated to 130 °C. The chamber was then closed and left undisturbed for 20 min.
2.5 Preparation of the solar cell filters
Filters made of the relevant materials were used instead of complete photovoltaic cells to evaluate the role of the active layer bandgap on the performance of the hybrid devices. For the glass filter, a glass substrate was cleaned in ethanol and used without further processing. For the glass with ITO filter, a glass substrate with ITO was cleaned with ethanol and used as is. For the glass with ZnO filter, a glass substrate was rinsed in ethanol and a layer of ZnO was deposited by spin-coating. For the glass/ITO/ZnO, a glass substrate with ITO was cleaned with ethanol, and a layer of ZnO was deposited by spin-coating. For the rest of the filters, all materials were dissolved in chlorobenzene (CB) at a concentration of approximately 30 mg mL−1. pNaSS was dissolved in an aqueous solution of Triton X100 (1% v/v). A glass substrate was cleaned with ethanol, and then a thin layer of pNaSS was deposited through spin-coating. Once dry, a thick polymer layer was deposited on top of the pNaSS layer through drop-casting. Finally, the samples were submerged in water to dissolve the pNaSS layer, releasing a freestanding layer of the filter materials. Filters were made of the following materials with increasing band gap: PFO, MEH-PPV, PFBT, P3HT, PCE12, PCE13, TQ1, PCE10, PCE11, N2200.2.6 Optical and photothermal characterization
Temperature response as a function of irradiance was measured on freestanding films with a SAN-EI Electric, XES-100S1 AAA solar simulator and an Optris PI 450 IR camera. The freestanding films of TE materials were mechanically supported on 3D printed supports and placed under the solar simulator. For the non-contact transmission experiments, a filter was placed directly above the TE materials. For the non-contact reflection experiments, a 3D-printed holder was printed so that the filters were at a 45° angle to the TE materials. The TE materials were covered to ensure no direct sunlight contributed to heating them up. For the contact experiments, the freestanding filters were placed on a 3D printed support under the solar simulator. In all cases, the IR camera measured the temperature in the middle of the materials (away from the supported edges) under illumination. The materials were illuminated for 5 min to allow them to reach a steady-state temperature. For the different 3D pieces, we printed PLA slabs using an ION V6 3D printer.Film reflectance and transmittance of the freestanding materials was measured using an FTIR spectrometer (Bruker Vertex 70) attached to an optical microscope (Hyperion).
3. Hybrid devices
3.1 Device geometry
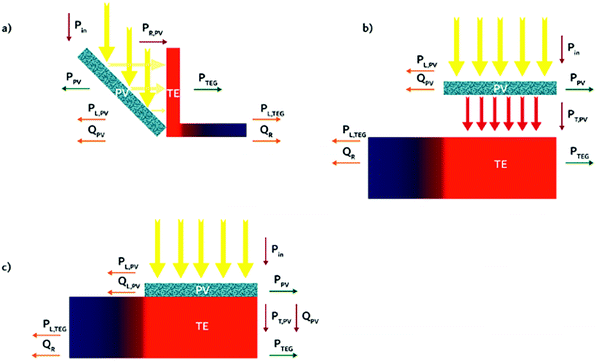
Three different alternatives come to mind as possible geometries for hybrid PV-TE devices: a non-contact reflection geometry, a non-contact transmission, and a contact transmission geometry. The three proposed geometries are shown in Fig. 1. In a reflection geometry (Fig. 1a), an opaque solar cell is placed at an angle to reflect light, PR,PV, towards the SOTEG. In a working solar cell, a fraction of the incident light is lost due to reflection at the front of the solar cell and reflection from the back electrodes,41 another fraction of the incident light is also transformed into heat, QPV, and the rest of the incident light can be transformed into useable power, PPV. The SOTEG can convert the reflected light from the PV into thermal energy and then to useable power, PTEG. Heat from the SOTEG can also be lost to the environment, QR, due to convection or radiation, for example. In this geometry light transmitted by the solar cell or light reflected by the solar cell, that is not reflected towards the SOTEG, is considered a loss mechanism, PL,PV. Similarly for the SOTEG, light transmitted through the SOTEG or reflected by the SOTEG is a loss mechanism, PL,TEG. In a non-contact transmission geometry (Fig. 1b), a semi-transparent solar cell is placed above the thermoelectric, allowing a fraction of light to be transmitted by the solar cell, PT,PV, which can be absorbed by the SOTEG. Reflection from the solar cell, PL,PV, and heat generated by the solar cell, QPV, are considered loss mechanisms in this geometry.In a contact geometry (Fig. 1c), the solar cell is placed in direct contact with the SOTEG. It should be noted that either an opaque or semi-transparent solar cell can be used in this geometry. In this manner, the heat from the solar cell can be partially transferred to the SOTEG. Moreover, if a semi-transparent solar cell is used, the sub-band gap photons and any non-absorbed light transmitted by the solar cell could be absorbed by the SOTEG. Under illumination, the solar cell will inevitably convert a percentage of incoming light into waste heat through non-radiative recombination. This waste heat can be partially converted into electricity by the SOTEG. If solar cell performance is enhanced with increasing temperature, the contact geometry could be the optimal geometry (see below). A SOTEG in intimate contact with a solar cell will cause an increase in the thermal resistance – i.e. reduce convection – at the backend of the solar cell, thus increasing the temperature of the solar cell. The gain in temperature will improve solar cell efficiency, and the thermal energy converted by the SOTEG will further raise the overall device efficiency.
3.2 Mathematical framework
The overall output power from a hybrid PV-TE device, PH,out, is given by:| PH,out = PPV + PTEG | (1) |
| PTEG = PT,PVηTEG | (2) |
| PTEG = PR,PVηTEG | (3) |
| PTEG = (PT,PV + QPV)ηTEG | (4) |
The TEG device efficiency is defined as
 | (5) |
 | (6) |
 | (7) |
3.3 Selection of materials and systems
To evaluate the potential of organic-based hybrid devices in a general manner, we have looked at a large number of systems. Two complete commercially available photovoltaic cells were compared: an organic module from Infinity PV and a small polycrystalline silicon module. Furthermore, we fabricated free-standing films of commonly used organic photovoltaic materials, which are here used as “filters”. The filters emulate organic solar cells of different compositions and are placed either above or at an angle to the TE materials to absorb below-bandgap photons or reflect light, respectively. As the bandgap of the materials will strongly affect the amount of light reflected or transmitted and, thus, how hot the cell gets, we fabricated optically thick filters of ten different polymers, with bandgaps spanning from 1.43 to 2.56 eV.For the thermoelectric materials, we chose representative organic materials employed in thermoelectrics, namely, doped semiconducting polymers, conducting polymers, carbon nanotubes (CNTs) of the eDIPS type, and polymer:eDIPS composites. Samples were prepared as free-standing films. We prepared films of PBTTT doped with F4TCNQ, PEDOT:PSS treated with DMSO, pure eDIPS CNTs and a eDIPS:cellulose composite [28,29].
In the calculation of the overall efficiencies, reference values of photovoltaic power conversion efficiency (summarized in Table 1) and thermoelectric figure of merit were used.
4. Results and discussion
4.1 Energy available to the TEG
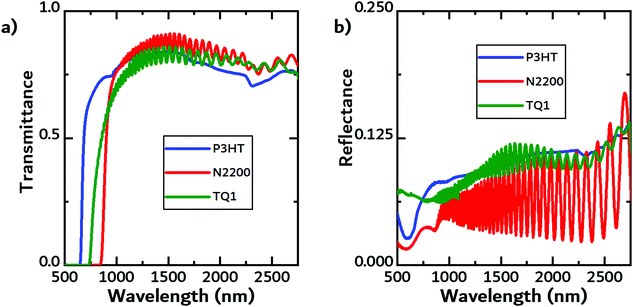
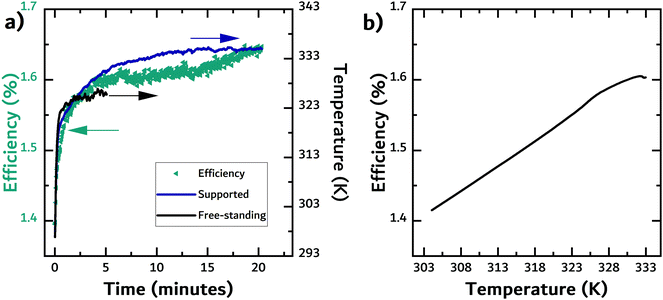
The first source of energy available to the TEG is the fraction of the incident light that is either reflected or transmitted by the photovoltaic cell. Using FTIR, we measured both the transmittance and reflectance of the filter materials. Exemplary transmittance and reflectance data is shown in Fig. 2a and b, respectively, while the data for the other materials can be found in the ESI.†In the contact geometry, the solar cell can be thought of as a heat reservoir with a fixed temperature that is in direct contact with the TEG. Therefore, it is important to evaluate how hot the different cells get. An infrared camera was used to measure the temperature of solar cells (and filters) under constant illumination. While there will be additional loss mechanisms, the temperature rise is here used as a proxy of the efficiency of converting light into heat in the solar cell, i.e. ηPV,PT. In Fig. 3a, the temperature evolution of a free-standing (black line) commercial organic solar cell and the same cell supported on the backside by a block of white PLA (dark blue line) under illumination is shown. In addition, the efficiency of the supported solar cell was recorded. When the solar cell was supported by the white PLA block, the temperature increase was slightly larger than the temperature of the free-standing solar cell. The efficiency of the solar cell increased by almost 20% as the temperature increased by over 30 K. Fig. 3b shows the efficiency of the solar cell as a function of temperature. The enhancement in efficiency could be due to an increase in the mobility of charge carriers.24,53,54 In organic semiconductors the mobility is known to be enhanced because of the temperature dependence on charge transport (temperature-activated hopping). The higher temperature likely contributed to improving charge transport in the active layer and/or the solar cell's ITO-free front electrode. For a commercial Si cell, the expected negative temperature dependence was observed, with efficiency dropping by approximately 20% (see Fig. S1 in the ESI†).
In the next experiment, the temperatures of the free-standing filters and the two commercial solar cells were measured under 1 sun illumination. The equilibrium values are shown in Fig. 4. Temperature rise will be dependent on the material's absorption and thickness. For the commercial Silicon cell, the temperature was measured on the front and backside of the cell to ensure no significant temperature gradient developed through the thickness of the cell, as it was comparably thicker than the rest of the samples measured. Surprisingly, the commercial organic solar cell achieved a temperature of 327 K, the highest temperature of all the materials tested (Fig. 4). It is likely that the PET encapsulation reduced convection losses, thus leading to a higher temperature. N2200, a common non-fullerene acceptor, heated up the most compared to the other solar cell materials likely because of its strong absorption up to 860 nm. Due to the difficulties of measuring the surface temperature of the TE materials when in direct contact with the filters, we instead chose to measure the surface temperature of the free-standing filters. In reality, we believe that this can serve as a lower limit since the temperatures will be higher due to the reduction in convection losses and the SOTEG's ability to absorb light not absorbed by the solar cell. To support our hypothesis, we observed that putting a support material, such as PET or PLA, directly in contact with the filter leads to the filter achieving much higher temperatures (Fig. S2, ESI†).
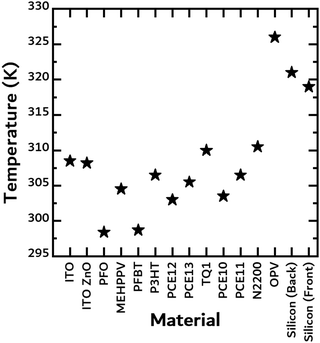 | ||
| Fig. 4 Steady-state temperatures achieved by the free-standing films used as “filters” under 1 sun illumination. | ||
4.2 Conversion of light into heat at the TEG
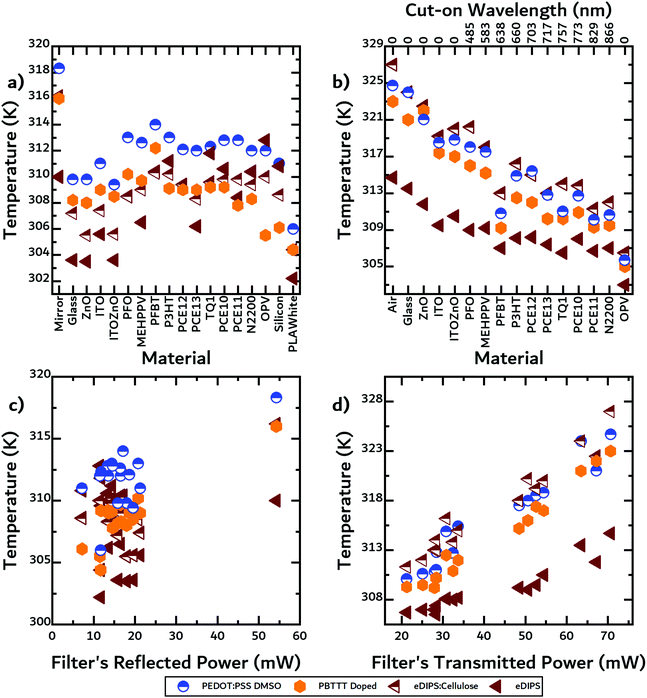
Next, IR thermography was used to quantify the maximum temperatures acquired by the TE materials in each geometry (see Fig. S3, ESI†). In a first step, the filters were placed at an angle of 45 degrees to reflect light towards the TE materials. A thermal power sensor was used to measure the light reflected by the filter, PR,PV in eqn (3). The data for the measured reflected power can be found in Table S1 in the ESI.† As previously mentioned, a solar cell should reflect more than the filters do because of reflection from the metallic back electrode. In Fig. 5a, we observed that the DMSO-treated PEDOT:PSS reached the highest temperatures of all the TE materials. For almost all filters the temperatures were very similar, i.e. ca. a 10 K rise, with two exceptions being in the case of the mirror and the white PLA. The mirror's reflectance is much higher than the rest of the materials, thus reflecting more light onto the OTE materials. Conversely, the PLA's specular reflectance is much lower than the rest of the materials.In a next step, we placed the filters above the TE materials emulating a non-contact transmission geometry and measured the temperature rise of the TE materials. In this configuration, the filters effectively transmit light frequencies below the bandgap to reach (and heat) the TE materials. A thermal power sensor was again used to measure the light transmitted by the filter, PT,PV in eqn (2). In Fig. 5b, we observed that the eDIPS:cellulose composite heated up the most. The composite material exhibits a thermal conductivity of ≈1 W m−1 K−1, which is much lower than the thermal conductivity of the pure eDIPS material (≈10 W m−1 K−1) due to the low thermal conductivity of cellulose.29 This low thermal conductivity is comparable to that of the F4TCNQ-doped PBTTT and DMSO-treated PEDOT:PSS, which are reported to be 0.3 and 0.42 W m−1 K−1, respectively.30,43 In terms of absorption, the composite absorbed strongly in the visible and up to 1200 nm, F4TCNQ-doped PBTTT absorbed strongly in the visible and up to 900 nm, while the DMSO-treated PEDOT:PSS absorbed weakly in the visible but strongly in the IR.28
In Fig. 5b, the cut-on wavelengths for each of the materials are given on the upper x-axis. We observed that temperature rise was strongly correlated with the bandgap of the filters in this geometry, unlike in the non-contact reflection geometry, where there is no apparent correlation between bandgap and temperature rise. We note that the temperature rises in the non-contact reflection geometry were much lower than those observed using a non-contact transmission geometry due to a larger percentage of light being transmitted than reflected. In Fig. 5c and d, the measured reflected and transmitted power by the filter are plotted against the measured temperature rise in the respective geometries.
4.3 TEG efficiencies
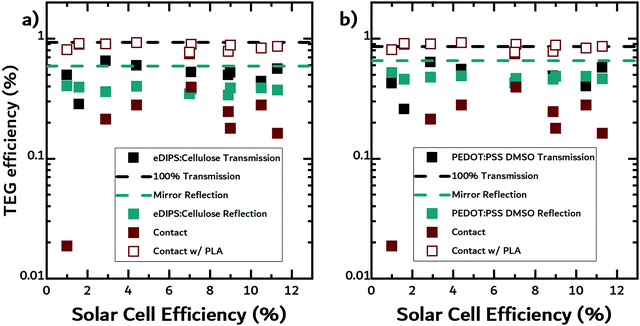
In a working TEG device, the device efficiency is dependent on the geometry of the device and the zT of the n- and p-type materials used in the device. Menon et al. demonstrated radial architectures can enhance the performance of organic TEGs used in waste-heat recovery applications.55,56 It is important to note that in general, n-type materials perform worse than p-type materials and are less stable.56In the next part of this work, we calculated the theoretical TEG efficiencies for the three geometries using eqn (5). We assumed two hypothetical thermoelectric materials with the optical and thermal properties of either eDIPS:cellulose, or DMSO-treated PEDOT:PSS, and a zT value of 0.5, corresponding to a state-of-the-art organic TE material.43 To investigate the relative benefit of using SOTEGs with OPV, we compiled the best reported efficiencies for fullerene solar cells with the donors used as filters in this study (see Table 1). In Fig. 6a and b, we plotted the calculated TEG efficiencies for eDIPS:cellulose and DMSO-treated PEDOT:PSS against the reported OPV efficiencies, using the temperature data from the previous experiments for the hot side, and room temperature for the cold side.
In both figures, the black and cyan dashed lines represent the theoretical upper limits to efficiency in non-contact transmission mode and non-contact reflection mode, respectively. The upper limits in non-contact transmission mode were calculated using temperatures measured when no filter was placed above the TE material, i.e. 100% transmission, while the upper limits in non-contact reflection mode were calculated using temperatures when a mirror reflected light onto the TE materials. Although the mirror does not reflect 100% of light, for our purposes, it is a reasonable approximation of ideal reflection under realistic conditions. The reflectance data for the mirror along with the other materials can be found in the Fig. S3 and S4 in the ESI.† The first observation is that, regardless of the geometry, for both material systems, the TEG efficiencies are much lower than the theoretical limits because the solar cells absorb strongly in the visible.
For the eDIPS:cellulose sample, the TEG efficiencies in non-contact transmission mode (black squares) are slightly higher than in non-contact reflection mode (cyan squares). TEGs, like any heat engine, will naturally have higher efficiencies at higher temperatures. Since less light is reflected than transmitted by the solar cells, the temperature rise is lower, and thus the TEG efficiency is lower.
In contact mode (wine squares), the TEG efficiencies spread over a larger range. On the one hand, the highest theoretical efficiencies appear for this geometry, but then, for a large fraction of the OPV materials studied, the TEG efficiencies are slightly lower than in the other geometries. We are underestimating the temperatures in a real device as we are only measuring the temperature of the free-standing filter, i.e. the solar cell, as opposed to measuring the actual temperature of the TE material. As previously mentioned, it is difficult to measure the temperature of the TE material in contact geometry, so the TEG efficiencies were calculated using the temperature of the filters, which we believe to be the lower limit for this geometry. We expect there to be an additional gain in temperature from the absorption of the TE material and a reduction in convection, thus resulting in higher TEG efficiencies. The latter is fully demonstrated in Fig. S2 in the ESI.† In order to calculate an upper limit for this geometry, we placed the solar cell filters in contact with a slab of PLA to emulate a device with a contact mode geometry and measured temperature rise of the filters. Using these temperatures, we recalculated the thermoelectric efficiencies (open wine squares). We observe that the TEG efficiencies are higher in the contact geometry than in the other two geometries.
For the DMSO-treated sample, the same conclusions as above can be drawn, although the TEG efficiencies in non-contact transmission mode are closer to those in non-contact reflection mode than for the eDIPS:cellulose.
In all cases, the SOTEG efficiencies would be greatly increased by better TE materials. Varying the zT, we can recalculate the TEG efficiencies for all three geometries as seen in Fig. S8 and S9 (ESI†). For a device with a non-contact reflection geometry (Fig. S8a and b, ESI†), eDIPS:cellulose and DMSO-treated PEDOT:PSS would need zTs higher than 2.5 to achieve TEG efficiencies greater than 1%, while a device with a non-contact transmission geometry (Fig. S9a and b, ESI†) would need zTs higher than 1 to achieve TEG efficiencies greater than 1%. In a contact geometry, TEG efficiencies of 1% can be readily attained for materials with zTs higher than 0.5 (Fig. 7).
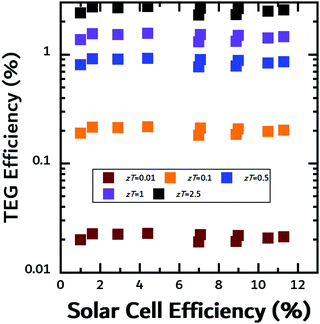 | ||
| Fig. 7 Calculated TEG efficiency in contact mode for various values of zT. Efficiency was calculated using the filter temperature as explained in the text. | ||
While this increase in efficiency may look small at first, it has an important advantage. Compared to other methods mentioned before, such as light management using patterned active layers, or tandem cells, this approach does not increase device complexity. A hybrid PV-TE solid-state device is a rather simple connection of two separately fabricated devices, unlike for example a tandem cell, which is a single, more complex device. For real applications, the increased cost and lower device yield may need to be quantified rigorously to establish the viability of a given approach. The potential increase in OPV power efficiency by the thermal insulating effect of the thermoelectric might be the dominant factor for all but state-of-the-art zT values, at least in the short term.
5. Conclusions
In this work, we evaluated three geometries for organic-based solid-state hybrid PV-TE devices: a non-contact reflection geometry, a non-contact transmission geometry, and a contact transmission geometry. We investigated the optical properties and the temperature rise of all OPV and TE materials in the three aforementioned geometries. With this data, we calculated TEG efficiencies and theoretical SOTEG output power densities. We found that the temperature available to SOTEGs would likely be higher in a transmission geometry than in a reflection geometry and thus leading to higher TEG efficiencies and SOTEG output power densities. Furthermore, a SOTEG in a transmission geometry benefits from operating in contact mode due to the additional temperature gain from the solar cell. Moreover, when a semi-transparent OPV is used, the SOTEG can absorb additional light transmitted by the solar cell. Finally, we observed that the efficiency of a commercial OPV is significantly enhanced at higher temperatures, which could add extra efficiency in a hybrid device.Conflicts of interest
There are no conflicts to declare.Acknowledgements
The authors acknowledge financial support from the Spanish Ministry Science and Innovation through the “Severo Ochoa” Program for Centers of Excellence in R&D SEV-2015-0496 (FUNMAT) and CEX2019-000917-S (FUNFUTURE), and PGC2018-095411-B-I00 (RAINBOW) projects; from the Generalitat de Catalunya through grants 2017SGR488 and AGAUR 2018 PROD 00191; and from the European Research Council (ERC) under grant agreement no. 648901. This project has received funding from the European Union's Horizon 2020 research and innovation program under the Marie Skłodowska-Curie grant agreement no. 713673. J. P. J. has received financial support through the “la Caixa” INPhINIT Fellowship Grant for Doctoral studies at Spanish Research Centers of Excellence (Grant code: LCF/BQ/IN17/11620035), “la Caixa” Banking Foundation (ID100010434), Barcelona, Spain. O. Z. A. acknowledges CONACYT-SENER for his PhD scholarship (no. 472571). J. P. J. acknowledges the departments of Physics, Chemistry and Geology of the Autonomous University of Barcelona (UAB) as coordinators of the PhD programme in Materials Science. The authors thank Dr A. Roig, Dr A. Laromaine and Dr D. Abol-Fotouh (ICMAB-CSIC) for the CNT:cellulose sample preparation and fruitful discussions. The authors thank Dr Aleksandr Perevedentsev for his help with sample preparation, and Mr Pau Molet for his help with the FTIR measurements. We acknowledge support of the publication fee by the CSIC Open Access Publication Support Initiative through its Unit of Information Resources for Research (URICI).References
- T. Duong, H. Pham, T. C. Kho, P. Phang, K. C. Fong, D. Yan, Y. Yin, J. Peng, M. A. Mahmud, S. Gharibzadeh, B. A. Nejand, I. M. Hossain, M. R. Khan, N. Mozaffari, Y. Wu, H. Shen, J. Zheng, H. Mai, W. Liang, C. Samundsett, M. Stocks, K. McIntosh, G. G. Andersson, U. Lemmer, B. S. Richards, U. W. Paetzold, A. Ho-Ballie, Y. Liu, D. Macdonald, A. Blakers, J. Wong-Leung, T. White, K. Weber and K. Catchpole, Adv. Energy Mater., 2020, 10, 1903553 CrossRef CAS.
- K. Yoshikawa, H. Kawasaki, W. Yoshida, T. Irie, K. Konishi, K. Nakano, T. Uto, D. Adachi, M. Kanematsu, H. Uzu and K. Yamamoto, Nat. Energy, 2017, 2, 1–8 CrossRef.
- NREL Best Research-Cell Efficiencies, https://www.nrel.gov/pv/assets/pdfs/best-research-cell-efficiencies.20200406.pdf, (accessed 13 June 2020).
- Y. Cui, H. Yao, L. Hong, T. Zhang, Y. Tang, B. Lin, K. Xian, B. Gao, C. An, P. Bi, W. Ma and J. Hou, Natl. Sci. Rev., 2019, 7, 1239–1246, DOI:10.1093/nsr/nwz200.
- Q. Liu, Y. Jiang, K. Jin, J. Qin, J. Xu, W. Li, J. Xiong, J. Liu, Z. Xiao, K. Sun, S. Yang, X. Zhang and L. Ding, Sci. Bull., 2020, 65, 272–275 CrossRef CAS.
- L. Zuo, X. Shi, S. B. Jo, Y. Liu, F. Lin and A. K.-Y. Jen, Adv. Mater., 2018, 30, 1706816 CrossRef.
- O. Dupré, R. Vaillon and M. A. Green, Sol. Energy Mater. Sol. Cells, 2015, 140, 92–100 CrossRef.
- A. Akbarzadeh and T. Wadowski, Appl. Therm. Eng., 1996, 16, 81–87 CrossRef CAS.
- A. Royne, C. J. Dey and D. R. Mills, Sol. Energy Mater. Sol. Cells, 2005, 86, 451–483 CrossRef CAS.
- L. Zhu, R. F. Boehm, Y. Wang, C. Halford and Y. Sun, Sol. Energy Mater. Sol. Cells, 2011, 95, 538–545 CrossRef CAS.
- G. Mittelman, A. Kribus, O. Mouchtar and A. Dayan, Sol. Energy, 2009, 83, 1322–1334 CrossRef CAS.
- W. Wang, Y. Shi, C. Zhang, S. Hong, L. Shi, J. Chang, R. Li, Y. Jin, C. Ong, S. Zhuo and P. Wang, Nat. Commun., 2019, 10, 1–9 CrossRef.
- K.-T. Park, S.-M. Shin, A. S. Tazebay, H.-D. Um, J.-Y. Jung, S.-W. Jee, M.-W. Oh, S.-D. Park, B. Yoo, C. Yu and J.-H. Lee, Sci. Rep., 2013, 3, 2123 CrossRef.
- N. Wang, L. Han, H. He, N. H. Park and K. Koumoto, Energy Environ. Sci., 2011, 4, 3676–3679 RSC.
- Y. Deng, W. Zhu, Y. Wang and Y. Shi, Sol. Energy, 2013, 88, 182–191 CrossRef.
- J. J. Lee, D. Yoo, C. Park, H. H. Choi and J. H. Kim, Sol. Energy, 2016, 134, 479–483 CrossRef CAS.
- B. Lorenzi and G. Chen, J. Appl. Phys., 2018, 124, 024501 CrossRef.
- D. Kraemer, L. Hu, A. Muto, X. Chen, G. Chen and M. Chiesa, Appl. Phys. Lett., 2008, 92, 243503 CrossRef.
- D. Kraemer, B. Poudel, H.-P. Feng, J. C. Caylor, B. Yu, X. Yan, Y. Ma, X. Wang, D. Wang, A. Muto, K. McEnaney, M. Chiesa, Z. Ren and G. Chen, Nat. Mater., 2011, 10, 532 CrossRef CAS.
- X. Ju, Z. Wang, G. Flamant, P. Li and W. Zhao, Sol. Energy, 2012, 86, 1941–1954 CrossRef CAS.
- E. A. Katz, D. Faiman, S. M. Tuladhar, J. M. Kroon, M. M. Wienk, T. Fromherz, F. Padinger, C. J. Brabec and N. S. Sariciftci, J. Appl. Phys., 2001, 90, 5343–5350 CrossRef CAS.
- G. Chen, C. Si, Z. Tang, K. Guo, T. Wang, J. Zhang and B. Wei, Synth. Met., 2016, 222, 293–298 CrossRef CAS.
- G. Bardizza, E. Salis, C. Toledo and E. D. Dunlop, Prog. Photovoltaics Res. Appl., 2020, 28, 593–600, DOI:10.1002/pip.3234.
- C. Deibel, A. Wagenpfahl and V. Dyakonov, Phys. Status Solidi RRL, 2008, 2, 175–177 CrossRef CAS.
- S. Züfle, N. Christ, S. W. Kettlitz, S. Valouch and U. Lemmer, Appl. Phys. Lett., 2010, 97, 063306 CrossRef.
- C. M. A. Lopes and M. I. Felisberti, Polym. Test., 2004, 23, 637–643 CrossRef CAS.
- H. R. Shanks, P. D. Maycock, P. H. Sidles and G. C. Danielson, Phys. Rev., 1963, 130, 1743–1748 CrossRef CAS.
- J. P. Jurado, B. Dörling, O. Zapata-Arteaga, A. Roig, A. Mihi and M. Campoy-Quiles, Adv. Energy Mater., 2019, 9, 1902385 CrossRef CAS.
- D. Abol-Fotouh, B. Dörling, O. Zapata-Arteaga, X. Rodríguez-Martínez, A. Gómez, J. S. Reparaz, A. Laromaine, A. Roig and M. Campoy-Quiles, Energy Environ. Sci., 2019, 12, 716–726 RSC.
- O. Zapata-Arteaga, B. Dörling, A. Perevedentsev, J. Martín, J. S. Reparaz and M. Campoy-Quiles, Macromolecules, 2020, 53, 609–620 CrossRef CAS.
- C. J. Glassbrenner and G. A. Slack, Phys. Rev., 1964, 134, A1058 CrossRef.
- J. Sun and J. J. Jasieniak, J. Phys. D: Appl. Phys., 2017, 50, 093001 CrossRef.
- I. Jeon, C. Delacou, A. Kaskela, E. I. Kauppinen, S. Maruyama and Y. Matsuo, Sci. Rep., 2016, 6, 1–9 CrossRef.
- E. Pascual-San-José, G. Sadoughi, L. Lucera, M. Stella, E. Martínez-Ferrero, G. E. Morse, M. Campoy-Quiles and I. Burgués-Ceballos, J. Mater. Chem. A, 2020, 8, 9882–9895 RSC.
- M. M. Mandoc, L. J. A. Koster and P. W. M. Blom, Appl. Phys. Lett., 2007, 90, 133504 CrossRef.
- B. Lipovšek, A. Čampa, F. Guo, C. J. Brabec, K. Forberich, J. Krč and M. Topič, Opt. Express, 2017, 25, A176 CrossRef.
- W. C. H. Choy, W. K. Chan and Y. Yuan, Adv. Mater., 2014, 26, 5368–5399 CrossRef CAS.
- A. Harillo-Baños, X. Rodríguez-Martínez and M. Campoy-Quiles, Adv. Energy Mater., 2020, 10, 1902417 CrossRef.
- L. Meng, Y. Zhang, X. Wan, C. Li, X. Zhang, Y. Wang, X. Ke, Z. Xiao, L. Ding, R. Xia, H.-L. Yip, Y. Cao and Y. Chen, Science, 2018, 361, 1094 LP–1098 LP CrossRef.
- G. Liu, J. Jia, K. Zhang, X. Jia, Q. Yin, W. Zhong, L. Li, F. Huang and Y. Cao, Adv. Energy Mater., 2019, 9, 1803657 CrossRef.
- Z. Tang, W. Tress and O. Inganäs, Mater. Today, 2014, 17, 389–396 CrossRef CAS.
- D. Kraemer, Q. Jie, K. Mcenaney, F. Cao, W. Liu, L. A. Weinstein, J. Loomis, Z. Ren and G. Chen, Nat. Energy, 2016, 1, 1–8 Search PubMed.
- G. H. Kim, L. Shao, K. Zhang and K. P. Pipe, Nat. Mater., 2013, 12, 719–723 CrossRef CAS.
- S. Alem, R. De Bettignies, J. M. Nunzi and M. Cariou, Appl. Phys. Lett., 2004, 84, 2178–2180 CrossRef CAS.
- W.-J. Yoon and P. R. Berger, Appl. Phys. Lett., 2008, 92, 13306 CrossRef.
- N. Y. Doumon, M. V. Dryzhov, F. V. Houard, V. M. Le Corre, A. Rahimi Chatri, P. Christodoulis and L. J. A. Koster, ACS Appl. Mater. Interfaces, 2019, 11, 8310–8318 CrossRef CAS.
- Y. Kim, H. R. Yeom, J. Y. Kim and C. Yang, Energy Environ. Sci., 2013, 6, 1909–1916 RSC.
- PTB7-Th (PCE10) | PBDTTT-EFT | 1469791-66-9 | Ossila, https://www.ossila.com/products/pce10?_pos=2&_sid=1a5323ea4&_ss=r&variant=31832978391136, (accessed 18 June 2020).
- Y. Liu, J. Zhao, Z. Li, C. Mu, W. Ma, H. Hu, K. Jiang, H. Lin, H. Ade and H. Yan, Nat. Commun., 2014, 5, 5293 CrossRef CAS.
- J. Hou, O. Inganäs, R. H. Friend and F. Gao, Nat. Mater., 2018, 17, 119–128 CrossRef CAS.
- J. J. Benson, Imperial College London, 2007.
- Ł. Bernacki, Z. Lisik and B. Łuszczyńska, Prz. Elektrotech., 2015, 1, 15–17 CrossRef.
- B. Ebenhoch, S. A. J. Thomson, K. Genevičius, G. Juška and I. D. W. Samuel, Org. Electron., 2015, 22, 62–68 CrossRef CAS.
- D. J. Coutinho, G. C. Faria, D. T. Balogh and R. M. Faria, Sol. Energy Mater. Sol. Cells, 2015, 143, 503–509 CrossRef CAS.
- A. K. Menon and S. K. Yee, J. Appl. Phys., 2016, 119, 055501 CrossRef.
- A. K. Menon, O. Meek, A. J. Eng and S. K. Yee, J. Appl. Polym. Sci., 2016, 134, 44060, DOI:10.1002/app.44060.
Footnote |
| † Electronic supplementary information (ESI) available: Appendix A, Additional temperature dependence expirements, reflectance and tansmittance data and calculated TEG efficiencies. See DOI: 10.1039/d0tc05067a |
| This journal is © The Royal Society of Chemistry 2021 |

