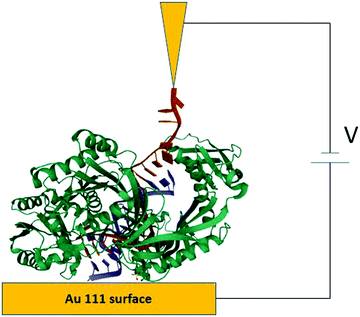
 Open Access Article
RNA BioMolecular Electronics: towards new tools for biophysics and biomedicine
Keshani G. Gunasinghe
Pattiya Arachchillage†
,
Subrata
Chandra†
,
Angela
Piso
,
Tiba
Qattan
and
Juan M.
Artes Vivancos
 *
*
Department of Chemistry, University of Massachusetts Lowell, One University Ave, 01854 Lowell, MA, USA. E-mail: juan_artesvivancos@uml.edu; Tel: 9789344337
First published on 8th September 2021
Abstract
The last half-century has witnessed the birth and development of a new multidisciplinary field at the edge between materials science, nanoscience, engineering, and chemistry known as Molecular Electronics. This field deals with the electronic properties of individual molecules and their integration as active components in electronic circuits and has also been applied to biomolecules, leading to BioMolecular Electronics and opening new perspectives for single-molecule biophysics and biomedicine. Herein, we provide a brief introduction and overview of the BioMolecular electronics field, focusing on nucleic acids and potential applications for these measurements. In particular, we review the recent demonstration of the first single-molecule electrical detection of a biologically-relevant nucleic acid. We also show how this could be used to study biomolecular interactions and applications in liquid biopsy for early cancer detection, among others. Finally, we discuss future perspectives and challenges in the applications of this fascinating research field.
Introduction
From before the 1980s and especially during the 90s, materials science in general, and nanoscience and nanotechnology in particular, have promised multiple applications enabled by an unprecedented control of matter. One of them is the ultimate miniaturization of electronic components and circuits to the scale of individual molecules. This exciting field is known as Molecular Electronics.Molecular Electronics started almost 50 years ago when Aviram and Ratner predicted the first molecular rectifier (Fig. 1, top) in their seminal theoretical work.1 During the last half century, a myriad of theoretical and experimental results have been published studying the many aspects of molecular electronics.
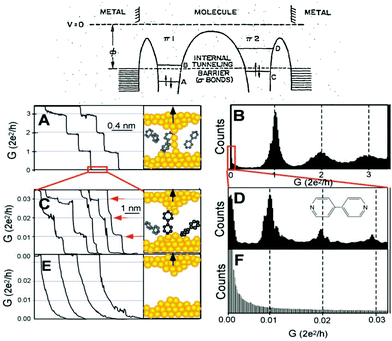 | ||
| Fig. 1 Top: Aviram and Ratner's proposed molecular diode diagram. Reproduced with permission from ref. 1. Bottom: The STMBJ current-distance method applied to bipyridine. (A) Conductance of a gold contact formed between a gold STM tip and a gold substrate decreases in quantum steps near multiples of G0 (=2e2/h) as the tip is pulled away from the substrate. (B) A corresponding conductance histogram constructed from 1000 conductance curves as shown in (A) shows well-defined peaks near 1G0, 2G0, and 3G0 due to conductance quantization. (C) When the contact shown in (A) is completely broken, corresponding to the collapse of the last quantum step, a new series of conductance steps appears if molecules such as 4,4′ bipyridine are present in the solution. These steps are due to the formation of the stable molecular junction between the tip and the substrate electrodes. (D) A conductance histogram obtained from 1000 measurements as shown in (C) shows peaks near 1×, 2×, and 3 × 0.01G0 that are ascribed to one, two, and three molecules, respectively. (E and F) In the absence of molecules, no such steps or peaks are observed within the same conductance range. Reproduced with permission from ref. 19. | ||
Theories for how charges transfer and transport in molecules developed2–8 in parallel with the experimental developments. The multiple theoretical and experimental methods used during the years, beyond the scope of this perspective, can be found in review papers9–14 and books.15–18 The field experienced a boom when the electronic conductance of individual molecules bound between electrodes could be measured reliably. Two main approaches were reported to achieve this, the current-distance19 and the current-time20 scanning tunneling microscope21 break-junction (STMBJ) approaches. The current-distance STMBJ (Fig. 1b) has been the most widely used. With this method, the STM tip is brought to contact and retracted from the sample several times while the current is recorded. When a molecule gets bound, a step appears, interrupting the exponential decay in the current-distance trace. This current (I) can be related to conductance (G) by G = I/V, with V being the voltage, and conductance histograms can be constructed by acquiring thousands of curves to statistically determine an individual molecule's conductance22 (see Fig. 1, bottom left panels). This method has the advantage of providing a relatively high yield and statistics. In the current-time method, the STM tip is brought to a fixed distance from the sample surface. The current is then recorded while molecules diffuse in the tunneling gap.20 When a molecule binds to both electrodes, a sudden jump is observed in the current trace that can be used to determine single-molecule conductance using the same approach and equation above. This method provides less yield and statistics but is unique to study the spontaneous formation of molecular junctions.
Primarily, molecular electronics techniques have been used to study charge transport through small molecules to demonstrate several single-molecule electronic devices, including diodes,23,24 transistors,25–27 potentiometers,28 … In the next section, we will see that they have also been applied to relatively more complex biomolecules (see the next section). Beyond demonstrating electronic devices, these techniques have been refined to study the effects of chemical binding and linking groups,29 the configuration of the binding atoms in the electrode surface,30 and even chemical reactions electrocatalyzed at the individual molecule level.31
Despite all these advances, nanotechnologies consisting of electronic devices based on individual molecules remain elusive and constitute one of the broken promises of modern nanoscience, nanotechnology, and materials science in general. However, we envisage that the intersection between these fascinating fields and biology may offer opportunities to move these ideas closer to reality. This perspective article aims to introduce the basics of BioMolecular electronics and propose new and potential biomolecular electronics applications that may be crucial for society's challenges.
BioMolecular Electronics
Shortly after opening the door for reliable single-molecule conductance measurements, biomolecules were considered as the subject of these studies, too, primarily short peptides32 and oligonucleotides.33 This quickly expanded to larger biomolecules,34–36 including redox proteins26,37 and even some larger complexes.38 We briefly review a protein example below before focusing on oligonucleotides and BioMolecular Electronics applications.Proteins: the case of azurin
The STM-BJ approach19 was used to perform conductance measurements on the redox protein azurin (Fig. 2).26 Azurin is a small protein from Pseudomonas aeruginosa that constituted the benchmark for charge transfer in proteins during the 90s in theoretical and experimental research (electrochemical and photochemical bulk studies).39–41 The results showed current steps comparable to those found in studies performed on organic molecules with simpler structures, indicating that azurin can establish a junction bridging two electrodes.26 Conductance histograms obtained at different electrochemical potentials demonstrated that azurin conductance is related to the redox behavior of the protein, as control measurements performed on non-redox Zn–azurin showed no such dependence. The dependence of azurin conductance on electrochemical potentials is consistent with a multistep charge transport model.7 A numerical version of the model42 was used to fit the data and obtain parameters describing the charge transport (CT) process. The conductance in the junction is controlled by the alignment of the Fermi levels of the electrodes with the energy level of the redox center, in analogy to a field effect transistor. This constituted a proof of concept transistor based on a single protein. Further research helped to obtain other parameters, like the transition voltage,43,44 studying azurin mutants,14,45 and azurin interacting with the redox partner.46 Developments over the last decades show that STM-assisted molecular junctions are a vital tool for molecular and bioelectronics. These applications to study single protein conductance opened the doors for future investigations on more complex biological samples that constitute ongoing research.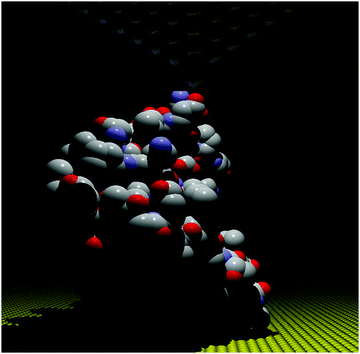 | ||
| Fig. 2 Idealized all atom representation of an azurin junction contacted between two STM electrodes. Figure built using the pdb structure 1AZU,47 Rasmol,48 and PoV-Ray,49 | ||
Nucleic acids
Just ten years after the discovery of the structure of DNA,50 it was suggested that the stacking of the orbitals of the bases of double stranded DNA (dsDNA) could lead to conductive behavior.51 Since then, several theoretical and experimental studies have addressed the question of the electronic conductance in DNA, leading to exciting findings and a still ongoing discussion.DNA CT has been an active field of study for many years. How the charges move through oligonucleotides is a question that has been addressed using diverse techniques, including bulk and single-molecule approaches, in environments ranging from ultra-high vacuum to solid-state configurations in air, as well as experiments in buffer and electrochemical environments.33,34,52–60
DNA bases have been found to participate and mediate CT in optical, electrochemical, and single-molecule approaches.53 However, in a recent study, it is suggested that CT could also be mediated by the backbone.60 Further research is needed to demonstrate if the backbone is playing any direct role in the DNA CT process. Despite not having a clear, unified picture of the CT process in DNA, it is now clear that CT plays an essential role in some DNA biological processes.53,61 For example, CT in DNA is fundamental in DNA oxidative processes, like oxidative damage and its repair related to many widespread diseases.61 But, probably due to the different variety of conditions, various lengths, and sequences used in the experiments, results of DNA conductance reported in the literature spanned a vast range differing in orders of magnitude. Just to cite some examples, DNA was reported to be insulating,54,62 semiconducting,56 conducting,57 and even superconducting.58
Nevertheless, despite all these different results, discarding disagreements due to diverse experimental conditions and extreme molecular differences, some consensus was achieved about the mechanisms for CT in individual DNA molecules. Fig. 3 shows the different determinants for single-molecule DNA conductance. In general, except in one report,60 it has been observed that a double-helix is needed to transport charges due to the base stacking providing the orbitals with energy levels mediating the transfer. Initially, the electronic conductance was believed to depend mainly on sequence and length, based on the results observed in DNA33 and other progressively longer molecules.64 GC-rich sequences tended to give a smoother decay of G with the distance, suggesting a hopping charge transfer, while ATs introduced a higher resistance for the charges, suggesting a tunneling charge transport mechanism. Similarly, a transition from tunneling to hopping is suggested with increasing lengths. Several variations and subtleties on these two extremes have been proposed over the years (i.e. see ref. 12, 65 and 66), but discussing the particular details is beyond the scope of this perspective. Theoretical studies suggested from early years that effects such as the structure and conformation of DNA may modulate the conductance.6,67 After a decade of single-molecule DNA measurements, new effects were described (Fig. 3c), suggesting that the conformation of the sequence59,68–70 and the delocalization of the density of electronic states59,63 over more than one base pair also play essential roles in determining the conductance of DNA oligonucleotides. As a consequence of the base stacking being the central mediator of the CT process, mismatches in the base-pairing can profoundly affect oligonucleotides' conductance.34,71 The conductance of the molecule can change by an order of magnitude, depending on the nature of the base substitution.34
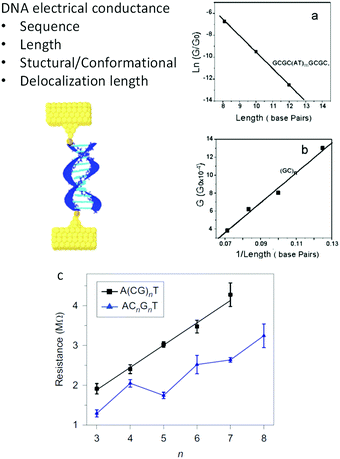 | ||
| Fig. 3 Factors determining DNA conductance. (a) Natural logarithm of DNA conductance vs. length (total number of base pairs). The solid line is a linear fit that reflects the exponential dependence of the conductance on length. The decay constant is determined from the slope of the linear fit. (b). Conductance of (GC)n vs. 1/length (in total base pairs). Reproduced with permission from ref. 33. (c) Resistance of alternating (black squares) and stacked (blue triangles) G DNA sequences versus the number of CG in the sequences. The stacked sequences have smaller resistance values than alternating sequences, and an oscillation is superimposed on the linear trend. Error bars are standard deviations calculated from three to four sets of experiments for each individual sequence. Reproduced with permission from ref. 63. The scheme in the left was adapted with permission from ref. 59. | ||
Despite this consensus, there are several remaining unknowns about the electrical conductance of DNA; What is the precise role of the backbone? Which one is the CT mechanism for each length? Is there a mechanism explaining all the effects? Is it possible to predict the electrical conductance from the DNA sequence in complex structures such as DNA origami or other NA nanostructures?
Further research is necessary to complete our understanding since experiments with individual oligonucleotides keep showing surprising results (see below).
DNA:RNA: a different length and sequence dependence
One would expect DNA:RNA hybrid molecules (a DNA chain hybridized with an RNA) would have similar or identical conductance as a dsDNA with the same sequence, but the initial experiments with simple GC-rich DNA:RNA sequences showed recently that their electrical conductance was one order of magnitude higher than the one of dsDNA for the same sequence.72Fig. 4 shows simulations done to rationalize the experimental results showing DNA:RNA having one order of magnitude higher conductance than the dsDNA counterpart.72 Briefly, results and simulations demonstrated that this different conductance is mainly due to DNA:RNA hybrids being in the A-form (Fig. 4a) conformation, while dsDNA is in the B-form (Fig. 4b). In contrast with some early theoretical calculations that suggested the opposite trend6 (it is worth noting that this study did not include the backbone in the computation), A-form is more compact and allows for the delocalization of the HOMO over more base pairs (see Fig. 4),59,72 resulting in a higher conductance.
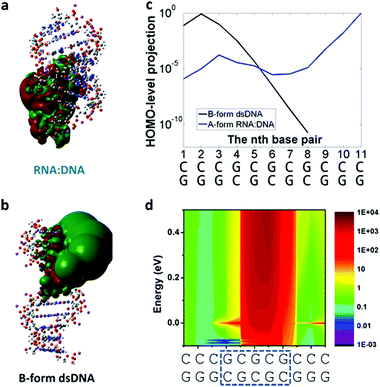 | ||
| Fig. 4 DNA:RNA conductance in GC-rich sequences. Results from charge-transport simulations of 11-bp RNA:DNA and B-form dsDNA. (a and b) 3D isosurface of the HOMO orbital (isovalue = 2 × 10⁻⁵) on the oligonucleotide structures for RNA:DNA and B-form dsDNA. (c) Projection of the HOMO level onto each of the base pairs in the A-form RNA:DNA (blue solid line) and B-form dsDNA (black solid line). There is no contribution to the HOMO level for the 9th to 11th base pairs in dsDNA. (d) 2D representation of the ratio of the total density of states (DoS) along the molecule between RNA:DNA hybrids and B-form dsDNA for an energy ranging from HOMO−0.1 to 0.5 eV above HOMO level. Reproduced with permission from ref. 72. | ||
Another surprise in the first DNA:RNA conductance reports was the length dependence of adenine-stacked sequences.73 Adenine-rich sequences favored a tunneling component and a sharp decay of the conductance for increasing lengths in dsDNA measurements33 but resulted in nearly length-independent and a long-range conductance73 in DNA:RNA hybrids (Fig. 5).
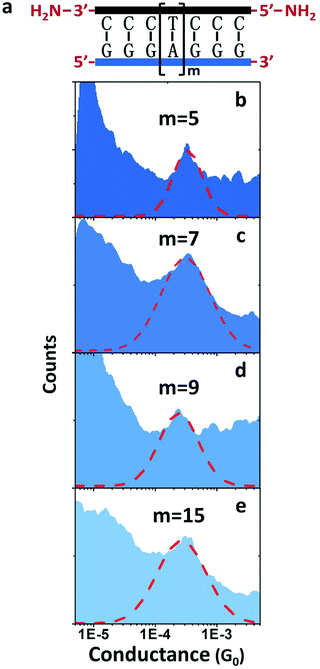 | ||
| Fig. 5 DNA:RNA conductance in adenine-rich sequences. Conductance measurements of adenine-stacked RNA:DNA hybrids. (a) Illustration of the GGG-Am-GGG RNA:DNA hybrids. (b–e) Conductance histograms of four RNA:DNA hybrids (m = 5, 7, 9, and 15, respectively). Red dashed line shows the Gaussian fitting of each peak. Reproduced with permission from ref. 73. | ||
The behavior of AT-rich sequences shown in Fig. 5 reflects virtually the same conductance for sequences ranging from eleven to twenty-one base pairs. This is indicative of a hopping CT mechanism,73 but a deeper analysis of this length dependence resulted in the conclusion that the most likely mechanism is hopping with the hopping site being delocalized over several base pairs.63 Specifically, it is 1.3 nm, or five bases for the sequence shown in Fig. 5.73
In summary, STMBJ measurements in individual oligonucleotides have established the main determinants for single-molecule conductance in dsDNA and DNA:RNA hybrids.59,71–73 However, some knowledge gaps remain and more studies are needed to characterize the CT process in oligonucleotides completely; e.g., the conductance of dsRNA or those from sequences containing uracil have not been systematically studied yet. Nevertheless, the research has already paved the way for single-molecule devices, biosensors, and several other applications (see below). In the following sections, we introduce some emerging applications of BioMolecular Electronics. The initial ones correspond to new applications recently reported, while others are potential applications representing ongoing research.
Some examples of applications and potential applications: a single-molecule biosensor for foodborne bacteria
The electrical detection of individual RNA molecules in solution described above allows for the ultra-sensitive detection of sequences in complex environments.71,74 Knowing the particular target sequence (i.e., specific for some organism), one can design a complementary probe functionalized to bind electrodes and close the “circuit” (Fig. 6), with the conductance detected being characteristic for the target sequence and sensitive to changes in length,72 conformation,59 and changes in the base-pairing.34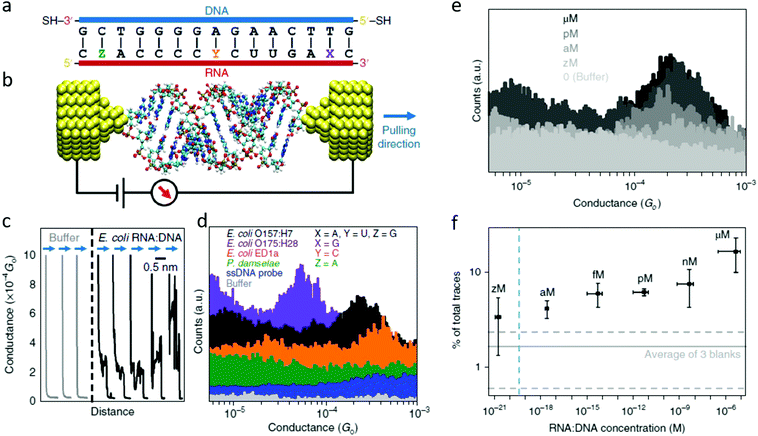 | ||
| Fig. 6 The first single-molecule electrical study on a biologically-relevant oligonucleotide. (a) Schematic of the 15 bp RNA:DNA sequences studied. The blue side represents the DNA probe with thiol linkers, and the red side represents the RNA sequences targeted. For E. coli O157:H7 X = A, Y = U, and Z = G (perfectly matched). In the other three cases a mismatch is present. For E. coli O175:H28 X = G, for E. coli ED1a Y = C and for Photobacterium damselae Z = A. (b) Idealized schematic of the experimental set-up showing the RNA:DNA molecule bound between two gold electrodes. (c) Representative conductance versus distance traces obtained from the O157:H7 hybrids during break junction measurements. The black curves (with steps) are measured when a molecule binds between the electrodes; and the grey curves occur when no molecules bind. All curves are offset horizontally for clarity. (d) Conductance histograms for the four RNA:DNA hybrids and two control experiments performed for the single-stranded DNA probe and blank buffer. Histograms are offset vertically for clarity. A total of 5000 traces were collected for each sample. (e) Representative histograms measured at various concentrations of the O157:H7 sequence. The control experiment in buffer solution shows no peak in the histogram. (f) Dependence of trace selection on the concentration of target molecules, showing the percentage of traces with steps at varying concentrations. Horizontal error bars show the final RNA:DNA hybrid concentration range from three independent experiments. Vertical error bars represent the percentage of curves showing steps from three independent measurements. Dashed horizontal lines represent the typical percentage of curves selected in sodium phosphate buffer without adding RNA:DNA hybrids. The vertical dashed line depicts the theoretical concentration where a single molecule would exist in the sample volume. Adapted with permission from ref. 71. | ||
Traditional approaches for detecting microorganisms often require time-consuming cell-culturing steps before detection and identification, and, while nucleic acid-based methods provide better specificity (mutants, different strains, and pathogenic serotypes can be differentiated), the detection of nucleic acids almost always requires enzymatic amplification through approaches such as PCR.75 The electrical detection of RNA can obviate the need for amplification steps and enable the detection of particular sequences in complex and dilute environments (Fig. 6).71
Fig. 6 shows the first single-molecule electrical detection approach applied to particular E. coli strains. These experiments focused on identifying specific strains of Escherichia coli.76 Many E. coli strains are pathogenic and produce one or more forms of Shiga toxin.77 This approach targeted a particular region of mRNA that partially encodes for the Shiga toxins. RNA was specifically targeted instead of DNA for different reasons, as introduced above:
• RNA transcription within the cells naturally amplifies these targets during the interphase of the cell cycle, thus naturally creating more RNA for detection, which in turn may remove the necessity of performing PCR-based amplification or cell-culturing steps.
• Many pathogens have RNA genomes78
• RNA fragments can provide direct information about gene activity and cell viability.
Note that this approach is entirely different from electrical sequencing technologies based on ionic currents; the charge transports through the bases, parallel to the strand in this case, while in sequencing approaches, one aims either to block the ionic current in a nanopore with the NA or to measure the CT perpendicular to each base. This single-molecule biosensor can detect known sequences quickly and sensitively, but is not designed to figure out new sequences. Recently, some efforts have been developed to adapt this technology to sequencing applications, using BioMolecular Electronics with the aid of machine learning data treatment.79
As a single-biomolecule sensor, this application shows remarkable specificity able to discern single-base mismatches. The histograms in Fig. 6d show that changes in an individual base can dramatically affect electrical conductance. While the wild-type (perfect match) sequence for the pathogenic E. coli O157:H7 results in a conductance around 2.5 × 10⁻⁴G0 (with G0 being the conductance quantum, G0 = 2e2/h), changing an adenine to guanine close to the 3′ in the RNA fragment causes the conductance to drop to a fifth of that value, allowing for detecting of this other pathogenic E. coli strain. In contrast, when guanine is exchanged for an adenine close to 5′ (a P. damselae sequence), the conductance is not detectable in this experimental range. Another surprising result was found when changing uracil in the central part of RNA for a cytosine (a sequence for the non-pathogenic E. coli ED1), resulting in an electrical conductance of 5 × 10⁻⁴G0. This is remarkable since it is counter-intuitive; affecting the base pairing in the middle of the sequence, instead of affecting the CT pathway, somehow favors it. This manifests that the conductance is a complex magnitude difficult to predict from the starting sequence and was explained thanks to molecular dynamics simulations coupled to ab initio CT calculations. The computations showed that this particular change affected the molecule's energy levels, bringing it closer to the energy level of the electrodes, resulting in a situation closer to resonance and thus a higher electrical conductance.71
Besides the high specificity allowing the distinction of different sequences from different strains differing in only one base pair, this method also has the advantage of extremely high sensitivity. Fig. 6e shows conductance histograms obtained from experiments performed at different RNA concentrations ranging from extremely low (zM, 10−21 M) to micro. The selectivity (number of conductance traces included in the histogram) scales proportionally with the concentration. A titration for the selectivity (Fig. 6f) allows finding the limit of detection for this proof-of-concept single-molecule sensor to be in the attomolar range. Table 1 shows a comparison of the Limit of Detection (LOD) of this novel biosensor to typical sensor performance indicators in the literature.
This, together with other indicators of sensor performance (the possibility of detecting the target RNA in the presence of interfering sequences71 and complex environments74), shows a proof-of-concept single-molecule biosensor that has enormous potential impact in diverse fields related to human health. This method's possible future benefits go from detecting potential pathogens before they cause catastrophic epidemics to the early detection of biomarker sequences related to cancer (see the last section).
Some present roadblocks for these new applications are the lack of single-molecule conductance measurements for RNA from human origin and the challenges in miniaturizing these single-molecule devices, despite recent advances in miniaturization and microfabrication of electromechanical molecular break-junctions systems.80,81 See the last section for more details.
Electrical measurement of biomolecular interactions at the single-molecule level
The advances described above are not limited to engineering applications in biosensors and nano detectors but could also open new possibilities for single-molecule biophysical measurements. Biomolecular interactions and their analysis are at the core of a wide range of disciplines like biochemistry, biotechnology, and medicinal chemistry. These dynamic interactions are the key to all cellular functions and understanding those interactions between biomolecules could be vital to elucidate the molecular basis of many diseases. Single-molecule techniques (mostly optical approaches) have emerged as powerful tools for deciphering these interactions.85Comparing single-molecule results with the known behavior of the cellular interactions in bulk has also remained a challenge for scientists over the years. STM-BJ methods could also be used to study the fundamentals of biophysical interactions at the single-molecule level. Therefore, BioMolecular Electronics methods based on scanning probe microscopies are promising single-molecule approaches for measuring electron transport between biomolecules and in biomolecular complexes. This molecular-level biophysical study could also be a concept validation for different single biomolecule-based sensors, not necessarily based on nucleic acids, if using interactions such as the one between antigen and antibody (Ag–Ab).
Measuring Ag–Ab interactions
Antigen–antibody interactions are a textbook example of biomolecular interactions.86 The strength of the interaction between antibody (Ab) and antigen (Ag) depends on the affinity and the specificity of the binding.86,87 In addition, depending on the number of binding sites and conformations at the molecular level, the strength of the binding may vary.88There exist several bulk methods for detecting these Ag–Ab interactions. These include immuno-rolling circle amplification,89–91 immuno-hybridization chain reaction,92 electrochemical impedance spectroscopy,93,94 proximity ligation assay,95 and surface plasmon resonance,96 among others. Recent studies have also shown that, in addition to these bulk methods, scanning tunneling microscopy can act as a promising electrical tool for studying these biomolecules on surfaces.97–100 Though researchers have addressed particular individual Ag–Ab complexes and their dynamics,98 we still lack a quantitative study of these biomolecular interactions at the molecular level and examining how the antigen binding site may affect the conductance pathway. STM methods have also allowed measuring single molecular electron transport properties between redox proteins,46 but STM-BJ measurements of biomolecular interactions and statistical biomolecular interaction conductance have not been reported to date. Using these measurements, one could bridge the single-molecule behavior to the known bulk results.
Antibodies are Y-shaped proteins with different binding domains (Fig. 7). They can form a conducting bridge by binding a pair of electrodes,97 making the system perfect for STM-BJ measurements. By measuring the electrical conductance of individual Ag–Ab complexes, one could get a molecular fingerprint to characterize them. Fig. 7 shows an idealized diagram of a single-molecule junction formed between and antibody and two electrodes. Measurements in the presence and absence of the antigen could help elucidate if the antigen affects the conductance pathway, and this may demonstrate a single-biomolecule biosensor based on Ag–Ab interactions. This kind of single-biomolecule electrical biosensors could be invaluable for human health and environmental monitoring.101
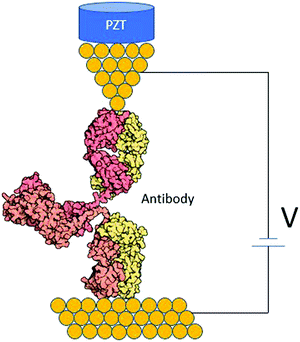 | ||
| Fig. 7 STM biomolecular break junction formed by an individual antibody between two gold electrodes. | ||
Understanding the biomolecular interactions in the RISC complex at the nanoscale
A far more complex system with crucial biomolecular interactions is the RNA-Induced Silencing Complex (RISC). The RISC is a multiprotein complex that uses the siRNA or miRNA as a template for recognizing complementary mRNA.102 When it finds a complementary strand, it activates RNase to cleave mRNA. siRNAs function post-transcriptionally by base-pairing to the mRNA 3′-untranslated regions to repress protein synthesis.102,103 The main components of the RISC are the nucleic acids, the proteins DICER, TRBP (RNA binding protein), PACT, and, most importantly, Argonaute 2 (AGO2).104 BioMolecular Electronics measurements could also be used for having a complete understanding of these dynamic processes and measuring the interactions between different components of the RISC complex.105Some recent studies support the fact that some phase-separated systems inside the cell are associated with transcription regulation and other biological functions. Processing bodies (P-bodies) are one of these phase-separated cytoplasmic ribonucleoprotein complexes, primarily composed of translationally repressed mRNAs and proteins.106 They are induced by cellular stress and related to mRNA decay.106 These phase-separated systems are associated with many diseases,107 including cancer, neurodegeneration, and some infectious diseases.
Fig. 8 shows an advanced potential application of BioMolecular Electronics, where a nucleic acid bound between electrodes, in turn, binds to Ago2. With such a system, one could have a clear insight into the binding geometry between the different components of the RISC complex and obtain electrical fingerprints for each case. One could construct the respective conductance histograms and get electrical fingerprints by measuring the conductance values for ds RNA and Ago2–dsRNA complexes. These fingerprints could be related to single-complex thermodynamic and kinetic information of these complexes responsible for gene silencing. This information could be crucial to predicting the design and delivery strategies for silencing human disease factors using RNAi.
In the future, the application of single-molecule techniques for the measurement of gene expression in individual cells could provide many new insights into the field of gene silencing.108
A potential biomedical application: electrical cancer detection in liquid biopsies
Cancer is a significant healthcare problem and constitutes one of the most frequent causes of death globally.109 Unfortunately, many cancer cases are recognized too late, and this late-stage diagnosis results in higher fatality rates. Thus, there is a clear need for detection methods capable of detecting early stages since this could enable early treatments, potentially saving many lives.110A promising approach for early detection is the use of cancer biomarkers in body fluids through liquid biopsies.111 Liquid biopsy is an analytically sensitive body fluid test that allows analyzing body fluids such as blood samples for cancer-specific biomarkers. It can be used to discriminate tumor cells easily among billion healthy cells.112 Blood samples, or other body fluids, can contain circulating free tumor nucleic acids (ctNA) such as circulating tumor DNA (ctDNA) or circulating tumor RNA (ctRNA) that can be used as cancer biomarkers.112 The amount of circulating tumor DNA in blood can range from 0.01% up to 1%,112 an extremely low level compared to wild-type cell-free DNA. This, combined with a low frequency of mutations relative to wild-type sequences, makes ctDNA detection in blood or other body fluids challenging.112 Detecting RNA may be relatively easier because transcription allows RNA to be amplified naturally and produces more RNA for detection. Moreover, RNA provides information about the particular cellular state.71
Nanotechnology could help to address these challenges. For example, the STM-BJ recently allowed the first demonstration of detection and identification of RNA from E. coli via single-molecule conductance71 (see above), and this could be an ideal method for liquid biopsy because it is non-invasive, highly sensitive, and could be helpful to detect cancers without the use of surgery.112Fig. 9 shows the proposed approach; after sampling body fluids, the liquid biopsy sample could be used for single-biomolecule electrical detection targeting cancer biomarkers with minimal preprocessing.74
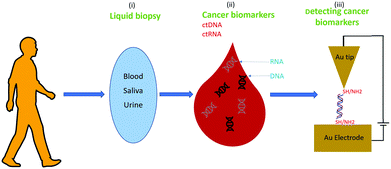 | ||
| Fig. 9 A biomedicine application: cancer detection via single-biomolecule electrical detection in liquid biopsies. | ||
The main hypothesis behind this particular application is that the sequences of ctNAs can be used to detect cancers. Recent omics studies suggest that this is the case, such as the Pan-Cancer Analysis of Whole Genomes (PCAWG) of the International Cancer Genome Consortium (ICGC) and The Cancer Genome Atlas (TCGA)109 (see Fig. 10). PCAWG reports the comprehensive and integrative analysis of 2658 whole-cancer genomes across 38 tumor types.109,113Fig. 10 shows a recent analysis of the distribution of cancer biomarkers and their mutations across cancer types.113 At the top of the list, one finds the proto-oncogene KRAS, TERT, and BRAF accounting for most of the mutations detected in dangerous adenocarcinomas like the pancreatic one. We propose using STM-BJ to detect Kras mRNA mutant fragments as a proof-of-concept application of single-molecule electrical detection of a biomarker for early cancer detection. This could be extended to many other biomarkers, and the detection paralleled after miniaturizing the single-biomolecule sensor to cover several different cancer types. Since the conductance of mRNA is expected to decrease with an increasing length of the sequence,72 it is critical to find the minimum specific size because it will allow for a higher signal-to-noise ratio in the conductance measurement. At the same time, the chosen sequence needs to be specific only for the required gene.
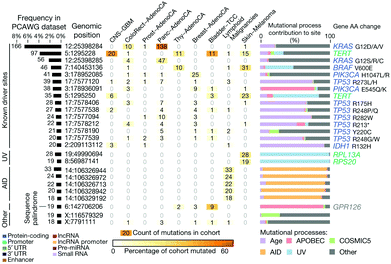 | ||
| Fig. 10 Candidate cancer biomarkers found in the recent literature.113 Reproduced with permission from ref. 113. | ||
It is worth mentioning that this approach is different from sequencing and is not targeting the discovery of new biomarkers. In this case, we propose BioMolecular Electronics for the fast electrical screening of liquid biopsy samples in single-molecule experiments (targeting already discovered common cancer biomarkers). We study the unique electrical fingerprints of the biomarkers that may appear in many cancer types with the objective of detecting cancers electrically. This could be extended to the parallel detection of many biomarkers in miniaturized devices that could simultaneously cover several different cancer types.
We are doing some preliminary analysis on wild-type and mutated KRAS sequences (a common cancer biomarker). GC content, melting temperatures, and secondary structure information can be found using the IDT Oligoanalyzer tool.114 In addition, the minimum specific length is found using the NCBI Blast tool.115 Multiple alignments Blast results confirm that the sequence with 16 bases is 100% specific for the Homo sapiens KRAS proto-oncogene, GTPase (KRAS), transcript variant a and b, mRNA.
Experiments are undergoing to measure the conductance of this and other biomarker sequences to compare it with the one found in mutant sequences.
This method could open the door for the rapid early electrical detection of cancer in liquid biopsies, especially if challenges in engineering and miniaturization are solved (see the next section). Also, one could apply this same idea for other applications, such as detecting infectious diseases or environmental monitoring of potential pathogens before they constitute a risk, anticipating (and hopefully preventing) future pandemics.
Challenges and opportunities in BioMolecular Electronics applications
The examples above show the potential of BioMolecular Electronics to result in new applications that can fulfill many current societal needs. A highly sensitive and completely electrical single-molecule biosensor could be a crucial asset for the early detection of cancer (see above), but could also help in environmental monitoring applications; detecting populations of microbes in particular ecosystems, anticipating changes in ecology that could result from the ongoing climate crisis.116 Another potential game-changing application could be the detection of highly infectious pathogens, such as coronavirus families and variants, that could allow for rapid screening in the population.Besides new sensing technologies, BioMolecular Electronics has the potential to result in the generation of new fundamental knowledge. Electrical signals in individual biomolecules could allow studying complex biological processes with unprecedented spatio-temporal resolution. This could shed new light on crucial biological processes such as the gene silencing of RISC or gene editing by the CRISPR-Cas complexes.
To achieve these objectives in the near future, BioMolecular Electronics needs to overcome a series of challenges. On the sensing front, in order to realistically deliver the promises of single biomolecule electrical detection in biomedical and environmental applications, the device needs to be miniaturized. Some efforts have recently shown remarkable progress miniaturizing molecular junctions,81 but to detect biomolecules in buffered or complex aqueous solutions, one will have to find solutions for miniaturizing the electrodes while insulating the contacts at the apex of the electrodes' gap. This is an evident engineering and experimental challenge, and solving it may also help make BioMolecular Electronics fundamental research more widespread. Also, single-biomolecule electrical signals are typically low signal-to-noise ratio, and this demands high statistics, typically needing hundreds or thousands of traces. New statistical and data analysis approaches are required in order to make these technologies more applicable, such as the recent application of machine learning for the analysis of conductance histograms.79
Even if these new technologies promise to be highly cost-effective for particular applications, at present, there are no single-biomolecule electrical sensors in the market. After all, the only biosensor routinely commercialized and widespread at the moment is the electrochemical glucose biosensor. To open the doors for the future commercialization of different biosensors, including the single-biomolecule electrical technologies discussed here, various stakeholders need to invest more to make them a reality, including funding agencies, academia, and especially industries.
Conclusions
Here, we provided a brief introduction and overview to the emerging field of BioMolecular Electronics, the discipline studying the CT process in biomolecules, and its potential applications, including future perspectives and challenges. After a brief introduction of the fundamental theory, a brief summary of the experimental techniques used for the study of CT in biomolecules was introduced, emphasizing single-molecule methods. Also, we reviewed some of the results in proteins and nucleic acids, from the initial studies on DNA to the latest studies on RNA and potential application examples.The study of charge transport in nucleic acids has been a very active field of research these last decades, and different experimental approaches have allowed establishing the CT mechanisms in short DNA molecules, revealing a transition from tunneling to hopping dependent on the length, the sequence of the molecule, and the delocalization or coherence length. In addition, other possible factors affecting the CT process are beginning to be considered, such as structural fluctuations and different conformations. Single-molecule studies on oligonucleotides with different structures have helped this end, providing results useful to derive a general theory for CT in oligonucleotides in the future. Also, these fundamental research approaches paved the way for new methods for the detection and diagnosis of diseases based on the electrical readout of single biomolecules and for biomolecular interactions in fundamental biophysics.
Conflicts of interest
There are no conflicts to declare.Acknowledgements
We acknowledge support from the NSF (Award Number 2027530) and from the University of Massachusetts Lowell (the Immersive Scholars program, the Wong research award 2020, and the UMass Lowell KCS Giants fund 2021).Notes and references
- A. Aviram and M. A. Ratner, Chem. Phys. Lett., 1974, 29, 277–283 CrossRef CAS.
- R. A. Marcus and N. Sutin, Biochim. Biophys. Acta, Rev. Bioenerg., 1985, 811, 265–322 CrossRef CAS.
- J. N. Betts, D. N. Beratan and J. N. Onuchic, J. Am. Chem. Soc., 1992, 114, 4043–4046 CrossRef CAS.
- D. N. Beratan, J. N. Onuchic, J. R. Winkler and H. B. Gray, Science, 1992, 258, 1740–1742 CrossRef CAS PubMed.
- C. C. Page, C. C. Moser, X. Chen and P. L. Dutton, Nature, 1999, 402, 47–52 CrossRef CAS PubMed.
- R. G. Endres, D. L. Cox and R. R. Singh, Rev. Mod. Phys., 2004, 76, 195 CrossRef CAS.
- J. Zhang, A. M. Kuznetsov, I. G. Medvedev, Q. Chi, T. Albrecht, P. S. Jensen and J. Ulstrup, Chem. Rev., 2008, 108, 2737–2791 CrossRef CAS PubMed.
- D. N. Beratan, S. S. Skourtis, I. A. Balabin, A. Balaeff, S. Keinan, R. Venkatramani and D. Xiao, Acc. Chem. Res., 2009, 42, 1669–1678 CrossRef CAS PubMed.
- C. A. Mirkin and M. A. Ratner, Annu. Rev. Phys. Chem., 1992, 43, 719–754 CrossRef CAS.
- F. Chen, J. Hihath, Z. Huang, X. Li and N. Tao, Annu. Rev. Phys. Chem., 2007, 58, 535–564 CrossRef CAS PubMed.
- S. Guo, J. M. Artés and I. Dez-Pérez, Electrochim. Acta, 2013, 110, 741–753 CrossRef CAS.
- J. M. Artés, M. López-Martnez, I. Dez-Pérez, F. Sanz and P. Gorostiza, Electrochim. Acta, 2014, 140, 83–95 CrossRef.
- E. S. Forzani, H. He, J. Hihath, S. Lindsay, R. M. Penner, S. Wang and B. Xu, ACS Nano, 2020, 14, 12291–12312 CrossRef CAS PubMed.
- T. Q. Ha, I. J. Planje, J. R. White, A. C. Aragonès and I. Dez-Pérez, Cur. Opin. Electrochem., 2021, 100734 10.1039/d1tc01535d.
- I. Baldea, Molecular Electronics: An Experimental and Theoretical Approach, CRC Press, 2016 Search PubMed.
- E. Scheer and J. C. Cuevas, Molecular electronics: an introduction to theory and experiment, World Scientific, 2017, vol. 15 Search PubMed.
- M. López-Martnez, J. M. Artés, V. Sarasso, M. Carminati, I. Dez-Pérez, F. Sanz and P. Gorostiza, Small, 2017, 13, 1700958 CrossRef PubMed.
- N. Darwish, C. Foroutan-Nejad, L. Domulevicz, J. Hihath and I. Dez-Pérez, Effects of Electric Fields on Structure and Reactivity, 2021, pp. 147–194 Search PubMed.
- B. Xu and N. J. Tao, Science, 2003, 301, 1221–1223 CrossRef CAS PubMed.
- W. Haiss, R. J. Nichols, H. van Zalinge, S. J. Higgins, D. Bethell and D. J. Schiffrin, Phys. Chem. Chem. Phys., 2004, 6, 4330–4337 RSC.
- G. Binnig, H. Rohrer, C. Gerber and E. Weibel, Phys. Rev. Lett., 1982, 49, 57 CrossRef.
- J. Hihath and N. Tao, Nanotechnology, 2008, 19, 265204 CrossRef PubMed.
- I. Dez-Pérez, J. Hihath, Y. Lee, L. Yu, L. Adamska, M. A. Kozhushner, I. I. Oleynik and N. Tao, Nat. Chem., 2009, 1, 635–641 CrossRef PubMed.
- B. Capozzi, J. Xia, O. Adak, E. J. Dell, Z.-F. Liu, J. C. Taylor, J. B. Neaton, L. M. Campos and L. Venkataraman, Nat. Nanotechnol., 2015, 10, 522–527 CrossRef CAS PubMed.
- I. Diez-Perez, Z. Li, J. Hihath, J. Li, C. Zhang, X. Yang, L. Zang, Y. Dai, X. Feng and K. Muellen, et al. , Nat. Commun., 2010, 1, 1–5 Search PubMed.
- J. M. Artés, I. Dez-Pérez and P. Gorostiza, Nano Lett., 2012, 12, 2679–2684 CrossRef PubMed.
- X. Yin, Y. Zang, L. Zhu, J. Z. Low, Z.-F. Liu, J. Cui, J. B. Neaton, L. Venkataraman and L. M. Campos, Sci. Adv., 2017, 3, eaao2615 CrossRef PubMed.
- J. S. Meisner, M. Kamenetska, M. Krikorian, M. L. Steigerwald, L. Venkataraman and C. Nuckolls, Nano Lett., 2011, 11, 1575–1579 CrossRef CAS PubMed.
- Y. S. Park, A. C. Whalley, M. Kamenetska, M. L. Steigerwald, M. S. Hybertsen, C. Nuckolls and L. Venkataraman, J. Am. Chem. Soc., 2007, 129, 15768–15769 CrossRef CAS PubMed.
- H. Rascón-Ramos, J. M. Artés, Y. Li and J. Hihath, Nat. Mater., 2015, 14, 517–522 CrossRef PubMed.
- A. C. Aragonès, N. L. Haworth, N. Darwish, S. Ciampi, N. J. Bloomfield, G. G. Wallace, I. Diez-Perez and M. L. Coote, Nature, 2016, 531, 88–91 CrossRef PubMed.
- X. Xiao, B. Xu and N. Tao, J. Am. Chem. Soc., 2004, 126, 5370–5371 CrossRef CAS PubMed.
- B. Xu, P. Zhang, X. Li and N. Tao, Nano Lett., 2004, 4, 1105–1108 CrossRef CAS.
- J. Hihath, B. Xu, P. Zhang and N. Tao, Proc. Natl. Acad. Sci. U. S. A., 2005, 102, 16979–16983 CrossRef CAS PubMed.
- L. Scullion, T. Doneux, L. Bouffier, D. G. Fernig, S. J. Higgins, D. Bethell and R. J. Nichols, J. Phys. Chem. C, 2011, 115, 8361–8368 CrossRef CAS.
- H. Uji, T. Morita and S. Kimura, Phys. Chem. Chem. Phys., 2013, 15, 757–760 RSC.
- E. A. Della Pia, Q. Chi, J. E. Macdonald, J. Ulstrup, D. D. Jones and M. Elliott, Nanoscale, 2012, 4, 7106–7113 RSC.
- D. Gerster, J. Reichert, H. Bi, J. V. Barth, S. M. Kaniber, A. W. Holleitner, I. Visoly-Fisher, S. Sergani and I. Carmeli, Nat. Nanotechnol., 2012, 7, 673–676 CrossRef CAS PubMed.
- H. B. Gray and J. R. Winkler, Quart. Rev. Biophys., 2003, 36, 341 CrossRef CAS PubMed.
- H. B. Gray and J. R. Winkler, Biochim. Biophys. Acta, Bioenerg., 2010, 1797, 1563–1572 CrossRef CAS PubMed.
- J. M. Salverda, A. V. Patil, G. Mizzon, S. Kuznetsova, G. Zauner, N. Akkilic, G. W. Canters, J. J. Davis, H. A. Heering and T. J. Aartsma, Angew. Chem., Int. Ed., 2010, 49, 5776–5779 CrossRef CAS PubMed.
- I. V. Pobelov, Z. Li and T. Wandlowski, J. Am. Chem. Soc., 2008, 130, 16045–16054 CrossRef CAS PubMed.
- J. M. Artés, M. López-Martnez, A. Giraudet, I. Dez-Pérez, F. Sanz and P. Gorostiza, J. Am. Chem. Soc., 2012, 134, 20218–20221 CrossRef PubMed.
- I. Bâldea, J. Phys. Chem. C, 2013, 117, 25798–25804 CrossRef.
- M. P. Ruiz, A. C. Aragones, N. Camarero, J. Vilhena, M. Ortega, L. A. Zotti, R. Pérez, J. C. Cuevas, P. Gorostiza and I. Dez-Pérez, J. Am. Chem. Soc., 2017, 139, 15337–15346 CrossRef CAS PubMed.
- A. Lagunas, A. Guerra-Castellano, A. Nin-Hill, I. Daz-Moreno, A. Miguel, J. Samitier, C. Rovira and P. Gorostiza, Nat. Commun., 2018, 9, 1–7 CrossRef CAS PubMed.
- E. Adman, L. Sieker and L. Jensen, Isr. J. Chem., 1981, 21, 8–11 CrossRef CAS.
- Rasmol tool, http://rasmol.org/, Accessed: 2020.
- PoVRay, http://www.povray.org/, Accessed: 2020.
- J. D. Watson and F. H. Crick, Nature, 1953, 171, 737–738 CrossRef CAS PubMed.
- D. Eley and D. Spivey, Trans. Faraday Soc., 1962, 58, 411–415 RSC.
- P. A. Sontz, N. B. Muren and J. K. Barton, Acc. Chem. Res., 2012, 45, 1792–1800 CrossRef CAS PubMed.
- S. O. Kelley and J. K. Barton, Science, 1999, 283, 375–381 CrossRef CAS PubMed.
- E. Braun, Y. Eichen, U. Sivan and G. Ben-Yoseph, Nature, 1998, 391, 775–778 CrossRef CAS PubMed.
- P. De Pablo, F. Moreno-Herrero, J. Colchero, J. G. Herrero, P. Herrero, A. Baró, P. Ordejón, J. M. Soler and E. Artacho, Phys. Rev. Lett., 2000, 85, 4992 CrossRef CAS PubMed.
- D. Porath, A. Bezryadin, S. De Vries and C. Dekker, Nature, 2000, 403, 635–638 CrossRef CAS PubMed.
- A. Rakitin, P. Aich, C. Papadopoulos, Y. Kobzar, A. Vedeneev, J. Lee and J. Xu, Phys. Rev. Lett., 2001, 86, 3670 CrossRef CAS PubMed.
- A. Y. Kasumov, M. Kociak, S. Gueron, B. Reulet, V. Volkov, D. Klinov and H. Bouchiat, Science, 2001, 291, 280–282 CrossRef CAS PubMed.
- J. M. Artés, Y. Li, J. Qi, M. Anantram and J. Hihath, Nat. Commun., 2015, 6, 1–8 Search PubMed.
- R. Zhuravel, H. Huang, G. Polycarpou, S. Polydorides, P. Motamarri, L. Katrivas, D. Rotem, J. Sperling, L. A. Zotti and A. B. Kotlyar, et al. , Nat. Nanotechnol., 2020, 15, 836–840 CrossRef CAS PubMed.
- J. K. Barton, E. D. Olmon and P. A. Sontz, Coord. Chem. Rev., 2011, 255, 619–634 CrossRef CAS PubMed.
- A. J. Storm, J. van Noort, S. de Vries and C. Dekker, Appl. Phys. Lett., 2001, 79, 3881–3883 CrossRef CAS.
- L. Xiang, J. L. Palma, C. Bruot, V. Mujica, M. A. Ratner and N. Tao, Nat. Chem., 2015, 7, 221 CrossRef CAS PubMed.
- T. Hines, I. Diez-Perez, J. Hihath, H. Liu, Z.-S. Wang, J. Zhao, G. Zhou, K. Mullen and N. Tao, J. Am. Chem. Soc., 2010, 132, 11658–11664 CrossRef CAS PubMed.
- J. C. Genereux and J. K. Barton, Chem. Rev., 2010, 110, 1642–1662 CrossRef CAS PubMed.
- M. Waleed Shinwari, M. Jamal Deen, E. B. Starikov and G. Cuniberti, Adv. Funct. Mater., 2010, 20, 1865–1883 CrossRef CAS.
- Y. A. Berlin, A. A. Voityuk and M. A. Ratner, ACS Nano, 2012, 6, 8216–8225 CrossRef CAS PubMed.
- J. Hihath, F. Chen, P. Zhang and N. Tao, J. Phys.: Condens. Matter, 2007, 19, 215202 CrossRef.
- C. Bruot, L. Xiang, J. L. Palma and N. Tao, ACS Nano, 2015, 9, 88–94 CrossRef CAS PubMed.
- L. Xiang, J. L. Palma, Y. Li, V. Mujica, M. A. Ratner and N. Tao, Nat. Commun., 2017, 8, 1–10 CrossRef PubMed.
- Y. Li, J. M. Artés, B. Demir, S. Gokce, H. M. Mohammad, M. Alangari, M. P. Anantram, E. E. Oren and J. Hihath, Nat. Nanotechnol., 2018, 13, 1167–1173 CrossRef CAS PubMed.
- Y. Li, J. M. Artés, J. Qi, I. A. Morelan, P. Feldstein, M. P. Anantram and J. Hihath, J. Phys. Chem. Lett., 2016, 7, 1888–1894 CrossRef CAS PubMed.
- Y. Li, J. M. Artés and J. Hihath, Small, 2016, 12, 432–437 CrossRef CAS PubMed.
- J. Veselinovic, M. Alangari, Y. Li, Z. Matharu, J. M. Artés, E. Seker and J. Hihath, Electrochim. Acta, 2019, 313, 116–121 CrossRef CAS.
- J. M. Bartlett and D. Stirling, PCR protocols, Springer, 2003, vol. 226 Search PubMed.
- O. Tenaillon, D. Skurnik, B. Picard and E. Denamur, Nat. Rev. Microbiol., 2010, 8, 207–217 CrossRef CAS PubMed.
- A. D. O'Brien, J. W. Newland, S. F. Miller, R. K. Holmes, H. W. Smith and S. B. Formal, Science, 1984, 226, 694–696 CrossRef PubMed.
- R. Rieger, A. Michaelis and M. M. Green, Glossary of genetics: classical and molecular, Springer Science & Business Media, 2012 Search PubMed.
- Y. Wang, M. Alangari, J. Hihath, A. K. Das and M. Anantram, BMC Genomics, 2021, 22, 1–10 Search PubMed.
- H. Jeong, H. B. Li, L. Domulevicz and J. Hihath, Adv. Funct. Mater., 2020, 30, 2000615 CrossRef CAS.
- H. Jeong, L. K. Domulevicz and J. Hihath, J. Microelectromech. Syst., 2020.
- M. Abhilash and D. Thomas, Biopolymer Composites in Electronics, Elsevier, 2017, pp. 405–435 Search PubMed.
- K. R. Srivastava, S. Awasthi, P. K. Mishra and P. K. Srivastava, Waterborne Pathog., 2020, 237–277 CAS.
- H. H. Nguyen, J. Park, S. Kang and M. Kim, Sensors, 2015, 15, 10481–10510 CrossRef CAS PubMed.
- P. V. Cornish and T. Ha, ACS Chem. Biol., 2007, 2, 53–61 CrossRef CAS PubMed.
- K. Roberts, B. Alberts, A. Johnson, P. Walter and T. Hunt, Molecular Biology of the Cell, New York, Garland Science, 2002 Search PubMed.
- D. L. Nelson, A. L. Lehninger and M. M. Cox, Lehninger principles of biochemistry, Macmillan, 2008 Search PubMed.
- J. J. Rhoden, G. L. Dyas and V. J. Wroblewski, J. Biol. Chem., 2016, 291, 11337–11347 CrossRef CAS PubMed.
- B. Schweitzer, S. Wiltshire, J. Lambert, S. O'Malley, K. Kukanskis, Z. Zhu, S. F. Kingsmore, P. M. Lizardi and D. C. Ward, Proc. Natl. Acad. Sci. U. S. A., 2000, 97, 10113–10119 CrossRef CAS PubMed.
- K. Zhang, S. Lv, M. Lu and D. Tang, Biosens. Bioelectron., 2018, 117, 590–596 CrossRef CAS PubMed.
- K. Zhang, S. Lv, Z. Lin, M. Li and D. Tang, Biosens. Bioelectron., 2018, 101, 159–166 CrossRef CAS PubMed.
- B. Zhang, B. Liu, D. Tang, R. Niessner, G. Chen and D. Knopp, Anal. Chem., 2012, 84, 5392–5399 CrossRef CAS PubMed.
- F. Lisdat and D. Schäfer, Anal. Bioanal. Chem., 2008, 391, 1555–1567 CrossRef CAS PubMed.
- E. Katz and I. Willner, Electroanalysis, 2003, 15, 913–947 CrossRef CAS.
- C. Lindskog, M. Backman, A. Zieba, A. Asplund, M. Uhlén, U. Landegren and F. Pontén, J. Histochem. Cytochem., 2020, 68, 515–529 CrossRef CAS PubMed.
- S. G. Patching, Biochim. Biophys. Acta, Biomembr., 2014, 1838, 43–55 CrossRef CAS PubMed.
- B. Zhang, W. Song, P. Pang, H. Lai, Q. Chen, P. Zhang and S. Lindsay, Proc. Natl. Acad. Sci. U. S. A., 2019, 116, 5886–5891 CrossRef CAS PubMed.
- B. Zhang and S. Lindsay, Nano Lett., 2019, 19, 4017–4022 CrossRef CAS PubMed.
- B. Zhang, W. Song, J. Brown, R. Nemanich and S. Lindsay, J. Am. Chem. Soc., 2020, 142, 6432–6438 CrossRef CAS PubMed.
- S. Lindsay, Life, 2020, 10, 72 CrossRef CAS PubMed.
- M. W. Gonzalez and M. G. Kann, PLoS Comput. Biol., 2012, 8, e1002819 CrossRef CAS PubMed.
- W. Dubitzky, O. Wolkenhauer, H. Yokota and K.-H. Cho, Encyclopedia of systems biology, Springer Publishing Company, Incorporated, 2013 Search PubMed.
- G. Meister and T. Tuschl, Nature, 2004, 431, 343–349 CrossRef CAS PubMed.
- S. Mitra, S. Ganguli and J. Chakrabarti, Cancer and Noncoding RNAs, Academic Press, Boston, 2018, vol. 1, pp. 1–23 Search PubMed.
- E. J. Sontheimer, Nat. Rev. Mol. Cell Biol., 2005, 6, 127–138 CrossRef CAS PubMed.
- Y. Luo, Z. Na and S. A. Slavoff, Biochemistry, 2018, 57, 2424–2431 CrossRef CAS PubMed.
- A. Zbinden, M. Pérez-Berlanga, P. De Rossi and M. Polymenidou, Dev. Cell, 2020, 55, 45–68 CrossRef CAS PubMed.
- A. Raj and A. van Oudenaarden, Annu. Rev. Biophys., 2009, 38, 255–270 CrossRef CAS PubMed.
- I. The, T. P.-C. A. of Whole and G. Consortium, et al. , Nature, 2020, 578, 82 CrossRef PubMed.
- M. Chen and H. Zhao, Hum. Genomics, 2019, 13, 1–10 CrossRef CAS PubMed.
- M. Poudineh, E. H. Sargent, K. Pantel and S. O. Kelley, Nat. Biomed. Eng., 2018, 2, 72–84 CrossRef CAS PubMed.
- J. Das and S. O. Kelley, Angew. Chem., 2020, 132, 2574–2584 CrossRef.
- E. Rheinbay, M. M. Nielsen, F. Abascal, J. A. Wala, O. Shapira, G. Tiao, H. Hornshøj, J. M. Hess, R. I. Juul and Z. Lin, et al. , Nature, 2020, 578, 102–111 CrossRef CAS PubMed.
- IDT Oligo Analyzer tool, https://www.idtdna.com/calc/analyzer, Accessed: 2021-03-25.
- NCBI blast tool, https://blast.ncbi.nlm.nih.gov/Blast.cgi?PROGRAM=blastnPAGE_TYPE=BlastSearchLINK_LOC=blasthome, Accessed: 2021-03-25.
- A. McMichael, Climate change and the health of nations: famines, fevers, and the fate of populations, Oxford University Press, 2017 Search PubMed.
Footnote |
| † These authors contributed equally to this work. |
| This journal is © The Royal Society of Chemistry 2021 |


