
 Open Access Article
 This Open Access Article is licensed under a Creative Commons Attribution-Non Commercial 3.0 Unported Licence
Self-assembling tetrameric peptides allow in situ 3D bioprinting under physiological conditions†
Sakandar
Rauf
 a,
Hepi H.
Susapto
a,
Kowther
Kahin
a,
Salwa
Alshehri
a,
Sherin
Abdelrahman
a,
Jordy Homing
Lam
bc,
Sultan
Asad
a,
Sandip
Jadhav
a,
Dhakshinamoorthy
Sundaramurthi‡
a,
Xin
Gao
bc and
Charlotte A. E.
Hauser
*ab
a,
Hepi H.
Susapto
a,
Kowther
Kahin
a,
Salwa
Alshehri
a,
Sherin
Abdelrahman
a,
Jordy Homing
Lam
bc,
Sultan
Asad
a,
Sandip
Jadhav
a,
Dhakshinamoorthy
Sundaramurthi‡
a,
Xin
Gao
bc and
Charlotte A. E.
Hauser
*ab
aLaboratory for Nanomedicine, Division of Biological & Environmental Science & Engineering (BESE), King Abdullah University of Science and Technology (KAUST), Thuwal 23955-6900, Saudi Arabia. E-mail: charlotte.hauser@kaust.edu.sa
bComputational Bioscience Research Center (CBRC), King Abdullah University of Science and Technology (KAUST), Thuwal 23955-6900, Saudi Arabia
cComputer, Electrical and Mathematical Sciences and Engineering (CEMSE) Division, King Abdullah University of Science and Technology (KAUST), Thuwal 23955-6900, Saudi Arabia
First published on 22nd December 2020
Abstract
We have developed an in situ bioprinting method that allows the printing of cells under true physiological conditions by applying self-assembling ultrashort peptides as bioinks. This method avoids cell stressing methods, such as UV-treatment, chemical crosslinking and viscous bioink printing methods. We further demonstrate that different nanomaterials can easily be synthesized or incorporated in the 3D bioprinted peptide scaffolds which opens up the possibility of functionalized 3D scaffolds.
1. Introduction
Synthetic peptides that can self-assemble into 3D nanofibrous scaffolds are promising candidates for 3D cell culture applications due to their control over composition and ease of chemical modification.1 In particular, ultrashort peptides composed of 3–7 amino acids are attractive candidates as they can maintain a high water content and are suitable as hydrogels for applications in tissue engineering and regenerative medicine.2–4 Moreover, due to their unique properties, self-assembling peptides have been used in a wide range of biomedical applications including drug delivery, anti-cancer treatment and wound healing, and as antimicrobial agents.5–7 While different bioink materials are commercially available for 3D cell culture as well as for 3D bioprinting applications, the majority of these materials include steps that are harsh for viable cells such as crosslinking using UV-treatment or chemical polymerization to transform pre-polymeric viscous solutions into a stable scaffold.8–11 During these processes, the printed cells might get damaged due to exposure to UV light or toxic chemicals. Furthermore, the viscosity in these bioinks implies a requirement for extrusion-based printing.10 Shear forces induced by the extrusion-based bioprinting exerted on entrapped cells can compromise their viability and functionality. Therefore, the development of 3D bioprinting methods that eliminate the use of viscous bioinks or post-treatment of 3D bioprinted constructs is highly desirable to fabricate viable, functional and well-defined 3D cellular constructs.10Previously, various natural bioinks have been explored for their 3D bioprinting applicability. These bioinks (e.g. matrigel, collagen and alginate) are natural materials derived from non-human sources and therefore not immunocompetent for human applications. Though biocompatible, natural bioinks such as collagen or matrigel are not prone to controlled modifications due to their complex and variable compositions.12 Complications in controlling the physiological variables (e.g. pH and salt concentration) of these materials also impose difficulty to recapitulate the extracellular matrix (ECM).13 Their batch-to-batch variations can also significantly affect sustainability and immunogenicity of the bioprinted 3D structures making them unsuitable for tissue/organ development or downstream clinical applications.12 Moreover, polymer-based 3D molds are a prerequisite to fabricate 3D structures using natural bioinks. This poses additional challenges in printing when molds are difficult to construct.11,14,15
Synthetic peptide materials have the potential to overcome problems associated with natural bioinks. In previous studies, ultrashort peptide bioinks have demonstrated adequate mechanical strength, rigidity, and shape fidelity on glass substrates.4 However, due to their viscous nature, these peptide bioinks still require extrusion-based printing, in which the viscous peptide gel containing the cells is extruded from a nozzle of micron-sized diameter exerting high shear forces on the cells during the printing process.16
Herein, we report a unique in situ 3D bioprinting method that utilizes physiological buffers and works at body temperature. We have developed two new ultrashort tetrameric peptides: Ac-Ile-Val-Cha-Lys-NH2 (IVZK) and Ac-Ile-Val-Phe-Lys-NH2 (IVFK) (Fig. 1a and Fig. S1–S3, ESI†). Our results show that the printed structures using our former developed peptide compounds2,3 as bioinks as well as the newly developed peptides IVZK and IVFK are highly durable and biocompatible.
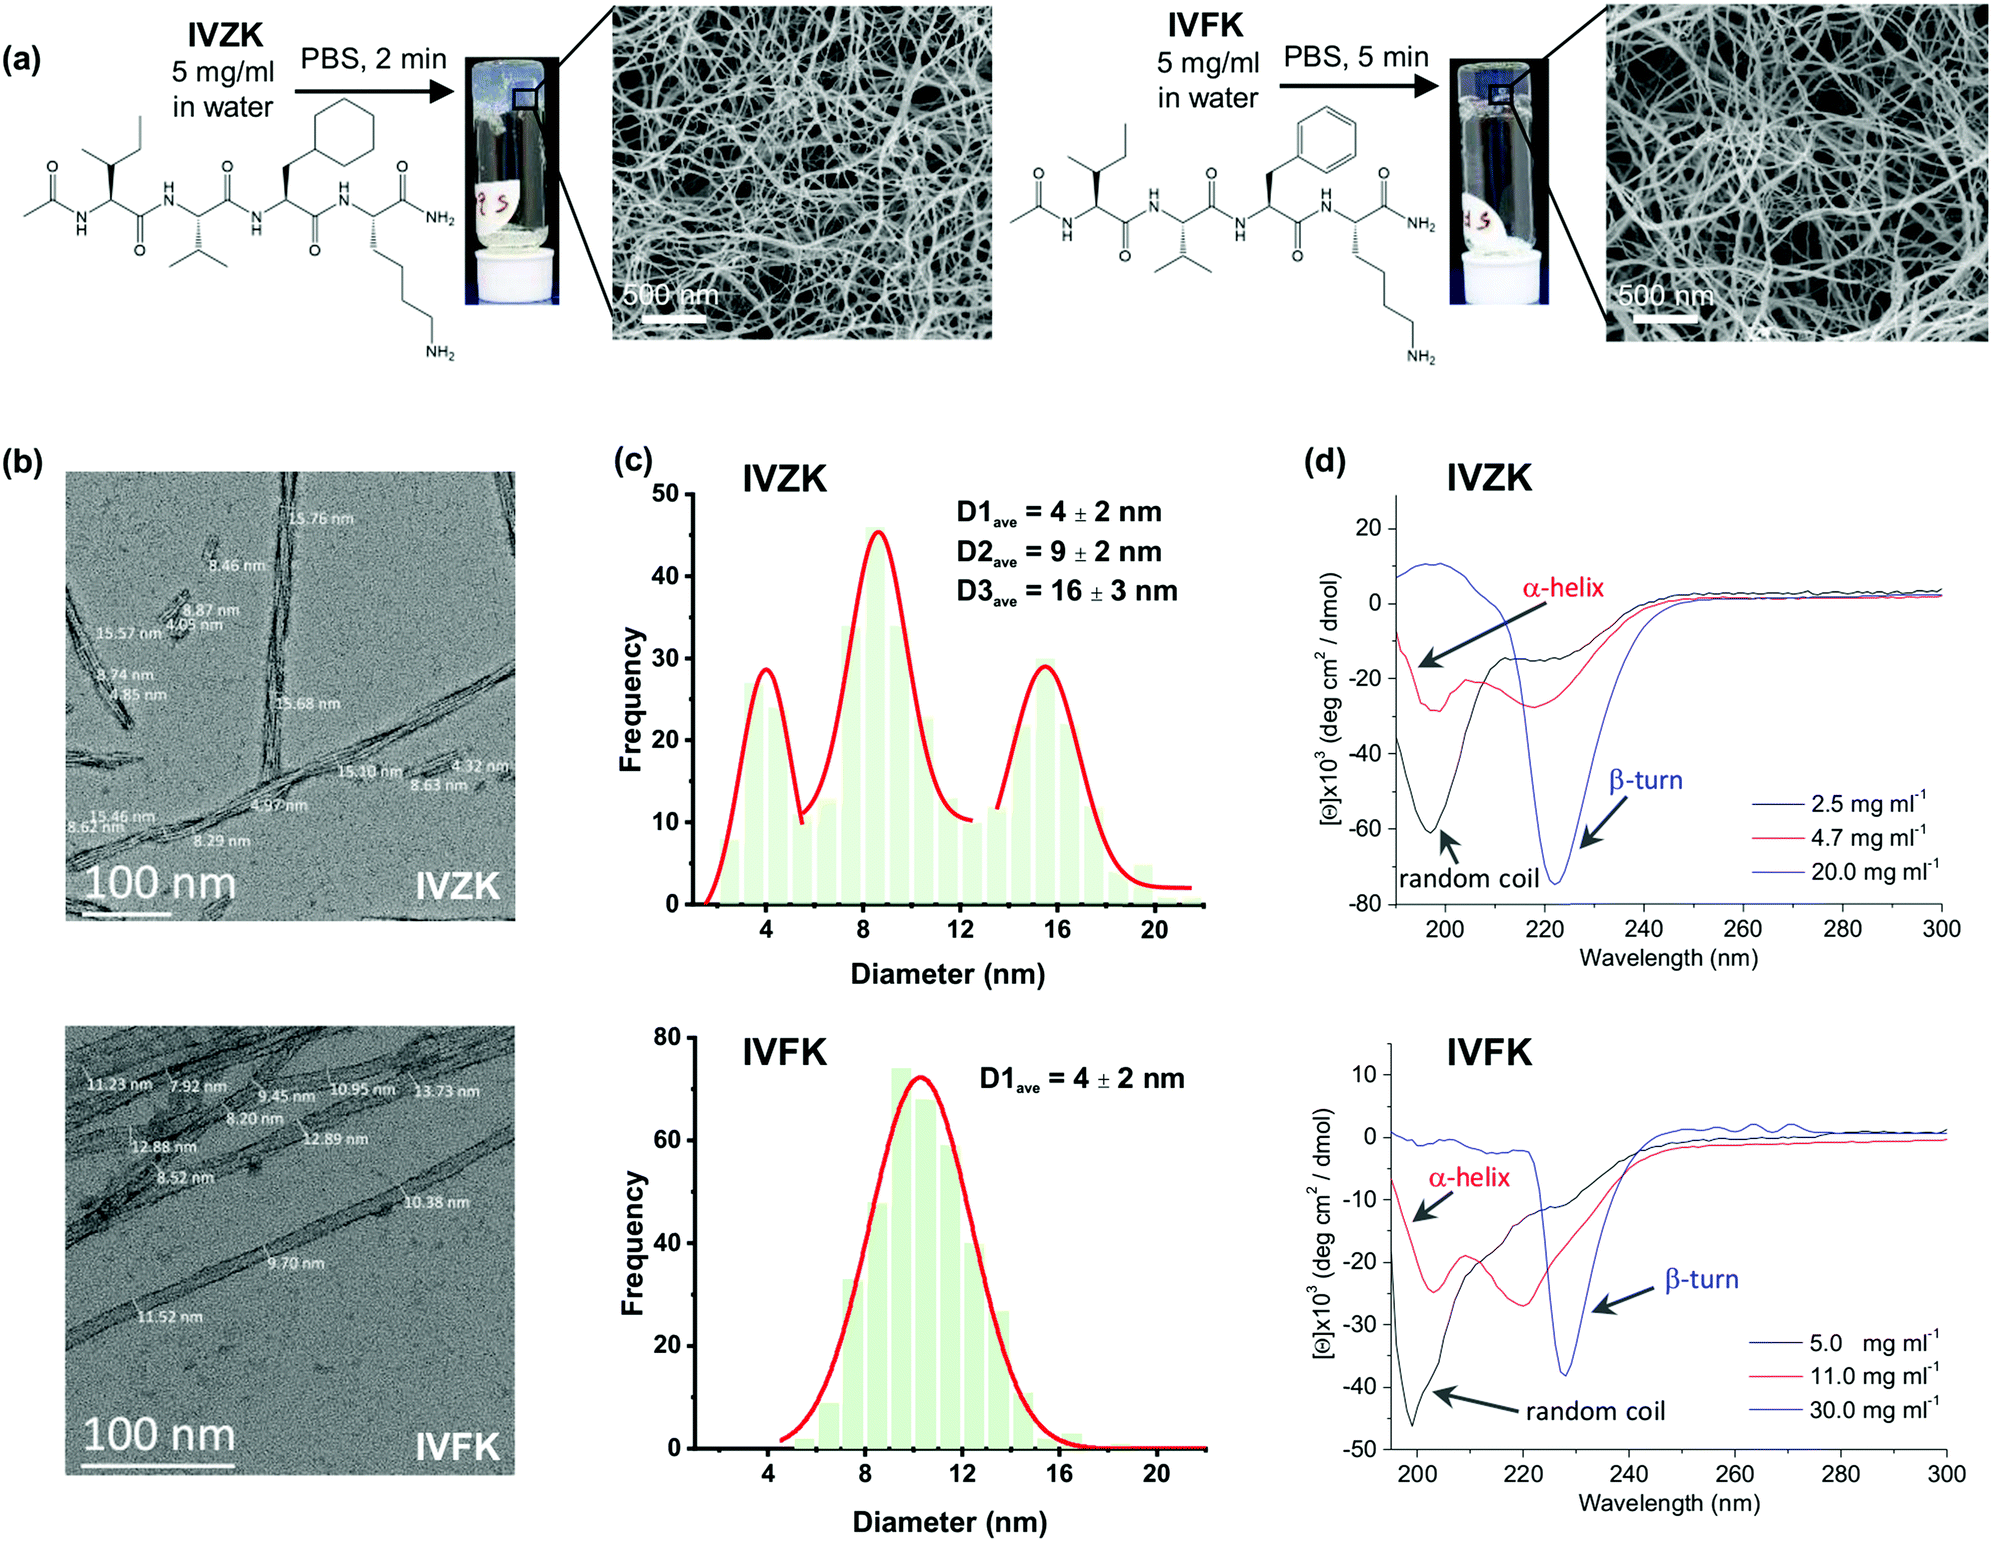 | ||
| Fig. 1 (a) Chemical structures of Ac-Ile-Val-Cha-Lys-NH2 (IVZK) and Ac-Ile-Val-Phe-Lys-NH2 (IVFK) peptides and the corresponding hydrogel pictures and scanning electron micrographs (SEM). (b) High resolution TEM images of IVZK and IVFK nanofibers. (c) The average diameter of IVZK and IVFK nanofibers which was calculated by plotting the distribution curve using the data collected from 10 and 13 TEM images of IVZK and IVFK, respectively. (d) CD spectra of IVZK and IVFK peptides at different concentrations. | ||
2. Experimental
2.1. Chemicals
The newly designed peptide sequences Ac-Ile-Val-Phe-Lys-NH2 (IVFK) and Ac-Ile-Val-Cha-Lys-NH2 (IVZK) were synthesized manually by solid phase peptide synthesis. The purity of the peptides IVFK and IVZK reached >95% using HPLC. LK6 (Ac-LIVAGK-NH2) and IK6 (Ac-ILVAGK-NH2) were custom synthesized by American Peptide Company (APC), Sunnyvale, USA, using manual solid phase peptide synthetic method, and purified to >95% using HPLC.4 9-Fluorenylmethoxycarbonyl (Fmoc) protected amino acids, MBHA Rink Amide resin, (2-(1H-benzotriazol-1-yl)-1,1,3,3-tetramethyluronium hexafluorophosphate (TBTU)), and hydroxy benzotriazole (HOBt) were purchased from GL Biochem, Shanghai, China. N,N-Diisopropylethylamine (DIPEA), piperidine, acetic anhydride, trifluoroacetic acid (TFA), triisopropylsilane, N,N-dimethylformamide (DMF), dichloromethane (DCM), diethyl ether, ethanol, and phosphate-buffered saline (PBS, 10× concentration) were purchased from Sigma-Aldrich. The chemicals were used as received, without any purification.2.2. Peptide synthesis
The peptide sequences Ac-Ile-Val-Phe-Lys-NH2 (IVFK) and Ac-Ile-Val-Cha-Lys-NH2 (IVZK) were synthesized on rink amide resin (1 mmol) using the Fmoc-based solid phase peptide synthetic (SPPS) method. The resin was pre-swelled with DCM in a reaction vessel with continuous agitation for 30 min and the Fmoc group on the resin was then deprotected using 20% (v/v) piperidine/DMF prior to the first coupling of amino acid. Then, the resin was washed thoroughly with DMF and DCM. A mixture consisting of TBTU (3 eq.), HOBt (3 eq.) DIPEA (6 eq.), and Fmoc-protected amino acid (3 eq.) was then added into the reaction vessel and shaken for 90 min. Both the Fmoc deprotection and coupling steps were always followed by washing the resin with DMF and DCM in order to remove the excess reagents and reactants from the reaction vessel. A Kaiser test was also performed after each coupling and deprotection step to examine the success of the reaction. All the steps of Fmoc-deprotection, peptide coupling, washing and Kaiser test were repeated until all of the amino acids were added to the peptide sequence. The N-terminal of the peptide sequence was later capped with an acetyl group by adding a mixture of acetic anhydride![[thin space (1/6-em)]](https://www.rsc.org/images/entities/char_2009.gif) :DIPEA:DMF in the ratio of 2:6:1 (v/v). Then, the peptide was cleaved from the resin by agitating it in a 95:2.5:2.5 mixture of TFA, water and triisopropylsilane, respectively, for a minimum of 2 h. The peptide solution in TFA was later collected in a round bottom flask. Afterwards, the peptide was further precipitated by adding cold diethyl ether and kept standing overnight at 4 °C. The precipitated peptide was separated from the supernatant by centrifugation. Subsequently, it was dried under reduced pressure to yield crude peptide powder. The pure peptide was obtained by reverse phase-HPLC purification using a C-18 column (2–98% ACN in 15 min) at a flow rate of 20 mL min−1. Both purified peptides were collected in more than 60% yield.
:DIPEA:DMF in the ratio of 2:6:1 (v/v). Then, the peptide was cleaved from the resin by agitating it in a 95:2.5:2.5 mixture of TFA, water and triisopropylsilane, respectively, for a minimum of 2 h. The peptide solution in TFA was later collected in a round bottom flask. Afterwards, the peptide was further precipitated by adding cold diethyl ether and kept standing overnight at 4 °C. The precipitated peptide was separated from the supernatant by centrifugation. Subsequently, it was dried under reduced pressure to yield crude peptide powder. The pure peptide was obtained by reverse phase-HPLC purification using a C-18 column (2–98% ACN in 15 min) at a flow rate of 20 mL min−1. Both purified peptides were collected in more than 60% yield.
2.3. Liquid chromatography – mass spectroscopy (LC-MS)
1 mg of peptides, which were dissolved in 1 mL of water, was analyzed using an Agilent 1260 Infinity LC equipped with an Agilent 6130 Quadrupole MS. An Agilent Zorbax SB-C18 4.6 × 250 mm column was used together with a mixture of two different solutions of 0.1% (v/v) formic acid – water (A) and 0.1% (v/v) formic acid – acetonitrile (B). The flow of mobile phase was 1.5 mL min−1 with a composition of 98% A – 2% B for the first 1 min. From 1 to 18 min, the flow of B increased until 98% B and turned back to 2% again. The LC chromatogram was obtained at a wavelength of 220 nm.2.4. Nuclear magnetic resonance (NMR)
The proton 1H-NMR analysis was performed on a Bruker 700 MHz. The NMR samples were prepared by dissolving 5 mg of peptide powder in 1 mL of d6-DMSO. 700 μL of this solution was later transferred into an NMR tube.2.5. Peptide gelation studies
The pre-weighed (as per required final concentration) peptide powder was dissolved in 0.9 mL of MilliQ water in a glass vial. The solution was vortexed for 5–10 seconds to obtain a clear and homogeneous solution. To this peptide solution, 0.1 mL of PBS buffer (10×, w/o Ca2+ and Mg2+) was added. To ensure homogeneous distribution of the buffer in the solution, the glass vial was further vortexed for 2–3 seconds. The glass vial was kept undisturbed on the bench and the hydrogel formation was observed using the vial inversion method. The pH of the solution of IVFK and IVZK was 5.57 and 5.48 at 5 mg mL−1 concentration, respectively. After the addition of PBS, the pH changed to 7.7 and 7.6 for IVFK and IVZK, respectively. The pH of the MilliQ water and phosphate buffer used was 6.7 and 7.4, respectively.2.6. Scanning electron microscopy (SEM) studies
The morphology of the samples was visualized using an FEI Magellan XHR Scanning Electron Microscope with an accelerating voltage of 3 kV and Quanta 3D FEG with an accelerating voltage of 10 kV. The SEM samples were prepared by dehydrating peptide hydrogels that were printed on a silicon wafer by gradually increasing the concentration of ethanol. The dehydrated gels were then dried at 31 °C and 1072 psi using a critical point dryer. The dried samples were sputter coated with 3 nm Ir and 3 nm Au/Pd before imaging.2.7. Transmission electron microscopy (TEM) studies
TEM studies were carried out using an FEI Titan G2 80–300 CT with a 300 kV emission gun. The Cryo TEM imaging was performed in low dose mode by using FEI's Titan Krios operating at 300 kV. The TEM samples for peptide nanofibers were prepared from diluted peptide hydrogel in water. One drop of this solution was then placed on a carbon coated copper grid that had been treated with glow discharge plasma before use. The drop was kept for 10 minutes at room temperature before being blotted using filter paper. To get better contrast, the grid was stained with 2% uranyl acetate for 1 minute and then dried for at least one day before imaging. The diameter of the IVFK and IVZK peptide nanofibers was measured using the image-analysis software ImageJ from a total of 13 and 10 TEM images, respectively. A size distribution histogram for each peptide nanofiber was created in origin to calculate the average diameter of both peptides.2.8. Circular dichroism (CD)
CD spectra were measured at ambient temperature (25 °C) using an AVIV-430 spectrophotometer in combination with a Peltier temperature controller. A rectangular quartz cuvette with an optical path length of 0.1 mm was used. Data acquisition was performed at 1 nm steps, scanning the wavelength from 190 to 300 nm with a spectral bandwidth of 1.0 nm. The detector high voltage (HT) signals were monitored during the acquisition, in which the values reached 300 V at lower concentrations (≤11 mg mL−1) and continued until 450 V at higher concentrations (20–30 mg mL−1). CD signals were further normalized to the molar ellipticity value.2.9. Molecular dynamics simulation of peptide assembly
We conducted molecular dynamics simulations of both IVFK and IVZK in water to study fibre formation at atomic scale. Two cases were considered for each of the peptides – 4-peptide assembly and 60-peptide assembly. The set-ups for the simulation boxes are summarized in Tables S1 and S2 (ESI†). The first case corresponds to a very dilute situation in which the peptide to water mole fraction is 0.001; this allows us to study the local assembly behavior similar to experimental concentration. The second case corresponds to a more concentrated situation in which the peptide to water mole fraction reaches 0.004–0.006; this allows us to simulate fibre formation across the periodic boundary. In any case, the simulation is conducted using an OPLS force-field;17 parameters for the unnatural amino acid Z are derived using the LigParGen webserver.18 Water molecules are described under a SPC/E model. Simulations are conducted under GROMACS 2018.19 Systems are propagated at intervals of 2 fs. All simulations were done in cubic periodic boundaries applied on all three directions. For efficiency, the long-ranged non-bonded interactions were handled using the Particle Mesh Ewald Method;20 electrostatic and Lennard-Jones interactions within 1.4 nm were considered short-ranged. Before launching into a production run, the system had gone through various successive energy minimization and equilibration steps under position and bond length restraints on heavy atoms. The final production run is handled as an isobaric–isothermic ensemble (NPT ensemble), and the system is coupled to a Berendsen Barostat21 with reference pressure at 1 bar and a V-Rescale Thermostat22 with the reference temperature at 300 K. For all investigated peptides, the systems were propagated for a duration of 100 ns. Calculations were performed at a rate of about 50 ns per day on 512 Intel Haswell cores at 2.3 GHz.2.10. Rheological characterization of peptide hydrogels
The mechanical stiffness of the peptide hydrogels was analyzed using a TA Ares-G2 Rheometer equipped with parallel-plate geometries of 8 mm diameter at room temperature. The sample gap between the upper and lower geometries was set at 1.8 mm. The hydrogels were prepared from 135 μL of peptide solution which was mixed with 15 μL of 10× PBS in a polymethyl methacrylate (PMMA) casting ring with an internal diameter of 8 mm and left for one day before measurement. To control the accuracy of the measurements, six replicates for each peptide hydrogel were prepared. The viscoelasticity measurement was performed on three successive tests, which were time-sweep, frequency-sweep, and amplitude-sweep. Time-sweep was performed at the first 5 minutes with an angular frequency and a strain of 1 rad s−1 and 0.1%, respectively. This allowed the gel to reach the equilibrium storage (G′) and loss modulus (G′′) before the next measurements. A frequency sweep was subsequently carried out on the sample for a range of angular frequency of 0.1–100 rad s−1 while keeping the strain constant at 0.1%. Finally, amplitude sweep was done to calculate the minimum strain required to break the gels. The test was performed by applying a gradual increase of strain from 0.01% to 100% at 1 rad s−1 angular frequency.2.11. 3D bioprinting
All peptide solutions were freshly prepared by dissolving 15 mg mL−1 of the synthesized peptide powder (IVFK and IVZK) in 1 mL of Milli-Q water and mixed for approximately one minute by vortexing to obtain a homogenous solution. The coaxial microfluidic printing nozzle was prepared by using two different syringe needles with different internal diameters. The main needle (18 Gauge) has an internal diameter (ID) of 840 μm, and the top needle has an ID of 80 μm (34 Gauge) with an outer diameter of 190 μm. Two holes were created at the side of the main needle, and a PTFE tube (PTFE#30 AWG thin wall tubing, Cole Parmer) with an ID of 304 μm was inserted from one side of the main nozzle by creating a hole of the same size as that of the PTFE tube's outer diameter for the flow of the cells. On the other side of the needle, a PTFE tube (PTFE#24 AWG thin wall tubing, Cole Parmer) with an ID of 550 μm was inserted and used for the flow of the peptide solution. Transparent epoxy was used to seal the tubing and the top nozzle.Briefly, a solution of the peptide (15 mg mL−1), phosphate buffer saline (10×) and about 8 million cells per mL in cell culture media were mixed at an interface inside the printing nozzle to form the peptide hydrogel during the bioprinting process. The flow rates of all three components were controlled using the microfluidic pumps. Ring structures of 8 mm diameter and a height of approximately 1.2 mm containing HDFn or hBMSCs cells (or without cells) encapsulated in the peptide hydrogel were printed using the robotic 3D bioprinter. Different printing speeds such as 0.6 mm s−1, 0.8 mm s−1, 1.2 mm s−1, 1.5 mm s−1, 1.8 mm s−1, and 6 mm s−1 were tested at the specified (fixed) flow rates and the optimum speed for printing was found to be 1.2 mm s−1 (data not shown). A printing speed of 1.2 mm s−1 was chosen as the optimum speed for 3D bioprinting and fixed throughout all of the experiments.
After printing, the number of cells encapsulated in the peptide hydrogel was counted per ring and estimated to be ≅70000 per ring structure (data were collected from eight replicates and cell counting was performed using the Trypan blue staining method). The 3D circular structures with five layers of peptide hydrogel were printed into a six-well plate. Then, the constructs were gently washed two or three times with the culture medium. To each well, 3mL of culture medium was added and the printed cell-laden constructs were cultured in a humidified incubator at 37 °C and 5% CO2. At pre-determined time points, the constructs were taken out to perform the cell proliferation 3D assay and cytoskeletal staining of the cells, which are discussed below.
For the 3D bioprinting of alginate–gelatin, alginic acid sodium salt powder (Sigma) and gelatin (porcine skin type A, Sigma) were dissolved (30 mg mL−1 of each) in Milli-Q water by stirring at 40 °C for 2 hours. The alginate–gelatin bioink was loaded into a 3 mL cartridge and fitted onto one of the extrusion head of a commercially available air pressure extrusion-based 3D bioprinter. The internal diameter of the printing nozzle used was 400 μm. The air pressure used for the extrusion of the alginate–gelatin bioink was 12 kPa, and a printing speed of 4 mm s−1 was used to print similar circular structures as in the case of the peptide bioinks. After printing, 105 cells (HDFn) were seeded onto the printed structure followed by the addition of calcium chloride solution (150 mM). The printed ring structures were incubated for 5 minutes to facilitate cross-linking. Finally, the excess calcium chloride solution was removed, and media was added and incubated as described above.
2.12. In situ synthesis of silver nanoparticles and inclusion of nanomaterials and quantum dots in 3D constructs
Different nanomaterials such as quantum dots and nanoparticles can be incorporated in the 3D peptide hydrogel using our 3D bioprinting method. As an example, streptavidin modified CdSe/ZnS quantum dots (QD 525, Invitrogen) were mixed with the IVZK peptide solution and 3D bioprinted using the same printing procedure as described earlier. Fluorescence confocal microscopy (Zeiss LSM 710 Inverted Confocal Microscope, Germany) was used to confirm the presence of the quantum dots in the construct. The excitation wavelength for the quantum dots was 405 nm, and the emission wavelength maximum was 525 nm (green color). In the case of in situ synthesis of nanomaterials, silver nanoparticles were generated in situ in the 3D peptide hydrogel construct using UV treatment (254 nm). A solution of silver nitrate (AgNO3, 1 mM) was mixed with IVZK peptide solution (15 mg mL−1) in the presence of Tris buffer (pH 8.5). Then the printing procedure was followed as discussed earlier. Afterwards, the printed constructs were treated with UV light (254 nm for 10 minutes) to generate in situ silver nanoparticles as earlier described by Reithofer et al.23 Instead of phosphate buffered saline (PBS), 100 mM Tris buffer (pH 8.5) was used to avoid precipitation of silver chloride.2.13. Cell culture of human dermal fibroblasts, neonatal (HDFn), and human bone marrow mesenchymal stem cells (hMSCs)
Human dermal fibroblasts, neonatal (HDFn, C0045C) were purchased from Thermo Fisher Scientific, USA. Cells were cultured in medium 106 (Thermo Fisher Scientific, USA) supplemented with 10% fetal bovine serum and 1% penicillin/streptomycin. The cells were maintained either in a T175 or T75 cell culture flask (Corning, USA) at 37 °C in a humidified incubator with 5% CO2. The cells were subcultured by using trypsin at approximately 80% confluency. The culture medium was replenished every 48 hours. Human bone marrow mesenchymal stem cells, (hMSCs, PT-2501) were purchased from Lonza, USA. Cells were cultured in medium (PT-4106E Lonza, USA) and supplemented with mesenchymal cell growth supplements (PT-4106E Lonza, USA), gentamicin sulfate Amphotericin-B (PT-4501E Lonza, USA) and L-glutamine (PT-4107E Lonza, USA). The cells were maintained either in a T75 or T150 cell culture flask (Corning, USA) at 37 °C in a humidified incubator with 95% air and 5% CO2. The cells were cultured by using trypsin at approximately 80% confluence. The culture medium was changed every 2–3 days.2.14. Cell proliferation 3D assay
The CellTiter-Glo® luminescence 3D cell viability assay was used to determine the number of viable cells (HDFn and hBMSCs) in 3D hydrogels based on the quantification of the ATP present, which signals the presence of metabolically active cells.24 After each time point, the plate with its contents was equilibrated at room temperature for approximately 30 minutes. CellTiter-Glo® Reagent equal to the volume of cell culture medium present in each well was added. The contents were mixed for 5 minutes to digest the hydrogels and then incubated for 30 minutes. After incubation, the luminescence was recorded using a plate reader (PHERAstar FS, Germany).2.15. Cytoskeletal staining
Immunostaining was performed after 1, 3, 7, 14 and 21 days of culture. In brief, the cells were fixed with 3.7% paraformaldehyde solution for 30 minutes and incubated in a cold cytoskeleton buffer (3 mM MgCl2, 300 mM sucrose and 0.5% Triton X-100 in PBS solution) for 10 minutes to permeabilize the cell membranes. The permeabilised cells were incubated in blocking buffer solution (5% FBS, 0.1% Tween-20, and 0.02% sodium azide in PBS) for 30 minutes at 37 °C, followed by incubation in anti-vinculin (1:100) for 1 hour at 37 °C and subsequently with anti-mouse IgG (whole molecule)–FITC and rhodamine–phalloidin (1:200) for 1 hour at 37 °C.25 Furthermore, the cells were incubated in DAPI for 10 minutes at 37 °C to counterstain the nucleus. The fluorescent dye-treated cells were observed and imaged using a laser scanning confocal microscope (Zeiss LSM 710 Inverted Confocal Microscope, Germany).
2.16. RNA sequencing of 3D bioprinted sample RNA isolated from 2D and 3D cultured cells
RNA from 3D cultured printed cells was isolated using Trizol reagent (15596018, Ambion, USA). Appropriate volumes of Trizol were added to each sample until the sample was homogeneous. Proper volumes of chloroform were added (chloroform volume = Trizol volume/5) to each sample and the samples were centrifuged at maximum speed afterward at 4 °C for 20 minutes. The upper aqueous layer containing the RNA was then carefully transferred to another tube. Pre-chilled isopropanol was added to each sample tube in volumes equal to that of the aqueous layer for each sample. The isopropanol/RNA mix was then stored at −80 °C for a minimum of 30 minutes and subsequently centrifuged at maximum speed and 4 °C for 20 minutes. The supernatant was carefully removed and discarded without disturbing the pellet which was then washed with 75% ethanol. Pellets were air dried and re-suspended in nuclease-free water. The 2D cultured cells were trypsinized and collected in 15 mL falcon tubes and then centrifuged for 5 minutes at maximum speed to pellet the cells. The cell pellets were then washed with 1× PBS followed by RNA isolation using an RNeasy Plus Mini Kit (Cat No./ID: 74136, QIAGEN, Germany). To prepare the isolated RNA samples from 3D cultured cells for the subsequent differential expression analysis using RNA sequencing, samples were purified using the RNeasy Plus Mini Kit (Cat No./ID: 74136, QIAGEN, Germany) following the manufacturer's recommended procedure.2.17. RNA sample concentration measurement and quality assessment
Intact RNA with at least an RNA integrity number (RIN) of 8.0 or higher and concentration in the range of 0.1–1.0 μg was used for RNA sequencing library preparation as recommended. Subsequently, 1 μL of RNA was measured using the Qubit RNA BR Assay Kit (Q10210, USA) and the Qubit fluorimeter (Q33226, USA) following the manufacturer's instructions. Then RNA quality was evaluated using the bioanalyzer 2100 (G2939BA, USA). For this purpose, 1 μL of each RNA sample was run on a Bioanalyzer Nano or pico chip depending on the concentration of the RNA sample following the manufacturer's recommendations. The RNA integrity number (RIN) was examined to assess the sample quality. Samples with RIN of at least 8.0 or higher were selected for library preparation.2.18. RNA sequencing library preparation
Libraries were prepared following the TruSeq Stranded mRNA Sample Prep LS Protocol; illumina, Catalog # RS-122-9005DOC; Part # 15031058 Rev. E; October 2013. RNA samples were first purified, and mRNA was then fragmented. This was followed by the synthesis of the first strand and then the second strand cDNA. Subsequently, 3′ ends were Adenylated and adapters were then ligated. At this point, the libraries were purified, and DNA fragments were enriched then amplified.2.19. RNA-Seq libraries validation
The prepared libraries were quantified using the Qubit® dsDNA HS Assay Kit (Q32851, USA). The quality of the prepared libraries was then determined using a Bioanalyzer HS DNA or DNA 7500 chip depending on the Qubit concentration readings. The peaks produced were around 300 bp as recommended. All samples were then pooled in one lane, and RNA sequencing was carried out using an illumine Hiseq next-generation sequencing machine.2.20. RNA sequencing analysis
The FATSAQ files generated after the Illumina pair-end sequencing were first subjected to quality value filtering and adaptor trimming via Trimmomatic by using the default parameters.26 PRINSEQ software was used to remove the polyA 3′ tails.27 The resulting files were further checked for contamination with rRNA and tRNA by using BLASTN with human rRNA and tRNA datasets, respectively.28 The purified reads were subjected to alignment to the human genome GRCh38 using Bowtie2/Tophat2.29 The differentially expressed genes were determined by analyzing the data files with the help of the Cuffdiff command from the Cufflinks package using the default parameters.30 We selected the differentially expressed genes which showed at least a +1 log10 fold change and passed the Cuffdiff default statistical test. The final list of differentially expressed genes was subjected to gene ontology analysis by using the GORILLA web server to categorize the differentially expressed genes into different functional groups.31,32 All the genes showing differential expression across the different comparisons were pooled together in a single file, and a heat map was generated by using the “heatmap.2” function in the Rgplots package. To determine the genes that were differentially expressed across all the comparisons, we used the jvenn web server to compute the Venn diagrams.333. Results and discussion
3.1. Self-assembly characterization
Both tetrameric peptides, IVZK and IVFK are amphiphilic peptides, composed of an amidated N-terminus hydrophobic tail and an acetylated C-terminus polar lysine residue. IVZK contains a non-aromatic cyclo-hexylalanine (Cha) moiety instead of aromatic phenylalanine (Phe) in IVFK. Fig. 1a and Fig. S1–S3 (ESI†) show the chemical structures of both peptides, their formation of hydrogels at 5 mg mL−1 in phosphate-buffered saline and the corresponding scanning electron micrographs (SEM) depicting twisted nanofibers. The average diameter of a twisted IVFK fiber observed using transmission electron microscopy (TEM) was 10.3 nm (Fig. 1b and c). For twisted IVZK fibers, the TEM images showed three different types of average diameters (4 nm, 9 nm, and 16 nm), pointing to double or triple helical structures (Fig. 1b and c). Fibers with a diameter of 9 nm were the most abundant ones. The single monomer helical fiber exhibited an average diameter of 4 nm. The twisted nanofibers for both peptides were also observed using cryo-TEM (Fig. S4, ESI†).The hydrogel formation for both peptides was then deeply studied using a vial inversion test (Fig. S5, ESI†). The peptide solution was considered to have formed a complete gel if all the solution phase had been transformed to gel phase. We found that IVFK required more time to form hydrogels than IVZK at the same concentration. Interestingly, the IVZK hydrogel was spontaneously formed at relatively low concentration (0.8 wt% in 1× PBS), showing IVZK's potential as a bioink.
The secondary structures of the peptide during the self-assembly process were then determined from the collected Circular Dichroism (CD) spectra of all peptides at different concentrations (Fig. 1d). The CD spectra of IVZK and IVFK showed changing structural conformations from random coil to β-turn structures at increasing peptide concentrations with α-helical intermediates. Similar structural transitions of other amyloid-like ultrashort peptides were earlier extensively discussed.2,34 Compared to IVFK, the structural transitions of IVZK can be observed at lower concentrations. This result suggests that there is a connection between self-assembly rate and conformation change.
3.2. MD simulations
To further elucidate the self-assembly process, we conducted molecular dynamics simulations of both peptides IVZK and IVFK in water to study fiber formation at the atomic scale (Fig. 2). Two cases were considered for each of the peptides – 4-peptide assembly and 60-peptide assembly. The first case corresponds to a very dilute situation in which the peptide to water mole fraction is 0.001; this allows us to study local assembly behaviour. The second case corresponds to a more concentrated situation in which the peptide to water mole fraction reaches 0.004–0.006; this allows us to simulate fiber formation across the periodic boundary. For the 60- and 4-peptide assemblies, 10 independent trajectories were attempted accumulating a simulation time of 1 μs for each peptide.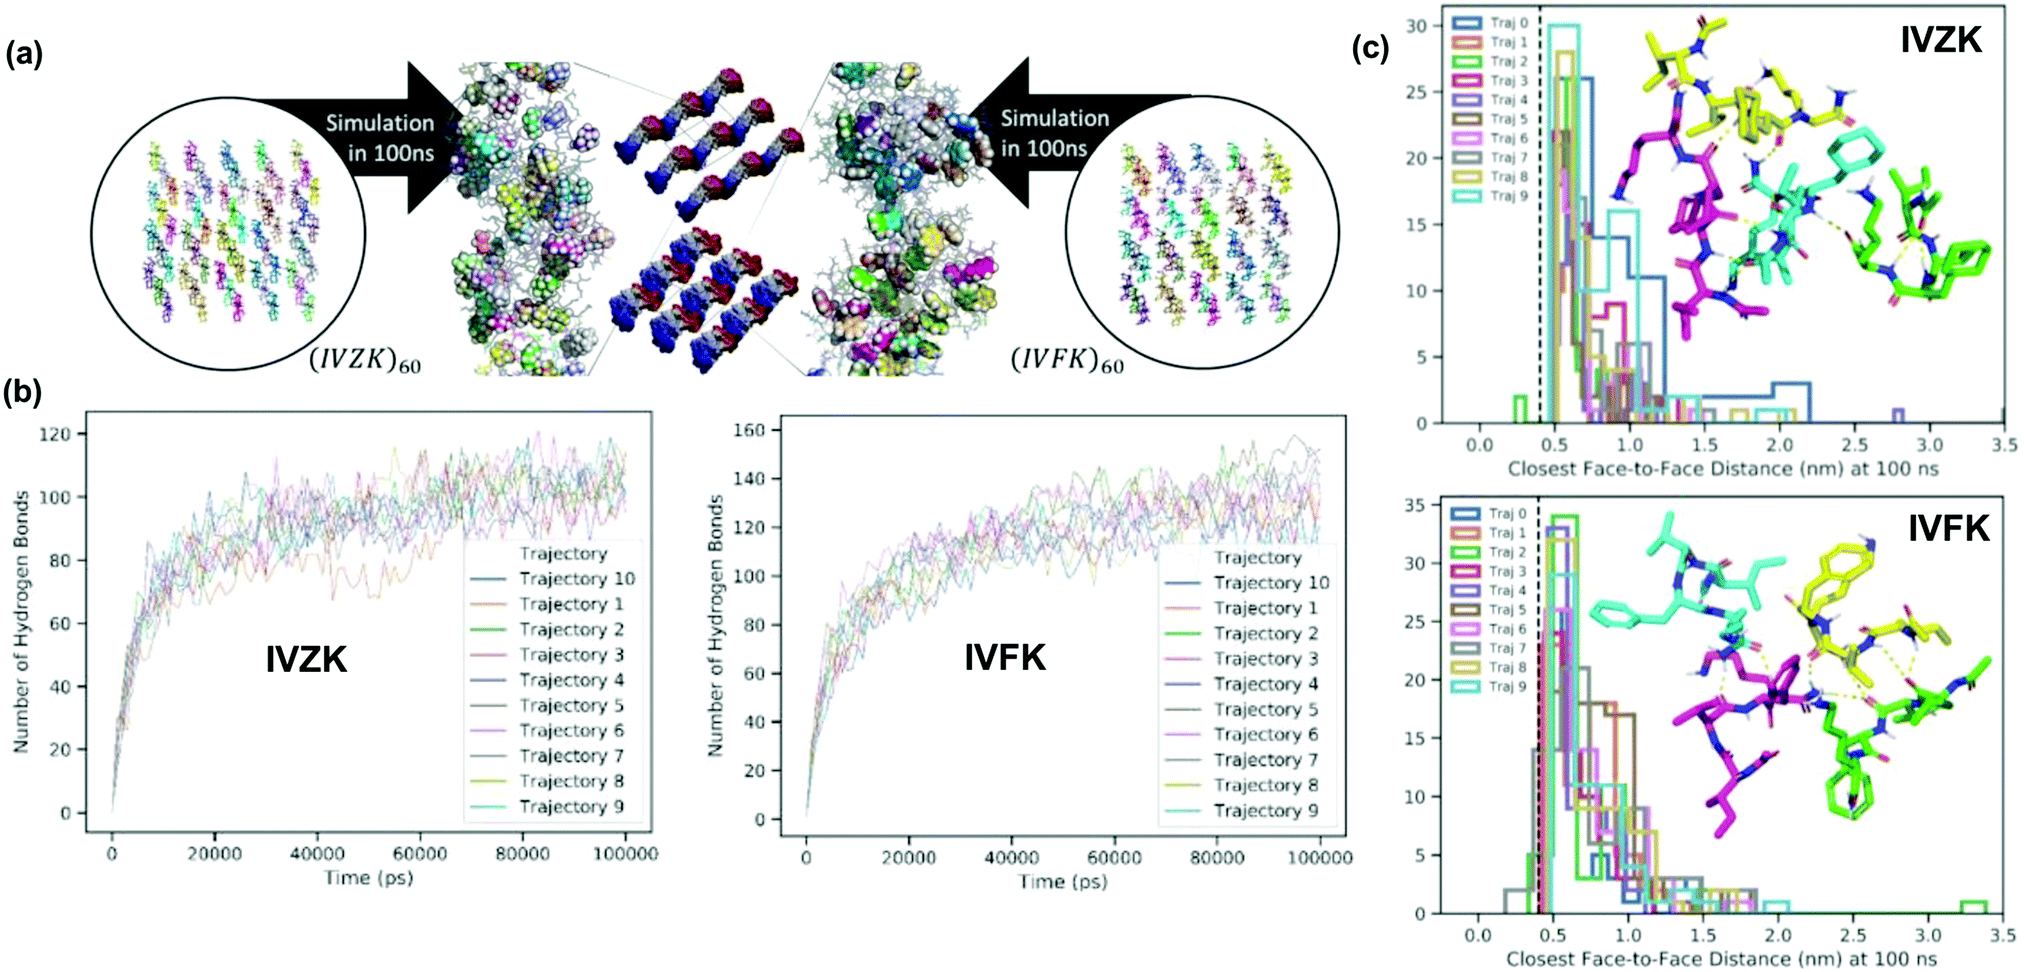 | ||
| Fig. 2 Molecular dynamics (MD) simulation studies of the peptides IVZK and IVFK. (a) Fibril structure formation for 60 peptides assembled at 100 ns. (b) Hydrogen bond analysis during the 100 ns simulation of sixty IVZK and IVFK peptide assembly. (c) The analysis of closest face-to-face distance among the six-membered ring in the Cha/Phe residue at 100 ns. | ||
We observed that the short peptide assemblies are largely maintained by hydrogen bond (H-bond) networks and interactions between hydrocarbons. In the 4-peptide assembly (Fig. S6 and Videos S1, S2, ESI†), the results show that the system can form an extensive H-bond structure, where one extreme of the extensiveness is the sheet structure, even if peptides were initially separated from each other for at least 1.2 nm.
We were also able to capture orderly sheet-like or sheet structures in part of the final fibre from the 60-peptide assembly (Fig. 2a and Fig. S7, Videos S3, S4, ESI†), even though the majority of the H-bond network was maintained otherwise. This suggests that H-bonds could play important roles in the formation of fibrils regardless of the peptide sequences. We also observed various forms of hydrogen bond networks, including β-turn-like (Fig. 2a inset stick diagram and Fig. S6, S7, ESI†) structures within simulation periods of 100 ns supporting our observations seen in the CD spectra (Fig. 1d). Note that the variance of H bond formation in IVFK is larger than that in IVZK suggesting that H-bond networks in IVZK are more consistent than those in IVFK (Fig. 2b).
We also show that π–π interaction is unimportant in the simulated fibril. In Fig. 2c inset histograms, we show that the majority of the face-to-face distance between the closest side chains of F (and Z) are >0.5 nm from one another. Given that the nominal distance for π-stacking is at <0.44 nm (dash line), it shows that the stacking is negligible, which is also apparent in the close-up snapshot of Fig. 2a, where the side chain F and Z were highlighted as space-filled representation.
Besides, the cyclo-hexylalanine (Z) sidechain in IVZK also plays a distinctive role in the fibril assembly. In Fig. S8 (ESI†), we show that the nominal distance between carbons in Z and their closest water atom HW or OW is much longer than that for carbons in F (Median at 0.48 nm versus 0.39 nm). This behavior could be explained by the flat, electron-donor exposed topology of the phenyl sidechain in F as opposed to the cyclo-hexyl ring in Z where electron-donors are screened by the covalently bonded hydrogens on the ring. This also suggests that Z is less solvent-accessible than F in general, which is consistent with the observations in MD trajectories.
3.3. Viscoelastic properties of self-assembled peptide bioinks
To investigate the viscoelastic properties of the peptide hydrogels, we determined the storage modulus (G′) and loss modulus (G′′) in an oscillatory rheology frequency sweep. In Fig. 3a and b, we show that the G′ values of IVFK and IVZK hydrogels are directly proportional to the concentration of the hydrogels. However, IVZK gels are significantly stiffer than IVFK gels which corroborates well with the more than twice as fast gelation time (Fig. 1a). In spite of having less stiffness than IVZK, the IVFK hydrogel is more elastic as the loss factor tanδ (G′′/G′) of IVFK hydrogel is less than that of IVZK.35 Also, we found that the stiffness for both tetrameric peptides was higher at the same molar concentration than that of earlier reported peptides with longer sequences such as hexamers.34,36 By changing the peptide concentration from 3 mg mL−1 to 10 mg mL−1, gels within a range of G′ from 6 kPa to 100 kPa could be achieved (Fig. 3c). Both peptides also showed a frequency-independent behaviour during a frequency sweep which is known to be a common viscoelastic property of hydrogels.37
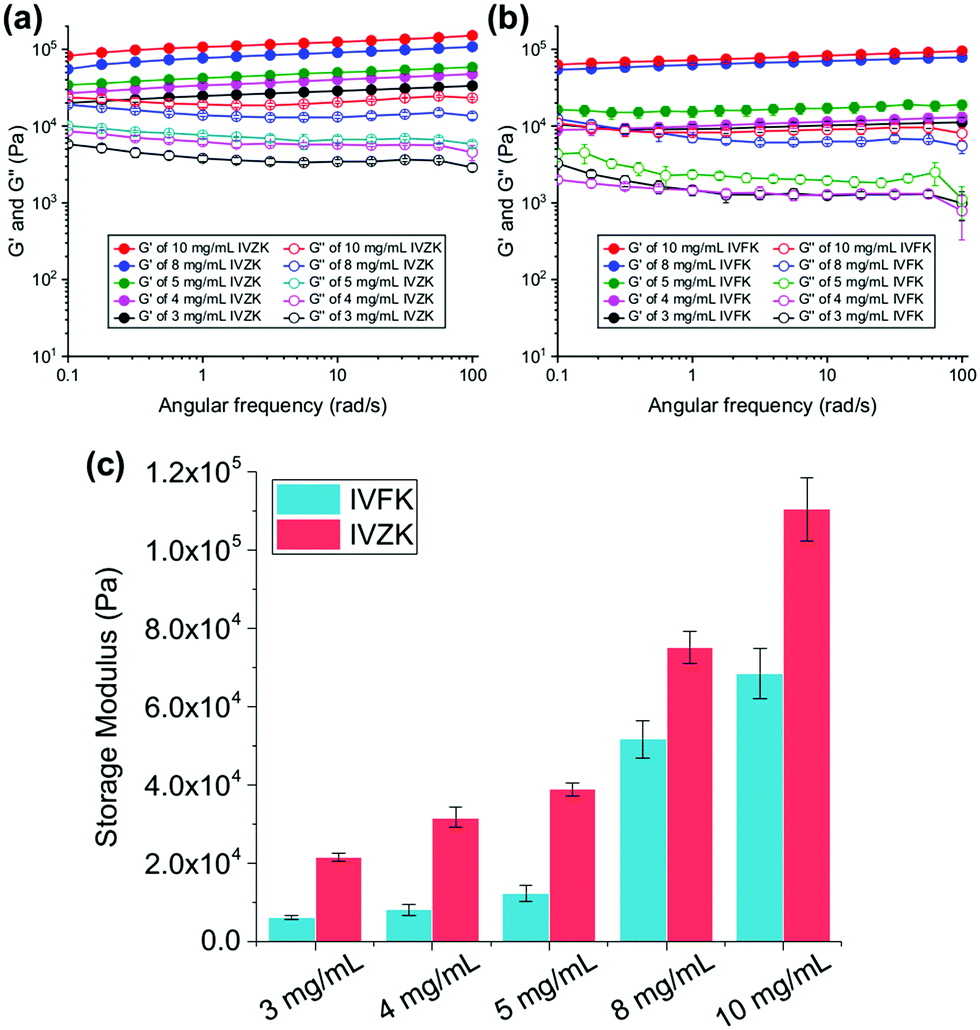 | ||
| Fig. 3 Rheological characterization of IVZK (a) and IVFK (b) at different concentrations using frequency sweep studies (storage modulus (G′) and loss modulus (G′′) as a function of angular frequency (ω)) (n = 6). (c) Comparison of the different G′ storage moduli of IVZK and IVFK at different peptide concentrations. | ||
An amplitude sweep was also carried out to determine the length of the linear viscoelastic region (LVR) under increasing strain values. It was found that IVZK gels have a shorter LVR at higher concentrations, while LVR for IVFK gels remains constant under 0.2% strain (Fig. S9, ESI†). This indicates that despite a lower storage modulus, IVFK has a better elasticity than IVZK. This result is congruent with the loss factor tan![[thin space (1/6-em)]](https://www.rsc.org/images/entities/i_char_2009.gif) δ from frequency sweep measurement.
δ from frequency sweep measurement.
3.4. 3D bioprinting of peptide bioinks
The bioprinter was developed in-house by integrating microfluidic pumps, a coaxial bioprinting nozzle and a four degrees-of-freedom robotic arm (Fig. 4a, left). A commercially available robotic 3D printer (Dobot Magician, Dobot) was converted into a bioprinter by exchanging the polymer extruder of the robotic arm with the bioprinting nozzle. This robotic system conveys high flexibility and accuracy as it incorporates swift rotational movement.38 It facilitates better printing than the majority of 3D bioprinters that rely on a traditional Cartesian based system for fabricating complex constructs. The Cartesian 3D printers often pose difficulty in flexibility and spatial manoeuvrability as they are bound by three degrees-of-freedom.39 Our robotic arm system conveys high flexibility and accuracy thus facilitating better prints. Compared to existing robotic arm bioprinters, our system constructs high resolution prints at much lower costs.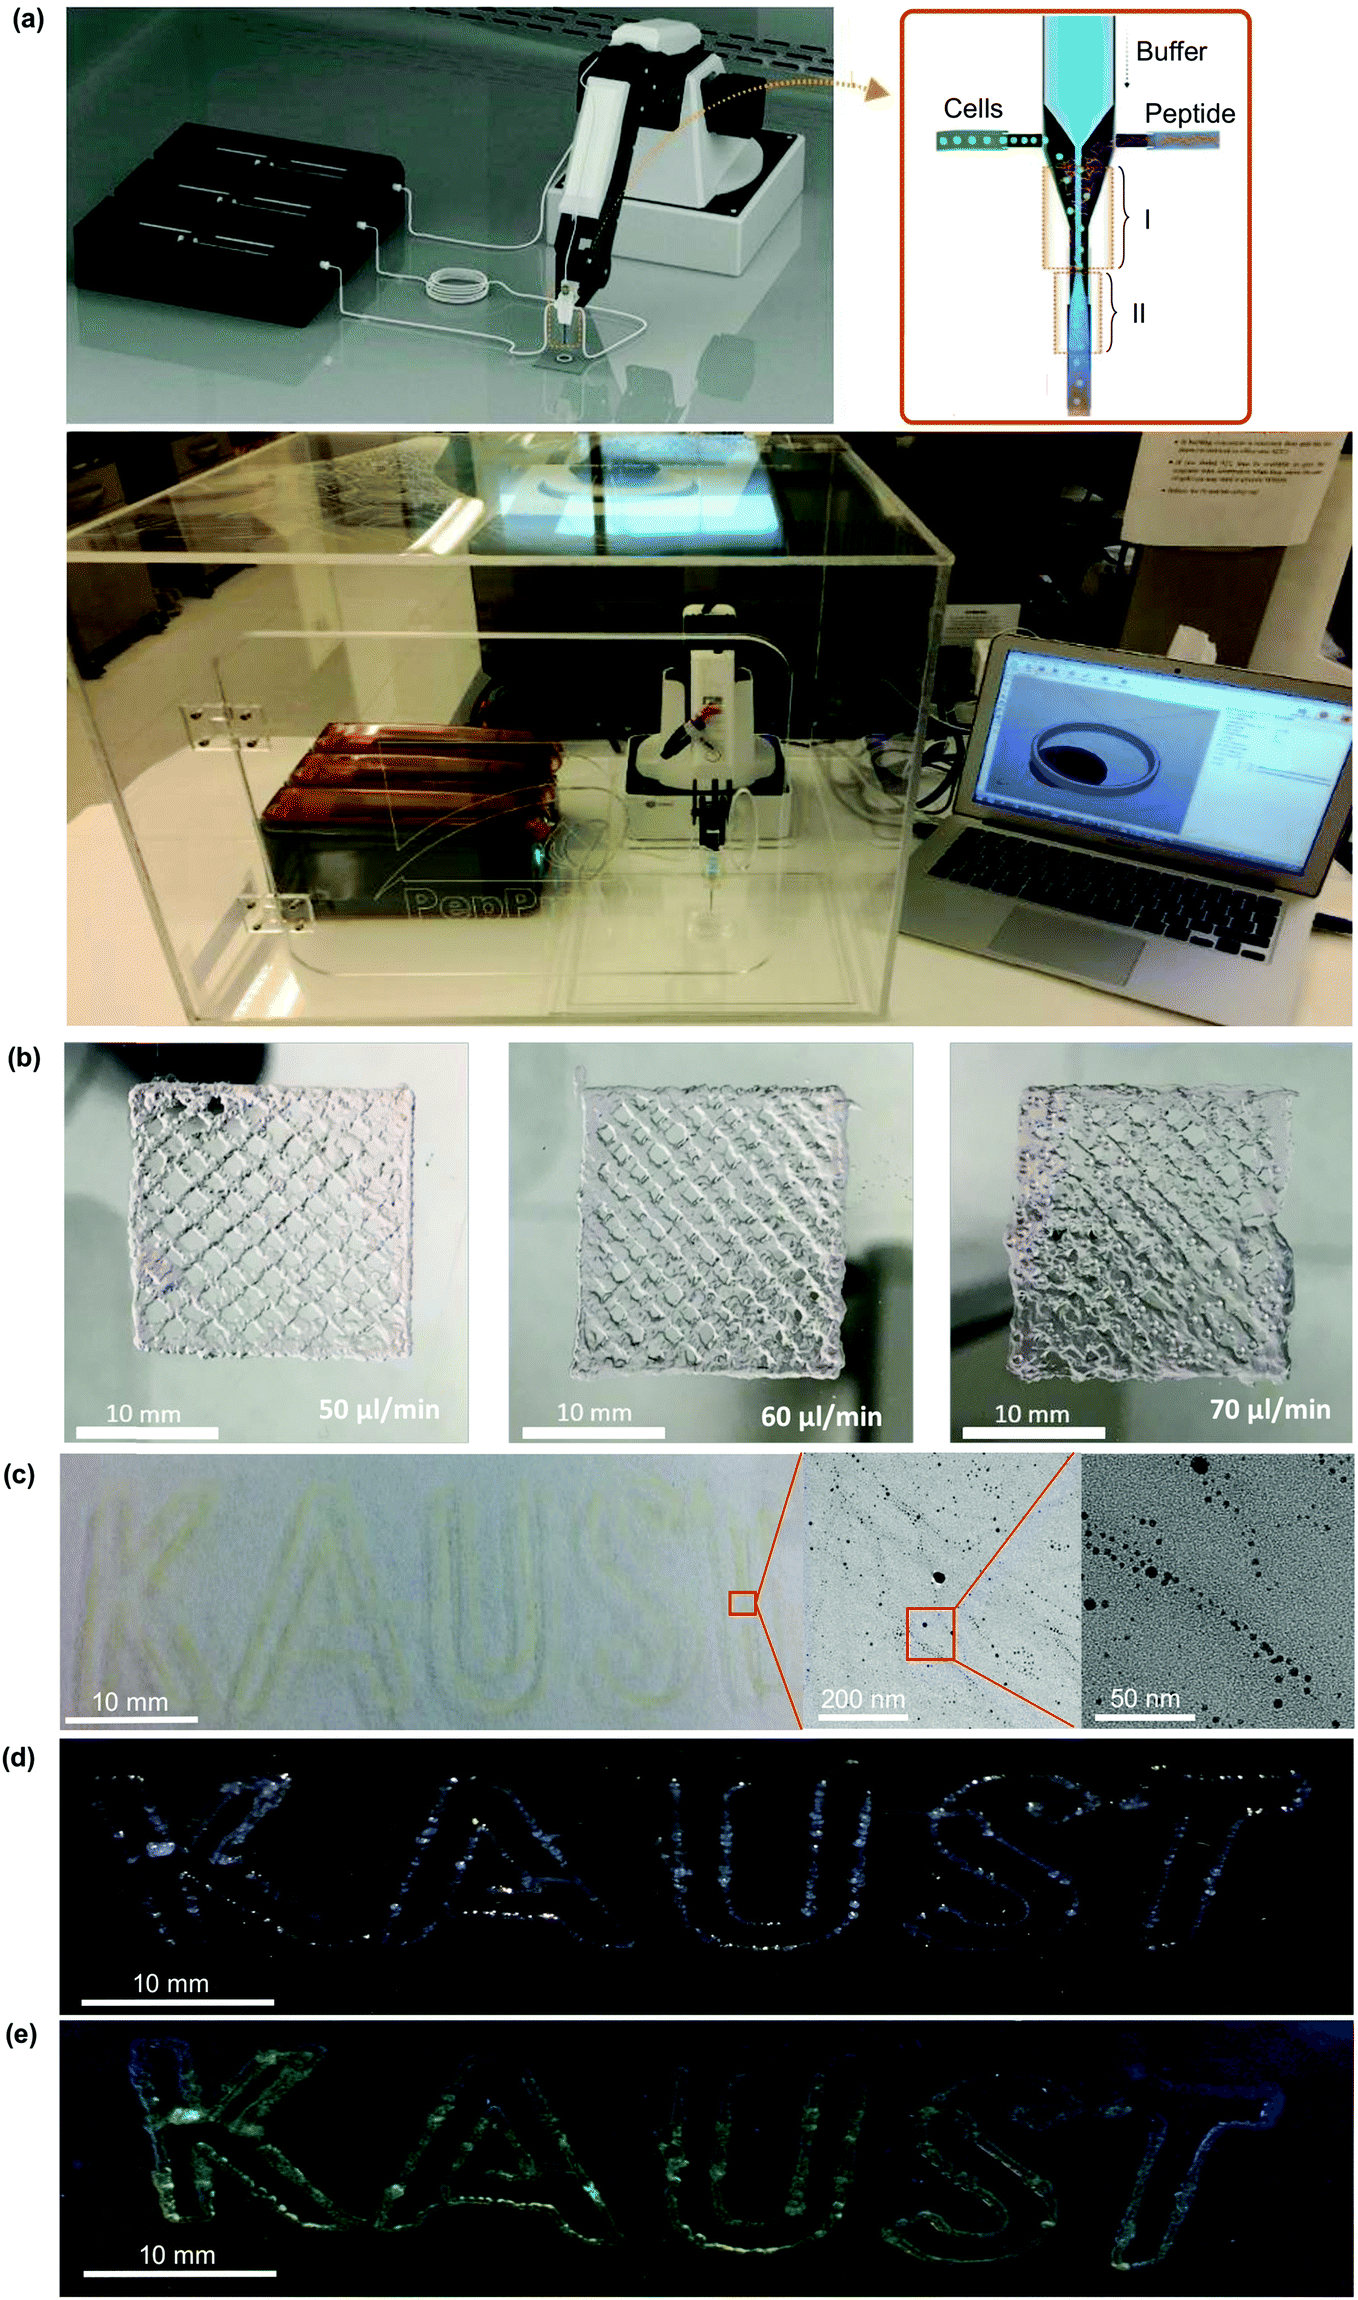 | ||
| Fig. 4 (a) Robotic 3D bioprinter set-up. The left picture shows a schematic picture of our robotic 3D bioprinter inside the biosafety cabinet consisting of microfluidic pumps, robotic arm and printing nozzle. The right picture shows the bioprinting set-up. All the bioprinting experiments involving printing of different cells were performed inside the biosafety cabinet. (b) Effect of different flow rates of peptide solution (50, 60 and 70 μL min−1) on the resolution of a bioprinted grid structure while keeping the flow rates of cells and phosphate buffer constant at 20 μL min−1, respectively. A good quality grid structure was obtained at a 50 μL min−1 flow rate in the case of IVZK peptide (15 mg mL−1). The scale bar in all figures is 10 mm. (c) In situ generated silver nanoparticles inside the 3D bioprinted IVZK peptide bioink. The yellowish color in the bioprinted text is due to the formation of silver nanoparticles. Transmission electron microscopy analysis shows that the average diameter of silver nanoparticles was 4.4 nm. (d and e) 3D bioprinted IVZK peptide bioink after inclusion of green colored quantum dots in the peptide solution without (d) and with (e) UV excitation at 365 nm. | ||
In order to print at physiological pH and to avoid premature mixing of the peptides and buffer, the nozzle of the robotic 3D bioprinter is specifically designed to contain two mixing zones (Fig. 4a, middle). It has a total of three inlets and one outlet. The tubing for the peptide solution and cell culture media (containing different cell types) inlets was inserted into the side wall of the main needle so that both fluids could mix in region i. The second needle was inserted inside the main needle from the top so that the solution from this needle (10× PBS) could mix smoothly with the other two solutions to form a peptide hydrogel close to the tip of the main needle (Fig. 4a, region ii). The length of the main needle was 2.5 cm, and the mixing region for the buffer with the cells and peptide was approximately 2.0 cm. Using this strategy, we were able to minimize the internal clogging of the nozzle while achieving higher resolution of printed structures.
Different shapes such as grids, text and 3D circles were bioprinted using the robotic 3D bioprinter, which moves freely in orthogonal directions according to arbitrary 3D CAD designs (Fig. 4b and Fig. S10, Videos S5–S8, ESI†). The resolution of the printed grid structures was compared at different flow rates of IVZK peptide solution – 50, 60 and 70 μL min−1 – while keeping the flow rates of the phosphate buffer solution and the cell line constant at 20 μL min−1. The concentrations of the peptide and phosphate buffer were also kept constant at 15 mg mL−1 and 10× PBS, respectively. Fig. 4b shows a good resolution obtained at 50 μL min−1, displaying a suitable ratio of peptide to PBS flow to enable the formation of a homogenous hydrogel. At higher flow rates, excessive gelling resulted in several clumps in the structures which decreased the resolution. On comparing the different peptides, IVZK, IVFK and two previously reported hexameric LK6 (Ac-LIVAGK-NH2) and IK6 (Ac-ILVAGK-NH2) bioinks3,4 (Fig. S10, ESI†), it was found that the printability of these peptides is similar with some diversities due to differences in their viscoelastic behaviour with the performance order as follows IVZK ≈ LK6 > IVFK > IK6. Currently, the best performance was achieved using ultrashort peptides IVZK and LK6 in terms of printability and by IVZK in terms of long-term stability of the printed structures (Fig. S11, ESI†). Scanning electron microscopy (SEM) analysis of 3D bioprinted IVZK structures revealed the nanofibrous structure of the peptide scaffold with a partial shear alignment of peptide fibers (Fig. S12, ESI†).
We also showed the versatility of our 3D bioprinting method by printing nanomaterials within the 3D constructs. Fig. 4c shows the in situ synthesis of silver nanoparticles inside the 3D bioprinted construct. The peptide bioinks provided sufficient nucleation sites for silver ions, and after UV irradiation, silver nanoparticles were formed inside the 3D construct. The formation of silver nanoparticles appeared with a yellowish color in the 3D bioprinted text compared to the transparent bioprinted text (Fig. 4b). The TEM analysis showed that the silver nanoparticles formed during this process have an average diameter of 4.4 nm (Fig. S13, ESI†). Silver nanoparticles were found to be aligned along the peptide fibers due to the nucleation of silver ions at the peptide moieties.40 Moreover, we also incorporated nanomaterials such as quantum dots during the 3D bioprinting process (Fig. 4d and e). These results showed the potential of our bioprinting method to print several nanomaterials and the synthesis of potential new nanomaterials within the 3D scaffolds for various applications in materials science.
3.5. 3D bioprinting of human skin fibroblast cells (HDFn) and human bone marrow-derived mesenchymal stem cells (hBMSCs)
To achieve a uniform distribution of the cells throughout the 3D bioprinted construct, we introduced a loop concept (Fig. 4a) using microfluidic tubing to load the cells firstly into the loop that can hold up to 1 mL of cell suspension. After loading the cells, the loop was connected with a 1 mL syringe containing cell culture media. The cells in the loop were then moved towards the nozzle by pumping cell culture media inside the loop with the microfluidic pump. This enabled uniform mixing of the cells with the peptide solution inside the nozzle (region i) which ultimately resulted in the uniform distribution of the cells in the printed hydrogel (region ii) as shown in Fig. 4a. On the other hand, when the cells were loaded directly into the syringe, they were quickly sedimented which resulted in the poor distribution of the cells in the 3D construct. Due to the micron-sized diameter of the microfluidic tubing, the cells were uniformly distributed throughout the construct.To test the efficacy of our 3D printing method, human skin fibroblasts cells (HDFn) were printed into a simple ring structure in a layer-by-layer fashion with an outer diameter of about 8 mm and thickness of 1.2 mm. The printed constructs were cultured for 21 days to test for biocompatibility. As a control, HDFn cells were printed into a similar 3D circular shape using alginate–gelatin as the bioink with a commercially available 3D bioprinter.41 Fluorescence confocal microscopy images showed the cytoskeletal staining of printed HDFn (Fig. 5a). Printed HDFn cells attained excellent spreading within IVFK and IVZK scaffolds after 21 days of culture as compared to alginate–gelatin following the actin network. In addition, 3D cell viability assays (Fig. 5b) were used to assess the proliferation of the 3D printed HDFn cell constructs. Cell proliferation increased for all bioinks at a similar rate until seven days in culture. After 14 days and 21 days of culture, the cell proliferation in IVFK and IVZK was comparable but higher than that of alginate–gelatin. These results therefore suggest that the nanofibrous structure of the IVFK and IVZK scaffolds provides a better ECM-like environment sufficient due to their favourable porosity and large surface area in contrast to alginate–gelatin.41 The shape fidelity of the 3D printed cell-containing constructs is another critical parameter to assess the printing efficacy.42 The ring structures printed with our peptide bioinks maintained their shapes throughout the 21 days of culture while alginate–gelatin structures lost their shape more quickly (Fig. 5c). This suggests that our new bioinks are more durable after printing.
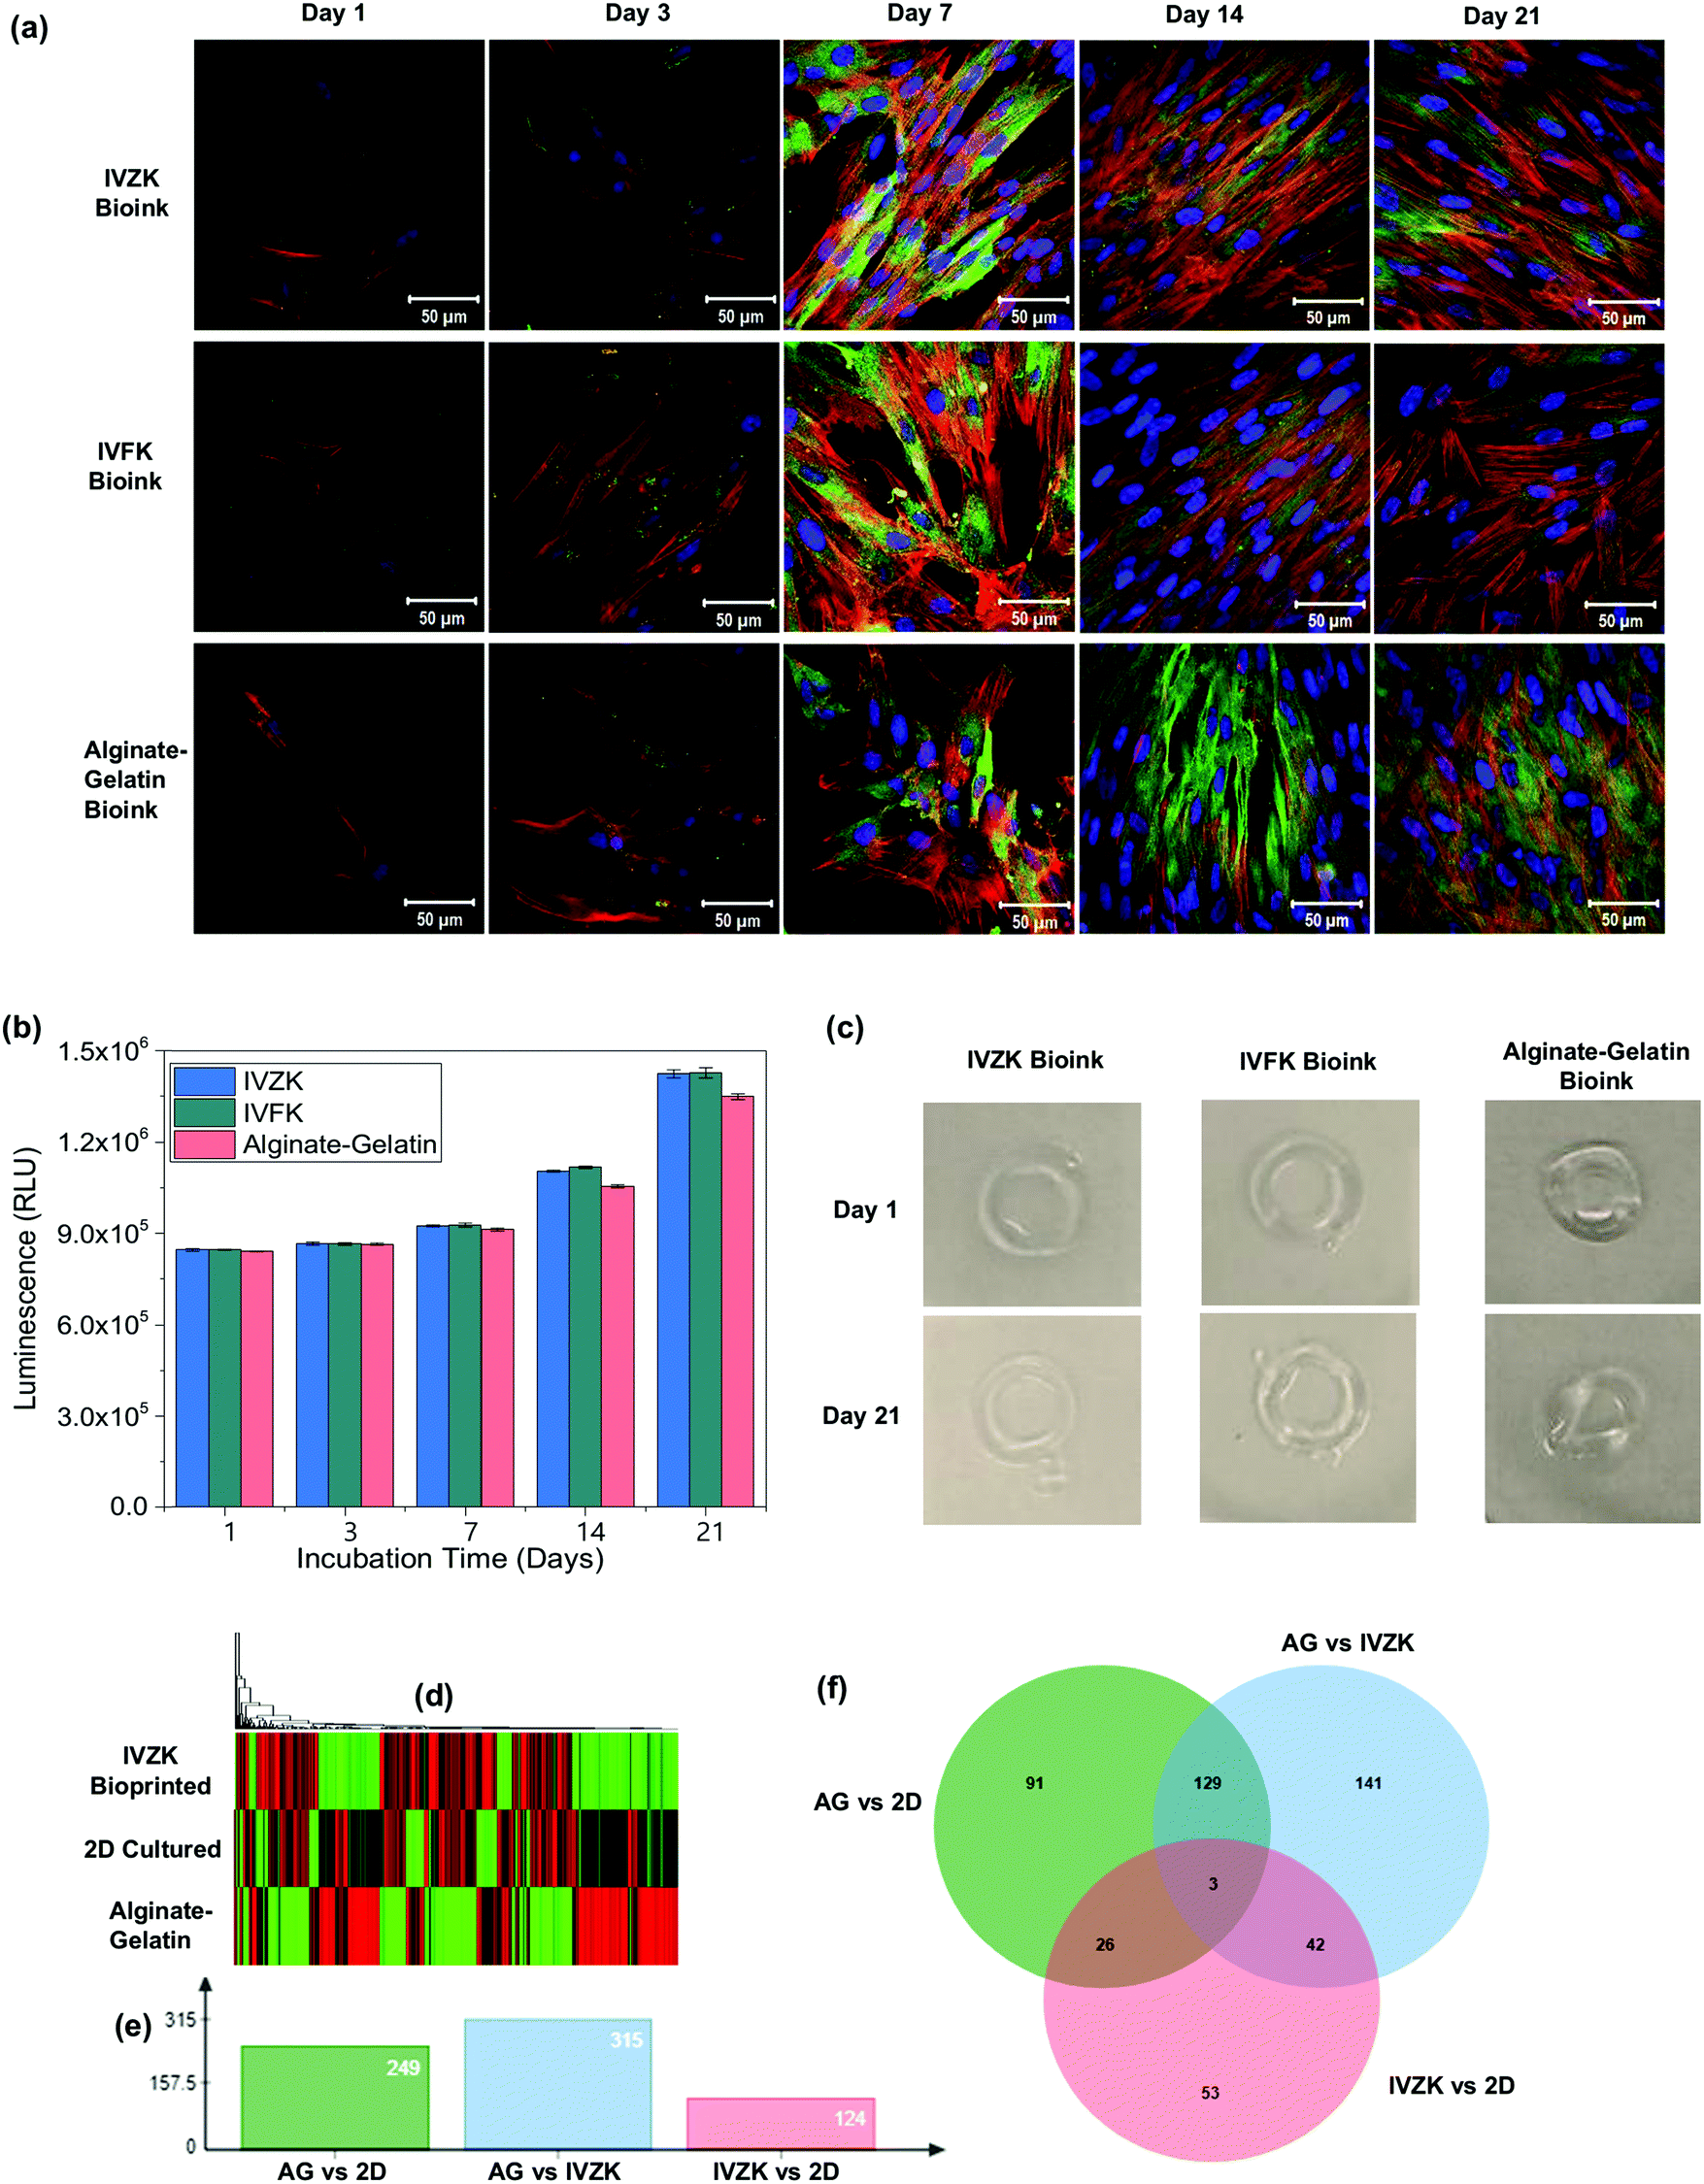 | ||
| Fig. 5 3D bioprinting of human dermal fibroblast (HDFn) cells. (a) Fluorescence confocal microscopy images of HDFn cells using IVZK, IVFK, and alginate–gelatin bioinks at different days of cell culture (nucleus shown in blue, F-actin shown in red and vinculin in green). (b) 3D cell viability assay of HDFn cells in IVFK, IVZK, and alginate–gelatin bioinks at various time points. For each time point, n = 3 samples were measured. (c) Picture of hydrogels containing HDFn cells printed on day 1 and after culturing in the media for 21 days. The color picture was changed to grey scale background to make the hydrogels more visible. (d) Differential transcriptomic expression of human dermal fibroblast (HDFn) cells using IVZK, and alginate–gelatin bioinks. Heat map of 7-day-old HDFn cells cultured in 2D, 3D alginate–gelatin and IVZK bioinks showing differential expression of genes with red color showing downregulation and green color showing upregulation. (e) Graphical representation of the total number of differentially expressed genes across different treatments in which AG stands for cells cultured in 3D alginate–gelatin scaffold, 2D stands for cells cultured on tissue culture plate, and IVZK stands for cells bioprinted with IVZK bioink. (f) Venn diagram of representative genes that are commonly differentially expressed across all treatments as explained in (e). See also ESI† for results from Gorilla software IVZK vs. 2D, Alginate–gelatin (AG) vs. IVZK, and alginate–gelatin (AG) vs. 2D. | ||
In addition, we used RNA sequencing to compare the difference in gene expression patterns in HDFn cells cultured in 2D, and 3D bioprinted in IVZK and alginate–gelatin (AG) bioinks. Our results showed a unique transcriptomic pattern in each case (Fig. 5d), and we identified 459 genes that were differentially expressed across all comparisons. Break down of genes into different comparisons showed that there was a total of 249 genes which were differentially expressed in cells cultured in 2D vs. cells cultured in 3D bioprinted alginate–gelatin scaffolds followed by 315 genes in the case of 3D bioprinted alginate–gelatin vs. 3D bioprinted IVZK peptide (Fig. 5e). A comparison of 3D bioprinted IVZK vs. 2D cultured cells showed a change in the expression level of 124 genes (Fig. 5e). Gene ontology enrichment analysis was conducted by using the GORILLA web-based server of differentially expressed genes,32 which classified the genes identified by function into 45 different functional groups in AG vs. 2D comparison, 50 in the case of IVZK vs. AG and 17 between IVZK and 2D. Here, among all the comparisons, the most common highly changed functional group is the cytoskeleton protein binding group, which confirms the report in previous studies of a clear difference in the ECM in both 2D and 3D cultured cells.43
To find out the genes that were differentially expressed in all the group comparisons we employed jvenn, a web-based server to compute a Venn diagram.32 The results showed that three genes named ANGPTL4, THBD, and CITED2 were found to be differentially expressed across all comparisons suggesting that these genes might be essential for the proper functioning of human fibroblast cells (Fig. 5f). Interestingly, ANGPTL4 was reported to regulate epidermal differentiation44 and promote wound healing.45 Thrombomodulin (THBD) is an integral endothelial-specific receptor that is involved in the blood coagulation mechanism.46 Moreover, CITED2 was found to have an important role in controlling fibroblast proliferation.47 Further in-depth studies are required to elucidate the importance of these three genes in the case of the growth of human fibroblast cells. However, our results highlighted an essential aspect of the different expression pattern of genes in human fibroblast cells cultured in 2D and 3D bioprinted scaffolds.
To demonstrate the versatility of our method and its potential to be used for other types of cells, we printed human bone marrow-derived mesenchymal stem cells (hBMSCs) using the IVZK bioink and compared it with the alginate–gelatin bioink (Fig. S14, ESI†).
4. Conclusion
We believe that our unique in situ 3D bioprinting method is advantageous over the existing printing methods due to its ability to print under truly physiological conditions. In addition, the two novel tetrameric peptide bioinks proved to be durable and easily printable, and offered excellent biocompatibility towards tested cell lines including human skin fibroblast cells and human mesenchymal stem cells. Improved bioinks and printing techniques will advance the use of 3D bioprinting technologies for a wide range of applications, including tissue engineering and regenerative medicine.Conflicts of interest
C. A. E. H. and S. R. are inventors on intellectual property related to this work.Acknowledgements
The work was supported by funding from King Abdullah University of Science and Technology (KAUST). Synthesis of IVFK and IVZK peptides was first performed at the Institute of Bioengineering and Nanotechnology, A*Star, Singapore. The authors would like to acknowledge Prof. Takashi Gojobori, Hajime Ohyanagi and Dr Katsuhiko Mineta for providing help in analyzing the RNA sequencing data. Visiting student and scholarship holder from the Studienstiftung des deutschen Volkes Ms Annemarie Kehl, Georg-August University Goettingen, Germany, kindly helped in measuring the CD spectra. The authors would like to acknowledge KAUST's Core Labs for supporting the sequencing and microscopy analyses.Notes and references
- E. F. Banwell, E. S. Abelardo, D. J. Adams, M. A. Birchall, A. Corrigan, A. M. Donald, M. Kirkland, L. C. Serpell, M. F. Butler and D. N. Woolfson, Nat. Mater., 2009, 8, 596–600 CrossRef CAS.
- C. A. Hauser, R. Deng, A. Mishra, Y. Loo, U. Khoe, F. Zhuang, D. W. Cheong, A. Accardo, M. B. Sullivan, C. Riekel, J. Y. Ying and U. A. Hauser, Proc. Natl. Acad. Sci. U. S. A., 2011, 108, 1361–1366 CrossRef CAS.
- A. Mishra, Y. H. Loo, R. H. Deng, Y. J. Chuah, H. T. Hee, J. Y. Ying and C. A. E. Hauser, Nano Today, 2011, 6, 232–239 CrossRef CAS.
- Y. Loo, A. Lakshmanan, M. Ni, L. L. Toh, S. Wang and C. A. E. Hauser, Nano Lett., 2015, 15, 6919–6925 CrossRef CAS.
- K. Fukunaga, H. Tsutsumi and H. Mihara, Bull. Chem. Soc. Jpn., 2019, 92, 391–399 CrossRef CAS.
- J. Li, R. Xing, S. Bai and X. Yan, Soft Matter, 2019, 15, 1704–1715 RSC.
- Z. Yang, H. Xu and X. Zhao, Adv. Sci., 2020, 7, 1903718 CrossRef CAS.
- S. Bertlein, G. Brown, K. S. Lim, T. Jungst, T. Boeck, T. Blunk, J. Tessmar, G. J. Hooper, T. B. F. Woodfield and J. Groll, Adv. Mater., 2017, 29, 1703404 CrossRef.
- N. Hakimi, R. Cheng, L. Leng, M. Sotoudehfar, P. Q. Ba, N. Bakhtyar, S. Amini-Nik, M. G. Jeschke and A. Gunther, Lab Chip, 2018, 18, 1440–1451 RSC.
- L. Ouyang, C. B. Highley, W. Sun and J. A. Burdick, Adv. Mater., 2017, 29, 1604983 CrossRef.
- L. Moroni, J. A. Burdick, C. Highley, S. J. Lee, Y. Morimoto, S. Takeuchi and J. J. Yoo, Nat. Rev. Mater., 2018, 3, 21–37 CrossRef CAS.
- N. Gjorevski, N. Sachs, A. Manfrin, S. Giger, M. E. Bragina, P. Ordonez-Moran, H. Clevers and M. P. Lutolf, Nature, 2016, 539, 560–564 CrossRef CAS.
- D. L. Alge and K. S. Anseth, Nat. Mater., 2013, 12, 950–952 CrossRef CAS.
- H. W. Kang, S. J. Lee, I. K. Ko, C. Kengla, J. J. Yoo and A. Atala, Nat. Biotechnol., 2016, 34, 312–319 CrossRef CAS.
- J. Jang, H. J. Park, S. W. Kim, H. Kim, J. Y. Park, S. J. Na, H. J. Kim, M. N. Park, S. H. Choi, S. H. Park, S. W. Kim, S. M. Kwon, P. J. Kim and D. W. Cho, Biomaterials, 2017, 112, 264–274 CrossRef CAS.
- B. Raphael, T. Khalil, V. L. Workman, A. Smith, C. P. Brown, C. Streuli, A. Saiani and M. Domingos, Mater. Lett., 2017, 190, 103–106 CrossRef CAS.
- W. L. Jorgensen and J. Tirado-Rives, Proc. Natl. Acad. Sci. U. S. A., 2005, 102, 6665–6670 CrossRef CAS.
- L. S. Dodda, I. Cabeza de Vaca, J. Tirado-Rives and W. L. Jorgensen, Nucleic Acids Res., 2017, 45, W331–W336 CrossRef CAS.
- T. M. M. J. Abraham, R. Schulz, S. Páll, J. C. S. B. Hess and E. Lindahl, SoftwareX, 2015, 1–2, 19–25 CrossRef.
- D. Y. Tom Darden and L. Pedersen, J. Chem. Phys., 1993, 98, 10089–10092 CrossRef.
- H. J. C. Berendsen, J. P. M. Postma, W. F. V. Gunsteren, A. DiNola and J. R. Haak, J. Chem. Phys., 1984, 81, 3684–3690 CrossRef CAS.
- G. Bussi, D. Donadio and M. Parrinello, J. Chem. Phys., 2007, 126, 014101 CrossRef.
- M. R. Reithofer, A. Lakshmanan, A. T. K. Ping, J. M. Chin and C. A. E. Hauser, Biomaterials, 2014, 35, 7535–7542 CrossRef CAS.
- D. F. Gilbert, G. Erdmann, X. Zhang, A. Fritzsche, K. Demir, A. Jaedicke, K. Muehlenberg, E. E. Wanker and M. Boutros, PLoS One, 2011, 6, e28338 CrossRef CAS.
- S. E. Kim, D. N. Heo, J. B. Lee, J. R. Kim, S. H. Park, S. H. Jeon and I. K. Kwon, Biomed. Mater., 2009, 4, 044106 CrossRef.
- A. M. Bolger, M. Lohse and B. Usadel, Bioinformatics, 2014, 30, 2114–2120 CrossRef CAS.
- R. Schmieder and R. Edwards, Bioinformatics, 2011, 27, 863–864 CrossRef CAS.
- S. F. Altschul, W. Gish, W. Miller, E. W. Myers and D. J. Lipman, J. Mol. Biol., 1990, 215, 403–410 CrossRef CAS.
- D. Kim, G. Pertea, C. Trapnell, H. Pimentel, R. Kelley and S. L. Salzberg, Genome Biol., 2013, 14, R36 CrossRef.
- C. Trapnell, A. Roberts, L. Goff, G. Pertea, D. Kim, D. R. Kelley, H. Pimentel, S. L. Salzberg, J. L. Rinn and L. Pachter, Nat. Protoc., 2012, 7, 562–578 CrossRef CAS.
- E. Eden, D. Lipson, S. Yogev and Z. Yakhini, PLoS Comput. Biol., 2007, 3, e39 CrossRef.
- E. Eden, R. Navon, I. Steinfeld, D. Lipson and Z. Yakhini, BMC Bioinf., 2009, 10, 48 CrossRef.
- P. Bardou, J. Mariette, F. Escudie, C. Djemiel and C. Klopp, BMC Bioinf., 2014, 15, 293 CrossRef.
- A. Lakshmanan, D. W. Cheong, A. Accardo, E. Di Fabrizio, C. Riekel and C. A. Hauser, Proc. Natl. Acad. Sci. U. S. A., 2013, 110, 519–524 CrossRef CAS.
- D. C. Tuncaboylu, A. Argun, M. Sahin, M. Sari and O. Okay, Polymer, 2012, 53, 5513–5522 CrossRef CAS.
- W. Y. Seow, G. Salgado, E. B. Lane and C. A. E. Hauser, Sci. Rep., 2016, 6, 32670 CrossRef CAS.
- M. A. Greenfield, J. R. Hoffman, M. O. de la Cruz and S. I. Stupp, Langmuir, 2010, 26, 3641–3647 CrossRef CAS.
- K. Kahin, Z. Khan, M. Albagami, S. Usman, S. Bahnshal, H. Alwazani, M. Majid, S. Rauf and C. Hauser, Proc. SPIE, 2019, 10875, 108750Q Search PubMed.
- D. Chimene, C. W. Peak, J. L. Gentry, J. K. Carrow, L. M. Cross, E. Mondragon, G. B. Cardoso, R. Kaunas and A. K. Gaharwar, ACS Appl. Mater. Interfaces, 2018, 10, 9957–9968 CrossRef CAS.
- E. Pazos, E. Sleep, C. M. Rubert Perez, S. S. Lee, F. Tantakitti and S. I. Stupp, J. Am. Chem. Soc., 2016, 138, 5507–5510 CrossRef CAS.
- T. Jiang, J. G. Munguia-Lopez, S. Flores-Torres, J. Grant, S. Vijayakumar, A. Leon-Rodriguez and J. M. Kinsella, Sci. Rep., 2017, 7, 4575 CrossRef.
- T. Jungst, W. Smolan, K. Schacht, T. Scheibel and J. Groll, Chem. Rev., 2016, 116, 1496–1539 CrossRef CAS.
- R. Edmondson, J. J. Broglie, A. F. Adcock and L. Yang, Assay Drug Dev. Technol., 2014, 12, 207–218 CrossRef CAS.
- M. Pal, M. J. Tan, R.-L. Huang, Y. Y. Goh, X. L. Wang, M. B. Y. Tang and N. S. Tan, PLoS One, 2011, 6, e25377 CrossRef CAS.
- Z. Teo, J. S. K. Chan, H. C. Chong, M. K. Sng, C. C. Choo, G. Z. M. Phua, D. J. R. Teo, P. Zhu, C. Choong, M. T. C. Wong and N. S. Tan, Sci. Rep., 2017, 7, 6303 CrossRef.
- Y. Dargaud, J. Y. Scoazec, S. J. H. Wielders, C. Trzeciak, T. M. Hackeng, C. Négrier, H. C. Hemker, T. Lindhout and E. Castoldi, Blood, 2015, 125, 1497–1501 CrossRef CAS.
- K. R. Kranc, S. D. Bamforth, J. Bragança, C. Norbury, M. van Lohuizen and S. Bhattacharya, Mol. Cell. Biol., 2003, 23, 7658–7666 CrossRef CAS.
Footnotes |
| † Electronic supplementary information (ESI) available. See DOI: 10.1039/d0tb02424d |
| ‡ Current address: Tissue Engineering & Additive Manufacturing (TEAM) Lab, Centre for Nanotechnology & Advanced Biomaterials, School of Chemical & Biotechnology, SASTRA Deemed University, Tirumalaisamudram, Thanjavur-613 401, Tamil Nadu, India. |
| This journal is © The Royal Society of Chemistry 2021 |