 Open Access Article
Creative Commons Attribution 3.0 Unported Licence
Correction: Metal chalcogenide-associated catalysts enabling CO2 electroreduction to produce low-carbon fuels for energy storage and emission reduction: catalyst structure, morphology, performance, and mechanism
Xiaolin
Shao
a,
Xurui
Zhang
a,
Yuyu
Liu
*a,
Jinli
Qiao
bc,
Xiao-Dong
Zhou
d,
Nengneng
Xu
d,
Jamie L.
Malcombe
d,
Jin
Yi
a and
Jiujun
Zhang
a
aInstitute for Sustainable Energy, College of Sciences, Shanghai University, Shangda Road 99, Baoshan, Shanghai 200444, China. E-mail: liuyuyu@shu.edu.cn; liuyuyu2014@126.com; Tel: +86 187 21521461
bShanghai Institute of Pollution Control and Ecological Security, Shanghai 200092, China
cCollege of Environmental Science and Engineering, Donghua University, Shanghai 201620, China
dInstitute for Materials Research and Innovation, Department of Chemical Engineering, University of Louisiana at Lafayette, Lafayette, Louisiana 70504, USA
First published on 26th February 2021
Abstract
Correction for ‘Metal chalcogenide-associated catalysts enabling CO2 electroreduction to produce low-carbon fuels for energy storage and emission reduction: catalyst structure, morphology, performance, and mechanism’ by Xiaolin Shao et al., J. Mater. Chem. A, 2021, 9, 2526–2559, DOI: 10.1039/D0TA09232K.
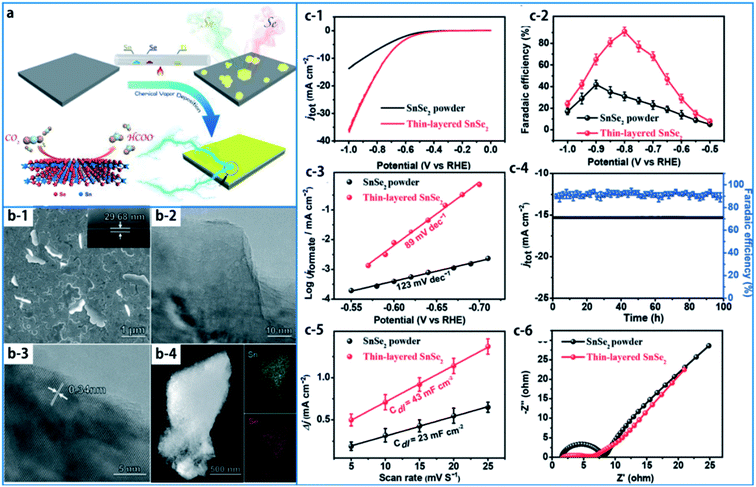
In the published article, Fig. 20 was accidentally omitted (a duplicate of Fig. 19 appears in its intended place). The corrected Fig. 20 and its caption are as shown here:
The Royal Society of Chemistry apologises for these errors and any consequent inconvenience to authors and readers.
| This journal is © The Royal Society of Chemistry 2021 |

