
 Open Access Article
 This Open Access Article is licensed under a Creative Commons Attribution-Non Commercial 3.0 Unported Licence
Applications of thermodynamic calculations to practical TEG design: Mg2(Si0.3Sn0.7)/Cu interconnections†
Silvana
Tumminello
 *a,
Sahar
Ayachi
a,
Suzana G.
Fries
b,
Eckhard
Müller
ac and
Johannes
de Boor
ad
*a,
Sahar
Ayachi
a,
Suzana G.
Fries
b,
Eckhard
Müller
ac and
Johannes
de Boor
ad
aInstitute of Materials Research, German Aerospace Center, D-51170 Cologne, Germany. E-mail: silvana.tumminello@dlr.de
bMaterials Research Department, Ruhr University Bochum, D-44801 Bochum, Germany
cInstitute of Inorganic and Analytical Chemistry, Justus Liebig University Gießen, D-35392 Gießen, Germany
dInstitute of Technology for Nanostructures, University of Duisburg-Essen, D-47057 Duisburg, Germany
First published on 5th August 2021
Abstract
Magnesium silicide stannide solid solutions, Mg2(Si,Sn), are prominent materials in the development of devices for thermoelectric energy conversion for intermediate operating temperatures, owing to the high values of their thermoelectric figure of merit zT, elemental abundance, and non-toxicity. The manufacturing of thermoelectric generators, however, relies also upon long-term stable contacts with low thermal and electrical resistivity and good bonding of the metallic contact bridge (electrode) to the thermoelectric legs of Mg2(Si,Sn) with a similar thermal expansion coefficient. In the assembly of thermoelectric generators, the thermoelectric legs have to be bonded to metallic electrodes to establish an electrical circuit. In this work, contacts between Mg2(Si0.3Sn0.7) and Cu were made at 600 °C and investigated using thermodynamic equilibrium calculations to gain understanding on the phase transformations occurring in the bonding process. Cu is selected as a metallic electrode as it is a highly conductive element with a thermal expansion coefficient similar to that of the thermoelectric material. Contacting methods usually deviate from equilibrium conditions; nevertheless, we use this contact couple to illustrate that equilibrium thermodynamic considerations are an efficient support to anticipate and identify the reaction products forming the final microstructure of the bonded region, and ultimately, for improving the contact design. A thermodynamic database of Gibbs energies for quaternary Cu–Mg–Si–Sn was built up and made available in this work. With this database, thermodynamic calculations were done in order to complement the experimental observations on the microstructure and thermochemistry of the Mg2(Si0.3Sn0.7)/Cu interconnections. The approach developed in this work is general and therefore applicable to the investigations of different thermoelectric materials and/or metallic electrodes, by enlarging the thermodynamic description, providing an effective guide to the experimental settings of the contacting process.
1 Introduction
Thermoelectric devices for power generation (thermoelectric generators, TEGs) convert heat into electricity through the Seebeck effect. Practical TEGs require a tailored design and engineering of the thermoelectric (TE) material, stable contacting with the metallic bridges (electrodes) and durable assembly technology for applicable modules.1,2 Magnesium silicide stannide solid solutions arise as prominent TE materials, owing to the high values of their thermoelectric figure of merit zT, elemental abundance, and non-toxicity. Recently the improved TE properties of p-type Mg2(Si1−xSnx) materials3–5 allow the use of the same base material for both p- and n-type TE legs,6–9 reducing the thermomechanical complexity of the modules and simplifying the selection of electrodes for practical devices. The operation of a TEG also relies upon long-term stable contacts with low thermal and electrical resistivity, similar thermal expansion coefficients of the bonding parts and good bonding of the conducting electrode to Mg2(Si1−xSnx) for intermediate operating temperatures (300–500 °C). A cross section of a conventional TEG is shown in Fig. 1, with two n-/p-leg pairs and Cu as the electrode working in a temperature gradient (hot/cold side). The zoom-in image shows the region of interest for the contacting process, ≈300 μm near the initial Mg2(Si0.3Sn0.7)/Cu interface. | ||
| Fig. 1 Scheme of the cross section of a TEG showing two n-/p-leg pairs in a temperature gradient (hot/cold side) and dashed line indicating electrical current. Zoom-in image of the region of interest for the contacting process close to the original Mg2(Si0.3Sn0.7)/Cu interface. | ||
Experimental investigations on Mg2(Si0.3Sn0.7)/Cu junctions10 showed low specific electrical contact resistances (<10 μΩ cm2), good bonding and no delamination. In the same work, Cu was indicated as a potential candidate electrode for n- and p-type TE legs though its influence on the functionality of the TE material is still under investigation. Accordingly, further insights are given in this work with special attention on phase transformations and diffusion–reaction phenomena occurring in the vicinity of the semiconductor/metal interface, namely the interconnection zone (IZ). We combine equilibrium calculations with chemical SEM/EDX analysis to understand the observed microstructure of Mg2(Si0.3Sn0.7)/Cu contacts and its further relationship with the bonding stability. The synthesis of TE legs and the leg/electrode contact entail several stages such as melting, mechanical milling and sintering, which are typically non-equilibrium processes; nevertheless, we show the effectiveness of equilibrium thermodynamics in providing understanding on phase stability and metastability throughout the technological processing of TEGs.
An overview of the application of thermodynamic calculations of phase diagrams to TE material design has been recently published;11 herein we broaden with this work the applications of thermodynamic modeling and calculations to the investigation of TE material/metal interconnections. We present the results for a Cu single element electrode as a case study, where the use of equilibrium thermodynamics provides ample information. Even when diffusion calculations are needed this approach can be used by coupling thermodynamic and diffusivity descriptions.12 Additionally, its extension to multicomponent electrodes is done by including each element in the thermodynamic description as described hereunder for this quaternary. This represents an advantage to handle electrodes with higher chemical complexity such as Mg2SiNi3 and stainless steel 304,13,14 and typically applied coatings like BN. The aim of this work is to establish an approach based on thermodynamics to investigate contacts, gain understanding and to show how this route can be improved. To this end, we take a Mg2(Si0.3Sn0.7)/Cu contacting couple and a two step contacting process as a case study to illustrate the potential of our thermodynamic calculation aided approach. In the case presented here, aid was provided a posteriori, and in further work this approach will be used simultaneously with the design.
For the investigation of the mentioned contacts, a quaternary thermodynamic description for the Cu–Mg–Si–Sn system is required. To the best of our knowledge, no such description is available in the literature; therefore, an open set of Gibbs energies was developed bringing together assessed binaries and ternaries from the literature and adapting the models for consistency in order to have a quaternary thermodynamic description. Of particular interest is the modelling of the quaternary extension of the C15 Laves phase and ternary τ1-Cu3Mg2Si, previously designated as γ-Cu51.7Mg33.3Sn15 and τ1-Cu3Mg2Si,10 respectively, as they were observed to grow in the IZ. Their model is included in the assembled thermodynamic database (stored in a file called TDB).
The structure of the paper is as follows: in Section 2, we present the literature review for the known ternaries and binaries and we describe the thermodynamic models of the relevant phases, while the complete set of Gibbs energies (TDB file) can be found in the ESI† and the thermodynamic formalism in Appendix A. The experimental details are given in Section 3. Subsequently, in the Results and discussion Section 4, we describe the buildup of the quaternary database, Section 4.1, and the application of the thermodynamic calculations, Section 4.2. Finally, we conclude in Section 5.
2 Thermodynamic modelling: literature review
The knowledge of the Gibbs energies for all the phases in a material system allows the calculation of thermodynamic properties of multiphase materials and equilibrium between phases. This procedure is used in the well-established Calphad method15 to obtain calculated phase diagrams and thermodynamic properties; within this framework, a set of Gibbs energies was assembled in this work using thermodynamic parameters available in the literature. Thermodynamic parameters are determined using large amounts of experimental data, made available within the past 100 years; therefore, it is of common practice to select suitable binary descriptions, which reproduce the more complete set of experimental data available at the time, to build up higher order system descriptions. This hierarchy is of utmost importance allowing extrapolations to multicomponent systems based on well evaluated binary and ternary subsystems.16 In a quaternary system such as Cu–Mg–Si–Sn, there are ten subsystems that need a thermodynamic description to get the quaternary information: four ternaries: Mg–Si–Sn, Cu–Mg–Si, Cu–Mg–Sn and Cu–Si–Sn; six binaries: Mg–Si, Mg–Sn, Si–Sn, Cu–Mg, Cu–Si and Cu–Sn. These constitutive systems are described hereunder calculating, for all the cases, isothermal sections at 600 °C due to the experimental contacting temperature.2.1 The Mg–Si–Sn system
The ternary Mg–Si–Sn follows the thermodynamic description proposed by Kozlov et al.,17 while the binaries were accepted from the respective references: Mg–Si,18 Mg–Sn19 and Si–Sn,20 and the calculated diagrams using the assembled TDB are shown in Fig. 2a. The compounds Mg2Sn and Mg2Si are known as semiconducting phases having the same stoichiometry and crystal structure, cubic antifluorite with Mg occupying 8a and Si/Sn in 4a Wyckoff positions (WPs), and space group Fm![[3 with combining macron]](https://www.rsc.org/images/entities/char_0033_0304.gif) m type C1. They were labelled in this work using the Strukturbericht designation C1_Mg2Sn and C1_Mg2Si. Due to their crystallography, they can form a solid solution in the 66.7 at% Mg isopleth of ternary Mg–Si–Sn; however, a wide miscibility gap in the solid phase with controversial solubility limits has been reported in phase equilibria determinations,17,21–23 and in phase investigations for thermoelectric applications.24,25
m type C1. They were labelled in this work using the Strukturbericht designation C1_Mg2Sn and C1_Mg2Si. Due to their crystallography, they can form a solid solution in the 66.7 at% Mg isopleth of ternary Mg–Si–Sn; however, a wide miscibility gap in the solid phase with controversial solubility limits has been reported in phase equilibria determinations,17,21–23 and in phase investigations for thermoelectric applications.24,25
 | ||
| Fig. 2 Calculated equilibrium diagrams for the Mg–Si–Sn system using Thermo-Calc software 2021a27 and the assembled thermodynamic database for this work with ternary parameters adapted from Kozlov et al.17 (a) Binary phase diagrams, Mg–Sn,26 Sn–Si20 and Si–Mg.18 (b) Isothermal section at 600 °C of ternary Mg–Si–Sn and composition of the TE material, Mg2Si0.3Sn0.7, before contacting indicated with the blue square symbol. | ||
This particular isopleth represents the section Mg2Sn–Mg2Si with two stable phases: the liquid and the solid Mg2Si1−xSnx labelled C1_Mg2X, where X = Si, Sn are known to share the same Wyckoff sites. The miscibility gap reported in the solid phase represents the mixture of two conjugated phases or compositions of maximal solubility, and it can be observed in the isothermal section at 600 °C in Fig. 2b, and a solid red line represents the equilibrium between the conjugated phases C1_Mg2X′ (maximum solubility of Si in Mg2Sn) and C1_Mg2X′′ (maximum solubility of Sn in Mg2Si). Within the miscibility gap, conjugated solutions can be simultaneously stable and are defined as composition sets in the thermodynamic calculations, i.e. C1_Mg2X′ is composition set 1 (C1#1) and C1_Mg2X′′ is composition set 2 (C1#2). Then, C1#1 and C1#2 define the equilibrium compositions at each temperature and ultimately, the binodal curve of the miscibility gap. The critical temperature of the miscibility gap was calculated using the present thermodynamic description, Tc = 1007.4 °C.
The solid phase was modelled with 2 sublattices (SLs) as proposed by Kozlov et al.:17 (Mg)0.5(Si,Sn)0.25 allowing Si and Sn in the same SL, with a computational convenient SL multiplicity (0.5/0.25), yet related to the Wyckoff sites, and two Gibbs energy excess terms to reproduce the miscibility gap.
The isopleth at 66.7 at% Mg is, in fact, a quasibinary section due to the congruent melting of both binary compounds C1_Mg2Sn and C1_Mg2Si; therefore, it can be read as a binary system with the tie-lines (equilibrium compositions), in theory, in the same plane of the section. However, two remarks are worth mentioning: first, the terminal members of the solid solution are then compounds, Mg2Si and Mg2Sn, and not elements; second, the practical fact of processing samples at a fixed Mg composition is rare to achieve in real applications and therefore knowledge on neighbouring competing phases is essential. In the manufacturing of TE materials, the relatively high Mg vapour pressure under processing conditions (leading to Mg loss and affecting the TE properties) is in practice often compensated for by Mg excess during mechanical alloying and during annealing.28,29 With these practical considerations, the TE material is synthesized, and the blue square in the isothermal representation at 600 °C shown in Fig. 2b indicates the composition of the pellet of the TE material before contacting, Mg2Si0.3Sn0.7, within the miscibility gap at a stoichiometry of 66.67 at% Mg.
2.2 The Cu–Mg–Si, Cu–Mg–Sn and Cu–Si–Sn systems
To build up the three ternary systems containing Cu, the following binaries were accepted from the literature: Cu–Mg,30 Cu–Sn,31 and Cu–Si32 and the calculated diagrams can be seen in Fig. 3a and 4a. Special interest is on the Cu2Mg phase due to the experimental evidence of dissolving Si and Sn, up to ≈12 at% Si and ≈15 at% Sn at ≈500 °C, which in turn would represent a quaternary extension in the Cu–Mg–Si–Sn system.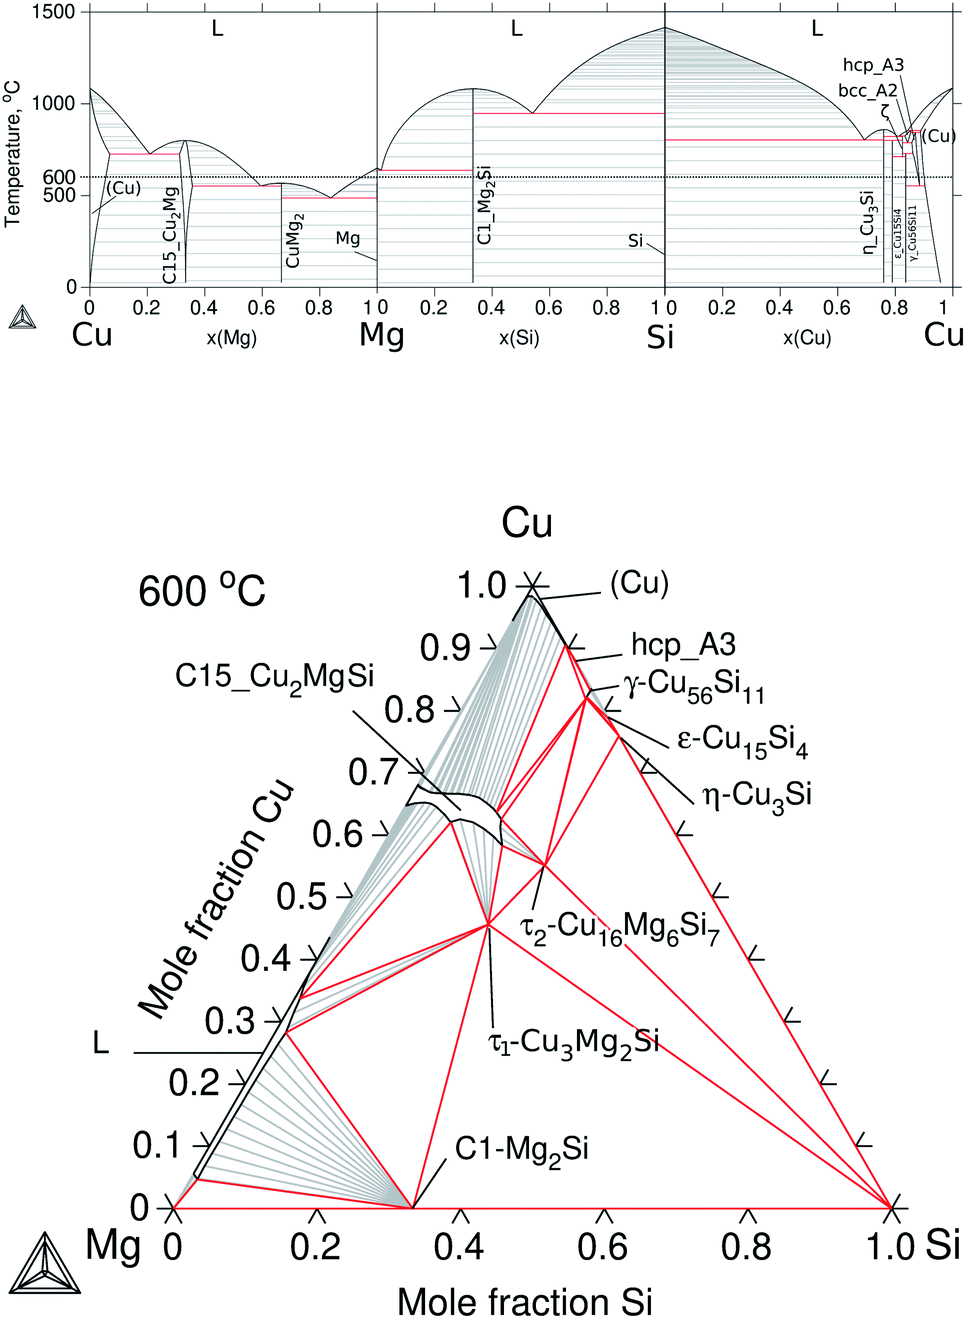 | ||
| Fig. 3 Calculated equilibrium diagrams for the Cu–Mg–Si system using Thermo-Calc software 2021a27 and the assembled thermodynamic database for this work. (a) Binary phase diagrams, Cu–Mg,30 Mg–Si18 and Si–Cu.32 (b) Isothermal section at 600 °C of ternary Cu–Mg–Si with parameters from Zhao et al.33 | ||
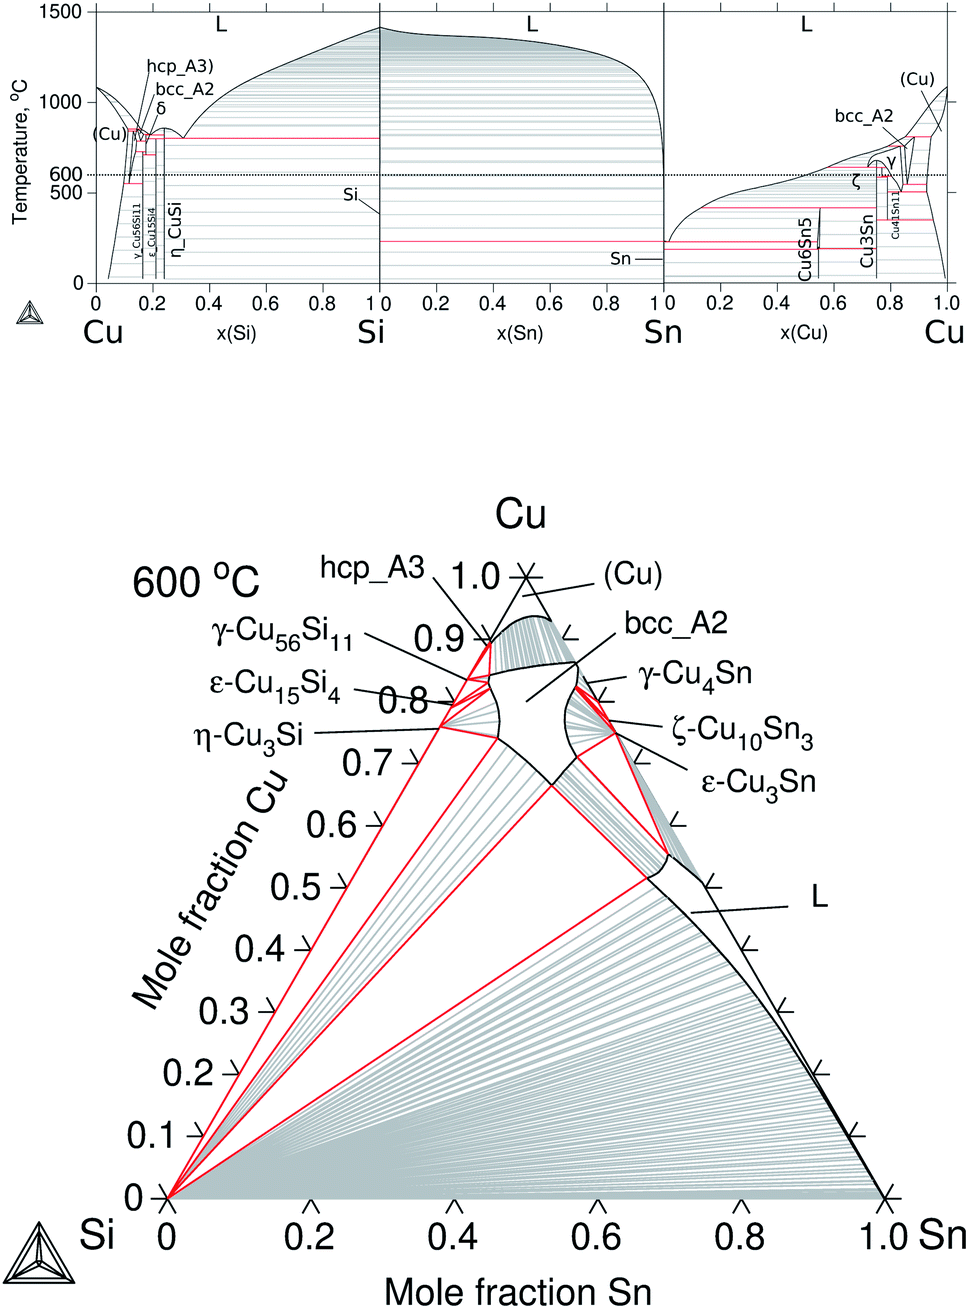 | ||
| Fig. 4 Calculated equilibrium diagrams for the Cu–Si–Sn system using Thermo-Calc software 2021a27 and the assembled thermodynamic database for this work. (a) Binary phase diagrams, Cu–Si,32 Si–Sn20 and Sn–Cu.31 (b) Isothermal section at 600 °C of ternary Cu–Si–Sn. | ||
The Cu2Mg intermediate compound is the prototype for Laves phases of type C15 with a cubic crystal structure and space group Fdm. This phase was labelled in this work as: C15_Cu2Mg for the binary, C15_Cu2MgSi and C15_Cu2MgSn for the ternary extensions, and C15 for the quaternary extension.
The thermodynamic description for the Cu–Mg–Si system was taken from Zhao et al.33 and the calculated isotherm at 600 °C is presented in Fig. 3b. This section shows mainly two ternary phases, τ1-Cu3Mg2Si and τ2-Cu16Mg6Si7 as well as the ternary extension C15_Cu2MgSi and the liquid phase on the Mg-rich side. There is reported evidence in the literature34 of a ternary phase, τ3-(Cu0.8Si0.2)2(Mg0.88Cu0.12), an order derivative of C15_Cu2MgSi existing at 500 °C but its temperature of stability and phase relations were not reported so far; and a high temperature polymorph of the mentioned τ1-Cu3Mg2Si, hexagonal hP24 Laves-type C36 that exists above 870 °C. Following the thermodynamic models of Zhao et al.33, the former was treated together with C15_Cu2MgSi and the latter was treated as one phase with τ1-Cu3Mg2Si.
The modelling of ternary Cu–Si–Sn was done by extrapolation from the respective binaries since no ternary phase is known to form in this system. The calculated phase diagrams for the binaries and the isothermal section at 600 °C are presented in Fig. 4.
The equilibrium in the isothermal section is dominated by the ternary extension of the bcc_A2 phase on the Cu-rich side and the liquid phase on the Sn-rich side. Finally, the description for the Cu–Mg–Sn system is presented in Section 4.1.
A summary of the thermodynamic models used for relevant phases for the interpretation of the present results is given in Table 1, while the complete thermodynamic description and database file (TDB) can be found in the ESI.†
| Phase | Pearson symbol, space group, prototype | Wyckoff positions | Thermodynamic SL model |
|---|---|---|---|
| Cu–Mg–Si–Sn | |||
| Liquid | — | — | (Cu, Mg, Mg2Sn, Sn, Si)1 |
| C15 | cF24 | (Cu, Mg, Sn, Si)2 (Cu, Mg, Sn, Si)1 | |
|
Fdm |
|||
| Cu2Mg | |||
| C15_Cu2MgSi | 16d Cu | ICSD-53305 | |
| 16d Si | |||
| 8a Mg | |||
| C15_Cu2MgSn | Sn replaces Cu atoms | Experimental35,36 | |
| (Cu) fcc_A1 | cF4 | 4a Cu | (Cu, Mg, Si, Sn)1 |
|
Fmm |
|||
| Cu | |||
| (Mg) hcp_A3 | hP2 | 2c Mg | (Cu, Mg, Si, Sn)1 |
| P63/mmc | |||
| Mg | |||
![[thin space (1/6-em)]](https://www.rsc.org/images/entities/char_2009.gif) |
|||
| Mg–Si–Sn | |||
| C1–Mg2X | cF12 | 8c Mg | (Mg)0.5(Si,Sn)0.25 |
| (X = Si, Sn) |
Fmm |
4a Si | |
| CaF2 | 4a Sn | ||
|
|||
| Cu–Mg–Si | |||
| τ1-Cu3Mg2Si | hP12 | 6h Cu | (Cu)2.74(Mg)2(Si)1.26 |
| P63/mmc | 4f Mg | ||
| Ord. MgZn2 | 2a Si | ||
| τ2-Cu16Mg6Si7 | cF116 | 32f Cu | (Cu)16(Mg)6(Si)7 |
|
Fmm |
32f Cu | ||
| Mn23Th6 | 24e Mg | ||
| 24d Si | |||
| 4a Si | |||
|
|||
| Cu–Mg–Sn | |||
| τ1, CuMgSn | cF12 | 4a Cu | (Cu)0.334(Mg)0.333(Sn)0.333 |
F![[4 with combining macron]](https://www.rsc.org/images/entities/char_0034_0304.gif) 3m 3m |
4b Mg | ||
| AgMgAs | 4c Sn | ||
| τ2, Cu4MgSn | cF24 | 16e Cu | (Cu)0.666(Mg)0.167(Sn)0.167 |
|
Fdm |
4c Mg | ||
| Cu2Mg-derivative | 4a Sn | ||
3 Experimental
The subsequent thermodynamic and kinetic analysis of the contacts can't be understood without the experimental details; therefore we summarise in this section relevant synthesis parameters associated with the present calculations, while a detailed description can be found in the work of Ayachi et al.10The contacts between the TE material and Cu were fabricated in two steps: the synthesis of TE pellets and the contacting with Cu. First, the TE pellets were synthesized from mechanically alloyed powders with the starting compositions of Mg2.06Si0.3Sn0.665Bi0.035 for n-type and Mg1.97Li0.03Si0.3Sn0.7 for p-type. The dopant elements, Bi and Li, were not included in the present thermodynamic models as explained in Section 4.2.4. The alloyed powders were consolidated in a direct-current sinter press at 700 °C for 20 min and 10 min for n- and p-type, respectively, under vacuum with a pressure of 66 MPa, and a 1 K s−1 heating rate using a graphite die.
Second, the pellets were contacted in the same facility with Cu foil of ≈50 μm thickness in direct contact with the graphite pistons on the top and bottom allowing the electrical current to flow through the electrodes and the sample. The joining was done at 600 °C for 10 min. The contacting temperature was chosen to be approximately the half of the melting temperature of the electrode (TmCu = 1085 °C). The TE properties of the pellets and contacts can be found in the literature, ref. 8.
The cross sections of the contacted samples were metallographically prepared for microstructure inspection and chemical analysis using a Scanning Electron Microscope (SEM), Zeiss Ultra 55 equipped with an energy-dispersive X-ray spectroscopy (EDX) detector with a 15 kV acceleration voltage and a resulting spatial resolution of ≈2 μm.
The annealing of the contacts was done for 1 week at 450 °C in sealed quartz ampules under an argon atmosphere, and the samples were coated with a thick BN layer to minimize Mg evaporation during the thermal treatment.
4 Results and discussion
4.1 Buildup of the Gibbs energy database
The constitutive subsystems of quaternary Cu–Mg–Si–Sn are presented in Section 2.2; however, one of the most significant systems is the Cu–Mg–Sn ternary, which will be introduced here in detail, as well as, the quaternary isotherm at 600 °C.The set of Gibbs energies for Cu–Mg–Sn was built using parameters from Miettinen et al.37 to model the excess energy of the liquid and the ternary phases, τ1-CuMgSn and τ2-Cu4MgSn, whereas for the ternary extension C15_Cu2MgSn, the solubility of Sn was adjusted in this work to reproduce the results of Vicente et al.35 at 525 °C. The calculated binaries and isothermal section at 600 °C are presented in Fig. 5. It can be seen that Cu dissolves up to ≈8 at% Mg and Sn in the (Cu) solid solution but the solubility of Cu in Mg and Sn is negligible. A small solubility of Cu in Mg2Sn (0.6–1.4 at% Cu) and of Sn in CuMg2 (2.2 at% Sn) have been reported35 but not considered in the present modelling. The calculated isothermal section indicates that C15_Cu2MgSn is in equilibrium with the ternary τ2-Cu4MgSn, the binary C1_Mg2Sn, the (Cu) terminal solid solution and the liquid phase on the Sn-rich and Mg-rich sides.
 | ||
| Fig. 5 Calculated equilibrium diagrams for the Cu–Mg–Sn system using Thermo-Calc software 2021a27 and the assembled thermodynamic database for this work. (a) Binary phase diagrams, Cu–Mg,30 Mg–Sn26 and Sn–Cu.31 (b) Isothermal section at 600 °C of ternary Cu–Mg–Sn. | ||
The quaternary extension of the C15 phase was modelled with 2SL as: (Cu, Mg, Si, Sn)2(Cu, Mg, Si, Sn) allowing the four elements in all SLs. Parameters for this phase were estimated in this work based on the assessment of Zhao et al.33. In contrast to the ternaries, the representation of a quaternary phase diagram is more challenging; however, a useful plot is a hatched tetrahedron for a given temperature as shown in Fig. 6 for 600 °C. The isothermal regular tetrahedron has four triangular faces made of isothermal sections of the constitutive ternary systems as indicated in the sketch at the low right corner of the same figure.
 | ||
| Fig. 6 Hatched isothermal tetrahedron at 600 °C for the Cu–Mg–Si–Sn system formed by calculated isotherms of the constitutive ternary systems as shown in the sketch on the right. | ||
4.2 Thermodynamic calculations with the constructed database
 | ||
| Fig. 7 Schematic representation of the two materials before contacting. | ||
They represent additional contributions to the Gibbs energy of the phase and can significantly increase the solubility or, in other words, suppress the miscibility gap. Further investigation on this feature is ongoing, although the first insights into the miscibility gap in the Mg2Si–Mg2Sn system based on ab intio studies combined with microstructure simulations38 and experimental studies25 can be found in the literature. Nonetheless, we show that the current thermodynamic description can effectively indicate the constitution of the resulting intermediate layers and can help to elucidate the microstructure evolution in the IZ.
The Mg2(Si0.3Sn0.7)/Cu contacts are semiconductor/metal junctions, in particular, ohmic contacts showing a linear current–voltage behaviour. Therefore, one important parameter is the electrical contact resistance characterized in previous work,10 while here we deal with the phase identification of the interlayers that evolve in the IZ. The selection of Cu as the electrode material was done based on the low specific contact resistance (<10 μΩ cm2), similar coefficients of thermal expansion (CTE) for the TE legs (Mg2(Si0.3Sn0.7) = 17.5 × 10⁻⁶ K−1 (ref. 39)) and the electrode (Cu = 17.0 × 10⁻⁶ K−1 (ref. 40)), and good bonding to the TE material.10 More precisely, the concept of bonding, elsewhere called adhesion, refers to the diffusion-reaction phenomena responsible for the phase transformations leading to a layered growth of intermediate phases (interlayers) in the IZ. The identification of the grown interlayers is crucial for further correlations with the specific contact resistance of the junctions, the TE properties of the legs, and the long-term functional stability of the connections.
The sequence of possible stable phases to be formed in the IZ can be calculated in the quaternary equilibrium diagram. A particularly useful section is Cu–Mg2Sn–Mg2Si at 600 °C as presented in Fig. 8a, and this diagram represents a plane within the isothermal composition tetrahedron as shown schematically on the right side of the figure. The light-gray dotted line in the phase diagram indicates the contacted couple Mg2(Si0.3Sn0.7)/Cu and the mass balance is fulfilled along this line, but it should not be confused with the diffusion path (or the reaction path). This section clearly shows the C15 single-phase field extending between the ternaries C15_Cu2MgSn and C15_Cu2MgSi establishing the quaternary extension of the C15 phase (highlighted in beige).
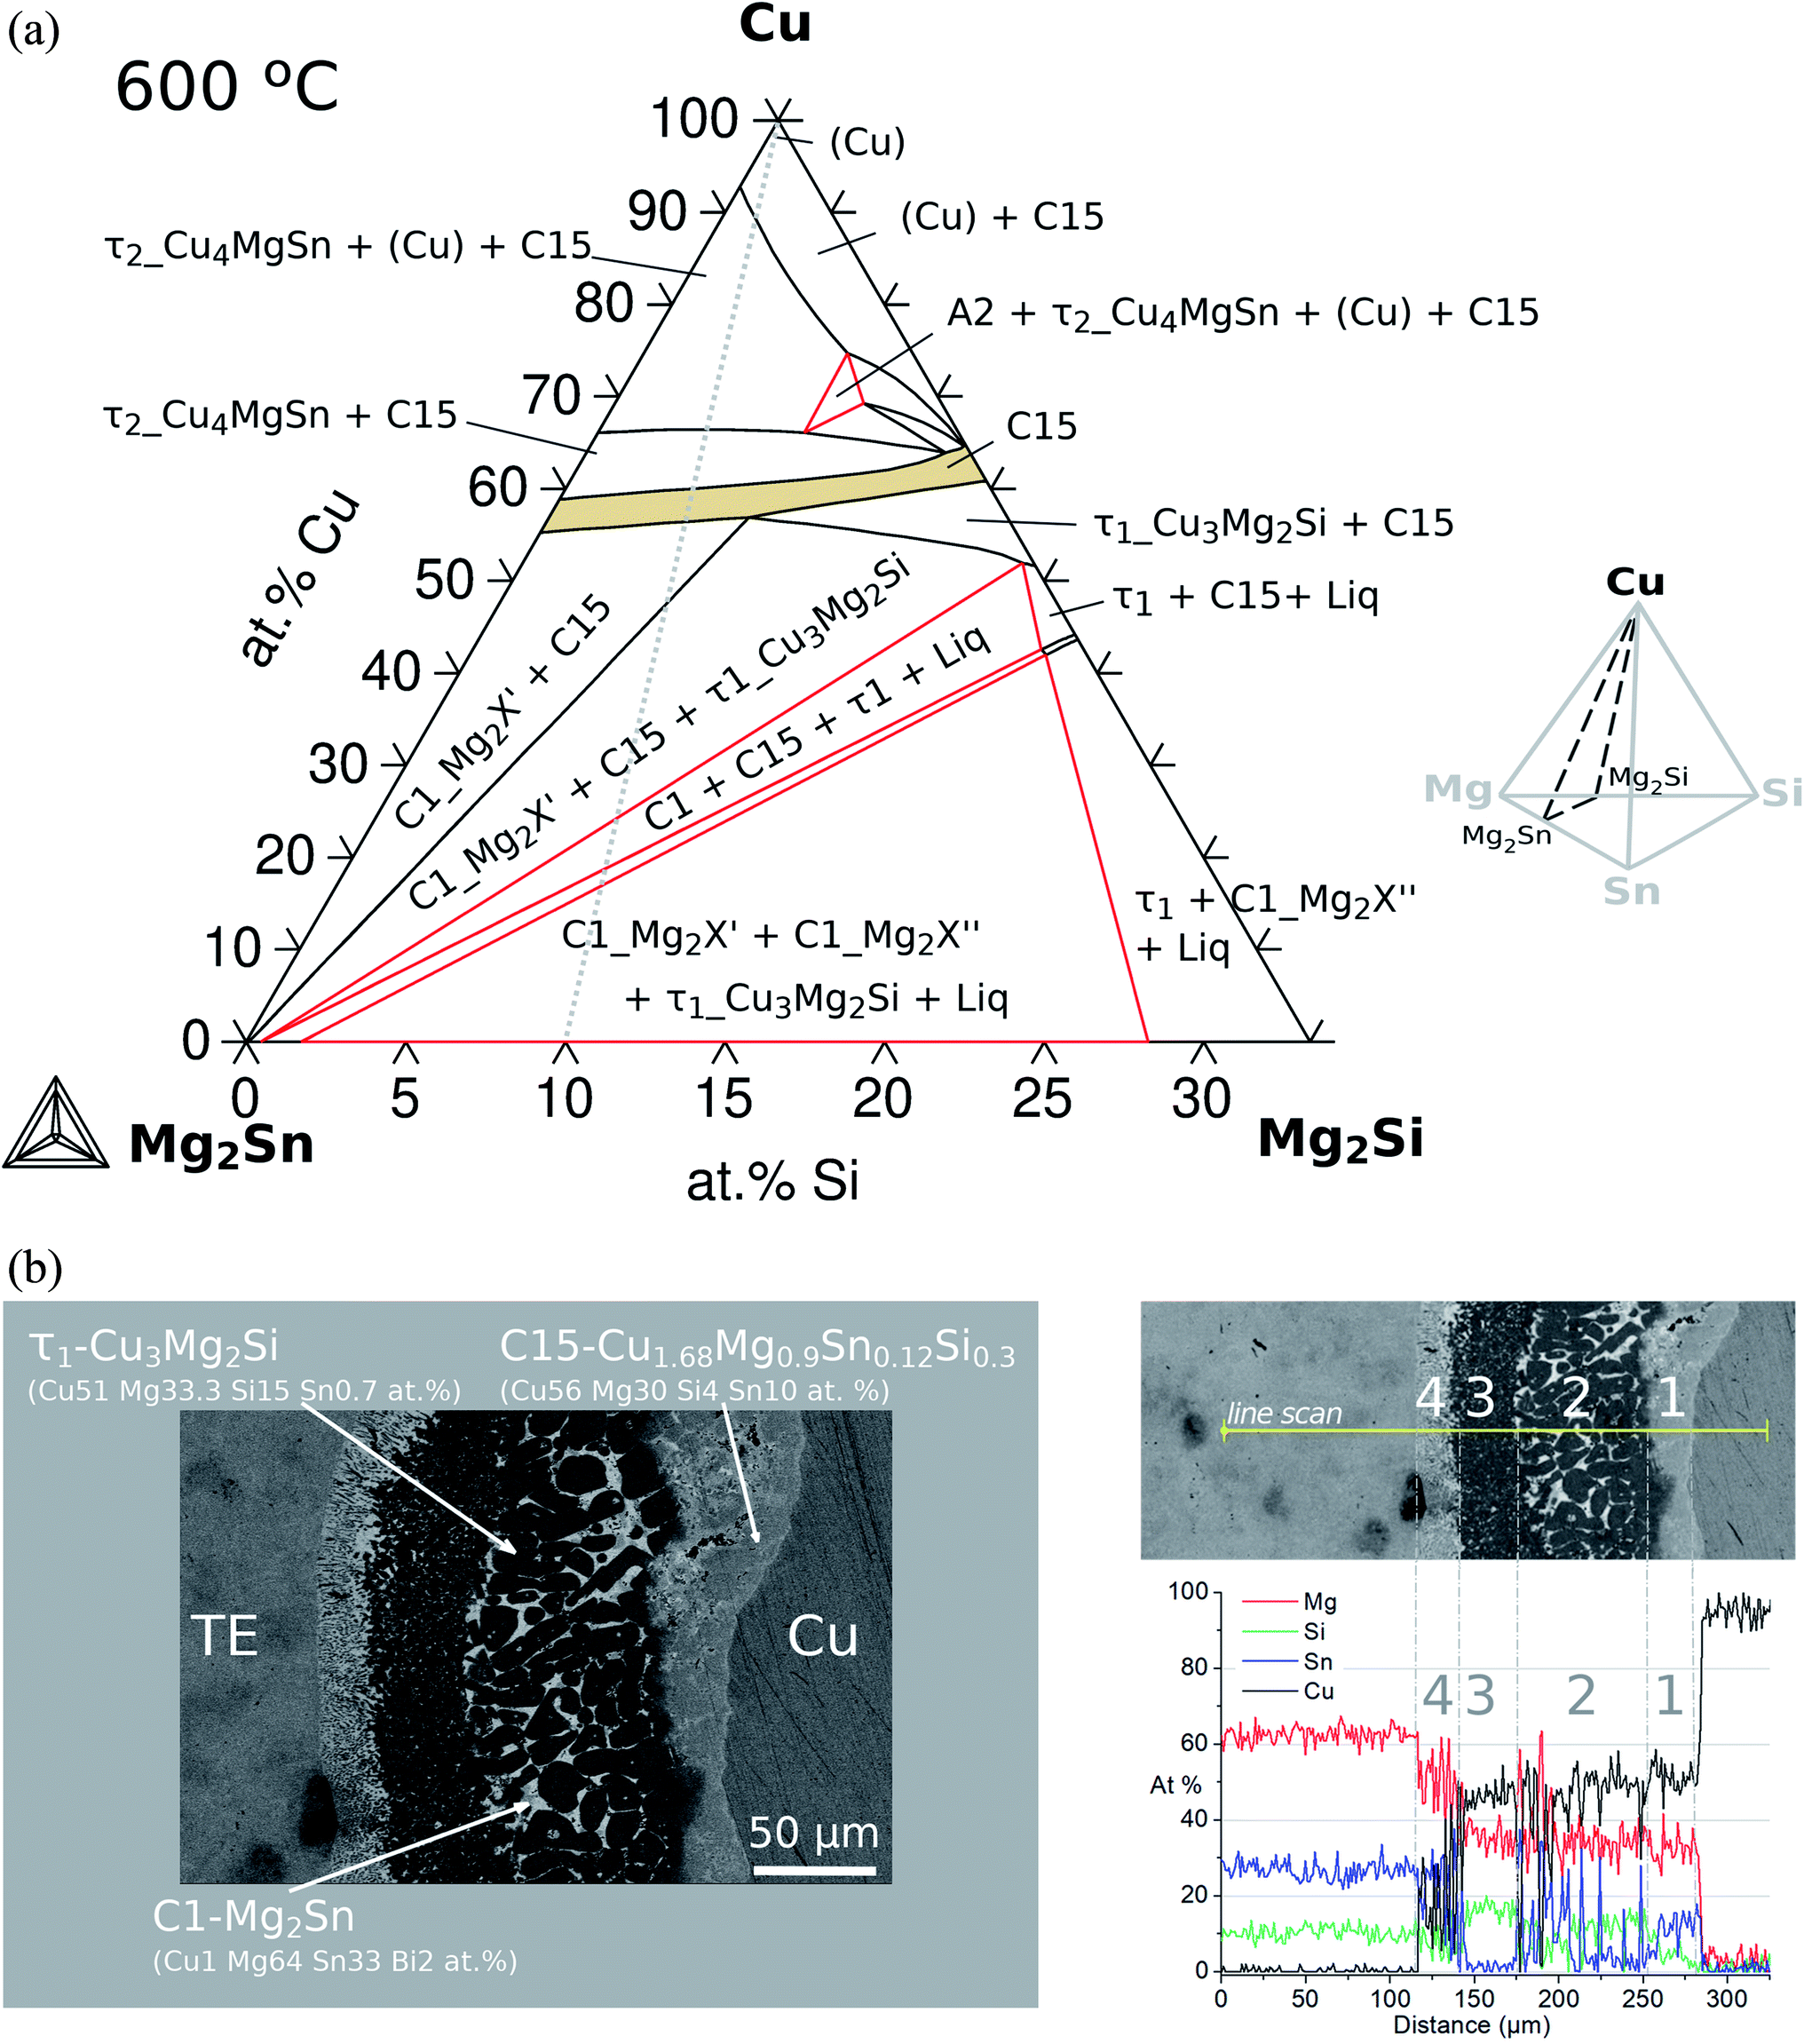 | ||
| Fig. 8 Calculated section of the quaternary phase diagram and experimental results. (a) Calculated Mg2Si–Mg2Si–Cu section of the isothermal tetrahedron at 600 °C using the present thermodynamic database; and scheme of the section within the composition tetrahedron. (b) SEM-BSE micrograph of a typical microstructure of the IZ in Mg2Si0.3Sn0.7/Cu junctions contacted at 600 °C and EDX line scan results across the IZ. | ||
The contacted samples can be modeled as diffusion–reaction couples, where at elevated temperatures, atomic diffusion towards and reaction at interfaces take place, in general, one of them being the dominating mechanism. Transformations at the interface are heterogeneous solid-state reactions that occur via nucleation and growth of new phases and interfaces (phase boundary migration). An important assumption in diffusion couples is the local equilibrium at the interfaces, meaning that the chemical potential of the species has the same value on both sides of a given interface. This assumption allows the use of the equilibrium diagrams to correlate the order of the product layers, their morphology and their composition. However, in many cases supersaturated regions occur near the interfaces leading to off-equilibrium; in particular, if a liquid phase is present the assumptions for solid–solid diffusion/reaction should be carefully considered.41
In the initial situation (Fig. 7) only one interface exists between Mg2(Si0.3Sn0.7) and Cu, i.e. the original interface where the reaction starts. As mentioned before, Mg2(Si0.3Sn0.7) is a homogeneous pellet with no microscopic dephasing, 7 ± 3 μm grain size and a pellet density of ≥97% (after the powder consolidation at 700 °C).42·In the final situation, after 10 min of joining at 600 °C in a direct sinter press, a reacted IZ can be observed with several new interfaces. A typical microstructure of the IZ is presented in Fig. 8b, and the cross section of the junction was imaged and chemically analysed with SEM/EDX microscopy. Four layers can be noted between the TE material and Cu. The composition of the interlayers is related to the phase diagram in the same figure as follows. The composition of Cu varies across the IZ decreasing towards Mg2(Si0.3Sn0.7), and this can be visualized on the phase diagram by following the gray dotted line. However, it is not possible to confirm only from the inspection of the final microstructure which phase nucleates and grows first at the original interface; in that case growth-kinetic experiments are required which can be confirmed by diffusion calculations if the diffusivity databases are available.12 Nonetheless, it is possible to deduce from the phase diagram that the initial interface in the Mg2(Si0.3Sn0.7)/Cu couple is not in equilibrium since several intermediate phases exist between the couple ends, and are expected to grow in the IZ. We can conjecture a possible initial scenario, where Mg diffuses into the Cu electrode to form the (Cu) solid solution based on the higher solubility of Mg in fcc-Cu than Cu in Mg2Sn or Mg2Si. Afterwards, the saturation of (Cu) solid solution occurs and C15_Cu2Mg nucleates and grows. Thus, in Fig. 8a the diagram is read from the Cu-rich corner down to Mg2(Si0.3Sn0.7) following the gray dotted line crossing several 2- and 3-phase fields with decreasing Cu composition, but only one single-phase field of C15 around 60 to 56 at% Cu.
The EDX composition analysis in Fig. 8b and data in Table 1 from Ayachi et al.10 show the phases τ1-Cu3Mg2Si (Cu51 Mg33.3 Si15 Sn0.7, at%), C1_Mg2Sn (Cu1 Mg64 Sn33 Bi2, at%) and C15 (Cu56 Mg30 Si4 Sn10, at%). The latter was initially associated with the ternary extension C15_Cu2MgSn (Cu52 Mg33 Sn15 or γ-Cu1.55MgSn0.45 in ref. 10) due to the low Si content close to the EDX detection limit. However, the thermodynamic calculations confirm the composition of the quaternary extension, the C15 phase (see Fig. 9 2nd column, figure explanation hereunder), and show excellent agreement with the experimental observations. The reacted IZ seems to have evolved up to the 3-phase region, C1_Mg2X′ + C15 + τ1-Cu3Mg2Si, in the phase diagram but the round shape precipitate morphology and wavy interfaces resemble the liquid phase, being possible to have localized composition gradients with the reduced Cu content shifting the equilibrium to the 4-phase field, C1_Mg2X′ + C15 + τ1-Cu3Mg2Si + liquid, as indicated by the phase diagram. In particular, these regions could be located around the precipitates of τ1 and due to the high Mg content of the liquid phase (cf.Fig. 9 4th column) are hardly distinguishable in the dark areas on the SEM/BSE micrograph. In this and other assembles, the presence of liquid in the IZ is highly important and can be anticipated by thermodynamic calculations using an equilibrium description.
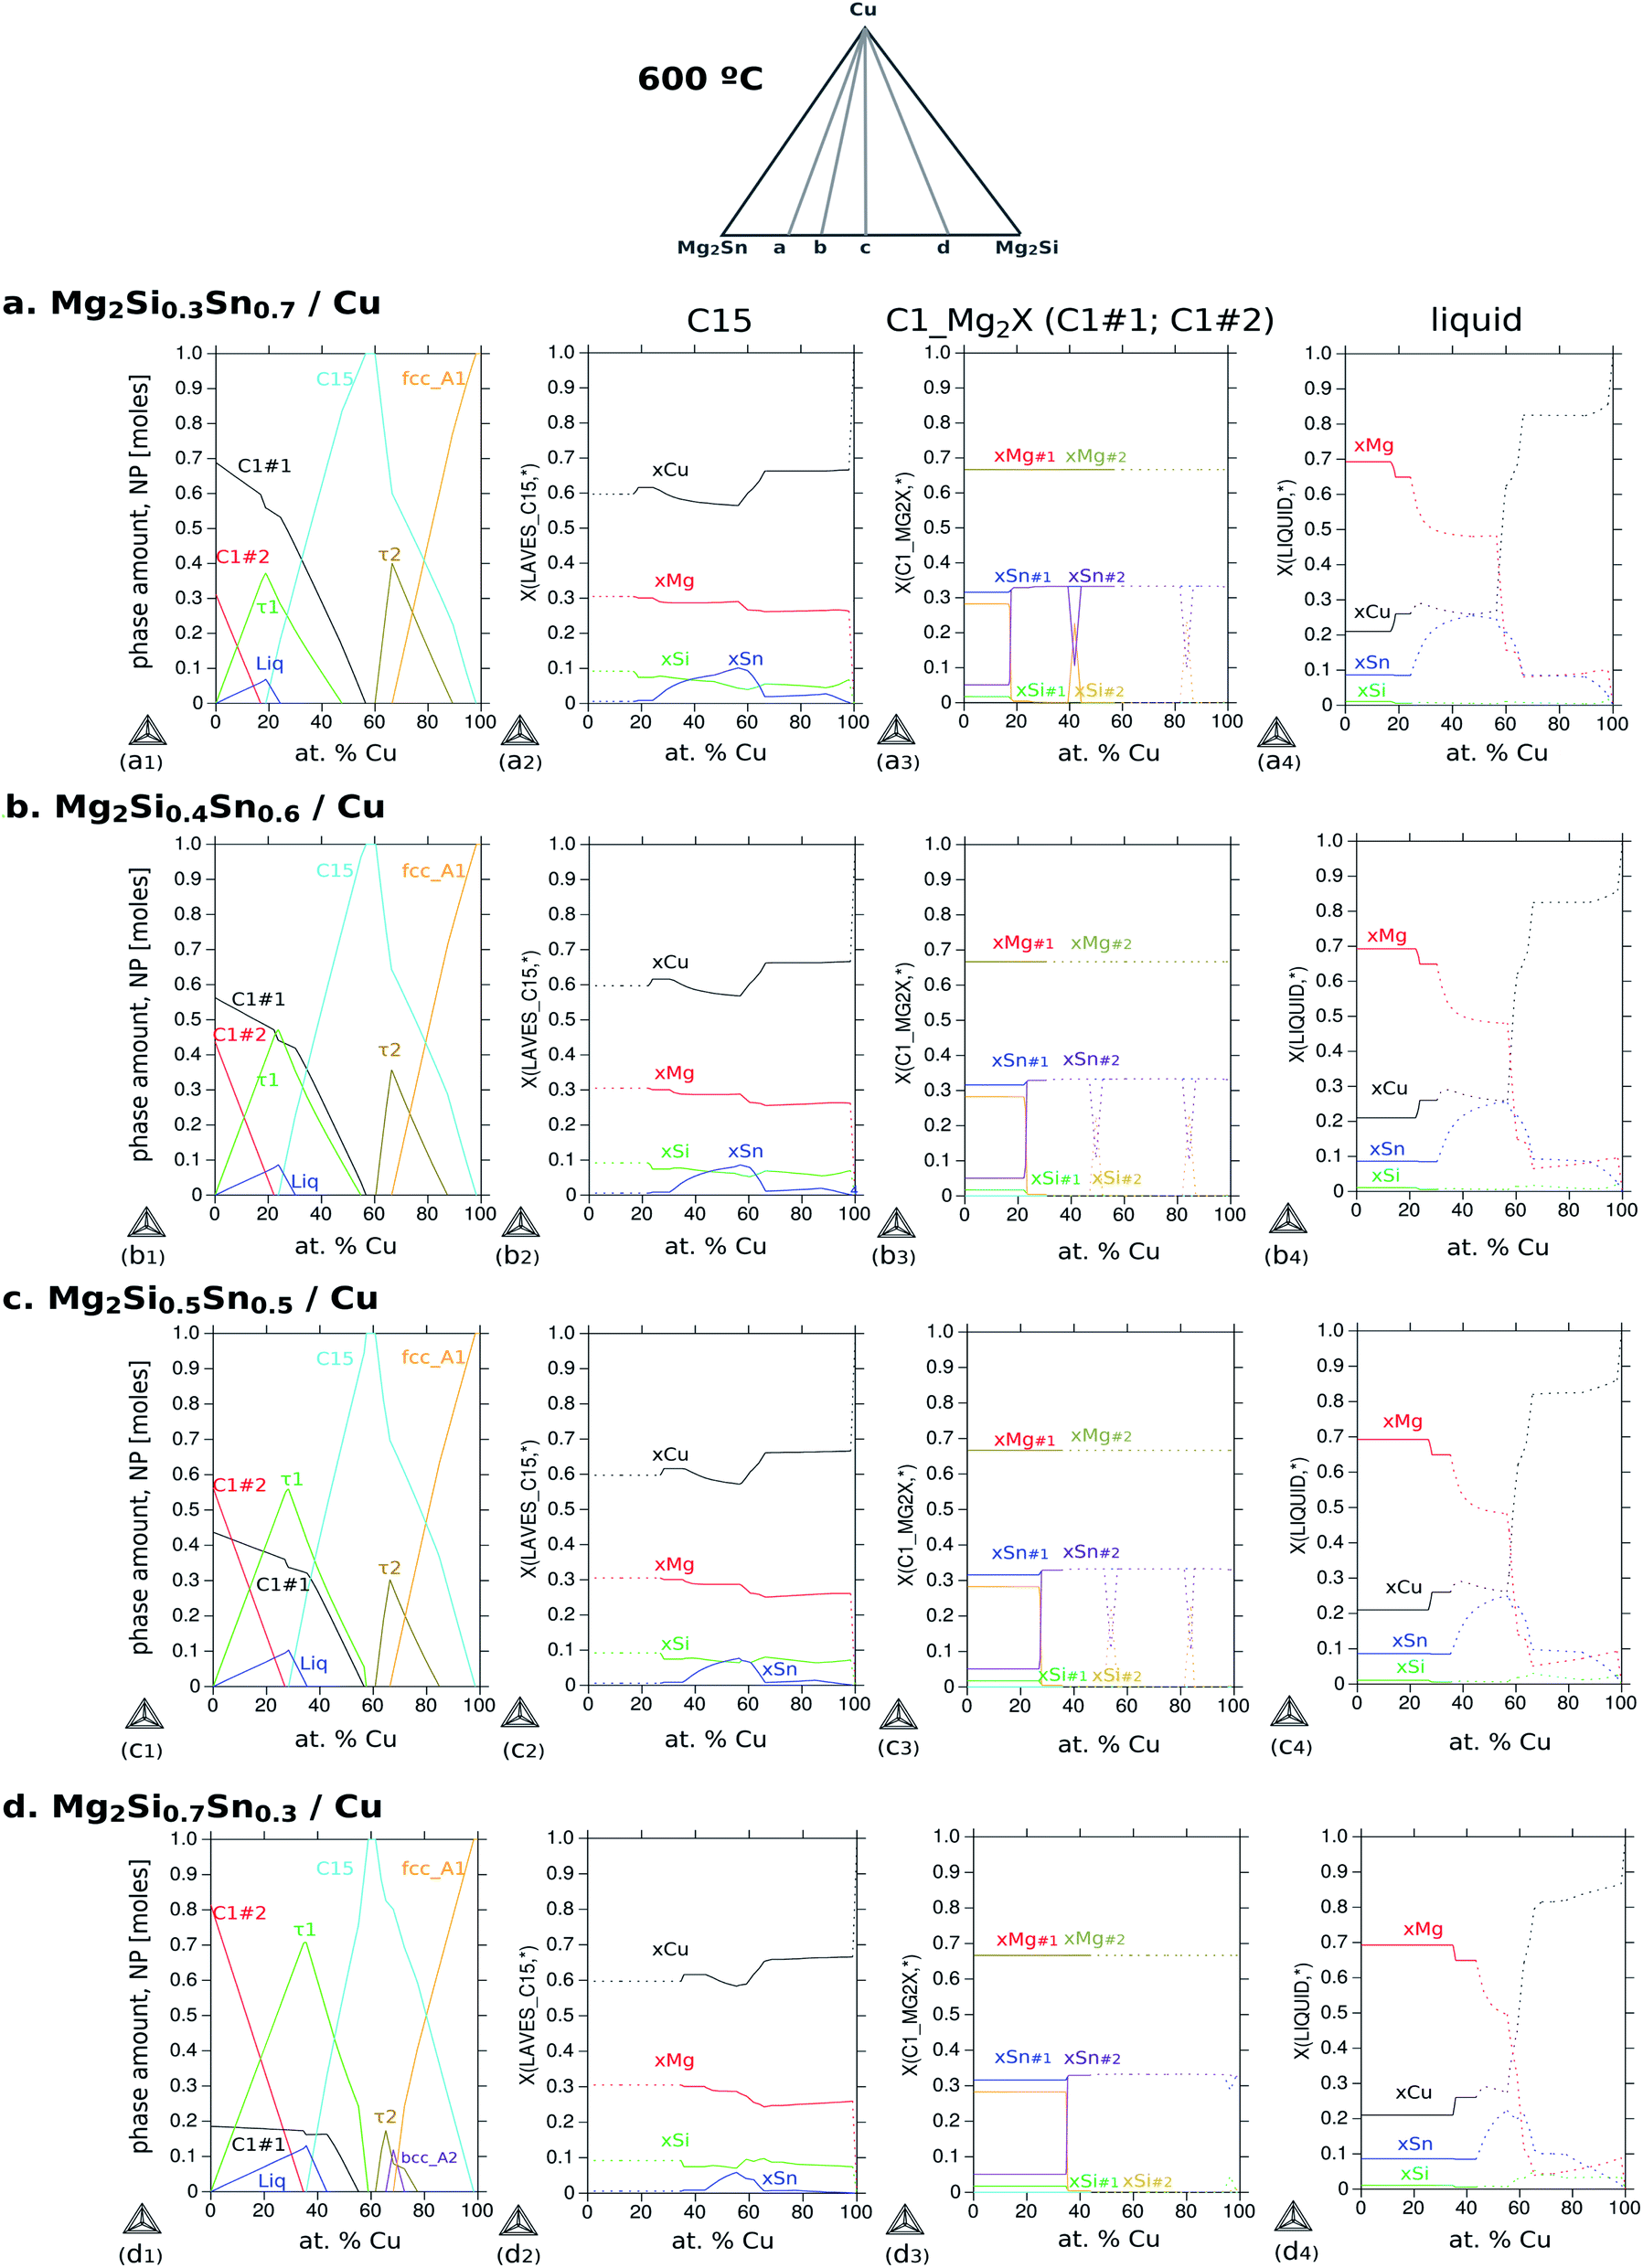 | ||
| Fig. 9 Calculated diagrams at 600 °C with varying Cu composition for different Si/Sn ratios in the TE material: (a) Si0.3Sn0.7, (b) Si0.4Sn0.6, (c) Si0.5Sn0.5, and (d) Si0.7Sn0.3, indicating the phase amount and elemental distribution in C15, C1_Mg2X (C1#1 Sn-rich, C1#2 Si-rich) and liquid. Dashed lines indicate metastability regions. | ||
It is important to highlight that the section Mg2Sn–Mg2Si–Cu does not show tie-lines since they are not necessarily on the same plane of the section; as a result, the amount of each phase in the respective fields cannot be obtained from this diagram. For phase quantification, another diagram is more suitable to indicate the amount of each phase as a function of Cu content (NP-xCu) as presented in Fig. 9. All diagrams were calculated for 600 °C varying the composition of Cu and setting the composition of the TE material, i.e. along the gray lines a–d schematically indicated at the top. The rows correspond to different compositions of the TE material within the solid solution, thus, with increasing Si to Sn composition ratio, Si/Sn = 0.3/0.7 (a), 0.4/0.6 (b), 0.5/0.5 (c) and 0.7/0.3 (d). The first column shows the diagrams of phase fraction versus composition of Cu, and the following columns show the distribution of the elements as a function of Cu composition in three phases of interest: C15 (2nd column), C1_Mg2X (3rd column) and liquid (4th column).
The diagram (a1) shows the fraction of each phase in equilibrium when the Cu content decreases from 100 to 0 at%, in correlation with the phase fields in Fig. 8a. With this diagram, we want to address three aspects of the final microstructure: (1) the composition of the quaternary extension C15; (2) the composition of the liquid in the 4-phase field; (3) the absence of τ2-Cu4MgSn in the final microstructure.
First, the composition of C15 in Fig. 9(a2) indicates slightly less Si than Sn between ≈40 and 60 at% Cu in agreement with our EDX analysis. It can also be seen, along the 2nd column, how Si and Sn contents in C15 vary with the Si/Sn ratio in the TE material. The second point is to address the composition of the liquid phase that might form surrounding the black round precipitates of τ1, in Fig. 9(a4). The liquid phase coexisting in the 4-phase field contains mainly Mg and Cu dissolving up to ≈8 at% Sn and ≤1 at% Si; therefore it would appear as a dark region in the BSE imaging (see also the Mg side in Fig. 6). Finally, the absence of τ2-Cu4MgSn in the final microstructure can be explained by observing Fig. 9(a1) and the amount of τ2 is always about 20% less than that of C15 for all Cu compositions; alternatively, it might be a phase with an incubation time larger than 10 min before it starts to grow, and it can have a slower growth rate than C15, and/or local variations in composition shift the equilibrium outside the plane Cu–Mg2Si–Mg2Sn, i.e. the diffusion path is not necessarily in this plane.
Coming back to Fig. 8a, we highlight the 2-phase equilibrium, C15 + C1_Mg2X′, at ≤55 at% Cu, where the C15 phase can exist in equilibrium with Mg2Sn possibly inducing phase separation in the TE material, Mg2(Si0.3Sn0.7) into its Sn-rich and Si-rich conjugates. Therefore, we investigate the phase fractions when varying the Si/Sn composition ratio in the TE material in Fig. 9. The selected compositions 40/60 and 50/50 are known to have good thermoelectric properties as well as 30/70, and 70/30 was chosen for completeness. When the Si content in the TE material increases, we can observe in the 1st column that C15 exists in a narrower Cu composition range towards Cu-rich, C15 shows less Cu content depletion (2nd column), increases the amount and range of existence of τ1-Cu3Mg2Si, there is an interplay between C1_Mg2X′ Sn-rich (C1#1) and C1_Mg2X′′ Si-rich (C1#2) —where C1_Mg2X′ forms at higher Cu compositions in the four cases but its fraction decreases while C1_Mg2X′′ fraction increases—, the fraction of τ2-Cu4MgSn decreases, bcc_A2 stabilizes in case d, the liquid fraction slightly increases and it is stable in a broader Cu composition range.
The types of diagrams presented in Fig. 9 are an extremely useful tool for direct comparison with chemical analyses for phase identification in complex microstructures. In addition, they are important for the interpretation of phase transformations and possible growth-kinetic mechanisms as shown for the case of Mg2(SixSn1−x)/Cu contacts.
These diagrams were also used here to show the significant amount of information that can be extracted from phase stability calculations.
The calculated vertical section from Mg2(Si0.3Sn0.7) to pure Cu as a function of temperature in Fig. 10 shows regions in the temperature-composition space, where the indicated phases are in equilibrium. The blue line indicates the zero phase fraction (ZPF) for the liquid and the blue area indicates all thermodynamic states where liquid exists. Similarly, the ZPF is indicated for the TE material, phase C1_Mg2X with the two composition sets C1#1 and C1#2, in red. From the intersection of the red and blue areas, the thermodynamic states for the coexistence of the two phases can be determined.
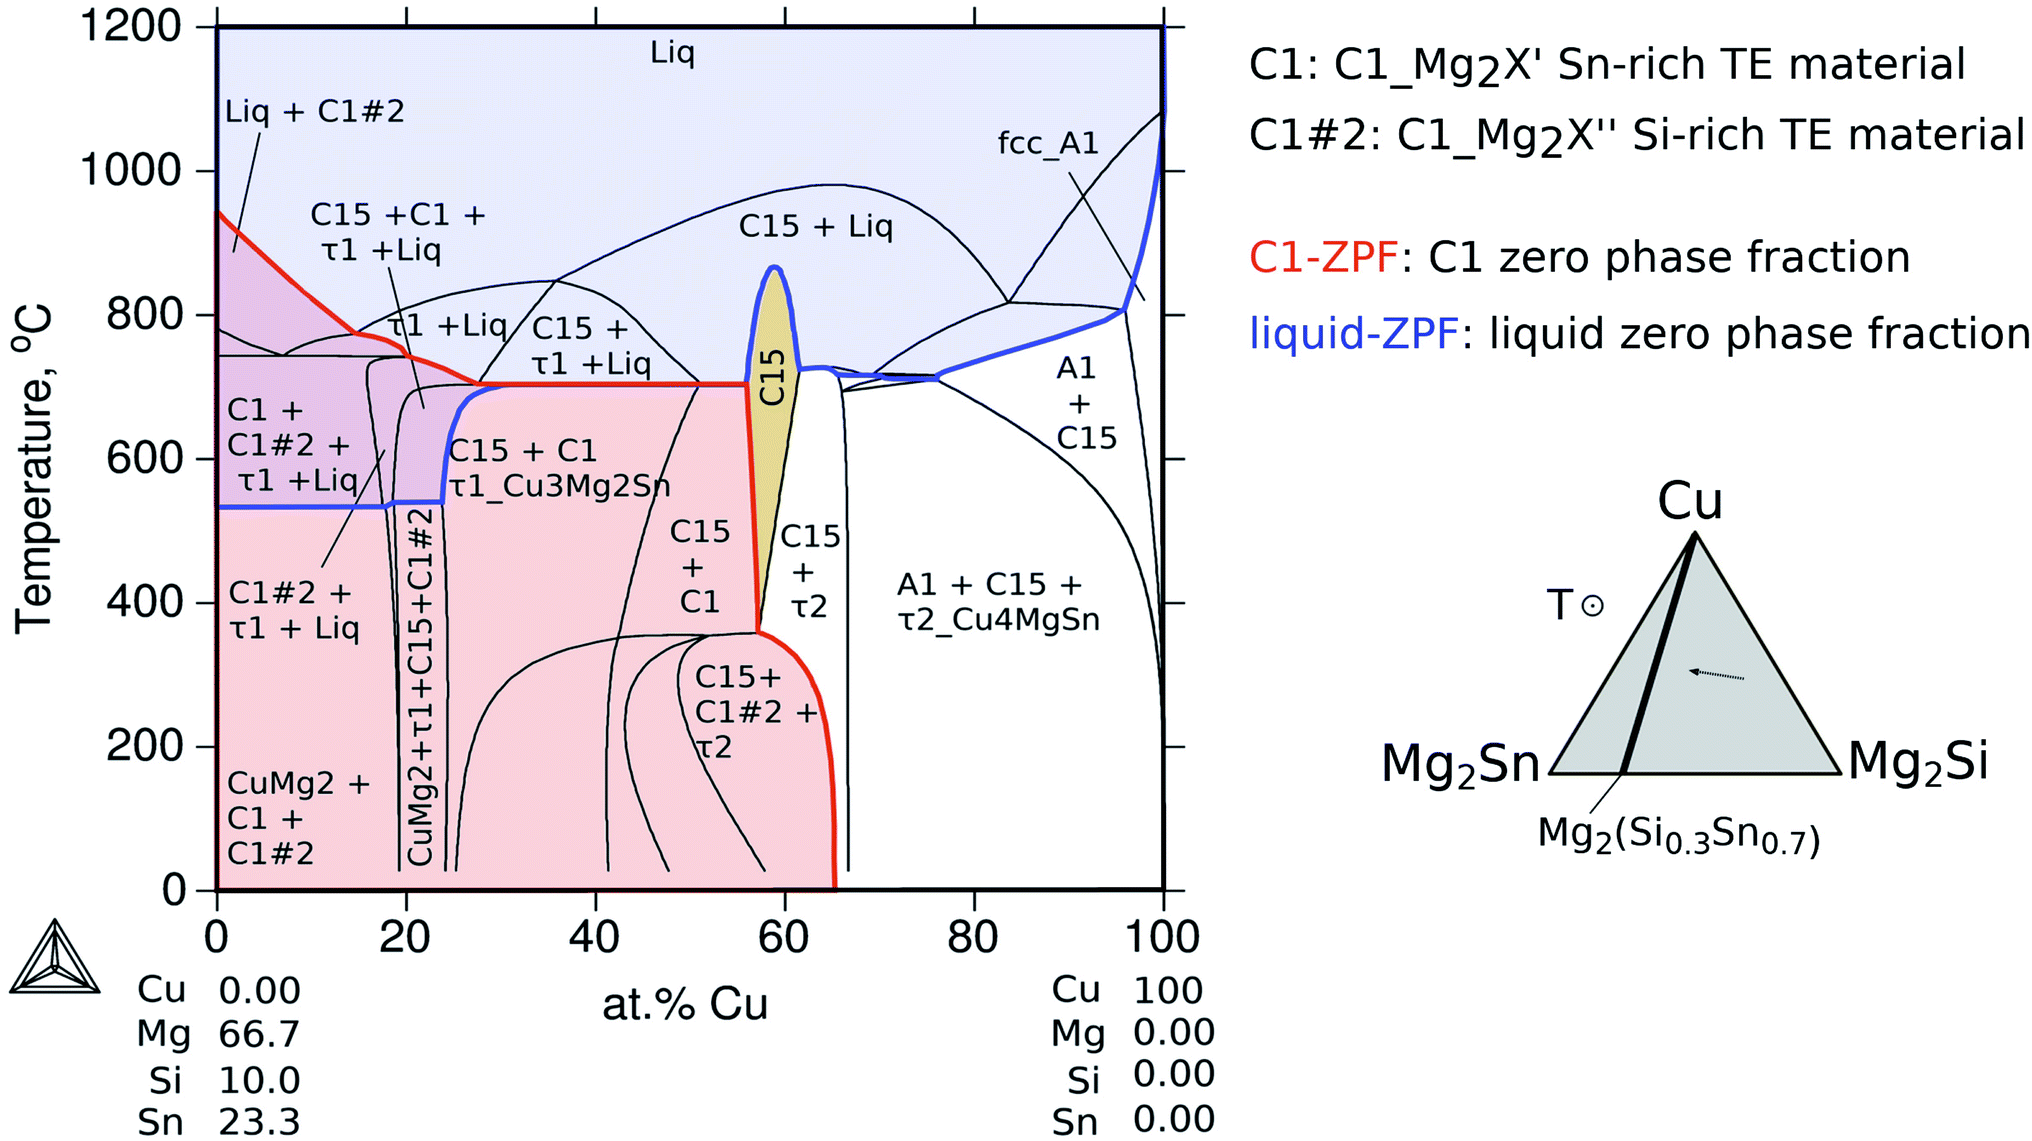 | ||
| Fig. 10 Calculated vertical section from Mg2(Si0.3Sn0.7) to pure Cu versus temperature to indicate the curves of the zero phase fraction for two phases of interest, the liquid (blue) and C1#1 and C1#2 (orange). | ||
This type of diagram is particularly useful to optimize synthesis and contacting conditions to obtain the right phase or phase sequence. The liquid ZPF line indicates the limit of the liquid appearance as a function of Cu composition. For the present investigation, it clearly shows that at the contacting temperature 600 °C the liquid phase was present resulting in successful interconnections, whereas, at temperatures below the liquid ZPF there is no liquid and therefore for the same contacting time the bonding is not expected to be so effective as the diffusion–reaction process must occur in the solid state. This is in agreement with the experimental results from Ayachi et al.,10 where it was observed that a successful joining/bonding was possible at 600 °C, but failed at 500 °C.
 | ||
| Fig. 11 Cu–Mg–Si, Mg–Si–Sn, and Cu–Mg–Sn isothermal sections at 600 °C with average measured composition in the interconnection zone (black circles) and in the thermoelectric material (blue square). | ||
On the Cu–Mg–Sn diagram the diffusion path can follow tie-lines in the 2-phase field, (Cu) + C15_Cu2MgSn, deviating from the analysed section (dotted black lines) and avoiding the formation of τ2-Cu4MgSn. The final state in the IZ indicates experimentally 3-phase equilibria: C1_Mg2X′ + τ1-Cu3Mg2Si + C15 in agreement with the phase diagram. The black dot in the Cu–Mg–Si ternary, Fig. 11, is near the limit of a 3-phase field with the Mg-rich liquid that might be present in the IZ and responsible for the roundish morphology of τ1-Cu3Mg2Si precipitates. It is worth noticing from the diagram that any local variation in Mg composition, both enriched or deficient, can deviate the diffusion path from the analysed plane (Mg2Sn–Mg2Si–Cu) leading to the formation of a Mg-rich liquid or Sn-rich liquid.
Finally, the growth sequence of the interlayers can be seen in a scheme in Fig. 12. A plausible initial situation at t0 is the formation of the solid solution (Cu) until saturation leading to the formation of C15_Cu2MgSn dissolving ∼4 at% of Si that is C15 quaternary extension at t1. Subsequently, C15 can equilibrate with C1_Mg2Sn at t2 and, eventually, τ1-Cu3Mg2Si nucleates at the interface Mg2(Si0.3Si0.7)/C1_Mg2Sn (t3). Probably, after or simultaneously the liquid phase can form (by Si-depletion in the TE material and/or Mg-depleted regions in the C1 layer) and shape the precipitates of τ1-Cu3Mg2Si.
 | ||
| Fig. 12 Scheme of a possible growing sequence of intermediate layers in Mg2(Si0.3Sn0.7)/Cu interconnections produced in a sinter press for 10 min at 600 °C. | ||
Nevertheless, the present thermodynamic description can be enlarged to account for dopant elements, charged carriers,43,44 coating elements and more complex point defect structures. In the present thermodynamic database, only substitutional defects are allowed, yet it represents a significant starting point for incremental improvements based on the proposed ground thermodynamic description. This description was already effective to understand the contacts in this study.
5 Conclusions
In this case study, a two step contacting route using Cu as a non-complex electrode was selected to show significant results derived only from equilibrium calculations. We provided an open access set of Gibbs energies for all the phases in the quaternary Cu–Mg–Si–Sn system, and with this tool we calculated several diagrams and applied them to the investigation of Mg2(Si0.3Sn0.7)/Cu contacts. The thermodynamic calculations contributed significantly:• To effectively anticipate the constitution (crystal structure of the phases and composition) of the intermediate layers formed in the interconnection zone of Mg2(Si0.3Sn0.7)/Cu junctions.
• By providing the phase amount and composition diagrams for in situ comparison with chemical analysis.
• In the interpretation of the microstructure and morphology in the reacted interconnection zone allowing the outlining of a possible growth sequence for the intermediate layers combined with minimum experimental work.
• In providing phase diagrams and thermochemical property diagrams to support knowledge on phase transformations and kinetics.
• In providing a roadmap for the identification of processing conditions to grow desired phases or microstructures. This allows the determination of suitable contacting parameters for the manufacture of efficient TE material/metal interconnections using the knowledge on the liquid zero phase fraction, thus making this fundamental approach extremely useful in practice.
The approach here used can be extended by enlarging the thermodynamic description to more complex electrodes and different types of coatings, while coupled to kinetics to describe further properties of the contacts and the TE material itself.
The assembled set of Gibbs energies meets the needs of a thermodynamic database for joining processes contributing with reliable thermodynamic descriptions in a broad range of composition and temperature, i.e. in the whole Cu composition space, and therefore the open set of Gibbs energies in this work is a crucial starting point for computational materials/processing design and certainly for further contributions. Hence, the first steps for accelerating the development of contact solutions for thermoelectric materials and improving the TEG fabrication process were presented in this work.
6 Appendix A: thermodynamic formalism
Several symbols will be used in this section, defined as follows:i, species. With i = Cu, Mg, Mg2Sn, Si, Sn.
x i, mole fraction of species i.
 and
and  , site fraction of species i in the first and second sublattices.
ν, set of integers in the Redlich–Kister power series.
1: Cu, 2: Mg, 3: Mg2Sn, 4: Si and 5: Sn, as coefficient's sub-indices.
Boldface means the major species in a given sublattice.
Stoichiometric compounds
|
G–HSER = a + bT + cTlnT + dT2 + eT−1 + fT3
| (1) |
6.1 C15: sublattice model
(Cu,Mg,Si,Sn)2(Cu, Mg,Si,Sn)1 | (2) |
where
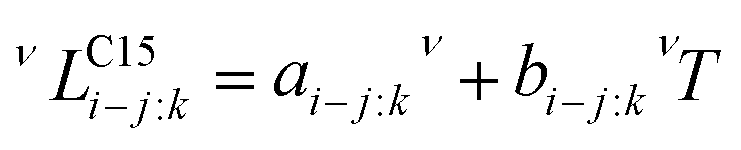
 means the interaction parameter between species i and j when species k is in the second sublattice.
Solid solutions: Redlich–Kister formalism

| (3) |
Liquid phase: associate-solution model
The associate species is Mg2Sn as a constituent of the liquid phase. This model uses site fractions yi, as previously defined, to emphasize that the fraction of constituents is not the same as the component mole fractions, and then it follows:
| n = yCu + yMg + 3yMg2Sn + ySi + ySn |
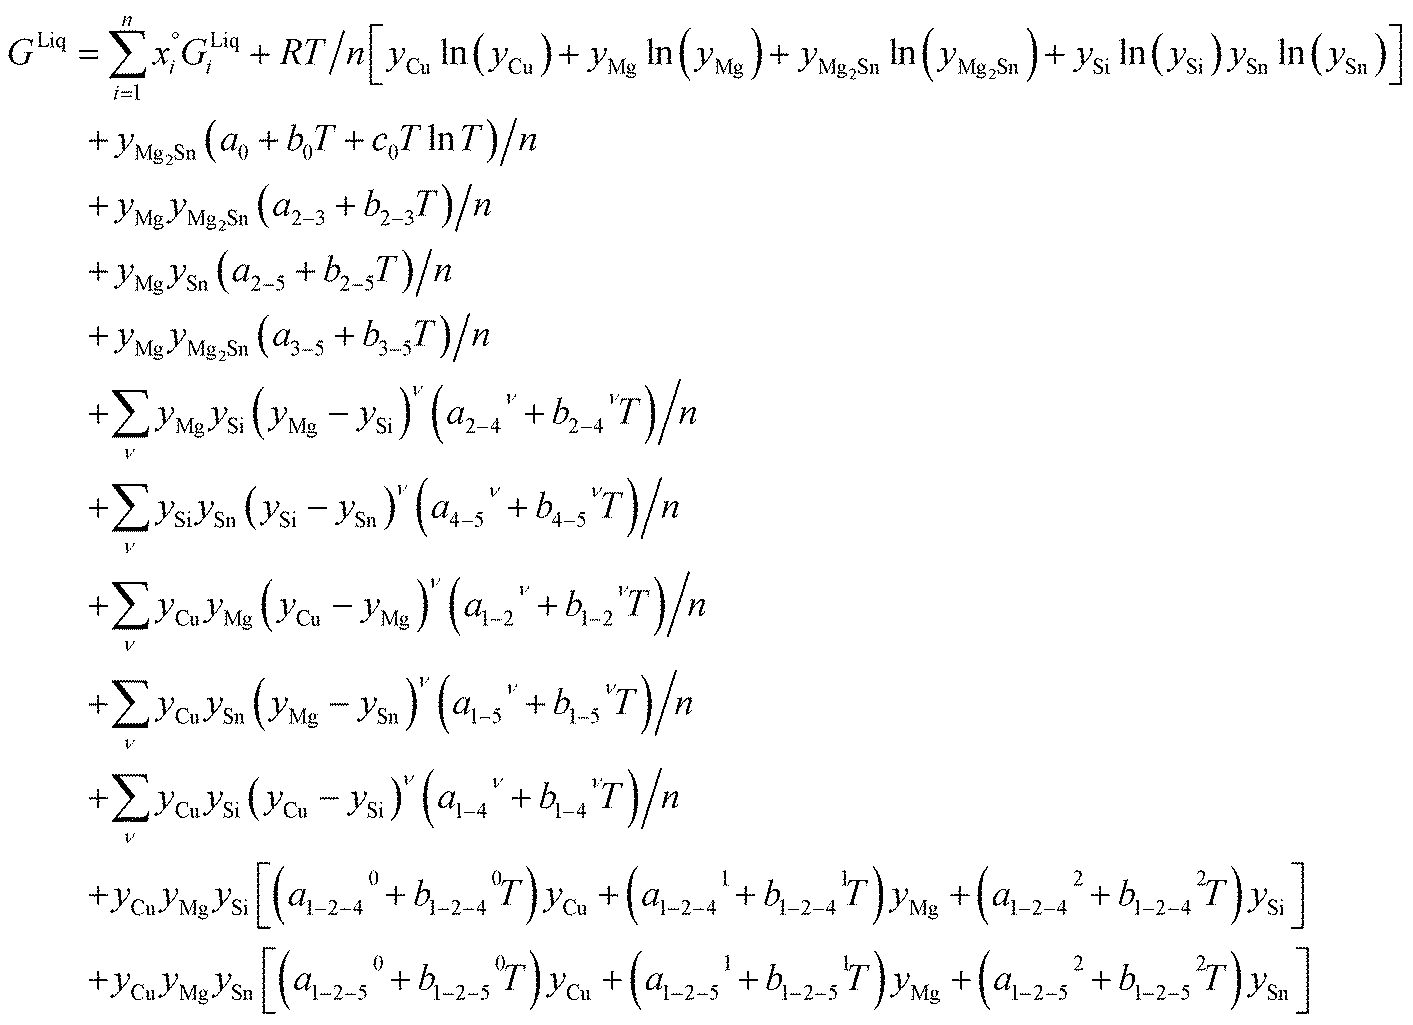 | (4) |
Parameters used in this work
| Phase | Eqn | i−j, ν | a, aν, ai−j | b, bν, bi−j | c, cν | d 10 4 | e | f 10 6 | Ref. |
|---|---|---|---|---|---|---|---|---|---|
| C15 | (2) | 1:1 |
15000 |
33 | |||||
| 2:2 |
15000 |
33 | |||||||
| 4:4 |
90000 |
33 | |||||||
| 5:5 |
15000 |
Tw | |||||||
| 1:2 |
−54690.99 | 364.73085 | −69.27642 | −5.19246 | 143502 |
−5.65953 | 33 | ||
| 2:1 |
104971 |
−16.4645 | 33 | ||||||
| 1−2:1 |
13011.35 |
33 | |||||||
| 1−2:2 |
13011.35 |
33 | |||||||
| 1:1−2 |
6599.45 | 33 | |||||||
| 2:1−2 |
6599.45 | 33 | |||||||
| 4:1 |
90000 |
33 | |||||||
| 1:4 |
90000 |
33 | |||||||
| 2:4 |
90000 |
33 | |||||||
| 4:2 |
90000 |
33 | |||||||
| 2−4:2 |
15000 |
33 | |||||||
| 2−4:4 |
15000 |
33 | |||||||
| 1−4:2 |
−291567 |
110 | 33 | ||||||
| 1:2−4 |
−234365 |
16 | 33 | ||||||
| 2:5 |
0.0 | 37 | |||||||
| 5:2 |
0.0 | 37 | |||||||
| 2−5:5 |
15000 |
33 | |||||||
| 2−5:2 |
15000 |
33 | |||||||
| 1:5 |
90000 |
Tw | |||||||
| 5:1 |
90000 |
Tw | |||||||
| 1−5:2 |
−102000 |
5 | Tw | ||||||
| 1:2−5 |
−189000 |
Tw | |||||||
| fcc | (3) | 1−2,0 | −22059.61 |
5.63232 | 30 | ||||
| 1−4,0 | −42203.5 |
13.89137 | 32 | ||||||
| 1−4,1 | −1102.2 | −18.177912 | 32 | ||||||
| 1−5,0 | −12912 |
4.72 | 31 | ||||||
| 1−5,1 | −15331.3 |
6.9539 | 31 | ||||||
| 2−5,0 | −22000 |
37 | |||||||
| 2−5,1 | −20000 |
37 | |||||||
| bcc | (3) | 1−2,0 | −6500 | 37 | |||||
| 1−4,0 | −26447.3 |
10.21623 | 32 | ||||||
| 1−4,1 | −47275.11 |
−8.517323 | 32 | ||||||
| 1−5,0 | −44821.6 |
51.2164 | 31 | ||||||
| 1−5,1 | −6876.5 | −56.4271 | 31 | ||||||
| hcp | (3) | 2−5,0 | −30000 |
−3 | 26 | ||||
| 2−5,1 | −11293.8 |
−4.42051 | 26 | ||||||
| 2−4,0 | −7148.79 | 0.894 | 20 | ||||||
| 1−2,0 | +22500 |
−3 | 30 | ||||||
| 1−4,0 | −26798.8 |
−0.731518 | 32 | ||||||
| 1−4,1 | −28064.75 |
−0.028889 | 32 | ||||||
| bct | (3) | 1−5,0 | 21000 |
45 | |||||
| diamond | (3) | 4−5,0 | 25265.65 |
23.84 | 20 | ||||
| Mg2X | (2) | 2:4 |
−16177.5 |
3.8967 | 18 | ||||
| 2:5 |
−31024.2 |
110.918 | −21.8911 | −0.003028 | −210000 | 26 | |||
| 2:4−5,0 |
5000 | 17 | |||||||
| 2:4−5,1 |
−900 | 17 | |||||||
| Cu4MgSn | (1) | −19600 |
5 | 37 | |||||
| CuMgSn | (1) | −26500 |
10 | 37 | |||||
| Cu16Mg6Si7 | (1) | 506236 |
20.0884 | 33 | |||||
| CuMgSi | (1) | −129354 |
8.43518 | 33 | |||||
| Cu15Si4 | (2) | 1:4 |
1240.9639 | −6.7191165 | 33 | ||||
| 2:4 |
5000 | 33 | |||||||
| 1−2:4 |
−40000 |
25 | 33 | ||||||
| Cu56Si11 | (2) | 1:4 |
1046.4873 | −5.8746832 | 33 | ||||
| 2:4 |
5000 | 33 | |||||||
| 1−2:4 |
−37000 |
3 | 33 | ||||||
| Cu19Si6 | (1) | 1367.66222 | −7.1976229 | 32 | |||||
| Cu33Si7 | (1) | 1972.382 | −6.9663933 | 32 | |||||
| Cu41Sn11 | (1) | −6323.5 | −1.2808 | 31 | |||||
| Cu3Sn | (1) | −8218 | −0.18 | 37 | |||||
| Cu10Sn3 | (1) | −6655.0 | −1.4483 | 31 | |||||
| Cu6Sn5L | (1) | −7129.7 | 0.4059 | 31 | |||||
| Cu6Sn5H B81_ETA 0:Va | (2) | 1:1:5 |
−4335.06 | 8.88657 | 45 | ||||
| 1:0:5 |
−12292.05 |
2.60267 | 45 | ||||||
| 1:1,0:5 |
−27696.77 |
45 | |||||||
| CuSn-γ | (2) | 5:1 |
116674.85 |
4.8166 | 31 | ||||
| 1:5 |
−10029.85 |
0.00285 | 31 | ||||||
| 1:1−5,0 |
−1857.8 | −2.5311 | 31 | ||||||
| 1:1−5,1 |
0.0 | −2.9894 | 31 | ||||||
| 1−5:5,0 |
45850 |
−42.2191 | 31 | ||||||
| CuMg2 | (1) | −28620 |
1.86456 | 30 | |||||
| liquid | (4) | 0 | −69092.9 |
97.6086 | −11.0957 | 26 | |||
| 2−3 | 6902.76 | −9.22726 | 26 | ||||||
| 3−5 | −8289.15 | −10.0268 | 26 | ||||||
| 2−5 | −31251 |
0.74703 | 26 | ||||||
| 2−4,0 | −70055 |
24.98 | 18 | ||||||
| 2−4,1 | −1300 | 18 | |||||||
| 2−4,2 | 6272 | 18 | |||||||
| 4−5,0 | 25364.6 |
20 | |||||||
| 4−5,1 | 3148.8 | 20 | |||||||
| 4−5,2 | 4460.9 | 20 | |||||||
| 1−2,0 | −36962.71 |
4.74394 | 30 | ||||||
| 1−2,1 | −8182.19 | 30 | |||||||
| 1−5,0 | −9002.8 | −5.8381 | 31 | ||||||
| 1−5,1 | −20100.4 |
3.6366 | 31 | ||||||
| 1−5,2 | −10528.4 |
31 | |||||||
| 1−4,0 | −38763.5 |
12.0 | 32 | ||||||
| 1−4,1 | −52431.2 |
27.4571 | 32 | ||||||
| 1−4,2 | −29426.5 |
14.775 | 32 | ||||||
| 1−2−4,0 | −27023.6 |
32.0757 | 33 | ||||||
| 1−2−4,1 | −20909.7 |
29.7609 | 33 | ||||||
| 1−2−4,2 | −287407 |
−2.87573 | 33 | ||||||
| 1−2−5,0 | −10000 |
20 | 37 | ||||||
| 1−2−5,1 | −20000 |
20 | 37 | ||||||
| 1−2−5,2 | −60000 |
30 | 37 |
Author contributions
All the authors contributed to writing, reviewing and editing. S. T. wrote the original draft of the manuscript, made the thermodynamic calculations, visualization, and did the formal analysis, data curation, validation, methodology and investigation; S. A. did all the experimental work, formal analysis, data curation, methodology and investigation; S. G. F. contributed to the conceptualization, software, validation and visualization; E. M. contributed to funding acquisition, resources, conceptualization, and supervision; J. d. B. was the project administrator, and did supervision, funding acquisition, and conceptualization. All authors have read and agreed to the published version of the manuscript.Conflicts of interest
There are no conflicts to declare.Acknowledgements
S. T. gratefully acknowledges the financial support of the Deutscher Akademischer Austauschdienst (DAAD) and the Deutsches Zentrum für Luft-und Raumfahrt (DLR, German Aerospace Center) through the DAAD-DLR fellowship program no. 314 and 57424730, and specially thanks Dr Ursula Kattner for providing Gibbs energies data related to Cu–Sn binary phases, and Thermo-Calc AB for providing a temporary software license to facilitate the work remotely. J. d. B. and S. A. would like to gratefully acknowledge the endorsement from DLR Executive Board Members for Space Research and Technology and the financial support from the Young Research Group Leader Program. J. d. B. is also funded by the Deutsche Forschungsgemeinschaft (DFG, German Research Foundation), project number 396709363.References
- R. He, G. Schierning and K. Nielsch, Adv. Mater. Technol., 2018, 3, 1–17 Search PubMed.
- X.-L. Shi, J. Zou and Z.-G. Chen, Chem. Rev., 2020, 120, 7399–7515 CrossRef CAS PubMed.
- J. de Boor, T. Dasgupta, U. Saparamadu, E. Müller and Z. F. Ren, Mater. Today Energy, 2017, 4, 105–121 CrossRef.
- H. Kamila, P. Sahu, A. Sankhla, M. Yasseri, N. H. Pham, T. Dasgupta, E. Müller and J. de Boor, J. Mater. Chem. A, 2019, 7, 1045–1054 RSC.
- H. Kamila, A. Sankhla, M. Yasseri, N. Hoang, N. Farahi, E. Müller and J. de Boor, Mater. Today: Proc., 2019, 8, 546–555 CAS.
- V. K. Zaitsev, M. I. Fedorov, E. A. Gurieva, I. S. Eremin, P. P. Konstantinov, A. Y. Samunin and M. V. Vedernikov, ik: Condens. Matter Mater. Phys., 2006, 74, 2–6 Search PubMed.
- W. Liu, X. Tan, K. Yin, H. Liu, X. Tang, J. Shi, Q. Zhang and C. Uher, Phys. Rev. Lett., 2012, 108, 1–5 Search PubMed.
- N. Farahi, C. Stiewe, D. Y. N. Truong, J. de Boor and E. Müller, RSC Adv., 2019, 9, 23021–23028 RSC.
- A. Sankhla, A. Patil, H. Kamila, M. Yasseri, N. Farahi, E. Müller and J. de Boor, ACS Appl. Energy Mater., 2018, 1, 531–542 CrossRef CAS.
- S. Ayachi, G. Castillo Hernandez, N. H. Pham, N. Farahi, E. Müller and J. De Boor, ACS Appl. Mater. Interfaces, 2019, 11, 40769–40780 CrossRef CAS PubMed.
- X. Li, Z. Li, C. Chen, Z. Ren, C. Wang, X. Liu, Q. Zhang and S. Chen, J. Mater. Chem. A, 2021, 9, 6634–6649 RSC.
- X. J. Liu, K. Oikawa, I. Ohnuma, R. Kainuma and K. Ishida, JOM, 2003, 55, 53–59 CrossRef CAS.
- S. Chen, Y. Chen, S. Ohno, L. Xu, W. Fan, L. Xue, M. Ferhat and Y. Wu, Phys. Status Solidi A, 2020, 217, 1901035 CrossRef CAS.
- B. Jayachandran, B. Prasanth, R. Gopalan, T. Dasgupta and D. Sivaprahasam, Mater. Res. Bull., 2021, 136, 111147 CrossRef CAS.
- H. Lukas, S. G. Fries and B. Sundman, Computational Thermodynamics. The Calphad Method, Cambridge University Press, 2007 Search PubMed.
- U. R. Kattner, JOM, 1997, 49, 14–19 CrossRef CAS.
- A. Kozlov, J. Gröbner and R. Schmid-Fetzer, J. Alloys Compd., 2011, 509, 3326–3337 CrossRef CAS.
- D. Kevorkov, R. Schmid-Fetzer and F. Zhang, J. Phase Equilib. Diffus., 2004, 25, 140–151 CrossRef CAS.
- B. C. Zhou, S. L. Shang and Z. K. Liu, CALPHAD: Comput. Coupling Phase Diagrams Thermochem., 2014, 46, 237–248 CrossRef CAS.
- I. Ansara, A. T. Dinsdale and M. H. Rand, COST 507 - Thermochemical Database for Light Metals Alloys, Office for Official Publications of the European Communities, Luxemburg, 1998, p. 396 Search PubMed.
- S. Muntyanu, E. B. Sokolov and E. S. Makarov, Inorg. Mater., 1966, 2, 740–744 Search PubMed.
- E. N. Nikitin, E. N. Tkalenko, V. K. Zaitsev, A. Zaslavskii and A. K. Kuznetzov, Inorg. Mater., 1968, 4, 1656–1659 Search PubMed.
- I.-H. Jung, D.-H. Kang, W.-J. Park, N. J. Kim and S. Ahn, Calphad, 2007, 31, 192–200 CrossRef CAS.
- R. Orenstein, J. P. Male, M. Toriyama, S. Anand and G. J. Snyder, J. Mater. Chem. A, 2021, 9, 7208–7215 RSC.
- M. Yasseri, K. Mitra, A. Sankhla, J. de Boor and E. Müller, Acta Mater., 2021, 208, 116737 CrossRef CAS.
- A. Kozlov, M. Ohno, R. Arroyave, Z. K. Liu and R. Schmid-Fetzer, Intermetallics, 2008, 16, 299–315 CrossRef CAS.
- TCSAB, Thermo-Calc Software AB, https://thermocalc.com/, accessed: 22 June 2021.
- D. Kato, K. Iwasaki, M. Yoshino, T. Yamada and T. Nagasaki, Phys. Chem. Chem. Phys., 2018, 20, 25939–25950 RSC.
- A. Sankhla, H. Kamila, K. Kelm, E. Müller and J. de Boor, Acta Mater., 2020, 199, 85–95 CrossRef CAS.
- C. A. Coughanowr, I. Ansara, R. Luoma, M. Hamalainen and H. L. Lukas, Z. Metallkd., 1991, 82, 574–581 CAS.
- J.-H. Shim, C.-S. Oh, B.-J. Lee and D. N. Lee, Z. Metallkd., 1996, 87, 205–212 CAS.
- X. Yan and Y. A. Chang, J. Alloys Compd., 2000, 308, 221–229 CrossRef CAS.
- J. Zhao, J. Zhou, S. Liu, Y. Du, S. Tang and Y. Yang, J. Min. Metall., Sect. B, 2016, 52, 99–112 CrossRef CAS.
- N. Bochvar, E. Lysova and L. Rokhlin, Landolt-Börnstein New Series IV/11A4, 2007, pp. 224–237 Search PubMed.
- E. E. Vicente, S. Bermudez, R. H. de Tendler, B. Arcondo and H. Sirkin, J. Mater. Sci. Lett., 1996, 15, 1690–1696 CrossRef CAS.
- B. Predel and H. Ruge, Mater. Sci. Eng., 1972, 9, 141–151 CrossRef CAS.
- J. Miettinen and G. Vassilev, J. Min. Metall., Sect. B, 2012, 48, 53–62 CrossRef CAS.
- S. I. Yi, V. Attari, M. Jeong, J. Jian, S. Xue, H. Wang, R. Arroyave and C. Yu, J. Mater. Chem. A, 2018, 6, 17559–17570 RSC.
- N. H. Pham, N. Farahi, H. Kamila, A. Sankhla, S. Ayachi, E. Müller and J. de Boor, Mater. Today Energy, 2019, 11, 97–105 CrossRef CAS.
- CRC Handbook of Chemistry and Physics, ed. R. C. Weast, CRC Press, USA, 55th edn, 1974 Search PubMed.
- A. A. Kodentsov, G. F. Bastin and F. J. Van Loo, J. Alloys Compd., 2001, 320, 207–217 CrossRef CAS.
- G. Castillo-Hernandez, M. Yasseri, B. Klobes, S. Ayachi, E. Müller and J. de Boor, J. Alloys Compd., 2020, 845, 156205 CrossRef CAS.
- Q. Chen, M. Hillert, B. Sundman, W. A. Oates, S. G. Fries and R. Schmid-Fetzer, J. Electron. Mater., 1998, 27, 961–971 CrossRef CAS.
- M. C. Peters, J. W. Doak, J. E. Saal, G. B. Olson and P. W. Voorhees, J. Electron. Mater., 2019, 48, 1031–1043 CrossRef CAS.
- U. R. Kattner, CALPHAD XXXII 2003 Conference Proceedings, 2004, pp. 241–273 Search PubMed.
Footnote |
| † Electronic supplementary information (ESI) available: Cu-Mg-Si-sn_thermodynamic_description.TDB: is the thermodynamic database for the quaternary system Cu–Mg–Si–Sn; cumgsisn_supplement_info.pdf: includes the calculated isotherm for Mg–Si–Sn at 700 °C. See DOI: 10.1039/d1ta05289f |
| This journal is © The Royal Society of Chemistry 2021 |