
 Open Access Article
 This Open Access Article is licensed under a Creative Commons Attribution-Non Commercial 3.0 Unported Licence
Origin of the catalytic activity at graphite electrodes in vanadium flow batteries†
Hannes
Radinger
 ,
Ahmad
Ghamlouche
,
Helmut
Ehrenberg
and
Frieder
Scheiba
*
,
Ahmad
Ghamlouche
,
Helmut
Ehrenberg
and
Frieder
Scheiba
*
Institute for Applied Materials, Hermann-von-Helmholtz-Platz 1, 76344 Eggenstein-Leopoldshafen, Germany. E-mail: frieder.scheiba@kit.edu
First published on 11th June 2021
Abstract
For many electrochemical devices that use carbon-based materials such as electrolyzers, supercapacitors, and batteries, oxygen functional groups (OFGs) are considered essential to facilitate electron transfer. Researchers implement surface-active OFGs to improve the electrocatalytic properties of graphite felt electrodes in vanadium flow batteries. Herein, we show that graphitic defects and not OFGs are responsible for lowering the activation energy barrier and thus enhance the charge transfer properties. This is proven by a thermal deoxygenation procedure, in which specific OFGs are removed before electrochemical cycling. The electronic and microstructural changes associated with deoxygenation are studied by quasi in situ X-ray photoelectron and Raman spectroscopy. The removal of oxygen groups at basal and edge planes improves the activity by introducing new active edge sites and carbon vacancies. OFGs hinder the charge transfer at the graphite–electrolyte interface. This is further proven by modifying the sp2 plane of graphite felt electrodes with oxygen-containing pyrene derivatives. The electrochemical evolution of OFGs and graphitic defects are studied during polarization and long-term cycling conditions. The hypothesis of increased activity caused by OFGs was refuted and hydrogenated graphitic edge sites were identified as the true reason for this increase.
Introduction
For many electrochemical devices that use carbon-based materials such as electrolyzers, supercapacitors, and batteries, oxygen functional groups (OFGs) are considered essential to facilitate electron transfer.1–5 Nearly 30 years ago, a few years after the first successful demonstration of an all-vanadium flow battery (VFB), a reaction mechanism based on hydroxyl groups on the surface of carbon-based electrodes was postulated.6–8 The research afterwards stagnated until the late 2000s, when the number of publications for (vanadium) flow batteries climbed exemplary in a short time (Fig. S1†). It is thus more remarkable that the original proposed reaction mechanism via oxygen functional groups (OFGs, Fig. 1a) is still regularly cited and reproduced in literature up to this year.9–12 A lot of scientific and industrial activities regarding VFBs focus on improving graphite-based felt electrodes by the application of OFGs through oxidative treatments such as thermal, chemical, electrochemical, alkaline or acid activation, to facilitate the negative (VIII + e− ⇌ VII, E0 = −0.26 V vs. SHE) and positive (VVO2+ + 2H+ + e− ⇌ VIVO2+ + H2O, E0 = 1.0 V vs. SHE) half-cell reactions.13–21 The later observed performance enhancement is then ascribed to an elevated quantity of surface oxygen.5,22 However, there are contradictory results about the specific OFG (hydroxyl, carbonyl, or carboxylic group), which is suspected to be responsible for the increased activity.11,16,19,22,23 Only a few research groups express serious doubt and discuss the VVO2+/VIVO2+ reduction kinetics, obstructed by OFGs.24–27 Both half-cell reactions have to be measured separately, since positive and negative electrodes respond differently to the surface oxygen concentration, which can mislead in symmetric full cell characterizations.28–30 | ||
| Fig. 1 Schematic representation of the graphite structure and the experimental procedure. (a) Selection of graphitic oxygen functional groups that can be distinguished with X-ray photoelectron spectroscopy, and their respective decomposition temperature under inert gas. (b) Defective graphite cluster displaying a Stone–Wales defect (C5–C7), a single vacancy (CV), a disturbed ring at the edge (C5), and two types of edge sites (armchair and zigzag). (c) Deoxygenation of graphite felt in a sealed glass tube under Ar/H2 atmosphere at different temperatures. Oxygen is removed according to the thermal instability of the respective OFG indicated in (a), and dangling bonds are saturated with hydrogen to prevent rapid reoxidation in air. (d) Subsequently, quasi in situ X-ray photoelectron and Raman spectroscopy were performed.38,39 | ||
A further complicating factor is that most of the oxidative procedures use harsh environments that as well damage the material surface and create defects such as edge sites and vacancies (Fig. 1b). Edge sites provide faster electron transfer kinetics for redox reactions, which was also demonstrated specifically for the vanadium chemistry.31–33 Theoretical calculations have concluded that the graphitic basal plane is inactive and only edge sites, which form carbonyl groups due to dissociation of water, can serve as active sites for vanadium.34,35 Also in experimental work, the activity in both half-cells has so far been associated with oxidized edge sites.33,36 However, in the evaluation of electrocatalysts, often only the properties before electrochemistry are investigated, therefore neglecting the change in surface chemistry and microstructure induced by the electrolyte and the applied potential. In a previous study, we have already shown that OFGs are electrochemically unstable, and predictions on the activity cannot be made based alone on a previous physicochemical characterization.37
To study the influence and electrochemical performance of OFGs on graphite felt electrodes, we took a different approach compared to previously discussed studies. While usually the oxygen concentration is increased by an oxidative pretreatment, we thermally deoxygenated felt electrodes (Fig. 1c) to investigate the changes in activity thereafter. This procedure allows us to observe chemical surface changes without attacking the structure and to study the influence of various OFGs because of their different decomposition temperature. We studied the influence of the deoxygenation procedure on rather inactive pristine graphite felt (GF) and highly performant, surface activated felt (GF-SA) with lots of OFGs and defects resulting from a previous thermal oxidation treatment. The evolution of the electronic structure and the microstructure was monitored by quasi in situ X-ray Photoelectron Spectroscopy (XPS) and Raman spectroscopy (Fig. 1d). After the evaluation of the respective half-cell activity, the evolution of OFGs and defects was selectively characterized after immersion in the electrolyte and polarization experiments. Further, the long-term cycling effect and stability of the deoxygenation procedure was studied. Combining all our results, we propose a new reaction mechanism based on hydrogenated graphitic edge sites instead of surface oxygen groups.
Results & discussion
Influence of the deoxygenation on the electronic structure
After thermal deoxygenation, the chemical composition of the graphite felts was studied by quasi in situ XPS (Fig. 2 and S2–S4†). The thermal, chemical, or hydrothermal deoxygenation of graphene oxide has been intensely studied by multiple methods.40–42 A precise understanding of these mechanisms on graphite felt electrodes is herein given for the first time. The C 1s region of mixed sp2/sp3 hybridized carbon is generally difficult to evaluate, which is why a semi-quantitative method by the first derivative of the C KLL Auger region (Fig. 2a) is used to approximate the overall carbon bonding state. For sp3 hybridized carbon-based materials such as diamond, the so-called D-parameter has a minimum of ∼13 eV, while graphite-like materials have higher energy gaps of up to 23 eV.43–45 At temperatures ≤500 °C mostly basal plane bound hydroxyl and carboxylic groups, and amorphous carbon are removed, and the π-conjugated structure of graphite is restored, resulting in the high sp2 content for GF-500 (21 eV).46,47 At higher temperatures, the relative sp3 content rises again (16 eV) due to the conversion of covalently bound ether (C–O–C) to edge site located carbonyl and phenyl groups.40 Above 900 °C (19 eV), some of these oxygen groups are removed, and the share in sp2 carbon rises again.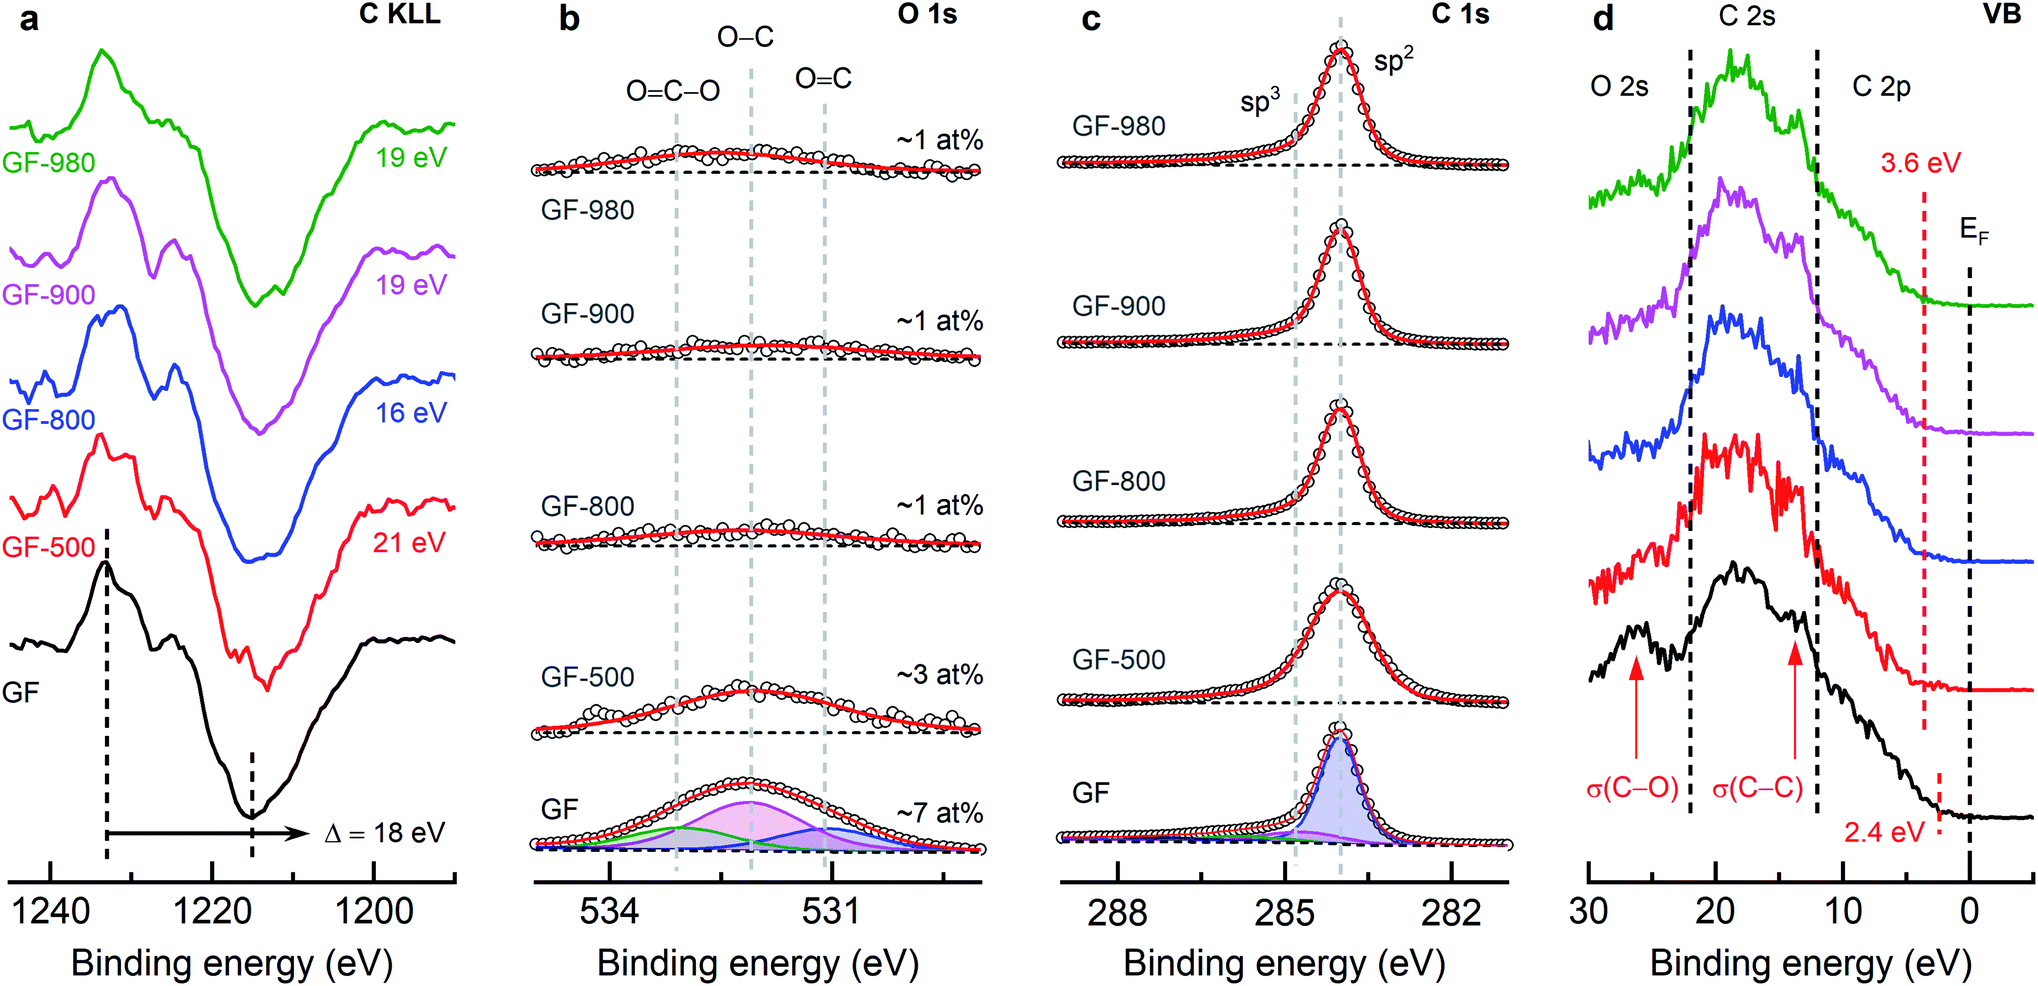 | ||
| Fig. 2 X-ray photoelectron spectroscopy investigation of the electronic structure of thermally deoxygenated graphite felts. (a) First derivative of the C KLL Auger region to determine the D-parameter by the binding energy difference between intensity minimum and maximum. (b) O 1s detail spectra, indicating the position of the respective oxygen group and the relative oxygen content. (c) C 1s detail spectra, indicating the position of sp2 and sp3 hybridized carbon. (d) Valence band (VB) region, displaying the O 2s, C 2s and C 2p regions and the evaluated valence band maximum. | ||
In the O 1s spectra (Fig. 2b) it is observed that the overall oxygen concentration on the surface decreases with temperature. On the initial sample, three different oxygen components were identified: O![[double bond, length as m-dash]](https://www.rsc.org/images/entities/char_e001.gif) C (oxygen doubly bounded to carbon in carbonyls) at ∼531.1 eV, O–C (singly bounded oxygen, C–O–C in ether and C–OH in hydroxyls) at ∼532.1 eV, and OC–O (oxygen bound as carboxylic acid) at ∼533.1 eV.48,49 The high binding energy oxygen component is regularly also assigned to phenyl groups (oxygen singly bounded to aromatic carbon).40,50,51 Even temperatures >1000 °C dot not sufficiently remove phenyl groups from graphite because of their thermodynamically stable presence between layers of graphite.51–53
C (oxygen doubly bounded to carbon in carbonyls) at ∼531.1 eV, O–C (singly bounded oxygen, C–O–C in ether and C–OH in hydroxyls) at ∼532.1 eV, and OC–O (oxygen bound as carboxylic acid) at ∼533.1 eV.48,49 The high binding energy oxygen component is regularly also assigned to phenyl groups (oxygen singly bounded to aromatic carbon).40,50,51 Even temperatures >1000 °C dot not sufficiently remove phenyl groups from graphite because of their thermodynamically stable presence between layers of graphite.51–53
Six different peak contributions in the C 1s region (Fig. 2c and S3†) are visible on GF: sp2 hybridized carbon at 284 eV, sp3 carbon at 284.8 eV, ether and hydroxyl groups at 286.3 eV, carbonyls at 287.6 eV, carboxylic groups at 289.2 eV, and the sp2 carbon related shake-up satellite at 291.2 eV.22,40,54,55 The regions after deoxygenation were deconvoluted by one sp2 component and the high binding energy π–π* feature. At temperatures ≥800 °C, the FWHM of sp2 carbon decreases from 1.3 eV (GF-500) to 0.8 eV (as originally on GF), indicating the absence of sp3 hybridized components. All three regions, in conclusion, suggest the conversion of oxygen from surface groups (sp3) to ether (sp2) to terminal groups (sp2) and their removal thereafter.
Additional information is gained by the low binding energy and valence band (VB) region (Fig. 2d). The domain at 2–12 eV above the Fermi level (EF) is occupied by C 2p valence electrons, up to 22 eV by C 2s electrons, and beyond contributions from O 2s electrons are observed.40,56,57 The onset of the C 2p threshold-edge allows the evaluation of the electronic density of states (DOS) at the valence band maximum (VBM). All samples show a non-zero DOS between 0 to 3 eV because of 2p–π electrons present in the π-conjugated basal plane.58 The heat-treated samples show an increased VBM of 3.6 eV compared to the pristine material (2.4 eV), since the deoxygenation increases the sp2 content, which itself has a positive effect on the in-plane electron transfer, but not perpendicular to the plane because of the absence of bridging bonds. At ∼13 eV the 2s σ(C–C) electron states are identified as an especially distinct feature ≥900 °C instead of merging with the subsequent C 2s signal, followed by the main C 2s peak at ∼18 eV.56,58,59 A prominent signal in the O 2s region associated with oxygen bound to the aromatic carbon lattice (σ(C–O)) disappears after deoxygenation.40,58,60 Interestingly, this feature reappears on GF-980 with a lower separation to the C 2s peak because of phenyl instead of primarily C–O–C or CO groups being present.40
The same investigation was conducted for GF-SA (Fig. S4†). This material initially has a lower sp2/sp3 ratio (D-parameter = 17 eV), attributed to the prior oxidative heat treatment. The sp2 character is then restored on GF-SA-980 (21 eV). For GF-SA-800 and above the oxygen concentration decreases (from 10 at% to ∼1 at%), and the overall appearance of the O 1s and C 1s region is like the GF row. GF-SA has a higher populated DOS (VBM = 1.9 eV), shifting to 3.7 eV directly after the first heating step and not changing thereafter. The 2s σ(C–C) contribution is less distinct, which we contribute to irreversible damage of the graphitic network because of the oxidative treatment.
Microstructural properties
The microstructural properties of the samples were characterized by Scanning Electron Microscopy (SEM) to analyze visible changes of the morphology, and Raman spectroscopy to assess semi-quantitative information about the number of graphitic defects. To characterize disorder in carbon materials, the I(D)/I(G) and I(D)/I(D′) ratios are valuable tools. The intensity ratio of the D and G band provides useful information such as the degree of disorder in the sample.61,62 Furthermore, the intensity ratio of the D and D′ band can be used to assess information about the origin of graphitic defects.63 An I(D)/I(D′) ratio of ∼3.5 is characteristic for grain boundary defects (edge sites and C5–C7 defects), whereas the ratio increases up to ∼7 for vacancy (CV) defects (see Fig. 1b for comparison).63 A ratio of ∼13 corresponds to mostly sp3 related defects and a value <3.5 to the presence of small sized sp2 domains close to each other in a loop configuration.63,64The difference in morphology between pristine GF and thermally activated GF-SA was visualized by SEM (Fig. 3a–c). The felts consist of randomly entangled fibers of ∼9 μm in diameter (Fig. 3a). Singular fibers of both felts were directly compared (Fig. 3b and c), which revealed numerous porous defects induced by the thermal activation. These pores greatly enhance the surface area, which was verified by nitrogen adsorption. An increase by a factor of 5.3 (from about 0.64 m2 g−1 to 3.41 m2 g−1) was observed, indicating that the oxidative attack exposes additional graphite layers and edge sites. To make sure that the deoxygenation treatment had no influence of the microstructure, GF-980 and GF-SA-980 were analyzed by SEM (Fig. S5†), revealing no visible difference compared to the initial samples.
 | ||
| Fig. 3 Microstructural properties of GF before and after deoxygenation. (a–c) SEM images of pristine (a and b) and surface activated (c) felt to compare the oxidative attack of the thermal activation. (d–g) Raman spectra of pristine, surface activated, and the thermally deoxygenated graphite felts. (d and e) First- and second-order modes of graphite, exemplary displayed for the primary felt material, indicating the respective vibrational feature and its wavenumber position; additionally, the FWHM values of the D band is given. Based on the deconvoluted first-order spectra, the (f) I(D)/I(G) ratio and the (d) I(D)/I(D′) ratio of the felts has been evaluated and are indicated regarding the prior heating temperature. | ||
To analyze the induced disorder, the oxidized and deoxygenated felts were investigated by Raman spectroscopy. The main features of a graphite Raman spectrum (Fig. 3d, e and S6†) comprise the G band at ∼1587 cm−1, associated with a first order E2g longitudinal optical phonon mode, resembling the in-plane stretching of CC bonds, and the D band at ∼1333 cm−1, induced by disorder such as edges, stacking fault, or atomic defects, corresponding to an A1g breathing mode of a six-atom C-ring.65–68 At higher wavenumbers, the spectrum is dominated by the second-order D band (2D) at 2655 cm−1, which is a result of two D band phonons with opposite momentum.
The I(D)/I(G) value (Fig. 3f) of GF (1.98) first decreases to 1.86 (GF-500), but then steadily rises to 2.25 (GF-980). In accordance with the XPS results, the first deoxygenation of the material results in a higher share of sp2 carbon due to the removal of basal plane bound oxygen and the rearrangement of graphitic layers. Continuous deoxygenation creates more defects, which are recognized as disorder in contrast to oxygenated edge sites which do not always correspond to a high D to G ratio.69,70 The increased I(D)/I(D′) ratio of GF (3.52 to 4.20) in Fig. 3g suggests the generation of vacancies at 800 °C. Higher temperatures counteract and heal these vacancies partly which is seen by a decreased ratio.
The band positions on both original samples are the same, but for GF-SA the D band is more, and the 2D signal is less pronounced, which indicates a higher degree of disorder and weaker interaction between intact two-dimensional graphitic layers for the activated felt.62 The higher FWHM of the D band for GF-SA (from 49 to 57 cm−1) is attributed to its more defective structure. With ongoing deoxygenation, the FWHM of the D band does not change by more than ±1 cm−1 for GF, but decreases by 4 cm−1 for GF-SA (Fig. S6†) which indicates partial healing of oxygenation damage. The evolution of the I(D)/I(G) ratio of GF-SA (2.65) follows a similar trend as GF with a decrease up to 800 °C (2.30), followed by an increase to 2.54 at 980 °C confirming an increase of deoxygenated defects also for the GF-SA sample series. The higher D to D′ ratios suggests that even before deoxygenation, the defects on GF-SA (3.70) are more related to edge sites, but deoxygenation further increases the number of vacancies up to GF-SA-980 (4.21).
In summary, up to a certain deoxygenation temperature (500 °C for GF and 800 °C for GF-SA, seemingly depending on the initial defect density) the disorder is first reduced, and rearrangement of the basal plane occurs. At higher temperatures, two effects were observed: (i) deoxygenation of edge sites leads to an increased D to G ratio due to their larger Raman scattering cross-section. (ii) Defects created at higher temperatures can be partially attributed to vacancies. Further, the comparison with XPS results demonstrates that this occurs while a high sp2/sp3 ratio is maintained.
Influence of OFGs on the electrochemical half-cell performance
To study the correlation between the electrocatalytic properties and the decreasing degree of deoxygenation, the electrochemical half-cell performance was examined by cyclic voltammetry (CV) and electrochemical impedance spectroscopy (EIS) in a three-electrode cell. Several features of the recorded CV data (Fig. S7†) were examined. The reversibility of the redox reaction was investigated by the peak current ratio between the oxidation and reduction reaction (Fig. 4a and b), while the electrocatalytic activity was studied by the peak potential separation (ΔEp) between the oxidation and corresponding reduction peak (Fig. 4c). Further, the influence of the deoxygenation on the electrochemical active surface area, which is linked to the electrical double layer capacitance (EDLC), was examined (Fig. 4d and S8†).71,72 In addition, the charge transfer resistance (RCT), which describes the electron transfer kinetics at the electrode–electrolyte interface, was evaluated. We assessed the RCT values in both half-cells by EIS (Fig. 4e, f and S9–S11†) at the start and the end of our cycling experiment. | ||
| Fig. 4 Electrochemical investigation of the felt electrodes by CV and EIS in the negative and positive half-cells. (a and b) The peak current (ip) ratio of the oxidation and reduction signals in the (a) negative and (b) positive half-cell, determined at different scan rates to study the reversibility of the respective redox reaction. (c) Investigation of the electrocatalytic activity by determining the peak potential separation (ΔEp) between the oxidation and reduction signal of pristine and surface activated felt electrodes. (d) Evaluation of the electrical double layer capacitance to investigate the differences in the active surface induced by the deoxygenation. (e and f) Evaluation of the charge transfer resistance (RCT) of the felt electrodes, determined by electrochemical impedance spectroscopy at the start of each half-cell cycling experiment (fresh) and again at the end (cycled) in the (e) negative half-cell, evaluated at an applied potential of −0.45 V vs. Ag/AgCl, and similarly in the (f) positive half-cell by applying a potential of 0.9 V vs. Ag/AgCl. | ||
The samples of the GF series all show peak current ratios well above 0.85 in the negative half-cell (Fig. 4a). However, in the positive half-cell (Fig. 4b) a rise in reversibility with increasing scan rate and deoxygenation is observed for GF. The desorption kinetics, often identified as the rate limiting step in the positive half-cell, are therefore accelerated by an oxygen-free surface.34,35 This is attributed to the higher electrostatic attraction between surface oxygen groups and the VVO2+ molecule compared to the VII ion. An acceleration of the desorption process is further supported by a steeper slope in the Randles–Sevcik plots (Fig. S12†). The ΔEp values of GF decrease from 230 mV (positive half-cell) and 270 mV (negative half-cell) to almost identical values for both half-cell reactions of ∼140 mV for GF-980. The initial activity enhancement is attributed to the removal of OFGs since no additional edge sites were created. Subsequently, a lower ΔEp is associated with additional disorder since no change in the chemical composition was observed. The active surface area slightly increases in accordance with the EDLC from about 1 (GF) to 1.25 mF (GF-980).
The redox reversibility of GF-SA is higher, but for both half-cell reactions no significant changes due to the deoxygenation were observed. For the positive half-cell, the ΔEp of GF-SA slightly decreases for temperatures >800 °C (from 100 mV to 80 mV). Even though an overall healing of disorder was observed by Raman spectroscopy up to this temperature, the creation of vacancies balances this loss of active edge sites, keeping ΔEp constant. At higher temperatures, the defect density rises which lowers ΔEp. In the negative half-cell, ΔEp rises from 60 mV to a nearly constant peak separation of 80 mV after deoxygenation at 500 °C, which is in accordance with the lower I(D)/I(G) ratio of GF-500. Since the additional removal of oxygen has no further influence on this value, we deduce that the overall lower degree of disorder of deoxygenated GF-SA (2.30 to 2.54) compared to its initial state (2.65) is responsible for the activity drop. The further loss of edges on GF-800 is compensated by an increased presence of carbon vacancies, which is evident in the D to D′ ratio, resulting in a constant ΔEp.
The EDLC of GF-SA corresponds to about 8 times the value of GF (Fig. 4d), but the surface area is only higher by a factor of ∼5.3. Additional active sites, commonly associated with additional oxygen groups, have been generated on GF-SA during the thermal activation.73,74 The EDLC of GF-SA steadily declines from about 7.9 to 6.3 mF with increasing deoxygenation temperature, while it increased on GF. The removal of OFGs can therefore not be held responsible for the observed change in active surface area. However, our results indicate, that the different EDLC of the two sample sets is related to the number of defects, which is in accordance with previous studies on graphitic disorder.75–77 After normalizing the EDLC to the real surface area (Fig. S9†), GF-980 has a higher value than its more active counterpart GF-SA-980. We attribute this to the different distribution of defects per area, and believe that non-edge defects, which were proven to have the highest capacitance per area, are more dense on GF-980.77
The electrochemical impedance of the electrodes was evaluated before and after electrochemical cycling to study the influence of the deoxygenation on the RCT (Fig. 4e and f). The RCT of GF-SA is consistently lower than GF, regardless of the inspected half-cell or deoxygenation temperature. This is based on the overall higher defect density, which is evident from the Raman results and the much higher EDLC. Two observations are made for the deoxygenated GF row: first, the strongest decrease of RCT for GF-500 is associated with the removal of the major part of OFGs. Even though for higher temperatures the oxygen concentration further decreases, active defects are partially healed (Fig. 3f), which explains the relative increase for GF-800 in the negative half-cell. However, additional deoxygenation decreases the RCT for the cycled samples, which is not observed for pristine GF. The degree of oxidation at this material is high as it was studied by our group previously.37 The oxygen-free electrodes further decrease RCT during cycling. In the positive half-cell, RCT steadily decreases with higher deoxygenation temperatures. All cycled samples of the GF row show an increase in RCT because of oxidation by the electrolyte, which is reduced by higher degree of deoxygenation. The removal of basal plane bound oxygen and formation of hydrogen-terminated edges at higher temperature, which are more stable against reoxidation and hence against the formation of new OFGs, leads to a more rapid electron conductivity across the basal plane and an increased charge transfer rate at the solid–liquid interface.33,34 A decrease of the internal resistance for both materials (the first intercept in the Nyquist plots in Fig. S10†) by 0.2–0.4 Ω (GF) and 0.2–0.3 Ω (GF-SA) is related to the higher electrical conductivity. In general, the RCT of the GF-SA row remains much lower due to the overall higher degree of disorder throughout all temperature stages. For GF-SA in both half-cells, the evolution of RCT with temperature resembles the I(D)/I(G) ratio (Fig. 3f), showing a higher resistance for a lower number of defects.
To further confirm our hypothesis, the influence of OFGs was studied by attaching pyrene derivatives with different functional groups (Fig. 5a) via π–π stacking to the basal plane of GF.78 This method has been chosen since it does not affect the microstructure of the electrode and was already successfully applied in the functionalization of graphene for capacitive energy storage.79 In our case, however, there was no enhancement of the electrocatalytic activity (Fig. 5b and c). The pure pyrene provides additional edge sites for redox reactions, which explains the increased performance in the negative half-cell. There is also a slight improvement by the oxygen-containing pyrenes compared to pristine GF, which we refer to the partial instability of the additional OFGs during cycling. However, also the oxygenated pyrenes contain three C6 rings without OFGs, which might work as active sites. In the positive half-cell, all pyrenes reduce the performance of GF. While the 1-pyrenecarboxylic acid maintains the activity of pure pyrene, a substantial decrease in ΔEp and peak current is observed for the hydroxyl group. The functionalization with different pyrenes confirms that OFGs are not beneficial for either of the two half-cell reactions. In fact, all but carboxyl groups do rather have a detrimental effect on the charge transfer. We showed herein that a pyrene modification of felt electrodes is possible and several effects can be observed. Further elucidation of the interplay between graphite and pyrene and the resulting mechanism is desired.
 | ||
| Fig. 5 Oxygen functional groups studied by the attachment of pyrene derivatives to the basal plane of graphite felt electrodes. (a) Schematic depiction of the used pyrene derivatives with the respective oxygen functional group. (b and c) The electrochemical performance studied by cyclic voltammetry in the (b) negative and (c) positive half-cell. | ||
Chemical and structural changes during electrochemistry
By the investigations discussed so far, we could rule out a significant contribution of OFGs to the charge transfer reaction of both half cells. Instead, we could highlight the importance of graphitic defects. However, as discussed previously all deoxygenated samples show a certain degree of reoxidation when exposed to the electrolyte or electrochemically cycled. This raises the question how well the initial surface structure obtained by an activation treatment is maintained in the cell or if surface structures of differently treated samples converge after some time irrespective of their initial treatment.Therefore, we investigated the evolution of surface functional groups after exposure to the positive and negative electrolyte and electrochemical polarization of the deoxygenated electrodes (GF-980 and GF-SA-980) and analyzed them by XPS to probe the surface chemical composition and the sp2/sp3 ratio (Fig. 6a and b). Further Raman spectroscopy was used to monitor possible changes of their surface microstructural properties (Fig. 6c and d).
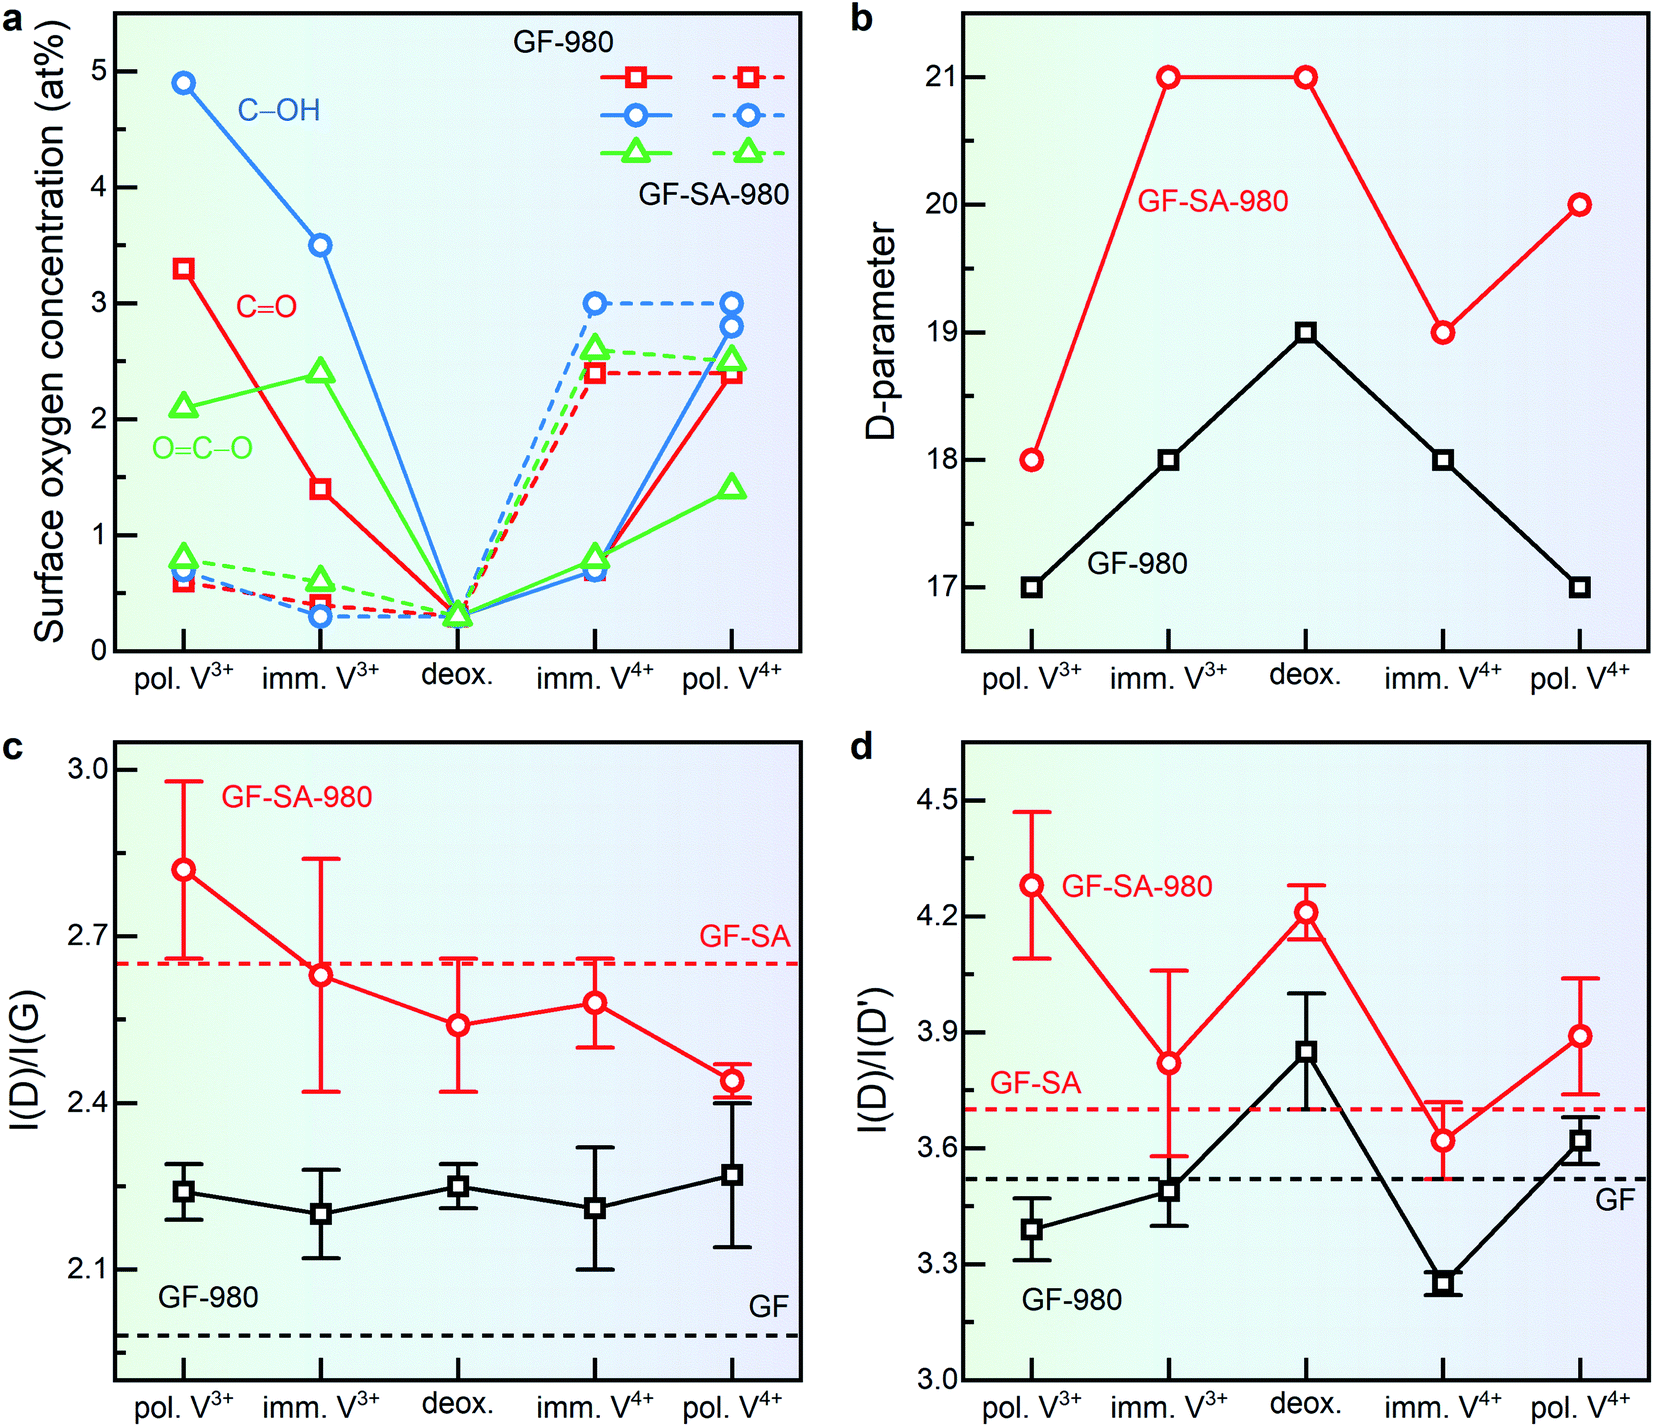 | ||
| Fig. 6 X-ray photoelectron and Raman spectroscopy investigation of graphite felts thermally deoxygenated (deox.) at 980 °C after immersion (imm.) and polarization (pol.) in each half-cell electrolyte. (a) Change in surface concentration of different oxygen functional groups, evaluated from the O 1s core level spectra. (b) D-parameter obtained by the first-derivative C KLL Auger region. (c) Overall degree of disorder given by the I(D)/I(G) ratio based on the Raman spectra, and (d) effect on graphitic defects expressed by the I(D)/I(D′) ratio. | ||
The amount of oxygen increases considerably for GF during immersion (∼7 at%) and polarization (∼10 at%) in the negative electrolyte (Fig. 6a and S13†). The major part consists of hydroxyl groups formed at basal planes, whereas carbonyls and carboxylic groups develop at edge sites.34,80,81 This is consistent with the decrease of the D-parameter (from 19 to 17, Fig. 6b), which we ascribe mostly to the formation of oxygen groups at edges or defects of the sp2 planes, resulting in sp3 carbon–oxygen bonds. The higher amount of oxygen is also observed in the increased σ(C–O) signal of the O 2s region in the valence band spectra (Fig. S13†).
The oxygen concentration on GF is rather low after immersion in the positive electrolyte (∼2 at%), while the oxidative polarization generates more oxygen moieties (∼7 at%), specifically carbonyl and carboxylic groups. An attack of basal planes is reflected by the decreased D-parameter (19 to 17 eV) and the disappearance of the peak corresponding to σ(C–C) bonding states (Fig. S13†). During immersion and polarization in both electrolytes, the I(D)/I(G) ratio of GF-980 remains almost unchanged (Fig. 6c), but a decrease of vacancies is observed by a change in the I(D)/I(D′) ratio (Fig. 6d). This shows that vacancies are more easily oxidized and consumed in contact with the electrolyte. However, the increase of the D to D′ ratio after polarization in VIVO2+ suggests that vacancies can also be deoxygenated electrochemically and therefore be available as active sites at an applied potential.
Less surface oxygen (∼2 at%) is formed on GF-SA-980, even after polarization, and there appears to be no recognizable preference for the formation of one specific type of OFG. This may seem surprising, given the significantly higher surface area of GF-SA. However, in contrast to GF less oxidation resistant carbon structures on the surface of GF-SA have already been removed due to the oxidative treatment of GF-SA prior to deoxygenation, which increases its stability towards reoxidation. Nevertheless, also for GF-SA an attack of basal planes by the negative polarization is witnessed by a decrease of the D-parameter from 21 to 18 eV. Considering the improved electrochemical performance of GF-SA-980, the higher concentration of oxygen on GF does not result in an increased activity in the negative half-cell. GF-SA-980 shows a significantly increased disorder which increases even further for the polarized electrode (from 2.57 to 2.82). Consequently, it can be concluded that the activity is more affected by the presence of structural defects acting as active sites rather than by OFGs. Many of these structural defects are linked to vacancies, as indicated by the high I(D)/I(D′) ratio of GF-SA-980 (Fig. 6d). Similar to GF, the density of vacancies at first decreases after immersion, indicating the reactivity with electrolyte species. In contrast to GF, negative polarization results in the activation of the electrode by inducing more vacancies than on GF-SA-980, showing that these previously occupied sites are not only freed but also additional point defects are created on the electrode. Hence, given that less noble carbon species at the surface have been removed, a low amount of OFGs is beneficial for application in the negative half-cell and polarization under operation further increases the number of favorable edge sites and vacancies.
Reoxidation of GF-SA-980 is stronger after immersion and polarization (∼8 at%) in the positive electrolyte. Again, a similar increase for all types of OFG can be observed. Since reoxidation occurs already mainly upon immersion into the positive electrolyte a participation of OFGs in the charge transfer reaction of the positive electrode cannot be fully ruled out. However, comparison with GF-980 which shows a further increase of OFGs due to polarization and an increase in RCT for cycled electrodes (Fig. 4f) while RCT for GF-SA-980 remains almost constant indicates that oxygen groups may not only not play the dominant electrocatalytic role but may even increase the charge transfer resistance.
By the evolution of the D-parameter for GF-SA-980 it is seen that a result of the immersion is the formation of OFGs at the basal plane (21 to 19 eV), which are then during polarization removed and form at the edge sites (19 to 20 eV). The restoration of sp2 carbon is also observed in the decreased I(D)/I(G) ratio after polarization (from 2.57 to 2.44). Similar to the negative half-cell, vacancies are oxidized during polarization, given by the evolution of the I(D)/I(D′) ratio (from 4.2 to 3.62 to 3.89).
Long-term half-cell cycling
Since immersion and polarization in the positive electrolyte leads to partial reoxidation of the surface, the effect of deoxygenation was studied during repetitive cycling to verify if it would get lost after several cycles. For this purpose, GF (initially ∼7 at% surface oxygen and a D to G ratio of 1.98) and GF-980 (<1 at%, I(D)/I(G) = 2.25) were cycled 100 times and ΔEp (Fig. 7a and b) as well as RCT were determined at the start and end of every 10th cycle (Fig. 7c). Subsequently, the electronic structure and microstructure were studied again by XPS and Raman spectroscopy (Fig. 7d and e).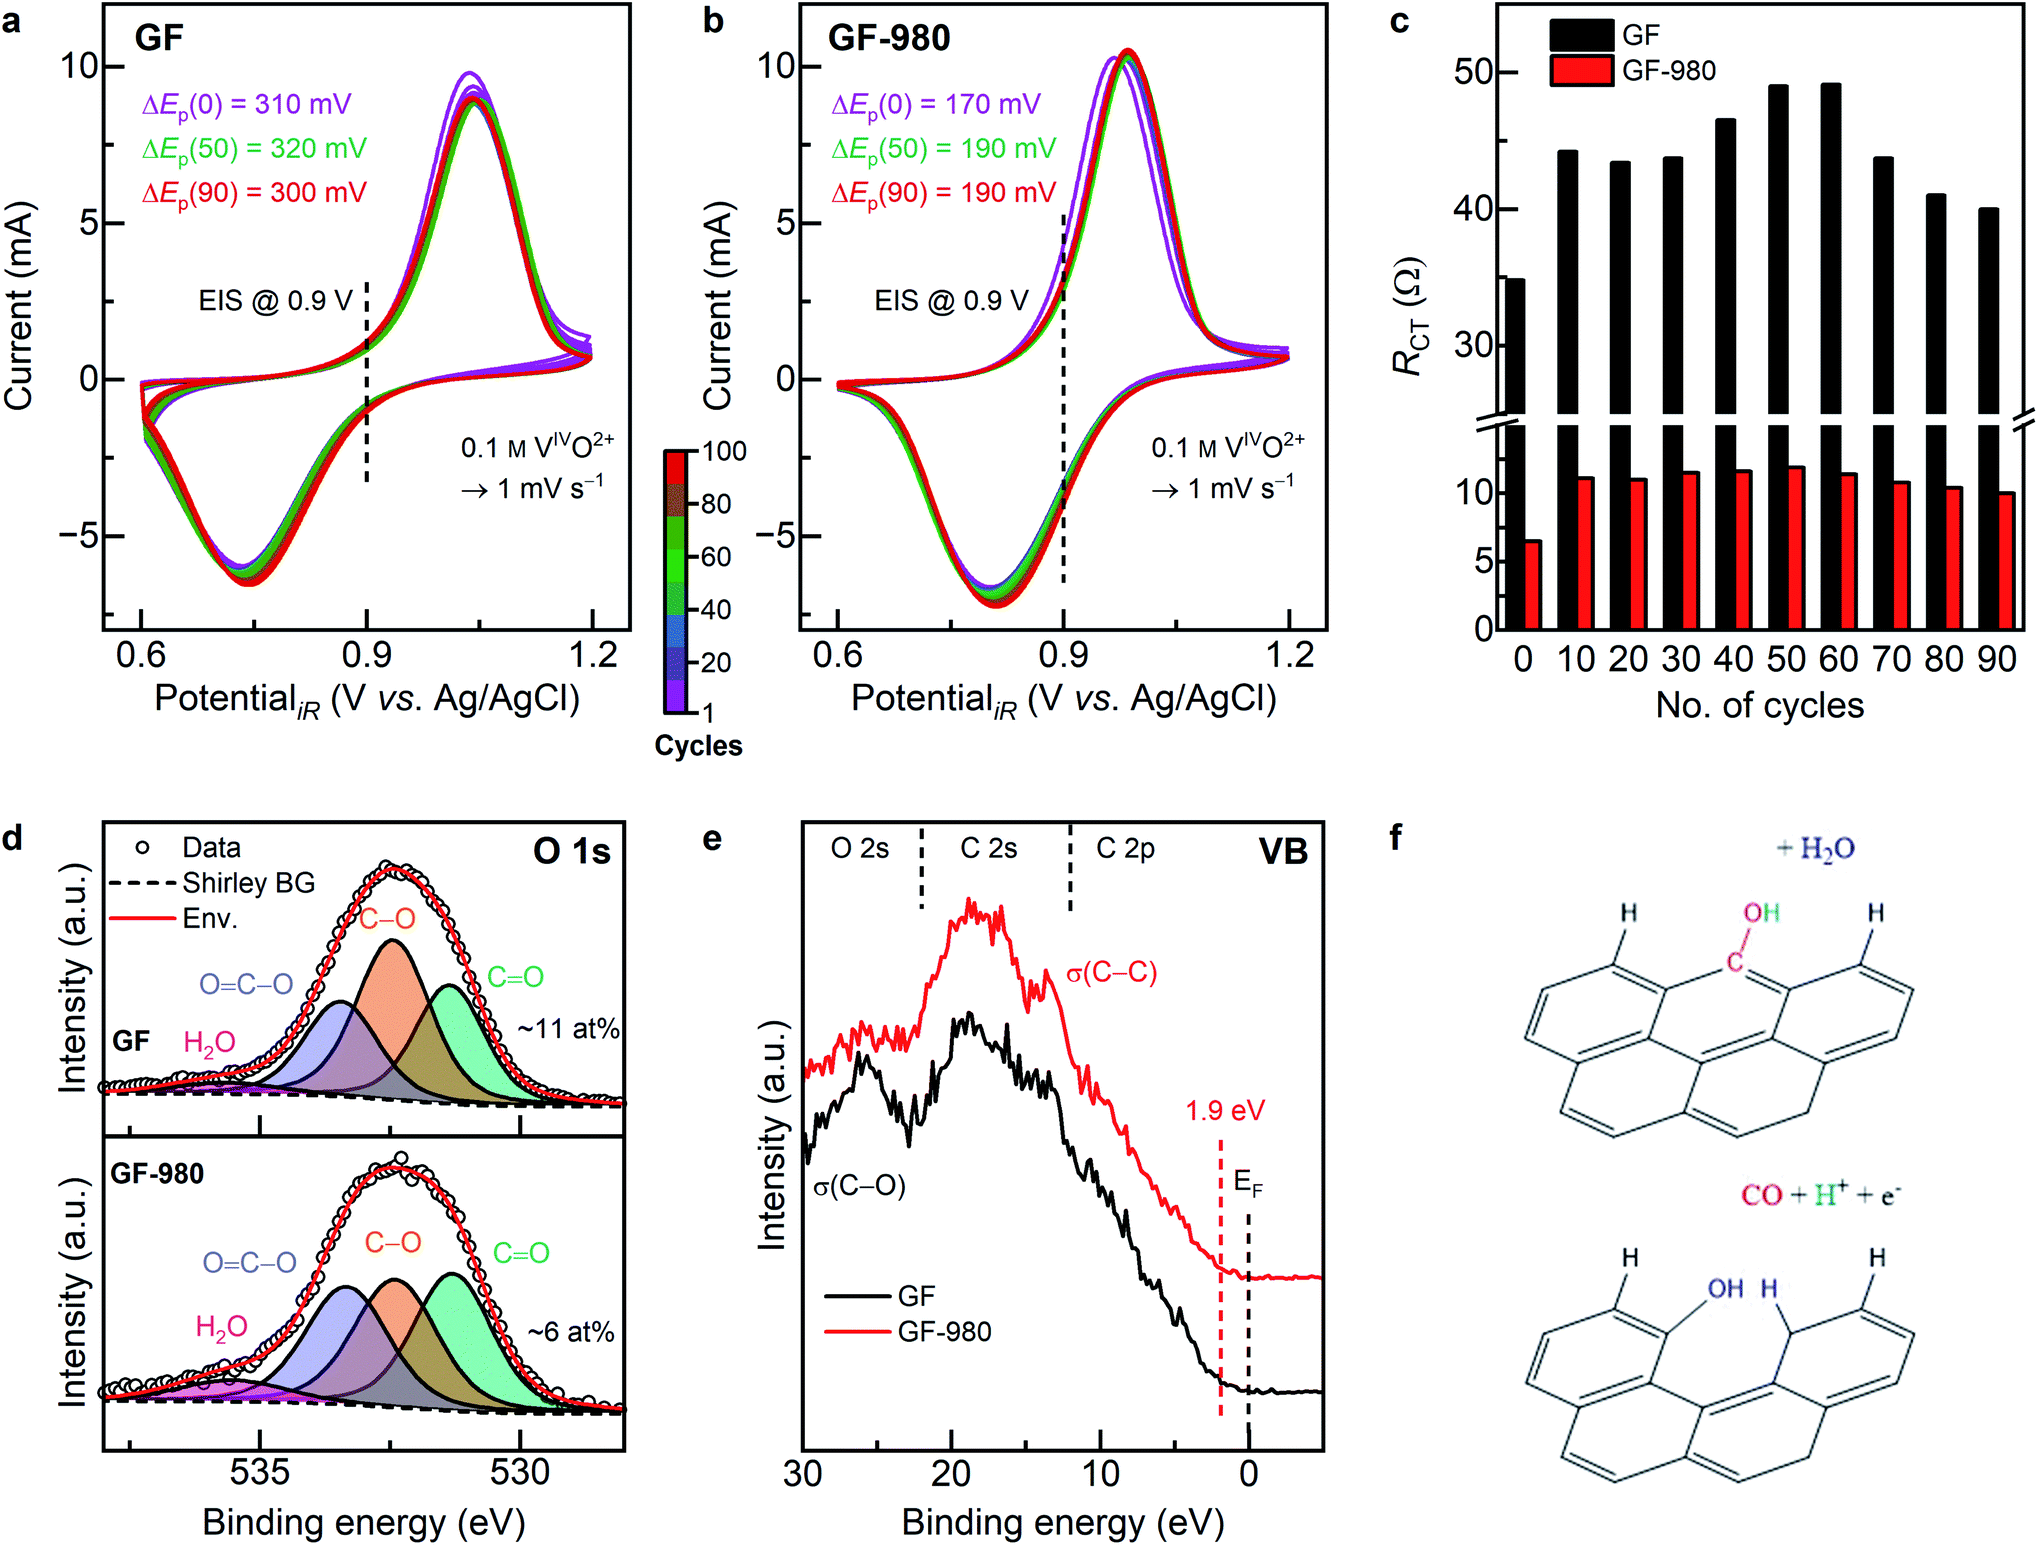 | ||
| Fig. 7 Long-term cycling performance and physicochemical investigation of pristine GF and thermally deoxygenated GF-980. Half-cell electrochemistry: (a and b) cyclic voltammetry curves of the positive half-cell, displaying the peak potential separation before and after 50 and 100 cycles. The color bar indicates the number of cycles in the pictures. (c) Evolution of the charge transfer resistance during cycling, measured initially and after each 10th cycle. Physicochemical characterization after 100 cycles: (d) deconvoluted X-ray photoelectron O 1s detail spectra and the respective relative oxygen content. (e) Valence band spectra, displaying the O 2s, C 2s, and C 2p regions and the valence band maximum. (f) Carbon corrosion mechanism on GF, as it is facilitated by the high concentration of hydroxyl groups, deduced by the higher degree of disorder (Fig. S16†) after long-term cycling. | ||
For pristine GF, ΔEp slightly increases over the first 50 cycles (from 310 to 320 mV) and decreases again thereafter (300 mV). GF-980 initially has a much lower ΔEp (170 mV), which also increases to around 50 cycles (190 mV) and remains constant thereafter. This trend is equally observed for GF and GF-980 by comparing their RCT values obtained from impedance spectroscopy, which shows an increase from 35 and 6.5 Ω before CV up to 49 and 12 Ω after 50–60 cycles, respectively, and a subsequent decrease at higher cycle numbers to 40 and 10 Ω. The electrochemical results prove that the previous deoxygenation has a positive effect on the long-term cycling performance. The increase of the values for the first 50 cycles is associated with the oxygen-enrichment of the electrode due to the oxidative electrolyte and potential. This condition of the electrode relates to the previous XPS results, which showed an increased oxygen concentration after polarization in the positive half-cell (Fig. 6a). After this saturation point, oxygen groups are removed due to the harsh environment, as it is seen by the studies after long-term cycling.
After performing 100 cycles, the oxygen concentration of GF is higher (∼11 at%) than of GF-980 (∼6 at%) (Fig. 7d and S14†). On GF-980 the different types of OFGs have similar concentrations, while OFGs on GF are dominated by hydroxyl groups (∼5 at%). Carboxylic groups and carbonyls are present to a lesser extent (∼3 at%). The deoxygenation procedure prevents the formation of basal plane oxygen species, as the physisorbed oxygen species readily desorb again on large sp2 sites with far away edges.34 Hydrogenated edge sites, as they are facilitated by the deoxygenation, are less prone to water adsorption.82,83
The oxygen content is further reflected in the O 2s region (Fig. 7e and S13†) by a less pronounced σ(C–O) signal and more distinct 2s σ(C–C) electrons on GF-980. A VBM of 1.9 eV signifies an increase of occupied states close to EF (compare Fig. 2d) due to increased electron transfer between layers of graphite, facilitated by intercalated electrolytic species such as water molecules, vanadium ions, or sulfuric acid.84,85 The more active GF-980 exposes a lower number of defects (I(D)/I(G) = 2.06) compared to the less active GF (2.21) (Fig. S16†). The origin of defects on both electrodes, which are mainly edge sites, is not affected by the electrochemical cycling. Combined with the higher hydroxyl concentration and the declining RCT, the increasing disorder is associated with incipient carbon corrosion (Fig. 7f), resulting in more active sites on the electrode. We conclude that the positive half-cell vanadium redox reaction relies on an oxygen-free, intact sp2 basal plane in combination with sufficient hydrogen-terminated defects as active sites. The prevention of oxygenation, equally on basal and edge sites, is beneficial for the electron transfer and the lifespan of the electrode.
Summary and conclusion
The influence of OFGs and surface defects on the electrochemical performance of graphite felt electrodes for the vanadium redox reactions was analyzed by a novel deoxygenation procedure. The removal of specific OFGs, subsequent defect healing, followed by creating disorder, especially, under the preservation of sp2 planes was confirmed by XPS and Raman spectroscopy. The oxygen-free electrodes, as opposed to the predominant opinion, had an overall better half-cell performance, as characterized by the peak potential separation and the charge transfer resistance, than the oxygen-rich starting material. At higher temperatures, the deoxygenation makes graphite felt more resilient against reoxidation and therefore also improves the long-term cycling performance. New active edge sites are induced, further enhancing the activity. The hindering effect of individual OFGs was further proven by modification of the sp2 plane of GF with pyrene derivatives. No additional activity enhancement was reached compared to pure pyrene. Instead, a poor performance especially for the additional hydroxyl group was observed. Additionally, no correlation between the concentration of oxygen in general of certain OFGs with the electrochemical performance could be established while instead the presence of certain carbon defects, as demonstrated by Raman analysis, correlates well with the observed electrochemical properties. Oxidation through the electrolyte is much more pronounced in the positive half-cell. During long-term cycling, it was shown that the benefit of the deoxygenation treatment is stable. It resulted in a lower degree of oxygenation, which guaranteed high activity and rapid charge transfer. A decreasing charge transfer resistance of oxygen-rich GF is associated with carbon corrosion, supported by the higher hydroxyl concentration, and thus the increasing number of edge sites.In summary, we disproved the previously ascribed electrocatalytic role of OFGs on graphite felt as driving force for the vanadium redox reactions. Therefore, we propose a new reaction mechanism for both half-cells (Fig. 8) that allows the redox reaction to occur at hydrogen-terminated edge sites rather than through the support of hydroxyl groups, as suggested by the previous mechanism (Fig. S17†). The activity and effective charge transfer are mainly determined by the number as well as stability of the (hydrogenated) graphitic edge sites and vacancies in combination with an oxygen-free and intact basal plane. It can be expected that our results are transferable to other systems since graphite-based electrodes are widely used in electrochemistry. Therefore, our results may initiate a renewed investigation of the charge transfer process for other fields as well.
 | ||
| Fig. 8 New reaction scheme for the half-cell reactions in a vanadium redox flow battery. (a) Illustration of the reactions in the negative and positive half-cell. (b) Three-step reaction mechanism in the negative half-cell: (1) ion exchange of hydrogen bound to an edge site of the electrode and a VIII ion from the electrolyte; (2) electron transfer from the electrode reduces the oxidation state of the vanadium ion; (3) a second ion exchange between vanadium and a proton from the electrolyte releases VII. (c) Four-step reaction mechanism in the positive half-cell: (1) ion exchange of hydrogen VIVO2+ ion from the electrolyte; (2) oxygen from the electrolyte is transferred to the positively charged vanadium ion; (3) an electron is transferred to the electrode under the release of a proton; (4) vanadium reacts with the free proton by an ion exchange and consequently VVO2+ is released. (d) Legend for the depiction in (b and c). | ||
Methods
Sample preparation
Sheets of polyacrylonitrile-based virgin (GF) and beforehand thermally activated (GF-SA) GFD 4.6 graphite felt (SGL Carbon, SIGRACELL battery electrodes) were cut out and cleaned by sonication in acetone and ultrapure water (18.2 MW cm−1) for 10 min each, followed by drying at 80 °C overnight. The felts were then heated in a gas tight sealed quartz glass tube with 5 °C h−1 to the desired temperature (500, 800, 900, and 980 °C) for 3 h under Ar/H2 atmosphere. The samples are consequently labelled with the corresponding deoxygenation temperature in addition to the kind of felt electrode. After thermal deoxygenation, the gas inlet and outlet of the glass tube were sealed to transfer the samples under inert atmosphere to an argon filled glove box. Therein, the felts were prepared for further examination. The use of the hydrogen saturation to prevent spontaneous re-oxygenation has been tested by performing XPS to the samples deoxygenated at 980 °C, after they were in contact with air for 5 min (Fig. S18†). Both kind of felt electrodes (GF-980 and GF-SA-980) show minor to no increase of surface oxygen species, which allows us to perform our experiments as described in the following.The pyrene modified electrodes have been prepared by a dipping procedure. The cleaned felts were immersed in a solution containing 5 mM of the corresponding pyrene derivative, pyrene (98%, Sigma-Aldrich), 1-hydroxypyrene (98%, Sigma-Aldrich), 1-pyrenecarboxylic acid (97%, Sigma-Aldrich) dissolved in dimethyl sulfoxide (99.7%, Sigma-Aldrich). After 24 h, the felts were thoroughly washed with Millipore water and dried at 80 °C.
Physicochemical characterization
The morphology of the samples was investigated by Scanning Electron Microscopy (SEM, Merlin, Carl Zeiss) with an acceleration voltage of 5–10 kV and a probe current of 150–500 pA.The specific surface area of the felts was measured by nitrogen physical adsorption isotherms (Gemini VII 2390, Micromeritics GmbH) and calculated according to the Brunauer–Emmett–Teller (BET) theory.
X-Ray photoelectron spectroscopy (XPS) has been established as a powerful tool to investigate OFGs on graphite-related material in a qualitatively and quantitatively manner. The electronic structure was analyzed by XPS, using a K-alpha+ spectrometer (Thermo Fisher Scientific) with monochromatic Al-Kα radiation (λ = 1486.6 eV) and a spot size of ∼400 μm. The felts were transferred under inert atmosphere to the analysis chamber to prevent thermal oxidation in air contact. Survey spectra were recorded with a pass energy of 200 eV, detail spectra with 50 eV. Two spots were measured on each sample to investigate the deviation of the results. The Avantage software (Thermo Fisher) was used for data acquisition and spectra deconvolution, using the implemented smart background function to apply a Shirley background correction. Single species were deconvoluted with Voigt profiles (30% Gaussian–Lorentzian peak shapes). The asymmetry of sp2 hybridized carbon was assessed with a tail mix of 90% and a tail exponent of 1. The position of the residual components in the C 1s region were restricted to the binding energy position of sp2 hybridized carbon, the FWHM values to the sp3 carbon signal with ±0.1 eV tolerance. The O 1s region was deconvoluted by multiple peaks with 1 ± 0.1 eV distance to each other, restricting the FWHM with ±0.1 eV for all oxygen groups but adsorbed water. All spectra were binding energy corrected and normalized to the most prominent signal of sp2 hybridized carbon at 284.2 eV. For the investigation of the D-parameter, the C KLL Auger region was scanned 100 times with a pass energy of 100 eV and a step size of 0.5 eV. The D-parameter can be determined by the binding energy distance between the maximum and minimum in the first-derivative plot of the obtained spectrum. The valence band region was studied with a pass energy of 50 eV at a step size of 0.2 eV. The valence band maximum was assessed by the intercept of two straight lines: one horizontal at the baseline, and one diagonal along the threshold-edge of the valence band spectra up to ∼10 eV. Both the Auger and the valence band region were normalized to the maximum signal to improve the comparison.
Raman spectroscopy on the other hand provides useful information on the degree of disorder and the type of graphitic edge defects of the felt material. The degree of disorder was investigated by Raman spectroscopy, using a LabRAM HR Evolution spectrometer (HORIBA scientific), equipped with a HeNe laser with a wavelength of 632.8 nm (Elaser = 1.9876 eV). To keep the chances of ambient and thermal oxygenation as minor as possible, the samples were directly transferred from an argon filled glove box to the Raman microscope and measured immediately. A 600 grooves mm−1 grating along with a 100× magnification objective has been used. On each sample, at least five spectra were taken on random positions to obtain a standard deviation value. By using a smaller magnifying lens, the deviation of the intensity ratios could be reduced. However, the signal intensity in general is lower and thus more difficult to analyze because thereby the part of light scattered from basal planes is increased while the resolution and intensity from edge sites is decreased. To prevent thermal oxygenation, the laser was kept at 10% of its potential power and the recording time was limited to 20 s per spectrum. The CasaXPS software package was used to subtract a cubic spline background and deconvolute the Raman spectra. Absolute Lorentzian peak shapes were used for the D and G band, and mixed Gaussian–Lorentzian for the residual vibrational features.
Electrochemical characterization
To study the electrochemical performance of the felt electrodes, cyclic voltammetry (CV) and electrochemical impedance spectroscopy (EIS) have been conducted in a custom built three-electrode cell connected to a potentiostat (SP-300, BioLogic). The graphite felt sample in contact with glassy carbon was used as working, a pristine graphite felt of at least five times the size as counter, and Ag/AgCl stored in 3 M KCl (EAg/AgCl = 0.210 V vs. RHE) as reference electrode. Prior to the electrochemical experiments, the samples were immersed in the corresponding electrolyte within under 1 min outside of the glove box to ensure thorough wetting while preventing atmospheric oxidation. At this point we want to mention that there was no problem with the hydrophilicity of the samples for all deoxygenated samples. Only GF floated on top of the electrolyte. To exclude a major influence of the wetting properties on the electrochemical performance, the samples were centrifuged for 5 min at 800 rpm. As positive electrolyte, 0.1 M VIVO2+ was prepared by dissolving VOSO4 powder (Alfa Aesar) in 2 M H2SO4 (Emsure). For the negative half-cell experiments, the positive electrolyte was cycled in a full cell to obtain 0.1 M VIII. The electrolyte filled cell has been bubbled with argon prior to, and the surface above the electrolyte during the experiments. An electrochemical surface conditioning step was performed to remove lose adsorbates of the felt surface by scanning 20 times either from 0 to −0.3 V (negative) or from 0–0.5 V vs. Ag/AgCl (positive half-cell) with 100 mV s−1. CV measurements have been conducted with a scan rate of 1 mV s−1, and the data has been iR corrected regarding the electrolyte resistance by EIS. Impedance spectra were recorded with a voltage amplitude of 10 mV at an applied potential of 0.9 V and −0.45 V vs. Ag/AgCl. The spectra were fitted with the RelaxIS 3 software (rhd instruments), using following equivalent circuit diagram: an inductance and the electrolyte resistance in series, followed by two resistance/constant phase elements in parallel, one for the glassy carbon/felt, and one for the felt/electrolyte interface, and in the end one constant phase element for the diffusion (which was not always necessary). At the second interface, the charge transfer resistance was assessed. Electrochemical double layer capacitance measurements were conducted in a non-faradaic potential range of 0.15–0.25 V vs. Ag/AgCl. The potential was kept at 0.2 V vs. Ag/AgCl for 2 min, before the potential window was scanned with scan rates of 10–250 mV s−1. The 5th cycle was then used to determine the current values at 0.2 V vs. Ag/AgCl, and to further assess the double layer capacitance. For the normalization of these values, we used the BET measurements of the felts, and the weight of the electrochemically tested sample.To evaluate the changes and development of the chemical surface composition, electronic structure and degree of disorder, graphite felts previously deoxygenated at 980 °C have been immersed and polarized in both used electrolytes. Therefore, the felt electrodes were transferred from the glove box to the respective electrolyte in under 1 min and kept there for 3 h to study the immersed felts. To investigate the electrochemical evolution of above-mentioned parameters, the felts were additionally polarized at −0.6 V vs. Ag/AgCl in VIII and at 1.2 V vs. Ag/AgCl in VIVO2+ for 1 h.
Conflicts of interest
There are no conflicts to declare.Acknowledgements
The financial support of the Federal Ministry of Education and Research (BMBF) within the project Flow3DKat (03EK3053C) is acknowledged. The authors gratefully acknowledge Margarete Offermann for performing the BET measurements.References
- Y. Lin, Q. Lu, F. Song, L. Yu, A. K. Mechler, R. Schlögl and S. Heumann, Angew. Chem., Int. Ed., 2019, 58, 8917–8921 Search PubMed.
- A. B. Soliman, H. S. Abdel-Samad, S. S. Abdel Rehim and H. H. Hassan, Sci. Rep., 2016, 6, 22056 Search PubMed.
- P. Simon and Y. Gogotsi, Nat. Mater., 2008, 7, 845–854 Search PubMed.
- H. R. Byon, B. M. Gallant, S. W. Lee and Y. Shao-Horn, Adv. Funct. Mater., 2013, 23, 1037–1045 Search PubMed.
- K. J. Kim, S.-W. Lee, T. Yim, J.-G. Kim, J. W. Choi, J. H. Kim, M.-S. Park and Y.-J. Kim, Sci. Rep., 2014, 4, 6906 Search PubMed.
- M. Rychcik and M. Skyllas-Kazacos, J. Power Sources, 1987, 19, 45–54 Search PubMed.
- M. Skyllas-Kazacos, J. Electrochem. Soc., 1986, 133, 1057 Search PubMed.
- B. Sun and M. Skyllas-Kazacos, Electrochim. Acta, 1992, 37, 2459–2465 Search PubMed.
- K. J. Kim, M.-S. Park, Y.-J. Kim, J. H. Kim, S. X. Dou and M. Skyllas-Kazacos, J. Mater. Chem. A, 2015, 3, 16913–16933 Search PubMed.
- Y. Wu and R. Holze, Batteries, 2018, 4, 47 Search PubMed.
- J. Maruyama, T. Hasegawa, S. Iwasaki, T. Fukuhara and M. Nogami, J. Electrochem. Soc., 2013, 160, A1293–A1298 Search PubMed.
- K. Amini, J. Gostick and M. D. Pritzker, Adv. Funct. Mater., 2020, 30, 1910564 Search PubMed.
- B. Sun and M. Skyllas-Kazacos, Electrochim. Acta, 1992, 37, 1253–1260 Search PubMed.
- W. Li, J. Liu and C. Yan, Carbon, 2013, 55, 313–320 Search PubMed.
- S. Zhong, C. Padeste, M. Kazacos and M. Skyllas-Kazacos, J. Power Sources, 1993, 45, 29–41 Search PubMed.
- Y. Li, J. Parrondo, S. Sankarasubramanian and V. Ramani, J. Phys. Chem. C, 2019, 123, 6370–6378 Search PubMed.
- A. M. Pezeshki, J. T. Clement, G. M. Veith, T. A. Zawodzinski and M. M. Mench, J. Power Sources, 2015, 294, 333–338 Search PubMed.
- W. Zhang, J. Xi, Z. Li, H. Zhou, L. Liu, Z. Wu and X. Qiu, Electrochim. Acta, 2013, 89, 429–435 Search PubMed.
- L. Yue, W. Li, F. Sun, L. Zhao and L. Xing, Carbon, 2010, 48, 3079–3090 Search PubMed.
- Z. Zhang, J. Xi, H. Zhou and X. Qiu, Electrochim. Acta, 2016, 218, 15–23 Search PubMed.
- Z. He, Y. Jiang, W. Meng, F. Jiang, H. Zhou, Y. Li, J. Zhu, L. Wang and L. Dai, Appl. Surf. Sci., 2017, 423, 111–118 Search PubMed.
- L. Estevez, D. Reed, Z. Nie, A. M. Schwarz, M. I. Nandasiri, J. P. Kizewski, W. Wang, E. Thomsen, J. Liu, J.-G. Zhang, V. Sprenkle and B. Li, ChemSusChem, 2016, 9, 1455–1461 Search PubMed.
- J. Noack, N. Roznyatovskaya, J. Kunzendorf, M. Skyllas-Kazacos, C. Menictas and J. Tübke, J. Energy Chem., 2018, 27, 1341–1352 Search PubMed.
- H. Fink, J. Friedl and U. Stimming, J. Phys. Chem. C, 2016, 120, 15893–15901 Search PubMed.
- J. Friedl and U. Stimming, Electrochim. Acta, 2017, 227, 235–245 Search PubMed.
- M. V. Holland-Cunz, J. Friedl and U. Stimming, J. Electroanal. Chem., 2018, 819, 306–311 Search PubMed.
- S. Rümmler, M. Steimecke, S. Schimpf, M. Hartmann, S. Förster and M. Bron, J. Electrochem. Soc., 2018, 165, A2510–A2518 Search PubMed.
- C. Choi, H. Noh, S. Kim, R. Kim, J. Lee, J. Heo and H.-T. Kim, J. Energy Storage, 2019, 21, 321–327 Search PubMed.
- R. Schweiss, C. Meiser and F. W. T. Goh, ChemElectroChem, 2017, 4, 1969–1974 Search PubMed.
- P. Mazúr, J. Mrlík, J. Beneš, J. Pocedič, J. Vrána, J. Dundálek and J. Kosek, J. Power Sources, 2018, 380, 105–114 Search PubMed.
- G. Zhang, A. S. Cuharuc, A. G. Güell and P. R. Unwin, Phys. Chem. Chem. Phys., 2015, 17, 11827–11838 Search PubMed.
- N. Pour, D. G. Kwabi, T. Carney, R. M. Darling, M. L. Perry and Y. Shao-Horn, J. Phys. Chem. C, 2015, 119, 5311–5318 Search PubMed.
- M. Park, I.-Y. Jeon, J. Ryu, J.-B. Baek and J. Cho, Adv. Energy Mater., 2015, 5, 1401550 Search PubMed.
- Z. Jiang, K. Klyukin and V. Alexandrov, Phys. Chem. Chem. Phys., 2017, 19, 14897–14901 Search PubMed.
- Z. Jiang, K. Klyukin and V. Alexandrov, ACS Appl. Mater. Interfaces, 2018, 10, 20621–20626 Search PubMed.
- S. M. Taylor, A. Pătru, D. Perego, E. Fabbri and T. J. Schmidt, ACS Appl. Energy Mater., 2018, 1, 1166–1174 Search PubMed.
- H. Radinger, J. Pfisterer, F. Scheiba and H. Ehrenberg, ChemElectroChem, 2020, 7(23), 4745–4754 Search PubMed.
- J. Collins, G. Gourdin, M. Foster and D. Qu, Carbon, 2015, 92, 193–244 Search PubMed.
- L. Zhang, Q. Xu, J. Niu and Z. Xia, Phys. Chem. Chem. Phys., 2015, 17, 16733–16743 Search PubMed.
- A. Ganguly, S. Sharma, P. Papakonstantinou and J. Hamilton, J. Phys. Chem. C, 2011, 115, 17009–17019 Search PubMed.
- H. R. Thomas, S. P. Day, W. E. Woodruff, C. Vallés, R. J. Young, I. A. Kinloch, G. W. Morley, J. V. Hanna, N. R. Wilson and J. P. Rourke, Chem. Mater., 2013, 25, 3580–3588 Search PubMed.
- H. P. Mungse, O. P. Sharma, H. Sugimura and O. P. Khatri, RSC Adv., 2014, 4, 22589 Search PubMed.
- A. Mezzi and S. Kaciulis, Surf. Interface Anal., 2010, 42, 1082–1084 Search PubMed.
- S. Kaciulis, A. Mezzi, P. Calvani and D. M. Trucchi, Surf. Interface Anal., 2014, 46, 966–969 Search PubMed.
- A. J. Barlow, S. Popescu, K. Artyushkova, O. Scott, N. Sano, J. Hedley and P. J. Cumpson, Carbon, 2016, 107, 190–197 Search PubMed.
- C.-J. Kim, W. Khan and S.-Y. Park, Chem. Phys. Lett., 2011, 511, 110–115 Search PubMed.
- O. Akhavan, Carbon, 2010, 48, 509–519 Search PubMed.
- C.-H. Chuang, S. C. Ray, D. Mazumder, S. Sharma, A. Ganguly, P. Papakonstantinou, J.-W. Chiou, H.-M. Tsai, H.-W. Shiu, C.-H. Chen, H.-J. Lin, J. Guo and W.-F. Pong, Sci. Rep., 2017, 7, 42235 Search PubMed.
- L. Tang, X. Li, R. Ji, K. S. Teng, G. Tai, J. Ye, C. Wei and S. P. Lau, J. Mater. Chem., 2012, 22, 5676 Search PubMed.
- C. Hontoria-Lucas, A. J. López-Peinado, J. D. López-González, M. L. Rojas-Cervantes and R. M. Martín-Aranda, Carbon, 1995, 33, 1585–1592 Search PubMed.
- C. Mattevi, G. Eda, S. Agnoli, S. Miller, K. A. Mkhoyan, O. Celik, D. Mastrogiovanni, G. Granozzi, E. Garfunkel and M. Chhowalla, Adv. Funct. Mater., 2009, 19, 2577–2583 Search PubMed.
- D. W. Boukhvalov and M. I. Katsnelson, J. Am. Chem. Soc., 2008, 130, 10697–10701 Search PubMed.
- A. Bagri, C. Mattevi, M. Acik, Y. J. Chabal, M. Chhowalla and V. B. Shenoy, Nat. Chem., 2010, 2, 581–587 Search PubMed.
- L. Chen, Z. Xu, J. Li, B. Zhou, M. Shan, Y. Li, L. Liu, B. Li and J. Niu, RSC Adv., 2014, 4, 1025–1031 Search PubMed.
- S. Park, K.-S. Lee, G. Bozoklu, W. Cai, S. T. Nguyen and R. S. Ruoff, ACS Nano, 2008, 2, 572–578 Search PubMed.
- M. Jin, T. H. Kim, S. C. Lim, D. L. Duong, H. J. Shin, Y. W. Jo, H. K. Jeong, J. Chang, S. Xie and Y. H. Lee, Adv. Funct. Mater., 2011, 21, 3496–3501 Search PubMed.
- F. R. McFeely, S. P. Kowalczyk, L. Ley, R. G. Cavell, R. A. Pollak and D. A. Shirley, Phys. Rev. B, 1974, 9, 5268–5278 Search PubMed.
- M. K. Rabchinskii, S. A. Ryzhkov, D. A. Kirilenko, N. V. Ulin, M. V. Baidakova, V. V. Shnitov, S. I. Pavlov, R. G. Chumakov, D. Y. Stolyarova, N. A. Besedina, A. V. Shvidchenko, D. V. Potorochin, F. Roth, D. A. Smirnov, M. V. Gudkov, M. Brzhezinskaya, O. I. Lebedev, V. P. Melnikov and P. N. Brunkov, Sci. Rep., 2020, 10, 6902 Search PubMed.
- K. Endo, S. Koizumi, T. Otsuka, T. Ida, T. Morohashi, J. Onoe, A. Nakao, E. Z. Kurmaev, A. Moewes and D. P. Chong, J. Phys. Chem. A, 2003, 107, 9403–9408 Search PubMed.
- H. K. Jeong, C. Yang, B. S. Kim and K. Kim, EPL, 2010, 92, 37005 Search PubMed.
- M. S. Dresselhaus, A. Jorio, A. G. Souza Filho and R. Saito, Philos. Trans. R. Soc., A, 2010, 368, 5355–5377 Search PubMed.
- M. A. Pimenta, G. Dresselhaus, M. S. Dresselhaus, L. G. Cançado, A. Jorio and R. Saito, Phys. Chem. Chem. Phys., 2007, 9, 1276–1291 Search PubMed.
- A. Eckmann, A. Felten, A. Mishchenko, L. Britnell, R. Krupke, K. S. Novoselov and C. Casiraghi, Nano Lett., 2012, 12, 3925–3930 Search PubMed.
- P. Puech, M. Kandara, G. Paredes, L. Moulin, E. Weiss-Hortala, A. Kundu, N. Ratel-Ramond, J. M. Plewa, R. Pellenq and M. Monthioux, C, 2019, 5, 69 Search PubMed.
- M. S. Dresselhaus, A. Jorio and R. Saito, Annu. Rev. Condens. Matter Phys., 2010, 1, 89–108 Search PubMed.
- L. G. Cançado, A. Jorio, E. H. M. Ferreira, F. Stavale, C. A. Achete, R. B. Capaz, M. V. O. Moutinho, A. Lombardo, T. S. Kulmala and A. C. Ferrari, Nano Lett., 2011, 11, 3190–3196 Search PubMed.
- F. Tuinstra and J. L. Koenig, J. Chem. Phys., 1970, 53, 1126–1130 Search PubMed.
- R. P. Vidano, D. B. Fischbach, L. J. Willis and T. M. Loehr, Solid State Commun., 1981, 39, 341–344 Search PubMed.
- S. Stankovich, D. A. Dikin, R. D. Piner, K. A. Kohlhaas, A. Kleinhammes, Y. Jia, Y. Wu, S. T. Nguyen and R. S. Ruoff, Carbon, 2007, 45, 1558–1565 Search PubMed.
- Z. Fan, K. Wang, T. Wei, J. Yan, L. Song and B. Shao, Carbon, 2010, 48, 1686–1689 Search PubMed.
- D. Tashima, E. Yamamoto, N. Kai, D. Fujikawa, G. Sakai, M. Otsubo and T. Kijima, Carbon, 2011, 49, 4848–4857 Search PubMed.
- X. You, M. Misra, S. Gregori and A. K. Mohanty, ACS Sustainable Chem. Eng., 2018, 6, 318–324 Search PubMed.
- Y.-T. Kim, Y. Ito, K. Tadai, T. Mitani, U.-S. Kim, H.-S. Kim and B.-W. Cho, Appl. Phys. Lett., 2005, 87, 234106 Search PubMed.
- M. J. Bleda-Martínez, J. A. Maciá-Agulló, D. Lozano-Castelló, E. Morallón, D. Cazorla-Amorós and A. Linares-Solano, Carbon, 2005, 43, 2677–2684 Search PubMed.
- R. J. Rice and R. L. McCreery, Anal. Chem., 1989, 61, 1637–1641 Search PubMed.
- A. Peigney, C. Laurent, E. Flahaut, R. R. Bacsa and A. Rousset, Carbon, 2001, 39, 507–514 Search PubMed.
- Z. Li, H. Peng, R. Liu, Y. Mo, B. Cao, W. Lai, X. Li, L. Pan and Y. Chen, J. Power Sources, 2020, 457, 228022 Search PubMed.
- Y. Zhang, C. Liu, W. Shi, Z. Wang, L. Dai and X. Zhang, Langmuir, 2007, 23, 7911–7915 Search PubMed.
- S. Ghosh, X. An, R. Shah, D. Rawat, B. Dave, S. Kar and S. Talapatra, J. Phys. Chem. C, 2012, 116, 20688–20693 Search PubMed.
- Z. Yang, S. Bhowmick, F. G. Sen, A. Banerji and A. T. Alpas, Sci. Rep., 2018, 8, 121 Search PubMed.
- L. Jiang, J. Wang, P. Liu, W. Song and B. He, RSC Adv., 2018, 8, 11216–11221 Search PubMed.
- P. Restuccia, M. Ferrario and M. C. Righi, Carbon, 2020, 156, 93–103 Search PubMed.
- G. Levita, P. Restuccia and M. C. Righi, Carbon, 2016, 107, 878–884 Search PubMed.
- S. Seiler, C. E. Halbig, F. Grote, P. Rietsch, F. Börrnert, U. Kaiser, B. Meyer and S. Eigler, Nat. Commun., 2018, 9, 836 Search PubMed.
- S. Wang, C. Wang and X. Ji, RSC Adv., 2017, 7, 52252–52260 Search PubMed.
Footnote |
| † Electronic supplementary information (ESI) available. See DOI: 10.1039/d1ta04316a |
| This journal is © The Royal Society of Chemistry 2021 |