
 Open Access Article
 This Open Access Article is licensed under a
 Creative Commons Attribution 3.0 Unported Licence
Electrical transport in a molten-solid V2O5–ZrV2O7 composite
Linn Katinka
Emhjellen
 *,
Ragnar
Strandbakke
and
Reidar
Haugsrud
*
*,
Ragnar
Strandbakke
and
Reidar
Haugsrud
*
Department of Chemistry, Centre for Materials Science and Nanotechnology, University of Oslo, FERMiO, Gaustadalléen 21, NO-0349 Oslo, Norway. E-mail: l.k.emhjellen@smn.uio.no; reidar.haugsrud@kjemi.uio.no
First published on 16th August 2021
Abstract
Molten-solid composite oxides are candidates as oxygen transport membranes (OTMs) at intermediate temperatures (500–700 °C). Effects of the constituent phases and interphases on surface reactions and transport processes in these composites are elusive. Here we contribute fundamental insight to such materials systems, applying electrochemical impedance spectroscopy (EIS) and electromotive force (emf) measurements to investigate the electrical conductivity characteristics of a 30 mol% V2O5–ZrV2O7 composite with a eutectic melting point at ∼670 °C. When V2O5 melts and increases the V2O5 volume percolation, the electrical conductivity increases by a factor of 10 and the activation energy increases from 0.21 to ∼0.7 eV. The oxygen red-ox reaction at the surface changes from being rate limited by charge transfer processes to mass transfer processes as a consequence of fast oxygen exchange in molten V2O5 as compared to the all-solid composite. These effects coincide with the ionic transport number rising from essentially zero to ∼0.4, reflecting a significant increase in the relative oxide ion conductivity. Oxygen permeation across a 30 mol% V2O5–ZrV2O7 membrane was estimated to be in the same order as for several dual-phase membranes, but one magnitude lower than for single-phase mixed conducting membranes at intermediate temperatures.
1. Introduction
Molten oxides immersed in porous ceramics are potential candidates as oxygen transport membranes (OTMs) at intermediate temperatures (500–700 °C),1,2 but the development is still at an early stage. To increase the fundamental understanding of the mechanisms governing surface kinetics and transport in molten-solid OTMs, we study the electrical conductivity, ionic transport number and electrode impedance in a molten-solid V2O5–ZrV2O7 composite system.Technologies utilizing OTMs have the potential to reduce operating costs of oxygen production.3 To deliver sufficient oxygen fluxes most OTMs based on both single-phase and composite (cer–cer) oxides require operating temperatures above 800 °C. High operating temperatures impose challenges with respect to energy efficiency and material degradation, and OTMs working at intermediate temperatures are consequently pursued.4 Generally, it has proved difficult to find solid oxides with sufficiently low activation energies for the oxide ion conductivity to serve as membranes at intermediate temperatures.5,6 In this respect, dual-phase materials where one of the phases is molten have recently shown accelerated transport of oxide ions in the molten phase at intermediate temperatures due to relatively low energy barriers for migration.1,7,8
Interfacial effects influence the performance and stability of such dual-phase membranes. Undesired reactions or segregations at the interface of the composite may influence electrical transport, but also the inherent properties of the interface between the solid and liquid may be important to the transport properties.9,10 Complete wetting and good chemical compatibility between the two phases in a molten-solid OTM is generally ensured when the liquid exists in chemical equilibrium with the solid.
Vanadates are potential candidates for molten-solid OTMs owing to their low melting points and corrosive properties, revealing potentially fast oxide ion transport.11–13 V2O5 melts at 690 °C.14 Both solid and liquid V2O5 are predominantly n-type conductors, with small polaron hopping between V4+ and V5+ ions as the dominant conduction mechanism.15,16 The electronic conductivity is preserved upon melting due to short-range order in liquid V2O5.15,16 However, the magnitude of the ionic conductivity in liquid V2O5 has, as known to us, not yet been reported.
Kulbakin et al.1 measured the oxygen flux of molten-solid V2O5–ZrV2O7 composites (25–40 mol% V2O5) in air/He gradients, and found that a 2 mm thick 40 mol% V2O5–ZrV2O7 membrane displayed an oxygen permeability of 1.1 × 10⁻⁸ mol cm−2 s−1 at 740 °C. The flux was rate-limited by the ambipolar electron-oxide ion conductivity.1,17
ZrV2O7 forms at a 1![[thin space (1/6-em)]](https://www.rsc.org/images/entities/char_2009.gif) :1 molar ratio between V2O5 and ZrO2, and melts at 747 °C.14,18 A small deviation in the cation ratio yields V-rich or Zr-rich ZrV2O7 phases, together with segregation of V2O5 or ZrO2, respectively. A V2O5–ZrV2O7 composite with a eutectic melting point at 670 °C forms with further excess of V2O5 (≤55 mol% excess). In this work, a composition of 30 mol% V2O5 (20 vol%) was chosen to ensure percolation of V2O5 in the composite above the eutectic melting point while minimizing risks with respect to membrane degradation.
:1 molar ratio between V2O5 and ZrO2, and melts at 747 °C.14,18 A small deviation in the cation ratio yields V-rich or Zr-rich ZrV2O7 phases, together with segregation of V2O5 or ZrO2, respectively. A V2O5–ZrV2O7 composite with a eutectic melting point at 670 °C forms with further excess of V2O5 (≤55 mol% excess). In this work, a composition of 30 mol% V2O5 (20 vol%) was chosen to ensure percolation of V2O5 in the composite above the eutectic melting point while minimizing risks with respect to membrane degradation.
Despite exhibiting decent oxygen permeability, the processes governing surface kinetics and electrical transport in molten-solid OTMs, including V2O5–ZrV2O7 composites, are not clear. On these bases, we investigate a 30 mol% V2O5–ZrV2O7 composite by means of electrochemical impedance spectroscopy (EIS) and electromotive force (emf) measurements. Moreover, we briefly study the electrical properties of the constituent phases in the composite. Besides, as the eutectic phase in V2O5–ZrV2O7 is comparable to V2O5 or V2O5 containing minor amounts of dissolved ZrO2, electrical characterization of 2 mol% Zr-doped V2O5 is included as part of the study.
2. Experimental
2.1 Synthesis and characterization
30 mol% (20 vol%) V2O5–ZrV2O7 composites and V-rich ZrV2O7 (2 mol% excess to control the cation stoichiometry, nominal composition: Zr0.98V2.02O7), from now on denoted as ZrV2O7, were synthesized by the conventional sol–gel method. Precursor solutions of vanadium and zirconium ions were prepared from NH4VO3 (≤99%, Sigma Aldrich) and ZrO(NO3)2·6H2O (99%, Sigma Aldrich). Citric acid (≤99%, Alfa Aesar) was added at a molar ratio corresponding to 1:1 with the sum of Zr and V ions. Ammonia (28% solution, Alfa Aesar) was added to maintain the pH in the solution around 6–7. The char resulting from the gelation, combustion and drying steps was calcined at 520 °C for 5 h. The powders were uniaxially pressed (isobaric) to disks of diameter 20 mm. The 30 mol% V2O5–ZrV2O7 composites were sintered at 620 °C for 48 h, yielding relative densities of 84–89%. The densest of these samples (relative density of 87–89%) were used in electromotive force (emf) measurements. ZrV2O7 disks were sintered at 700 °C for 48 h, resulting in a relative density of 83%.
V2O5 (≤99.6%, Sigma Aldrich) was used as nominally pure V2O5. Zr-doped V2O5 (2 mol% ZrO2, 99%, Sigma Aldrich) was synthesized by a conventional solid-state reaction. Nominally pure and Zr-doped V2O5 disks were sintered at 620 °C for 10 h yielding relative densities of 68 and 64%, respectively.
The phase composition and crystal structure of all materials were investigated by X-ray diffraction (XRD) on a Bruker AXS D8 Discover with Cu Kα1 radiation (λ = 1.5406 Å). The microstructure and porosity of the surfaces and cross-sections of the sintered disks were analysed by means of scanning electron microscopy (SEM, FEI Quanta 200 FEG-ESEM). Prior to SEM analysis, cross-sections were polished down to 1 μm roughness using SiC paper.
2.2 Electrical characterization
Electrical characterization was carried out on disks mounted in a ProboStat™ measurement cell (NORECS AS, Norway). The gas composition in the cell was controlled using an in-house built gas mixer.19 2-electrode-4-wire configurations were used for ZrV2O7 and V2O5–ZrV2O7. Porous Au electrodes were painted on both sides of the disks (Au paste M-0034, Metalor Technologies SA, Switzerland) and Pt mesh was applied for current collection. For nominal and Zr-doped V2O5, a van der Pauw assembly with Pt point electrodes was employed.A Keysight 34970A multichannel multimeter and a Keysight E3642A DC power supply were used to measure the electrical conductivity of V2O5 and Zr-doped V2O5. The measurements were done in dry air from 200 to 600 °C for V2O5 and 300 to 600 °C for Zr-doped V2O5.
The electrical conductivity and electrode impedance of ZrV2O7 and V2O5–ZrV2O7 were characterized using a Novocontrol Alpha A impedance spectrometer coupled with a POTGAL interface (Novocontrol Technologies, Germany). Impedance sweeps (1 MHz to 0.01 Hz, 50 mV rms) were collected after equilibration in dry air from 250 to 720 °C for ZrV2O7, and from 400 to 600 °C for V2O5–ZrV2O7.
Impedance spectra were deconvoluted using the ZView software (SAI) and fitted to an equivalent circuit, as exemplified in Fig. 1.
 | ||
| Fig. 1 Deconvolution model for V2O5–ZrV2O7. The circuit consists of an inductive element, L, resistors, R1 and R2, and constant phase elements, Q1 and Q2. | ||
2.3 Ionic transport number
The ionic transport number, ti, was determined by means of electromotive force (emf) measurements. V2O5–ZrV2O7 samples were polished down to 5 μm roughness using SiC paper before applying Au electrodes. The disks were sealed to an alumina support tube using an alumina-based paste (Ceramabond 571, Aremco Products Inc., USA) to form two separate compartments (the inner and outer gas chambers, respectively). A spring-loaded alumina plate pressed the disk against the support tube to promote sealing. The inner and outer compartment gases were directed onto the inner and outer electrodes with the help of ceramic tubes. The assembly including sealant was dried at room temperature for 2 hours and subsequently cured at 93 °C for 2 hours. Prior to the measurements, the gas tightness of the ceramic seal was checked qualitatively. As it is challenging to reach a completely gastight sealing at low temperatures, high gas flow rates were applied towards both sample electrodes to minimize the effects of leakages. The emf resulting from gradients in oxygen partial pressure across the sample was measured with a Gamry reference 3000 potentiostat. O2 (AGA 99.5%) was diluted with Ar (AGA, 99.999%) to vary the oxygen gradient. Measurements were conducted as a function of temperature and pO2 gradient. For measurements in the temperature range 580–690 °C, the pO2 gradient was kept constant. Isothermal measurements were conducted at 680 °C under different gradients in
  . To correct for voltages arising from small gradients in temperature across the cell, the emf was recorded in forward and reversed pO2 gradients, and the two subtracted and the result halved.
3. Results
No secondary phases were observed from XRD analysis of sintered disks of ZrV2O7, V2O5 and Zr-doped V2O5. The XRD pattern of 30 mol% V2O5–ZrV2O7 sintered at 620 °C for 48 h is presented in Fig. 2. All diffraction peaks could be assigned to either ZrV2O7 (Pa![[3 with combining macron]](https://www.rsc.org/images/entities/char_0033_0304.gif) space group) or V2O5 (Pmmn space group). The SEM images in Fig. 3 show an even distribution of V2O5 and ZrV2O7.
space group) or V2O5 (Pmmn space group). The SEM images in Fig. 3 show an even distribution of V2O5 and ZrV2O7.
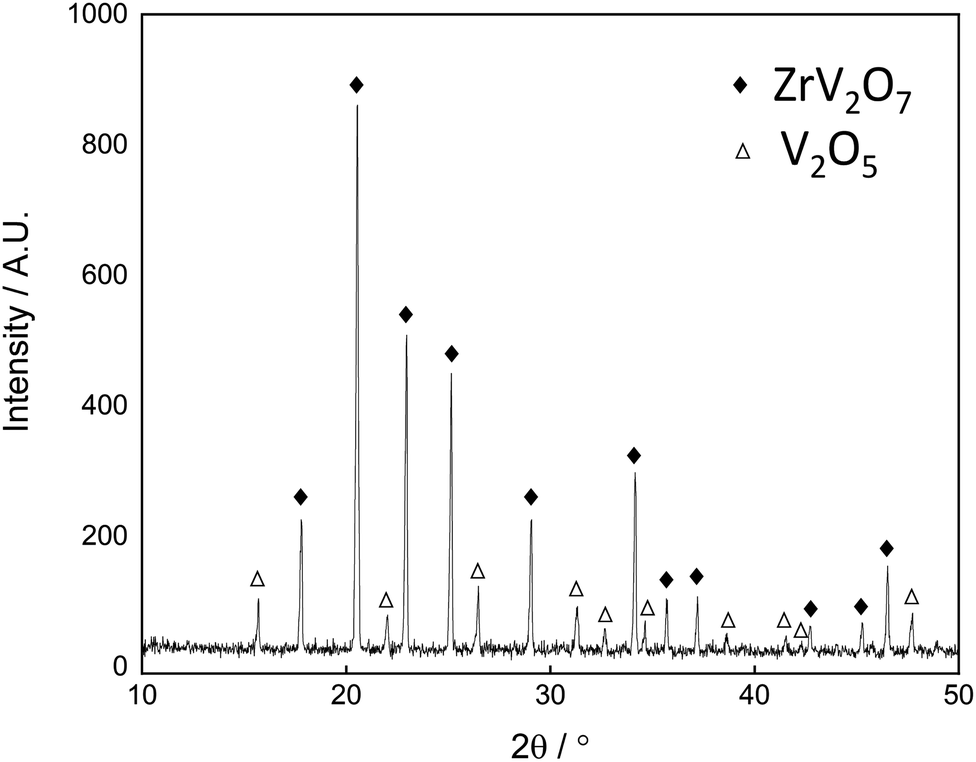 | ||
| Fig. 2 XRD pattern of as-synthesized 30 mol% V2O5–ZrV2O7. | ||
 | ||
| Fig. 3 SEM-micrographs of (a) surface and (b) cross-section view of 30 mol% V2O5–ZrV2O7. The brighter and darker phases correspond to ZrV2O7 and V2O5, respectively. | ||
Fig. 4 shows the electrical conductivity of ZrV2O7, V2O5–ZrV2O7, V2O5 and Zr-doped V2O5vs. inverse temperature in air. Literature data from liquid V2O5 in air or oxygen are included for comparison. The activation energy derived from the slope of logσT vs. 1/T plot for solid V2O5 of 0.20 eV is consistent with literature values.16 Zr-doped V2O5 displays lower conductivity and higher activation energy (0.31 eV) than the nominally pure material. Up to 540 °C the electrical conductivity of ZrV2O7 is approximately three orders of magnitude lower than for V2O5, and with an activation energy of 0.30 eV, in agreement with the work of Yuan et al.20 Above 540 °C, the conductivity increases gradually, followed by a discontinuity of a factor of 2 at ∼630–640 °C. The conductivity at 640–720 °C follows an Arrhenius-type behaviour with an activation energy of 0.71 eV.
 | ||
| Fig. 4 Electrical conductivity of nominally pure and 2 mol% Zr-doped V2O5, ZrV2O7 and 30 mol% V2O5–ZrV2O7vs. 1/T in air (0.21 atm O2). The electrical conductivity of liquid V2O5 in air16 and 1 atm O215 is included. | ||
For the composite, the conductivity of solid V2O5–ZrV2O7 falls between the two constituent phases, with an activation energy of 0.21 eV. Approaching the phase transition, the conductivity increases significantly, reaching values corresponding to molten V2O5. Also, the activation energy for the electrical conductivity of molten-solid V2O5–ZrV2O7 at 670–690 °C resembles literature values for liquid V2O5 (0.63 eV in air16 and 0.73 eV in O215).
Fig. 5 shows ti as a function of temperature in a fixed pO2 gradient. ti is close to zero below 640 °C, implying only minor contribution of ionic conductivity in the composite below the eutectic melting point. Above 640 °C, ti increases abruptly before stabilizing at ∼0.4 above 660 °C when the eutectic phase is entirely liquefied. Moreover, isothermal emf measurements at 680 °C under different gradients in pO2 showed insignificant changes in ti. From the measured ti of ∼0.4 and the total conductivity, the ionic conductivity was calculated to be in the order of 0.01 S cm−1 at 670–690 °C.
 | ||
Fig. 5 Ionic transport number of 30 mol% V2O5–ZrV2O7 measured from 580–690 °C in a fixed pO2 gradient  . . | ||
One must recognize that possible gas leakages during measurements and failure to take significant electrode polarization resistance into account presumably lead to underestimated ionic transport numbers. It is common to measure the polarization resistances by EIS and subsequently correct the transport numbers by Liu's approach.21 However, this method does not apply to electrolytes with significant electronic conductivity, as this may lead to large errors in the determination of polarization resistances by EIS.22 Nonetheless, in our measurements where ti ∼ 0.4 and the polarization resistance does not exceed 1/10 of the ionic resistance in the electrolyte, the error in the measured ti without any correction is estimated to be less than 10% according to the model by Kharton et al.22 The ionic transport number is in rather good agreement with Kulbakin et al.,1 who measured ti to ∼0.6–0.4 at 690–740 °C by volumetric measurements of the faradaic efficiency technique.
Nyquist plots of V2O5, ZrV2O7, and V2O5–ZrV2O7 at 600 °C in air where the materials are solid, are shown in Fig. 6a–c, respectively. In the spectrum for V2O5 (Fig. 6a), there is no visible electrode polarization. The spectra in Fig. 6b and c, however, contain a high-frequency contribution representing the volume resistance (bulk + grain boundaries) and one or more responses at lower frequencies corresponding to electrode polarization resistances. There are two electrode responses in the spectrum for ZrV2O7 (Fig. 6b); an arc at intermediate frequencies (10 kHz to 1 Hz) with a capacitance in the order of 10−6 F cm−2 and the beginning of an arc at lower frequencies (<1 Hz) with a capacitance in the order of 10−1 F cm−2. These values are typically representing charge transfer and mass transfer processes, respectively.23 The capacitance of the electrode part in the impedance spectrum of V2O5–ZrV2O7 in Fig. 6c is in the order of 10−6 F cm−2. The arc is somewhat asymmetrical, which was the case with some of the spectra below 600 °C. Still, relatively consistent fitting results were obtained using the circuit illustrated in Fig. 1.
 | ||
| Fig. 6 Nyquist plot with impedance sweep of (a) V2O5, (b) ZrV2O7 and (c) 30 mol% V2O5–ZrV2O7 from 1 MHz to 0.1 mHz at 600 °C in air. Solid lines are deconvolutions. | ||
Fig. 7 shows a set of impedance spectra of the composite from 630 to 690 °C – the temperature region where the V2O5 rich phases change from solid to liquid. The specific polarization resistances and corresponding capacitances in the temperature range 400–690 °C determined by deconvolution of the electrode arc according to Fig. 1 are presented, respectively, in Fig. 8a and b.
 | ||
| Fig. 7 Impedance spectra with fittings (solid lines) of 30 mol% V2O5–ZrV2O7 from 630–690 °C in air. | ||
 | ||
| Fig. 8 Specific (a) polarization resistances and (b) associated capacitances from 400–690 °C in air. | ||
Both the polarization resistances and electrode capacitances change significantly across the phase transition. Similarly as for the volume resistance, the electrode polarization resistance decreases when going from an all-solid to a molten-solid composite. In the same temperature window, the capacitance values of the electrode response change from being in the order of 10−6 to 10−1 F cm−2.
4. Discussion
Comparing the electrical conductivities of the three different materials studied herein (cf.Fig. 4), the electrical conductivity of solid 30 mol% V2O5–ZrV2O7 is between the two single-phase materials, and determined by the V2O5 phase present in a small volume fraction (20 vol%) below the eutectic melting point. This is reflected in the activation energy resembling the value of V2O5 and in the low ionic transport number (ti ∼ 0, cf.Fig. 5) showing that electronic conductivity predominates.The lack of electrode polarization for solid V2O5 (cf.Fig. 6a) is in accordance with the general view that this oxide is essentially a pure electronic conductor.15,16 The electrical conductivity decreases and the apparent activation energy increases when V2O5 is substituted with 2 mol% Zr. Assuming that Zr resides in a V site it will act as an acceptor dopant, yielding several possible interpretations to this behavior, both of charge carrier mobility and/or concentration origin. According to the electroneutrality principle, addition of a negative substituent will decrease the concentration of inherent negative charge carriers, in this case presumably electrons. Acceptor substitution could lead to changes in the structure affecting the charge mobility; it has been reported that the electrical conductivity of V2O5 is sensitive to impurities.15 To clarify this requires a more dedicated study of V2O5 which was not the scope of this investigation.
Turning to ZrV2O7, the electrical conductivity is three orders of magnitude lower than V2O5, meanwhile the activation energy remains as low as 0.30 eV below 540 °C. Based on conductivity and Seebeck coefficient measurements showing negative coefficients, Buchanan et al.18 concluded that ZrV2O7 is an n-type electronic conductor with the same V4+/V5+ electron hopping mechanism as in V2O5. The impedance spectra (cf.Fig. 6b), however, contradicts this conclusion, since the capacitive electrode responses, seen as two arcs at intermediate (10 kHz to 1 Hz) and low frequencies (1 Hz to 0.1 mHz), are indicative of ionic charge carriers. In this respect, it should be noted that the sign of the Seebeck coefficient reflects the sign of the predominating charge carrying defects, and negative values do therefore not exclude ionic charge carriers such as oxygen interstitials or metal vacancies. The arc at intermediate frequencies with a capacitance in the order of 10−6 F cm−2 represents an interfacial process involving charge transfer, and a double layer capacitance, presumably stemming from accumulation of charge carriers at the electrolyte/electrode/gas triple-phase boundary (TPB). The capacitive response at low frequencies is the beginning of an arc with large polarization resistance and a capacitance in the order of 10−1 F cm−2. This capacitance is attributed to mass transfer processes, e.g., diffusion or surface processes.23
The indication from the electrode impedance that ZrV2O7 is an ionic conductor is not easily explained, since the activation energy of 0.30 eV below 540 °C is unusually low considering the possible ions that could contribute in the solid state. This points to intrinsic electronic charge carriers as the predominant contribution to the electrical conductivity. Attempts of measuring the ionic transport number of ZrV2O7 unfortunately failed, as the brittleness of the disks led to high gas leakages in the setup. Hence, the major charge carrier in ZrV2O7 remains inconclusive here and will be investigated further in a combined computational and experimental study.
Upon melting of 30 mol% V2O5–ZrV2O7, the V2O5 phase expands into the porous microstructure of the composite due to the increase in molar volume through the phase transition, and thus increases the V2O5 percolating matrix. This rationalizes the 10-fold increase in conductivity above 630 °C (cf.Fig. 4). The activation energy increases from 0.21 below to ∼0.7 eV above the melting point, revealing a change in transport properties. This is supported by the increase in the ionic transport number of the composite, from essentially zero (n-type electronic conductivity of V2O5 predominating) to approximately 0.4 close to the eutectic melting point (cf.Fig. 5), reflecting an increasing ionic contribution to the total conductivity in V2O5 upon melting. We expect the majority of the ionic conductivity to stem from oxide ion transport.1 However, it should be noted that a gradient in pO2 will be accompanied by an inverse gradient in the metal ion activity. Thus, measured ti includes all ionic charge carriers.19,24 The ionic transport number of the composite is essentially independent of the temperature in the melted state (cf.Fig. 5). The physical interpretation of this behaviour would be that the apparent temperature dependence of the ionic and electronic conductivity is close to equal. However, the validity of this observation is difficult to ascertain here with the narrow temperature range of the measurements when the V2O5 phase is melted and, moreover, the uncertainty of the transport numbers.
The discontinuity in the electrical conductivity of ZrV2O7 at 630–640 °C and the activation energy of 0.71 eV at 640–720 °C resemble that of the composite. This behaviour could reflect the addition of excess (2 mol%) V2O5 relative to the nominal composition, resulting in a small amount of melt that will enhance the conductivity. The increase in conductivity is minor compared to the increase observed for the composite (a factor of 2 vs. a factor of 10), i.e., the increase in the conductivity of V2O5–ZrV2O7 across the eutectic melting point cannot be explained by the ZrV2O7 phase alone. In contrast to the composite, there were insignificant changes in the electrode capacitance of ZrV2O7 in the measured temperature range, indicating that the transport mechanisms remain the same across the discontinuity in conductivity. The gradual increase in slope of the temperature dependence above 540 °C resembles that of a structural phase transition. As mentioned, the electrical conductivity of ZrV2O7 will be examined further in a separate study.
Now we will address the impedance spectroscopy data to further elucidate the behavior of the composite in view of the single-phase materials and differences between the composite in the all-solid and the solid–liquid state.
The impedance spectrum of solid V2O5–ZrV2O7 contains a bulk and an electrode response, in good correspondence with the total conductivity reflecting the two constituent phases, and one of them (ZrV2O7) containing ionic charge carriers (cf.Fig. 6c). The considerable electrode resistance of the ionic conducting phase is partly short-circuited by the electronic conductor, and only a small and finite electrode polarization remains, dominated by a charge transfer-type of reaction step. Considering the negligible mass transfer resistance and that vanadium oxides are well-known redox catalysts, dissociative adsorption of oxygen may occur at the surface of V2O5 in addition to the Au electrode.25 Hence, the large mass transfer resistance seen for single-phase ZrV2O7 can be circumvented via the V2O5 phase in the composite.
In the temperature region where the composite is solid, the electrode response with a capacitance of ∼10−6 F cm−2 indicates that charge transfer processes, i.e., compensating ionic charge accumulation at the TPBs, predominate the electrode polarization. The changes in the capacitance values from ∼10−6 to ∼10−1 F cm−2 when moving across the eutectic melting point reflect a decrease in the relative contribution of the charge transfer processes so that mass transfer processes become rate-limiting when the V2O5 fraction of the composite has melted (cf.Fig. 7).
Overall, the variations in polarization resistances and corresponding capacitances show that the oxygen red-ox reaction at the surface of the composite changes from being rate limited by charge transfer processes below to mass transfer processes above the eutectic melting point (cf.Fig. 8a and b). The significant drop in charge transfer resistance as V2O5 melts may reflect a change in the principal mechanism for the oxygen red-ox reaction. V2O5 is an electronic conductor when the composite is all-solid, hence, the primary pathway for the oxygen red-ox reaction is through the ZrV2O7/Au/gas and/or ZrV2O7/V2O5/gas TPB (cf.Fig. 9a). When V2O5 melts and becomes a mixed conductor, however, the most favorable pathway for the oxygen red-ox reaction is at the V2O5/Au/gas TPB, and the V2O5/gas interface may also contribute directly (cf.Fig. 9b). Consequently, the increase in reaction sites and the rapid oxygen exchange in molten V2O5 as compared to solid ZrV2O7 decreases the charge transfer resistance significantly as the composite goes from all-solid to molten-solid.
 | ||
| Fig. 9 Schematic mechanisms for the oxygen red-ox reaction at the surface of (a) solid and (b) molten-solid V2O5–ZrV2O7. Areas where the charge transfer processes occur are marked in green. | ||
Finally, it is interesting to evaluate the molten-solid composite with respect to its potential as an oxygen separation membrane. Assuming that the ionic transport number reflects oxide ions only, the oxygen permeability can be estimated from the ionic transport number and the electrical conductivity using a simplified Wagner equation.3,26 The estimated oxygen permeation for a 1.5 mm thick 30 mol% V2O5–ZrV2O7 membrane is in the order of 10−8 mol cm−2 s−1 at 680 °C  , which is comparable to the oxygen permeability measured by Kulbakin et al.1 This supports our expectation that the measured ti of ∼0.4 mainly reflects oxide ion transport. The calculated oxygen permeability is also comparable to other solid dual-phase membranes intended for intermediate temperatures.3 For instance, the oxygen permeability of a 1 mm thick dual-phase (Bi2O3)0.74(SrO)0.26 – 40 vol% Ag membrane in an identical pO2 gradient at 700 °C was reported to 5 × 10⁻⁸ mol cm−2 s−1.27 However, the estimated oxygen permeation of V2O5–ZrV2O7 is approximately one order of magnitude lower than that of an equally thick Ba0.5Sr0.5Co0.8Fe0.2O3−δ (BSCF) membrane under similar conditions.28
We have utilized the V2O5–ZrV2O7 material system as a model system for investigating the electrical properties of molten-solid composites. Further insight into the behavior of these dual-phase materials as oxygen membranes can be achieved by dedicated studies of surface kinetics and interfacial effects with approaches based on isotope exchange, e.g., gas-phase analysis in combination with isotope diffusion profiling by means of SIMS. Composite materials with lower eutectic melting points and/or possibly higher oxygen permeability are yet to be examined. Some of the major challenges for the technological application of these composites will involve chemical and mechanical stability, with evaporation of the molten phase being one of the main concerns for long-time operation. Future directions for improving their performance should include tailoring of phase composition and microstructure.
5. Conclusions
The n-type electronic conductivity of V2O5 predominates the V2O5–ZrV2O7 composite in the measured temperature range 400–690 °C, since the electrical conductivity of ZrV2O7 (mixed conductor) is approximately three orders of magnitude lower than in V2O5.When V2O5 melts and increases the V2O5 percolation in the composite significantly, the electrical conductivity increases with a factor of 10 to essentially the same values as molten V2O5. The increase in the activation energy of the electrical conductivity and the ionic transport number across the eutectic melting point reflects a significant increase in the relative oxide ion conductivity.
EIS implies that the oxygen red-ox reaction at the surface of the composite changes from being rate limited by charge transfer processes to mass transfer processes upon melting as a consequence of rapid oxygen exchange in molten V2O5 as compared to solid ZrV2O7. This in accordance with the increase in oxide ion conductivity in the composite after melting.
The present data set was used to estimate the oxygen flux across a V2O5–ZrV2O7 molten-solid OTM. At intermediate temperatures, the oxygen permeability is in the same order as for several dual-phase membranes, but one order of magnitude lower than for single-phase mixed conducting membranes.
Conflicts of interest
There are no conflicts to declare.Acknowledgements
This research has received funding from the Research Council of Norway (RCN) under the CLIMIT program (MOC-OTM 268450). The authors are grateful to Prof. Truls Norby (UiO) for valuable discussions.References
- I. V. Kulbakin, et al., Transport properties of ZrV2O7–V2O5 composites with liquid-channel grain boundary structure, Russ. J. Electrochem., 2013, 49(9), 878–882 CrossRef CAS.
- I. V. Kulbakin, et al., Highly oxygen-permeable NiV2O6 – 25 wt% V2O5 molten-oxide membrane material, Inorg. Mater., 2018, 54(10), 1055–1061 CrossRef CAS.
- J. Sunarso, et al., Mixed ionic–electronic conducting (MIEC) ceramic-based membranes for oxygen separation, J. Membr. Sci., 2008, 320(1), 13–41 CrossRef CAS.
- P. M. Geffroy, et al., Rational selection of MIEC materials in energy production processes, Chem. Eng. Sci., 2013, 87, 408–433 CrossRef CAS.
- J. Kim and Y. S. Lin, Synthesis and oxygen permeation properties of ceramic-metal dual-phase membranes, J. Membr. Sci., 2000, 167(1), 123–133 CrossRef CAS.
- M. Balaguer, et al., Fast oxygen separation through SO2- and CO2-stable dual-phase membrane based on NiFe2O4–Ce0.8Tb0.2O2−δ, Chem. Mater., 2013, 25(24), 4986–4993 CrossRef CAS.
- V. V. Belousov, S. V. Fedorov and I. V. Kul'bakin, Hybrid molten/solid In2O3–Bi2O3 oxygen ion transport membranes, J. Membr. Sci. Res., 2015, 1(2), 96–99 Search PubMed.
- V. V. Belousov, Oxygen permeation of partly molten slags, Metall. Mater. Trans. A, 2014, 45(10), 4257–4267 CrossRef CAS.
- J. Jamnik, J. Maier and S. Pejovnik, Interfaces in solid ionic conductors: equilibrium and small signal picture, Solid State Ionics, 1995, 75, 51–58 CrossRef CAS.
- J. Maier, Ionic conduction in space charge regions, Prog. Solid State Chem., 1995, 23(3), 171–263 CrossRef CAS.
- V. V. Belousov and S. V. Fedorov, Accelerated mass transfer involving the liquid phase in solids, Russ. Chem. Rev., 2012, 81(1), 44–64 CrossRef CAS.
- H. Singh, D. Puri and S. Prakash, An overview of Na2SO4 and/or V2O5 induced hot corrosion of Fe- and Ni-based superalloys, Rev. Adv. Mater. Sci., 2007, 16(1), 27–50 CAS.
- J. G. Gonzalez-Rodriguez, et al., Corrosion performance of heat resistant alloys in Na2SO4–V2O5 molten salts, Mater. Sci. Eng. A, 2006, 435–436, 258–265 CrossRef.
- E. M. Levin, et al., Phase diagrams for ceramists 1969 supplement, American Ceramic Society, Columbus, Ohio, 1969 Search PubMed.
- R. C. Kerby and J. R. Wilson, Electrical conduction properties of liquid vanadates. I. Vanadium pentoxide, Can. J. Chem., 1972, 50(17), 2865–2870 CrossRef CAS.
- T. Allersma, et al., Structure and physical properties of solid and liquid vanadium pentoxide, J. Chem. Phys., 1967, 46(1), 154–160 CrossRef CAS.
- V. V. Belousov, A. A. Klimashin and S. V. Fedorov, Modeling oxygen ion transport of molten oxide membranes based on V2O5, Ionics, 2016, 22(3), 369–376 CrossRef CAS.
- R. C. Buchanan and G. W. Wolter, Properties of hot-pressed zirconium pyrovanadate ceramics, J. Electrochem. Soc., 1983, 130(9), 1905–1910 CrossRef CAS.
- T. Norby, EMF method determination of conductivity contributions from protons and other foreign ions in oxides, Solid State Ionics, 1988, 28–30, 1586–1591 CrossRef.
- B. Yuan, et al., Electrical properties and dielectric relaxation behavior of zirconium vanadate, Ceram. Int., 2018, 44(17), 21621–21625 CrossRef CAS.
- M. Liu and H. Hu, Effect of interfacial resistance on determination of transport properties of mixed-conducting electrolytes, J. Electrochem. Soc., 1996, 143(6), L109–L112 CrossRef CAS.
- V. V. Kharton and F. M. B. Marques, Interfacial effects in electrochemical cells for oxygen ionic conduction measurements: I. The e.m.f. method, Solid State Ionics, 2001, 140(3), 381–394 CrossRef CAS.
- J. T. S. Irvine, D. C. Sinclair and A. R. West, Electroceramics: characterization by impedance spectroscopy, Adv. Mater., 1990, 2(3), 132–138 CrossRef CAS.
- A. Evans, W. Xing and T. Norby, Electromotive force (emf) determination of transport numbers for native and foreign ions in molten alkali metal carbonates, J. Electrochem. Soc., 2015, 162(10), F1135–F1143 CrossRef CAS.
- J. Haber, Fifty years of my romance with vanadium oxide catalysts, Catal. Today, 2009, 142(3), 100–113 CrossRef CAS.
- S. Smart, et al., Oxygen transport membranes: dense ceramic membranes for power plant applications, in Advanced Membrane Science and Technology for Sustainable Energy and Environmental Applications, ed. A. Basile and S. P. Nunes, Woodhead Publishing, 2011, pp. 255–292 Search PubMed.
- K. Wu, et al., Oxygen permeation through (Bi2O3)0.74(SrO)0.26–Ag (40% v/o) composite, J. Membr. Sci., 2001, 188(2), 189–193 CrossRef CAS.
- Z. Shao, et al., Investigation of the permeation behavior and stability of a Ba0.5Sr0.5Co0.8Fe0.2O3−δ oxygen membrane, J. Membr. Sci., 2000, 172, 177–188 CrossRef CAS.
| This journal is © The Royal Society of Chemistry 2021 |