 Open Access Article
A novel method to synthesize BiSI uniformly coated with rGO by chemical bonding and its application as a supercapacitor electrode material†
Huapeng
Sun‡
 ab,
Xufeng
Xiao‡
b,
Veronica
Celorrio
 c,
Zhenfu
Guo
d,
Yue
Hu
 *b,
Caroline
Kirk
*a and
Neil
Robertson
 *a
*a
aSchool of Chemistry and EaStCHEM, University of Edinburgh, King's Buildings, David Brewster Road, Edinburgh, Scotland EH9 3FJ, UK
bWuhan National Laboratory for Optoelectronics (WNLO), Huazhong University of Science and Technology (HUST), Wuhan 430074, China
cDiamond Light Source Ltd, Harwell Science and Innovation Campus, Oxfordshire, Didcot, OX11 0DE, UK
dHebei North University, Zhangjiakou 075000, Hebei, P. R. China
First published on 28th June 2021
Abstract
In this paper, we demonstrate a novel synthetic route to assemble reduced graphene oxide (rGO) uniformly coated on BiSI composite and investigate its potential as the active electrode material for supercapacitors. In this strategy, graphene oxide (GO) was not a simple physical mixture with the BiSI material but bismuth cations were uniformly anchored on the surface of GO by chemical bonding during material growth and the size of GO can determine the final size of rGO coated BiSI composite. The galvanostatic charge–discharge measurement results show that the BiSI–rGO electrode has a maximum specific capacity of 234 C g−1 at the current density of 1 A g−1 and excellent capacity retention of 92.4% after 2000 cycles. In situ XANES and EXAFS were employed to study the electrochemical oxidation and reduction processes of the bismuth-based material with rGO coating and investigate the origins of the structural stabilities. The results show that our novel rGO coating route can not only significantly increase the capacity but also improve cycling stability.
Introduction
In recent years, supercapacitors have been the subject of extensive research as sustainable and cost-effective energy storage devices, due to high power density and good cycle stability.1–4 Supercapacitors are generally divided into two types: electric double layer capacitor (EDLC) and pseudocapacitors.5,6 The EDLC stores energy through the physical adsorption and accumulation of ions at the electrode and electrolyte interface,7–9 while the pseudocapacitors chemically store energy through faradaic redox reactions. Electrode materials have been widely researched as the key factor affecting the performance of supercapacitors, including carbon materials,10–13 conductive polymer materials,14–16 and metal compound materials.17–20 Among them, Bi-based compounds are favourable due to their relatively rich content in the crust, ready availability, and high theoretical specific capacity, including Bi2S3,21,22 Bi2O3,23 BiVO4,24,25 BiFeO3 (ref. 26 and 27) and BiSI.28 However, previous studies have proven that Bi-based materials have relatively poor electronic conductivity, resulting in low charge transfer rate in the rapid charge–discharge cycle and large volume changes, due to the easy insertion of the electrolyte into the structure. This affects the performance of the capacitor under high current discharge and long-term cycle stability.24,29 In order to improve the conductivity of the Bi-based supercapacitor, carbon nanotubes (CNT) and Ag have been added to the Bi-based electrode material to form a composite material, which effectively improves the performance.30,31 Carbon materials, when forming composites with Bi-materials, must have “appropriate” electrical conductivity. As they are essentially a cladding layer, they must also have physical properties which will allow tolerance of the volume changes associated with the Bi-materials. However, the cost of CNT and Ag are both very high, limiting potential in any practical application for Bi-based capacitors.Reduced graphene oxide (rGO) is considered as one of the best carbon materials for it not only has good electrochemical performance, but also reduces the volume change and agglomeration of electrode materials.32–37 Moreover, rGO itself can absorb ions in the electrolyte to form a double-layer capacitor and combined with a Bi-based active material can form an EDLC pseudo-capacitance composite capacitor. However, to date, the reported Bi-based materials and rGO composite materials, are physical mixtures, where rGO is physically adsorbed on the surface of the Bi-based material. The distribution is not very even, failing to achieve the uniform coating effect of rGO on the surface of the Bi-based material.24,30,38
In this paper, a novel method is developed to use the –OH group on the GO surface and ethylene glycol (EG) as a linker to anchor bismuth ions on the GO surface, and furthermore in situ generate BiSI crystals to obtain a BiSI–rGO composite structure with a uniform surface coating of rGO. Through the electrochemical testing of BiSI–rGO, it displays both the pseudocapacitance of BiSI and the EDLC performance of rGO, which greatly improves the capacity from 88 C g−1 for BiSI28 to 234 C g−1. This is greater than the sum of the simple BiSI and rGO, which shows that BiSI–rGO produces a synergistic energy storage effect. By assembling an asymmetric capacitor, the device exhibits a high energy density of 15.2 W h kg−1 at a power density of 807 W kg−1. We further discuss the synthesis mechanism. It is believed that Bi ions are anchored on the GO surface first, then GO is bent to finally form BiSI–rGO uniformly during the formation of BISI crystals, instead of first generating BiSI crystals and then coating with GO. This is the first time that chemical bonding has been used during material formation to coat Bi-based substances with rGO instead of a simple physical attachment. This novel route to coat GO on a Bi-based active material significantly improves its capacity and cycle stability.
Results and discussion
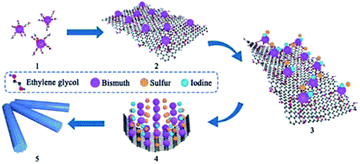
The rGO uniformly coated BiSI samples, labelled as BiSI–rGO, were prepared by a novel synthesis route as described in Scheme 1. For comparison, a physical mixture of BiSI and rGO was also prepared using a reported common synthesis route that prepares BiSI first then coats it with rGO (“BiSI–mix”). The mechanism and evidence for the novel synthesis route to produce BiSI–rGO is presented in detail at the end of discussion section.Fig. 1 shows PXRD patterns of the as-prepared materials BiSI–rGO and BiSI–mix and confirms both samples contain BiSI. Refinement of the PXRD data using a least squares refinement procedure was carried out in the orthorhombic space group Pnam. The refined unit cell parameters for BiSI–rGO were a = 8.503(3) Å, b = 10.241(4) Å and c = 4.171(2) Å and for BiSI–mix, a = 8.499(2) Å, b = 10.242(3) Å and c = 4.172(2) Å. These are in good agreement with standard literature values (ICDD PDF card no. 43-652).39 It should be noted the broad peak at ∼24° 2θ, associated with the poorly crystalline rGO phase, is not observed; rGO is only present in very small quantities, as a thin coating on the surface of the BiSI. The observed data are dominated by the well crystalline BiSI sample, swamping the weak and broad diffraction peak of the rGO. The Raman spectra of pristine BiSI, pure rGO and BiSI–rGO composite materials are shown in Fig. 1B. Both BiSI–rGO and rGO samples have obvious characteristic peaks at 1312 cm−1 (D band) and 1595 cm−1 (G band). The D band is a common feature of sp3 defects in carbon, and the G band provides two-dimensional in-plane vibration information of sp2 bonded carbon atoms in the crystal lattice.40 The broadening of the D and G bands is due to the introduction of oxygen functional groups such as hydroxyl and epoxide during the oxidation process.38 The Raman spectra of BiSI–rGO composites have slight shifts to lower wavenumbers at 1308 cm−1 and 1592 cm−1, compared with the pure rGO spectra. The intensity ratio of D and G band (ID/IG) for the BiSI–rGO composite material is ca. 1.23, which is slightly larger than 1.1 of rGO, indicating that the in situ reduction of GO on the BiSI surface leads to a decrease in the average size of the graphitic domains during the BiSI–rGO structure formation.41 All the samples show low energy Bi–S vibrational modes at 220 cm−1 and 280 cm−1, which are similar to Bi2S3.42
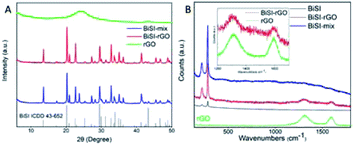 | ||
| Fig. 1 PXRD patterns of the as-prepared BiSI–rGO, BiSI–mix and rGO powder (A) and Raman spectra of BiSI–rGO and rGO powder (B). | ||
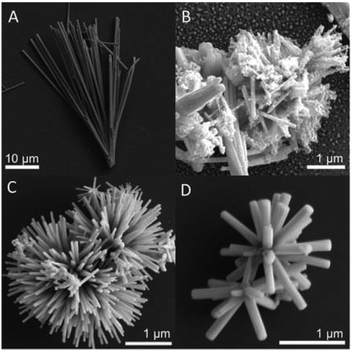
It is observed from the SEM images shown in Fig. 2 that both the morphology of the sample BiSI–mix (Fig. 2B) and BiSI–rGO (Fig. 2C) have obvious changes, when compared to pristine BiSI (Fig. 2A), after surface coating with rGO. In the image of BiSI–mix sample (Fig. 2B), a thin layer of rGO is observed on only some of the needle surfaces, with some parts of the needle-like surface having no obvious coating. This is consistent with most of the published results using this method to synthesize rGO-coated bismuth based materials, such that rGO tends to be physically coated on the BiSI surface, and the thickness and uniformity of the coated rGO on each BiSI needle structure cannot be controlled. Compared with pristine BiSI, the BiSI–rGO sample is no longer a bundle-shaped nanoneedle structure, but a nanoflower structure composed of nanoneedles, and the length of each nanoneedle is greatly reduced, from 20–30 microns to 1 micron. This not only increases the specific surface area, but also shortens the charge transfer distance, which helps overcome the disadvantages of poor conductivity of the BiSI material. The higher magnification image (Fig. 2D) of BiSI–rGO shows that all the nanoneedles of the BiSI–rGO sample are approximately the same size. This is different to the size distribution of BiSI–mix sample where the parts coated with rGO are smaller in size than those parts without rGO-coating. Moreover, on the BiSI–rGO sample, no separate rGO layered structure was observed.
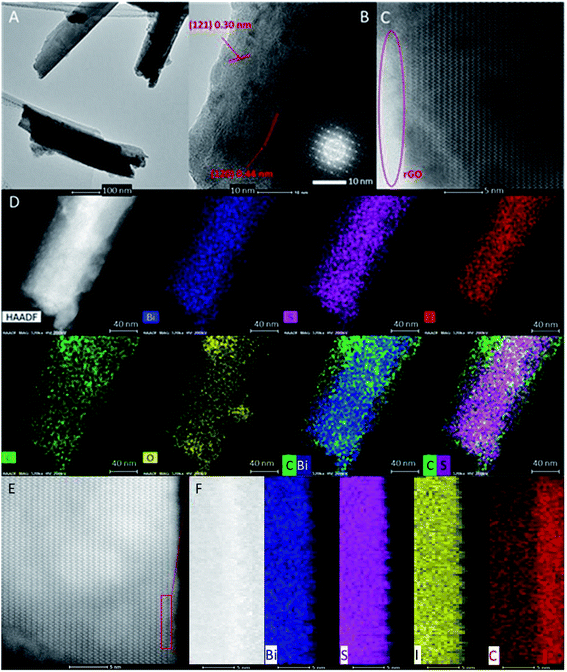
In order to further observe the surface structure of the sample and confirm the uniform coating of rGO on the BiSI surface, HRTEM and HAADF-EDS were employed to analyse the surface structure and element distribution. It can be clearly seen from Fig. 3A that BiSI–rGO has a single needle-like morphology with a length of around 650 nm. The high-resolution TEM image presented in Fig. 3B and partially-enlarged image in Fig. S2B† clearly show two different sets of lattice fringes, with measured interplanar spacings of 0.30 nm, corresponding to the (121) crystallographic plane of BiSI, and 0.44 nm, corresponding to the (120) crystallographic plane. These are two of the most intense reflections observed by PXRD (Fig. 1) at 20.3° and 29.5°. The corresponding selected area electron diffraction (SAED) patterns of BiSI–rGO (inset in Fig. 3B) shows that the BiSI–rGO sample has an orthorhombic structure. An obvious interface is observed in Fig. 3C between the crystal BiSI structure in the centre and amorphous rGO on the surface, indicating rGO has been uniformly coated on BiSI surface. In the HAADF-EDS mapping image (Fig. 3D), there are strong signals for elements Bi, S and I in the central area of but much lower distribution at the edge of the BiSI–rGO nanoneedle. However, the element distribution of C and O are obviously wider than Bi, S and I that extend to the whole surface of BiSI–rGO nanoneedle. In order to have a more objective comparison, the element maps of Bi, S and C were combined and it can be clearly noticed that both bismuth (represented by blue colour) and carbon (represented by green colour) were detected in the central area but only green (carbon) was found uniformly distributed at the edge area around blue (bismuth). Moreover, the carbon–sulfur elements map has the same trend as carbon–bismuth. These prove that rGO has been uniformly coated on the surface of BiSI needle-like crystal and formed a stable composite.
X-ray Photoelectron Spectroscopy (XPS) was used to study and compare the chemical oxidation state of each element in BiSI, BiSI–mix and BiSI–rGO composite materials. The full XPS spectra (Fig. 4A) show that there are bismuth, sulfur, iodine, carbon and oxygen peaks on the surfaces of the three materials. The high-resolution XPS spectrum of the 4f orbital of Bi shows that the Bi3+ state has two strong peaks, typically at approximately 164 and 159 eV respectively, belonging to Bi4f5/2 and Bi4f7/2. Comparing the XPS spectra of the three materials, it was found that peak positions of the BiSI and BiSI–mix samples are almost exactly the same at 164.2 eV and 158.7 eV, while the peak positions of BiSI–rGO have a slight shift, located at 163.8 eV and 158.4 eV. This shows that the rGO in the BiSI–mix sample has no chemical bond with Bi, only physical adsorption, because the peak positions of Bi have not changed. The high-resolution XPS of S and I spectra show that the S and I peaks of the three substances are basically at the same position, which indicates that S and I did not form a chemical bond with GO during the formation of BiSI–rGO. In the XPS spectrum of C1s, BiSI has a weak carbon peak, which may come from carbon-based pollutants in the air. The three peaks in the BiSI–mix and BiSI–rGO samples belong to the characteristic peaks of carbon atom sp2 hybridization at 284 eV, epoxy C–O at 286 eV and ketyl C![[double bond, length as m-dash]](https://www.rsc.org/images/entities/char_e001.gif) O at 289 eV. The intensity of the ketyl peak in the BiSI–rGO sample is less than that in the BiSI–mix sample, which suggests the majority of GO in BiSI–rGO sample is reduced to rGO compared with BiSI-coated sample. This may be because in the process of reducing GO to rGO, the GO in the BiSI–rGO sample is uniformly coated on the BiSI surface, which is easier to be reduced than the BiSI–mix sample with a large number of GO stacks on the surface. In the XPS spectrum of O 1s (Fig. 4F), BiSI–mix has three overlapping peaks located at 530, 531 and 533 eV, corresponding to the oxygen combined with Bismuth (Bi–O), the oxygen combined with carbon (C–O) and the oxygen in the hydroxyl group (C–OH). BiSI sample has a weak C–O peak and Bi–O peak but has no obvious C–OH peak that would originate from GO, which implies that Bismuth in BiSI and BiSI–mix are both surface-oxidized with oxygen in the air. However, the BiSI–rGO sample has no obvious Bi–O peak, which indicates that rGO is uniformly coated on the surface of BiSI, preventing its oxidation. In addition, the C–OH peak of the BiSI–rGO sample is significantly smaller than that of the BiSI–mix sample, which is consistent with the results observed from the C1s spectrum that the degree of GO reduction in BiSI–rGO is significantly greater than that of BiSI–mix.
O at 289 eV. The intensity of the ketyl peak in the BiSI–rGO sample is less than that in the BiSI–mix sample, which suggests the majority of GO in BiSI–rGO sample is reduced to rGO compared with BiSI-coated sample. This may be because in the process of reducing GO to rGO, the GO in the BiSI–rGO sample is uniformly coated on the BiSI surface, which is easier to be reduced than the BiSI–mix sample with a large number of GO stacks on the surface. In the XPS spectrum of O 1s (Fig. 4F), BiSI–mix has three overlapping peaks located at 530, 531 and 533 eV, corresponding to the oxygen combined with Bismuth (Bi–O), the oxygen combined with carbon (C–O) and the oxygen in the hydroxyl group (C–OH). BiSI sample has a weak C–O peak and Bi–O peak but has no obvious C–OH peak that would originate from GO, which implies that Bismuth in BiSI and BiSI–mix are both surface-oxidized with oxygen in the air. However, the BiSI–rGO sample has no obvious Bi–O peak, which indicates that rGO is uniformly coated on the surface of BiSI, preventing its oxidation. In addition, the C–OH peak of the BiSI–rGO sample is significantly smaller than that of the BiSI–mix sample, which is consistent with the results observed from the C1s spectrum that the degree of GO reduction in BiSI–rGO is significantly greater than that of BiSI–mix.
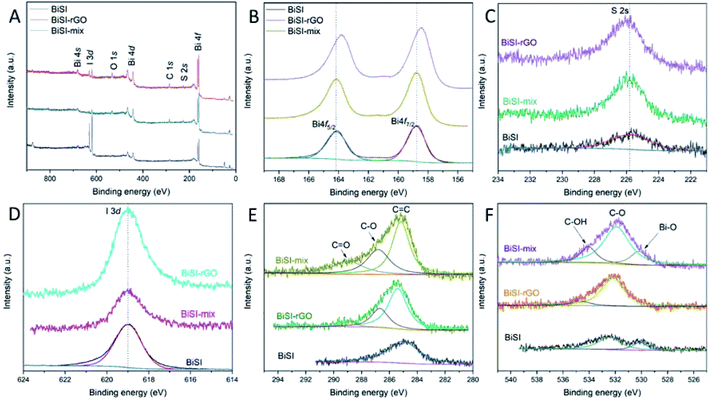 | ||
| Fig. 4 XPS full spectrum (A), high resolution spectrum of bismuth 4f (B), sulphur 2p (C), iodine 3d (D) carbon (E) and oxygen (F) for BiSI, BiSI–mix and BiSI–rGO powders; specific peaks are labelled. | ||
Typical nitrogen adsorption–desorption isotherms for BiSI, BiSI–mix and BiSI–rGO composite are shown in Fig. S3† and their specific surface areas are calculated as 5.21 m2 g−1, 11.25 m2 g−1 and 14.88 m2 g−1 respectively. BiSI is found to have one kind of pore, with an average pore diameter of 46 nm, whereas both BiSI–mix and BiSI–rGO show the presence of similar pores (41 nm) to BiSI, as well as the presence of smaller pores, with average pore diameters of about 17 nm and 9 nm, respectively. This indicates our novel synthetic route has increased the surface area and reduced the pore size. Moreover, its average pore diameter is very close to the range of 3–8 nm which is considered as ideal for supercapacitor electrodes.43
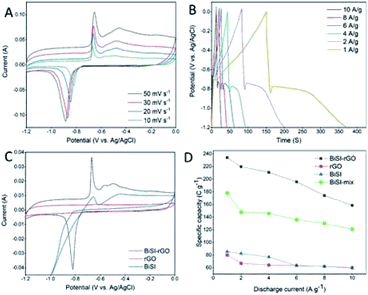
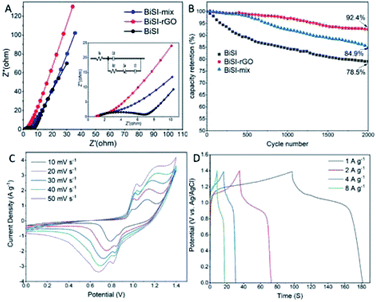
Cyclic Voltammetry analysis (CV) was employed to give an overview of processes when the materials are used as electrode materials for supercapacitors at different potentials using a three-electrode system in 3 M KOH electrolyte at room temperature. A series of CV profiles of BiSI–rGO are shown in Fig. 5A over a potential window of −1.2 to 0 V vs. Ag/AgCl with scan rates from 10 to 50 mV s−1. It can be seen from Fig. 5A that there are obvious anodic peaks and cathodic peaks at all scan rates, indicating the sample has good reversibility and typical battery-like characteristics.44 At the same time, a conventional rectangular area for EDLC behaviour is also observed, especially at higher scan rate,45 which suggests the BiSI–rGO has both pseudocapacitive and EDLC behaviour. Moreover, these CV profiles consist of one reduction peak and two oxidation zones. In detail, for the low scan rate of 10 mV s−1, the reduction peak is located at −0.8 V, which is caused by the reduction of Bi3+ to Bi0; furthermore, there are two oxidation peaks; a sharp peak at −0.64 V and a broad peak at −0.45 V. These can be assigned to the oxidation process of Bi0 → Bi+ and Bi+ → Bi3+, respectively.46 In addition, the oxidation peaks shift to a more positive potential while reduction peaks shift to a more negative potential with increasing scan rate, which is very common phenomenon for CV curves, mainly derived from the overpotential and iR drops.47Fig. 5B displays overall Galvanostatic Charge–Discharge (GCD) profiles of the BiSI–rGO sample at various current densities from 1 to 10 A g−1, at the same potential window as the CV scans (−1.2 to ∼0 V). GCD profiles present unique charging–discharging features of an asymmetric curve that contains a typical platform discharge shape of bismuth based pseudocapacitors48,49 first and a typical triangular outline of EDLC at the end of the discharge process, which indicate it has both pseudo-capacitive and EDLC characteristics consistent with the results of CV. For the discharge stage, there is a steep voltage drop first, probably due to the internal resistance, and then a platform of a quasi-faradaic process during which Bi0 is oxidized to Bi3+. After that, a typical triangular curve occurs which is the behaviour of EDLC whereby electrolyte ions physically discharge from the surface of the BiSI–rGO composite. The specific capacities of the BiSI–rGO electrode are 234 C g−1, 219 C g−1, 210 C g−1, 196 C g−1, 174 C g−1 and 158 C g−1 with increasing current densities from 1 A g−1 to 10 A g−1, which indicates that the specific capacity of the electrode decreases with increase in current density. The CV curves of BiSI–rGO, rGO and BiSI electrodes are plotted in Fig. 5C together to show a comparison. The pure rGO electrode has a conventional rectangle, showing EDLC behaviour and the BiSI–rGO electrode has more obvious anodic peaks and cathodic peaks, when compared with the BiSI electrode, indicating better reversibility. The negative shift of the reduction peak of the BiSI electrode may be caused by the adsorption of hydrogen generated at the high negative potential on the BiSI surface, but the BiSI–rGO sample uniformly coated with rGO on the surface inhibits the generation of hydrolysed hydrogen, which makes its stable charging and discharging voltage window increase compared with BiSI electrode. The comparison of specific capacity of BiSI–rGO, BiSI–mix, BiSI and rGO electrodes in a three-electrode system is shown in Fig. 5D at different discharge current densities. BiSI–rGO electrode has the largest capacity and better capacity retention with increased discharge current density, and its capacity is not only higher than single BiSI and rGO electrodes but higher than the sum of the two. This indicates that coating rGO on BiSI is not a simple mixture of BiSI and rGO but they create synergies to improve capacity and stability. From the SEM image, BiSI–rGO particles have the smallest size, which can effectively shorten the nanoscale electron diffusion length during the charge and discharge process. This will improve the interface contact and reduce the internal resistance. At the same time, the BiSI–rGO sample has the largest surface area of the four electrodes tested here, which may be another important factor to improve its capacity. In addition, the BiSI–rGO composite has two kinds of average pore size around 8 nm and 41 nm, which is not only close to the ideal pore size (3–8 nm) for EDLC supercapacitor but also provides multiple channels for ion absorption and transfer leading to an improved capacity performance.
The physical and electrochemical processes of the BiSI–rGO, BiSI–mix and BiSI electrodes were characterized by electrochemical impedance spectroscopy (EIS) in the three-electrode test system with an AC amplitude of 10 mV at a frequency of 150 kHz to 0.1 Hz. The Nyquist plots of the three electrodes all show a typical faradaic pseudocapacitor behaviour with a semicircle in the high frequency region, and a line towards vertical in the low frequency region in Fig. 6A, which is close to a mixture of typical battery characteristic and capacitor behaviour.50 The intercept of the semicircle at the high-frequency end of the real axis (Z′) gives the Rs value in the equivalent circuit as the equivalent series resistance (ESR), which represents the combined resistance due to the resistance in the KOH electrolyte and the current collector. The diameter of the semicircle and curvature are simulated with resistor Rct in parallel with a constant phase element Cdl to indicate two possible behaviours of the electrolyte during charging and discharging. BiSI–rGO, BiSI–mix and BiSI samples have a calculated Rct value of 1.96 Ω, 4.22 Ω and 5.54 Ω, respectively, which was analysed on the diameter of semicircle, representing the charge transfer resistance and the bulk resistance of the active material and electrode pores. The Rct of BiSI–rGO electrode is smaller than the BiSI and BiSI–mix electrode, which may be due to the smaller particle size leading to smaller bulk resistance and the rGO on the surface which can effectively increase electrical conductivity. The electrochemical performance of the electrodes was further analysed by Bode phase plot and the results are shown in Fig. S4.† The phase angle of BiSI, BiSI–mix and BiSi–rGO are 66.59°, 73.26°, 75.01°, which are between the angle of capacitive and faradaic behaviour. Among them, the angle of BiSI–rGO electrode is closer to capacitive behaviour (90°). This confirms that the intercalation/deintercalation process is more likely to occur on the BiSI–rGO electrode and it has better capacity than the other electrodes. In addition, the relationship of normalized C′′ and frequency was plotted in Fig. S4D† and the relaxation time constant of the samples was also calculated by the equation: (τ0 = 1/f0, f0 is the frequency of maximum C′′). The calculated τ0 of the BiSI–rGO is 54 ms, which is much smaller than those of the BiSI (981 ms) and BiSI–mix (411 ms), indicating that uniformly coated rGO layer on BiSI surface is favorable for rapid ion transport. The comparison of cyclic stability of three prepared electrodes is shown in Fig. 6B, and BiSI–rGO electrode shows significantly improved capacity retention of 92.4% over 2000 cycles.
In order to further explore the practical application of BiSI–rGO electrode, a hybrid supercapacitor (HSC) device was prepared with BiSI–rGO as the negative electrode and commercial Ni(OH)2 electrode (its physical and electrochemical characterisations are showed in Fig. S5†) as the positive electrode, and was tested in 3 M KOH electrolyte. The choice of commercial Ni(OH)2 as the positive electrode is due to its excellent stability of electrochemical performance. It shows a stable capacity between 300 C g−1 to 280 C g−1 with discharge current from 1 A g−1 to 10 A g−1. Fig. 6C shows the CV curve of the hybrid device under different scan rates from 10 to 50 mV s−1 in the voltage range of 0 to 1.4 V. The well-defined redox reaction peak is clearly visible, indicating that the HSC device has fast charge and discharge performance. Fig. 6C shows the GCD curve of the HSC device under the 0 to 1.4 V voltage platform, which further reflects the energy storage performance. Nickel-based material was chosen as the positive electrode because its suitable potential range and has been widely proven as high performance electrode.51 The specific capacity obtained is 57 C g−1 at current density of 1 A g−1. In addition, Fig. S5E† shows the cycle performance of the HSC device and the BiSI–rGO HSC device retains 86% of the initial capacity which is much higher than 74% of BiSI HSC device after 2000 cycles at the discharge current of 10 A g−1, indicating that the HSC device has good stability and rGO coating significantly improves the capacity retention. The Ragone diagram of the relationship between energy and power density is shown in Fig. S5F† to evaluate the actual performance of HSC devices. The energy density of the BiSI–rGO//Ni(OH)2 device is 15.2 W h kg−1 at the power density of 807 W kg−1 and still maintains 6.3 W h kg−1 at a higher power density of 4745 W kg−1. These results confirm that the prepared BiSI–rGO is expected to become an excellent candidate for hybrid supercapacitor anode materials.
To further probe the charge-storage mechanism of the Bi-based materials under cycling, the electronic structure of bismuth was studied by extended X-ray absorption fine structure (EXAFS) and X-ray absorption near edge structure (XANES) and the bismuth L3-side XANES. Fig. 7A presents the normalised XANES spectra of Bi foil and Bi(III) oxide compounds in addition to the ‘dry’ nanostructured BiSI–rGO and BiSI electrodes (prior to flooding the cell with electrolyte). Comparison against the Bi foil and standard oxide compound reference suggested the Bi present in both BiSI–rGO and BiSI were in an intermediate state between Bi0 and Bi3+, which is due to the Bi bonding to S, a less electronegative element than O, and therefore the average oxidation state of Bi is found to be lower than in the Bi2O3 standard.52,53 Linear combination fit (LCF) analysis was used to estimate the oxidation state of Bi (Table S1†), and results indicate that the oxidation state of Bi in BiSI–rGO (1.6) is lower than that of BiSI (1.9), which could be caused by the partial substitution of S by C, which is less electronegative, on the active site. These results are consistent with the XPS analysis. Fig. 7B shows the comparison between the Fourier transform (FT) of the experimental spectra (black lines) and the best-fit simulations (red lines) for BiSI–rGO and BiSI (k-space data are shown Fig. S6†). The first peak at around 2 Å (without phase correction) corresponds to the first coordination shell (Bi–S). The second peak, above 3 Å, is associated with the second shell, which is a combination of Bi–I, Bi–S and Bi–Bi single scattering. The starting model to fit the data was constructed using a published structural model39 which was refined from powder XRD data using the Rietveld refinement technique, and the coordination numbers fixed to their crystallographic values. The amplitude reduction factor (S02), bond lengths, Debye–Waller factors (σ2) and the energy shift parameter (ΔE0) were refined. The best-fit parameters are summarised in Table S2.†
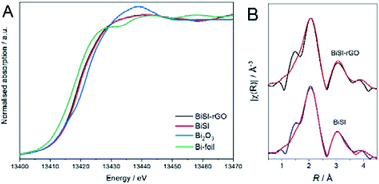 | ||
| Fig. 7 (A) Normalized Bi LIII-edge XANES spectra. (B) Data (black lines) and fits (red lines) of the FT signal of the k2-weighted EXAFS. | ||
To better understand the structural and chemical changes undergone by Bi in both BiSI–rGO and BiSI, in situ XAS measurements were employed to study the whole chemical reduction and oxidation process of BiSI–rGO electrode, using a purpose-made electrochemical cell based on the design of a published ref. 54 using beamline B18 at Diamond Light Source. Fig. 8 shows the XANES spectra for BiSI–rGO (A, B) and BiSI (C, D) for the cathodic (A, C) and anodic (B, D) scan directions. It can be observed that as the potential is made more negative, the position of the edge shifts to lower energies, indicating a reduction of the Bi atoms, as well as the appearance of the A1 and A2 peaks (see Fig. S7†), characteristic of a Bi metallic state (Fig. 7A). As the potential is swapped back in the anodic scan, these peaks start to become faint until they disappeared. The changes in the oxidation state were further analysed by LCF analysis and are presented in Tables S3 and S4.† The oxidation state of bismuth did not change until the potential reached −0.8 V, which indicates that Bi3+ started to be reduced at −0.8 V. Meanwhile, during the oxidation process, the oxidation state of bismuth did not significantly increase until −0.7 V and had an obvious jump at −0.4 V indicating two oxidation peaks. This is in complete agreement with the CV scan result shown in Fig. 5C. It can be noticed that in the whole redox process, most Bi3+ can be reduced to Bi0, but part of Bi0 cannot be oxidized to Bi3+ after the oxidation process. This is in agreement with our previous research that the bismuth metal agglomerated on the surface of BiSI and is the main reason for the capacity decrease of BiSI.28Fig. 9 shows the XANES (A) and Fourier transforms of the EXAFS (B) data collected before and after subjecting the materials to stability test (LCF analysis results are presented in Table S6†). Datasets confirm that although the oxidation state of the materials recovers, the samples suffer irreversible structural changes. Study of the final structure of the materials is outside the scope of the current study. Fig. 9B shows that the Bi–S peak at around 2 Å of BiSI–rGO sample still can be seen after 1000 cycles, but this peak for BiSI sample shifted. The mean oxidation state of bismuth in BiSI–rGO sample is 2.7 which is much higher than 1.8 in BiSI sample after 1000 cycles. This suggests that the BiSI sample is degrading and Bi metal particles are forming, which are not re-oxidised on cycling, which is confirmed by SEM. The SEM image of BiSI (Fig. S9†) shows the sample has degraded on cycling, with the needle-like morphology of BiSI almost gone and presence of metallic Bi particles, as confirmed by EDS. The rGO–BiSI sample (Fig. S8†) still shows the presence of BiSI needles and suggest the rGO coating has enhanced the stability of this phase significantly reducing the agglomeration of non-oxidizable Bi metal on the surface of the active substance. These results prove that our novel route to uniformly coated rGO on the BiSI can change the electronic structure of bismuth, and effectively prevents the agglomeration of non-oxidizable Bi particles on the electrode surface, thus improving the capacity retention of the electrode.
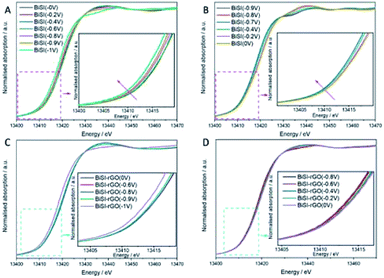 | ||
| Fig. 8 In situ Bi LIII-edge XANES spectra of BiSI–rGO (A, B) and BiSI (C, D) in 1 M KOH under a cathodic (A, C) and anodic (B, D) scan. | ||
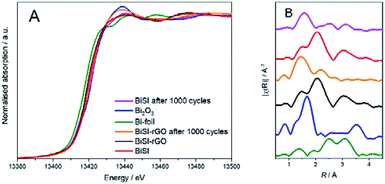 | ||
| Fig. 9 (A) Normalized Bi LIII-edge XANES spectra. (B) Fourier transformed signal of the k2-weighted EXAFS. | ||
Based on the clear evidence of uniform and chemically-attached rGO seen by several of the techniques presented above, the possible formation mechanism of uniformly coated BiSI–rGO composite can be explained by a novel synthesis route. First, Bi3+ ions react with ethylene glycol (EG) in the solution to form a relatively stable compound Bi2(OCH2CH2O)3 owing to its strong coordination with Bi3+, leading to complete dissolution of Bi(NO3)3 in the solvent.48 Second, the Bi ions were anchored to the GO surface due to the chemical bonding with the –OH groups and defects on the GO surface. Third, the sulfur and iodine ions in the solution begin to react with bismuth ions that are anchored on the GO surface to form needle-like BiSI, while GO begins to curl onto the generated BiSI surface. Finally, the rGO is uniformly coated on the needle-like BiSI surface. In order to prove this mechanism, we used different sizes of GO to synthesize rGO-coated BiSI samples to determine whether the size of GO will influence the particle size of rGO coated BiSI samples. The sample using GO with an average size of about 3–4 μm are labelled BiSI–rGO-1, the sample using GO with an average size of about 200 nm is marked as BiSI–rGO-2, and the original BiSI–rGO sample used 1 μm GO. Their morphologies are shown in Fig. 10 and it can be obviously seen that the particle length of needle-like GO coated BiSI samples become smaller with the decrease in average size of GO nanosheet. BiSI–rGO-1, BiSI–rGO-2 and BiSI–rGO samples have an average length of around 2–3 μm, 250–300 nm, and about 1 μm, respectively. This indicates that the assembly process of our route does not involve synthesis of the needle like BiSI first, then coating with rGO on its surface, since the size of GO would then not influence the length and morphology of BiSI crystal. The most possible process is that bismuth ions are anchored on the GO surface first by chemical bonding. During the synthesis of BISI–rGO, GO is simultaneously bent along with the formation of needle-like BiSI crystals and finally uniformly coated on the surface of BiSI. The size of GO nanosheet will determine the final length of rGO coated BiSI samples because most bismuth ions have already been anchored on the surface of GO. In addition, the specific capacity and electrical conductivity of BiSI–rGO-1, BiSI–rGO-2 and BiSI–rGO electrodes with different rGO ratio are compared in Table S6,† and it can be seen that the BiSI–rGO electrode with rGO ratio of 0.12 has the highest specific capacity and faradaic efficiency. Although the BISI–rGO-2 sample has a smaller particle size, its needle-like particles aggregate together to form a cluster, reducing electrical conductivity and capacity.
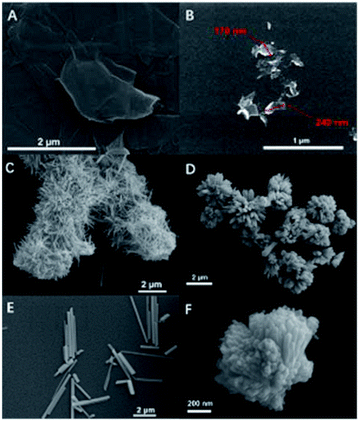 | ||
| Fig. 10 SEM image of GO nanosheet used to synthesize BiSI–rGO-1 (A) and images of BiSI–rGO-1 (C and E). SEM image of GO nanosheet used to synthesize BiSI–rGO-2 (B) and images of BiSI–rGO-2 (D and F). | ||
Conclusions
In summary, a novel method was used to synthesize BiSI–rGO composites with uniform rGO coating on the surface, templated via chemical bonding, rather than a physical mixture of the two components. A hybrid supercapacitor (HSC) device based on the BiSI–rGO electrode has been successfully fabricated representing excellent supercapacitive properties with a high energy density of 15.2 W h kg−1 at a power density of 807 W kg−1 over a potential window of 1.4 V and good capacity retention (86% after 2000 cycles). Moreover, in situ XANES and EXAFS were employed to study the chemical and electronic structure of bismuth at different voltages during the entire electrochemical reduction and re-oxidation process. The results show that our rGO coating route led to high conductivity of rGO to improve the conductivity of the composite, which we suggest may be due to the Bi bonding directly to the C of the rGO, as confirmed by XPS. The non-oxidizable Bi covering the electrode surface after reduction has been proven to be a key factor affecting the reversible cycling stability of Bi-based electrode materials and our rGO coating can effectively inhibit non-oxidizable bismuth accumulation on the electrode surface, thereby effectively improving the capacity retention. This research not only demonstrates a route to uniformly coat rGO on bismuth-based materials by chemical bonding but also provides a new idea to improve the reversible cycling stability of Bi-based material for capacitor applications.Experimental
Materials
All reagents were obtained from commercial suppliers (Acrōs Organics, Sigma Aldrich, Fluka) and used as received unless otherwise stated. Solvents used were of analytical grade (Sigma Aldrich, Fisher Scientific, VWR Chemicals, and Cambridge Isotope Laboratories).Synthesis
Two different routes were used to synthesize rGO coated BiSI. First, 0.485 g (1 mmol) Bi(NO3)3·5H2O was dissolved in 20 mL ethylene glycol under vigorous stirring. Then 40 ml ethanol containing dispersed graphene oxide (GO) nanosheets (48 mg) was added to this solution and stirred for 4 hours. BiSI–rGO-1, BiSI–rGO-2 and BiSI–rGO samples used GO nanosheets with an average length of around 2–3 μm, 250–300 nm, and about 1 μm, respectively. The size of GO nanosheet was controlled by the ultrasonication time in ethanol. After that, 0.456 g (6 mmol) thiourea and 0.254 g (1 mmol) I2 were mixed and ground in a mortar and pestle for 20 minutes. This powder mixture and the solution were transferred to a 100 mL Teflon-lined autoclave. The autoclave was heated to 160 °C for 15 hours and was then cooled to room temperature. The final product was washed and centrifuged several times with ethanol and deionized water until the liquid became clear. The precipitate was dried in an oven at 40 °C for 12 hours. The product of this route had a yield of 87%. For comparison, the sample BiSI–mix was also synthesized by a hydrothermal route. In a detailed synthesis, 0.485 g (1 mmol) Bi(NO3)3·5H2O was add to 40 mL ethanol that contained 48 mg graphene oxide (GO) nanosheets under vigorous magnetic stirring for 4 h. After that, 0.456 g (6 mmol) thiourea and 0.254 g (1 mmol) I2 were mixed and ground in a mortar and pestle for 20 minutes. Then this powder mixture and the solution were transferred to a 100 mL Teflon-lined autoclave. The autoclave was heated to 160 °C for 15 hours and was then cooled to room temperature. The precipitate was also washed and dried at the same condition as BiSI–rGO samples.Conflicts of interest
The authors state there are no conflicts to declare.Acknowledgements
The authors wish to acknowledge the Diamond Light Source for the provision of beamtime (SP25651). We thank Dr Aaron Naden for performing the SEM and TEM measurements in the University of St. Andrews. We thank Dr Stephen Francis for help in performing XPS measurements. We thank Dr Andrey Gromov for the help of performing Raman measurements.Notes and references
- N. Choudhary, C. Li, J. Moore, N. Nagaiah, L. Zhai, Y. Jung and J. Thomas, Adv. Mater., 2017, 29, 1605336 CrossRef.
- L. Fan, K. Lin, J. Wang, R. Ma and B. Lu, Adv. Mater., 2018, 30, 1800804 CrossRef PubMed.
- A. S. Levitt, M. Alhabeb, C. B. Hatter, A. Sarycheva, G. Dion and Y. Gogotsi, J. Mater. Chem. A, 2019, 7, 269–277 RSC.
- W. Raza, F. Ali, N. Raza, Y. Luo, K.-H. Kim, J. Yang, S. Kumar, A. Mehmood and E. E. Kwon, Nano Energy, 2018, 52, 441–473 CrossRef CAS.
- J. Libich, J. Máca, J. Vondrák, O. Čech and M. Sedlaříková, J. Energy Storage, 2018, 17, 224–227 CrossRef.
- L. L. Zhang and X. S. Zhao, Chem. Soc. Rev., 2009, 38, 2520–2531 RSC.
- D. L. Chapman, Philos. Mag., 1913, 25, 475–481 Search PubMed.
- E. Frackowiak, Phys. Chem. Chem. Phys., 2007, 9, 1774–1785 RSC.
- M. Gouy, J. Phys. Theor. Appl., 1910, 9, 457–468 CrossRef.
- Z. Song, H. Duan, L. Miao, L. Ruhlmann, Y. Lv, W. Xiong, D. Zhu, L. Li, L. Gan and M. Liu, Carbon, 2020, 168, 499–507 CrossRef CAS.
- C.-F. Liu, Y.-C. Liu, T.-Y. Yi and C.-C. Hu, Carbon, 2019, 145, 529–548 CrossRef CAS.
- H. Peng, B. Yao, X. Wei, T. Liu, T. Kou, P. Xiao, Y. Zhang and Y. Li, Adv. Energy Mater., 2019, 9, 1803665 CrossRef.
- G. Zhang, T. Guan, N. Wang, J. Wu, J. Wang, J. Qiao and K. Li, Chem. Eng. J., 2020, 399, 125818 CrossRef CAS.
- L. Zang, Q. Liu, J. Qiu, C. Yang, C. Wei, C. Liu and L. Lao, ACS Appl. Mater. Interfaces, 2017, 9, 33941–33947 CrossRef CAS PubMed.
- Y. Wang, F. Chen, Z. Liu, Z. Tang, Q. Yang, Y. Zhao, S. Du, Q. Chen and C. Zhi, Angew. Chem., Int. Ed., 2019, 58, 15707–15711 CrossRef CAS PubMed.
- F. Gao, J. Song, H. Teng, X. Luo and M. Ma, Chem. Eng. J., 2021, 405, 126915 CrossRef CAS.
- Q. X. Xia, N. M. Shinde, J. M. Yun, T. Zhang, R. S. Mane, S. Mathur and K. H. Kim, Electrochim. Acta, 2018, 271, 351–360 CrossRef CAS.
- W. Zuo, C. Xie, P. Xu, Y. Li and J. Liu, Adv. Mater., 2017, 29, 1703463 CrossRef PubMed.
- W. Lu, J. Shen, P. Zhang, Y. Zhong, Y. Hu and X. W. Lou, Angew. Chem., Int. Ed., 2019, 58, 15441–15447 CrossRef CAS PubMed.
- S. Hou, X. Xu, M. Wang, Y. Xu, T. Lu, Y. Yao and L. Pan, J. Mater. Chem. A, 2017, 5, 19054–19061 RSC.
- X. Zhai, J. Gao, X. Xu, W. Hong, H. Wang, F. Wu and Y. Liu, J. Power Sources, 2018, 396, 648–658 CrossRef CAS.
- L. Yang, Y. Hu and L. Zhang, Chem. Eng. J., 2019, 378, 122092 CrossRef CAS.
- N. M. Shinde, Q. X. Xia, J. M. Yun, R. S. Mane and K. H. Kim, ACS Appl. Mater. Interfaces, 2018, 10, 11037–11047 CrossRef CAS.
- S. S. Patil, D. P. Dubal, V. G. Deonikar, M. S. Tamboli, J. D. Ambekar, P. Gomez-Romero, S. S. Kolekar, B. B. Kale and D. R. Patil, ACS Appl. Mater. Interfaces, 2016, 8, 31602–31610 CrossRef CAS.
- D. Yan, X. Fu, Z. Shang, J. Liu and H. a. Luo, Chem. Eng. J., 2019, 361, 853–861 CrossRef CAS.
- D. Moitra, C. Anand, B. K. Ghosh, M. Chandel and N. N. Ghosh, ACS Appl. Energy Mater., 2018, 1, 464–474 CrossRef CAS.
- Q. Pan, C. Yang, Q. Jia, W. Qi, H. Wei, M. Wang, S. Yang and B. Cao, Chem. Eng. J., 2020, 397, 125524 CrossRef CAS.
- H. Sun, G. Yang, J. Chen, C. Kirk and N. Robertson, J. Mater. Chem. C, 2020, 8, 13253–13262 RSC.
- Z. J. Zhang, Q. C. Zheng and L. Sun, Ceram. Int., 2017, 43, 16217–16224 CrossRef CAS.
- S. Dutta, S. Pal and S. De, New J. Chem., 2018, 42, 10161–10166 RSC.
- H. Wu, J. Guo and D. a. Yang, J. Mater. Sci. Technol., 2020, 47, 169–176 CrossRef.
- S. J. Patil, D. P. Dubal and D.-W. Lee, Chem. Eng. J., 2020, 379, 122211 CrossRef CAS.
- Y. K. Penke, A. K. Yadav, P. Sinha, I. Malik, J. Ramkumar and K. K. Kar, Chem. Eng. J., 2020, 390, 124000 CrossRef CAS.
- J. Zheng, X. Pan, X. Huang, D. Xiong, Y. Shang, X. Li, N. Wang, W.-M. Lau and H. Y. Yang, Chem. Eng. J., 2020, 396, 125197 CrossRef CAS.
- K. Krishnamoorthy, P. Pazhamalai, V. K. Mariappan, S. Manoharan, D. Kesavan and S.-J. Kim, Adv. Funct. Mater., 2021, 31, 2008422 CrossRef CAS.
- M.-Y. Li, C.-H. Chen, Y. Shi and L.-J. Li, Mater. Today, 2016, 19, 322–335 CrossRef CAS.
- T. Shen, L. Yang, M. E. Pam, Y. Shi and H. Y. Yang, J. Mater. Chem. A, 2020, 8, 22488–22506 RSC.
- C. Sengottaiyan, N. A. Kalam, R. Jayavel, R. G. Shrestha, T. Subramani, S. Sankar, J. P. Hill, L. K. Shrestha and K. Ariga, J. Solid State Chem., 2019, 269, 409–418 CrossRef CAS.
- W. Hasse-Wessel, Naturwissenschaften, 1973, 60, 474 CrossRef.
- K. S. Novoselov, V. I. Fal′ko, L. Colombo, P. R. Gellert, M. G. Schwab and K. Kim, Nature, 2012, 490, 192–200 CrossRef CAS.
- E. Paek, A. J. Pak, K. E. Kweon and G. S. Hwang, J. Phys. Chem. C, 2013, 117, 5610–5616 CrossRef CAS.
- H. Kalpen, W. Hoenle, M. Somer, U. Schwarz, K. Peters, H. Von Schnerig and R. Blachnik, ChemInform, 1998, 29, 36 Search PubMed.
- A. Fuertes, G. Lota, T. Centeno and E. Frackowiak, Electrochim. Acta, 2005, 50, 2799–2805 CrossRef CAS.
- P. Simon, Y. Gogotsi and B. Dunn, Science, 2014, 343, 1210–1211 CrossRef CAS.
- W. Li, D. Chen, Z. Li, Y. Shi, Y. Wan, G. Wang, Z. Jiang and D. Zhao, Carbon, 2007, 45, 1757–1763 CrossRef CAS.
- B. Sarma, A. L. Jurovitzki, Y. R. Smith, S. K. Mohanty and M. Misra, ACS Appl. Mater. Interfaces, 2013, 5, 1688–1697 CrossRef CAS PubMed.
- E. Miniach and G. Gryglewicz, J. Mater. Sci., 2018, 53, 16511–16523 CrossRef CAS.
- J. Zhao, Z. Li, T. Shen, X. Yuan, G. Qiu, Q. Jiang, Y. Lin, G. Song, A. Meng and Q. Li, J. Mater. Chem. A, 2019, 7, 7918–7931 RSC.
- X. Yu, J. Zhou, Q. Li, W.-N. Zhao, S. Zhao, H.-M. Chen, K. Tao and L. Han, Dalton Trans., 2019, 47, 14908–14916 RSC.
- S. Zhang, K. Xu and T. Jow, Electrochim. Acta, 2006, 51, 1636–1640 CrossRef CAS.
- V. K. Mariappan, K. Krishnamoorthy, P. Pazhamalai, S. Natarajan, S. Sahoo, S. S. Nardekar and S.-J. Kim, Nano Energy, 2020, 77, 105248 CrossRef CAS.
- E. Zhang, T. Wang, K. Yu, J. Liu, W. Chen, A. Li, H. Rong, R. Lin, S. Ji and X. Zheng, J. Am. Chem. Soc., 2019, 141, 16569–16573 CrossRef CAS PubMed.
- Z. Wang, C. Wang, Y. Hu, S. Yang, J. Yang, W. Chen, H. Zhou, F. Zhou, L. Wang and J. Du, Nano Research, 2021, 1–7 Search PubMed.
- A. M. Wise, P. W. Richardson, S. W. T. Price, G. Chouchelamane, L. Calvillo, P. J. Hendra, M. F. Toney and A. E. Russell, Electrochim. Acta, 2018, 262, 27–38 CrossRef CAS.
Footnotes |
| † Electronic supplementary information (ESI) available: SEM, BET plots and XANES spectra. See DOI: 10.1039/d1ta02988f |
| ‡ These authors contributed equally to this work. |
| This journal is © The Royal Society of Chemistry 2021 |

