
Post-transition metal/polymer composites for the separation and sensing of alkali metal ions†
Salma
Merhebi
a,
Munirah
Mohammad
a,
Mohannad
Mayyas
 a,
Roozbeh
Abbasi
a,
Chengchen
Zhang
a,
Shengxiang
Cai
a,
Franco
Centurion
a,
Wanjie
Xie
a,
Zhenbang
Cao
a,
Junma
Tang
a,
Md Arifur
Rahim
a,
Jin
Zhang
b,
Amir
Razmjou
ac,
Greg
Leslie
a,
Kourosh
Kalantar-Zadeh
*a,
Jianbo
Tang
*a and
Francois-Marie
Allioux
*a
a,
Roozbeh
Abbasi
a,
Chengchen
Zhang
a,
Shengxiang
Cai
a,
Franco
Centurion
a,
Wanjie
Xie
a,
Zhenbang
Cao
a,
Junma
Tang
a,
Md Arifur
Rahim
a,
Jin
Zhang
b,
Amir
Razmjou
ac,
Greg
Leslie
a,
Kourosh
Kalantar-Zadeh
*a,
Jianbo
Tang
*a and
Francois-Marie
Allioux
*a
aSchool of Chemical Engineering, University of New South Wales (UNSW), Sydney, New South Wales 2052, Australia. E-mail: k.kalantar-zadeh@unsw.edu.au; jianbo.tang@unsw.edu.au; f.allioux@unsw.edu.au
bSchool of Mechanical and Manufacturing Engineering, UNSW, Sydney, New South Wales 2052, Australia
cCentre for Technology in Water and Wastewater, University of Technology Sydney, New South Wales, Australia
First published on 27th May 2021
Abstract
The separation and sensing of alkali metal ions from aqueous lithium resources is of great importance for building future renewable and lithium-based energy storage technologies. As such, interest arises for the development of functional composites selective to ionic lithium (Li+) over sodium (Na+) and potassium (K+) that allows for a range of low carbon-footprint sensing and recovery processes. Here, selective separation of Li+ from aqueous mixtures of Na+ and K+ ions using polyvinyl alcohol/maleic acid composites was enhanced by the inclusion as nano-additives of post-transition metals gallium (Ga) and indium (In), together with their alloys and oxidized species, in the composite casting process. The co-addition of Ga and In resulted in the spontaneous formation of Ga oxides and hydroxides while In remained in the metallic state. This Ga–In composite was stable in aqueous solutions containing a high concentration (0.1 M) of mixed alkali metal ions over 5 days and achieved exceptionally high selectivities of Li+ over Na+ (3.8 ± 0.1) and K+ (7.1 ± 0.1). Results from an electrochemical sensing platform technique revealed that Li+ selectivity was in the same order as the diffusion rates. This work demonstrated that the low-melting-point post-transition metal alloy enables a one-step low energy fabrication of selective polymeric composites with diverse applications for energy, sensing and separation industries. The work has implications for the efficient manufacture of renewable and lithium-based energy storage technologies.
Introduction
Post-transition metals are a class of materials considered as metalloids with low melting points that exhibit peculiar properties such as mixed metallic and covalent bonding within their structures.1,2 Particularly, gallium (Ga) and indium (In), and their oxides, show unique lithiation properties.3–5 For instance, one atom of Ga can host two atoms of lithium (Li).6 Bulk Ga forms an eutectic alloy with lithium at a reported temperature as low as 27.5 ± 2 °C for 1.7 at% (atomic percentage) Li.7 Similarly, In forms a wide range of intermetallic compounds with Li and presents a high lithium ion (Li+) diffusion coefficient within its semi-metallic matrix.8 As such, both Ga and In-based metals, alloys and oxides present high affinity to Li ionic species and compounds and are outstanding candidates to explore new Li recovery pathways. In addition, due to their low-melting points, pure Ga, In and their alloys can be processed into nanoparticles decorated by surface oxide nanostructures.9–13 These nanostructured additives can be included into various polymeric matrices to form composites presenting attractive properties for ions sensing and selective ions recovery such as Li+.The recovery of Li+ with low environmental impact and carbon-footprint is necessary for the development of sustainable energy systems that combine renewable and battery storage.14,15 The global lithium demand for battery manufacturing is expected to double by 2030 as the transition to intelligent energy systems occurs.15,16 Conventional hard rock Li mining and high-temperature refining operations negatively impact the carbon emission reduction strategy of battery energy storage applications.15,17 In contrast, the extraction of Li+ from brines is considered to have up to 50% lower carbon footprint. However, the extraction of Li+, from these unconventional resources including continental, oil fields or geothermal brines, seawater, and waste streams, is currently impaired by the lack of selective and stable separation materials.17,18
In classical ionic separation processes, the efficient recovery of Li+ is limited by the difficulty in separating Li+ from other alkali metal ions.18–20 Ionic sodium (Na+) and potassium (K+) exhibit similar chemical properties including the same valence and close ionic radii for physical separation.18,21 The reversible ionic selectivity of a material is reported to arise from the energy of interactions between hydrated ions and functional binding sites.18,22 A number of materials have been proposed for the selective separation of Li+ in aqueous media but the development of materials with high selectivity, reversibility and stability remains challenging at scale.18,22,23
Functional materials are often deposited at the surface of a polymeric support as a selective layer or embedded into a polymeric matrix as selective additives.9,24–28 The polymeric material provides additional mechanical support to the fillers, which can either be inert or play an active role such as facilitating the diffusion of ionic species.29,30 For the separation of alkali metal ions and the recovery of Li+ mixed in solution with Na+ and K+, the base polymeric matrix should allow the passage of Na+ and K+, exhibit negatively charged functional groups and possess a relatively high hydrophilicity.
Here we choose polyvinyl alcohol (PVA) as a hydrophilic, semicrystalline polymer that presents a charged matrix with functional hydroxyl and carbonyl groups providing high conductivity and permeability to both Na+ and K+.31–33 Strong interactions between the functional groups of PVA and Li+ were also previously reported but were shown to induce intermolecular charge transfer leading to detrimental changes in the physicochemical stability of PVA.31 Cross-linking or direct coordination with the selective additives are ways to mitigate the weakening of the PVA matrix.32,34 Ga, In and Ga–In alloys have also recently been demonstrated to be stabilized by the charged PVA matrix resulting in conductive ionic junctions between the charged groups and the metallic species.9 Considering the interactions of Li+ with PVA, Ga, In and their alloys, we investigate the possibility to use a composite of these materials for the selective sensing and separation of Li+ from Na+ and K+ in aqueous media.
In this work, Ga, In and Ga–In alloys were dispersed into a PVA solution before casting and cross-linking reaction to form thin flat-sheet composites. The low melting point of these post-transition metals and alloys allowed the preparation of the dope solutions in benign solvents and at low temperatures. The physicochemical characteristics together with the sensing and selectivity Li+ over Na+ and K+ were measured for the composites containing mixed metallic and oxide compounds. Insights on the structure and performance of the composites were used as the basis for a proposed selectivity mechanism based on hindered diffusion in aqueous solutions.
Experimental
Materials
In (beads, 99.9% purity) and Ga (beads, 99%) were purchased from Rotometals, USA. Lithium chloride (LiCl, ≥99%), sodium chloride (NaCl, ≥99%) and potassium chloride (KCl, ≥99%) were obtained from Chem-Supply Pty Ltd., Australia. PVA (Mw = 85![[thin space (1/6-em)]](https://www.rsc.org/images/entities/char_2009.gif) 000–124000 g mol−1, 99+% hydrolyzed) and maleic acid (MA, ≥99%) were procured from Sigma-Aldrich, Australia. All materials were used as received without further purification. Eutectic Ga–In (EGaIn) alloy was obtained by melting together 74.5 wt% Ga and 25.5 wt% In at 80 °C for 1 h.
000–124000 g mol−1, 99+% hydrolyzed) and maleic acid (MA, ≥99%) were procured from Sigma-Aldrich, Australia. All materials were used as received without further purification. Eutectic Ga–In (EGaIn) alloy was obtained by melting together 74.5 wt% Ga and 25.5 wt% In at 80 °C for 1 h.
Dope preparation and composite synthesis
Ga, In and EGaIn were used for the formation of nano-additives in the PVA/MA base matrix. First, a 10 wt% PVA solution was prepared by dissolving PVA powder into deionized (DI) water under mechanical stirring at 80 °C for 2 h. Then, MA (40% w/w with respect to the weight of PVA) was mixed with the solution under constant stirring for another 2 h. Ga and EGaIn composites were prepared by directly adding the metal or alloy into the PVA/MA dope solution (1:1 weight ratio), followed by sonication using a probe sonicator (VCX 750, Sonics & Materials, Inc.). The sonication was performed in a water bath to mitigate the temperature rise during the process. The power intensity of the sonicator was kept at 40% of its maximum power (750 W) for a duration set between 10 to 40 min. The In nano-additives were first prepared by melting the In beads in glycerol on a hotplate above the In melting point (>156.6 °C) and then sonicated under the same power and time duration as for the preparation of Ga and EGaIn dope solutions. The as-prepared In nano-additives were centrifuged and washed thoroughly before mixing with the PVA/MA solution (1:1 weight ratio) on a roller mixer overnight.
The dope solutions containing the nano-additives were then cast according to a wet thin film fabrication technique using a casting knife (TQC Sheen) at a traverse speed of 1 mm s−1. The gap between the clear float glass plate and the casting blade was adjusted to control the film thickness. The films were dried at ambient temperature overnight and subsequently cured in an oven at 140 °C for 90 min to cross-link the PVA/MA polymer matrix. The as-formed composites were gently peeled from the glass plate in a coagulation bath.
Characterizations
Surface wettability of the composites with different nano-additives was expressed as the average of triplicate measurements of water contact angle for each sample (KSV Cam 200). Mechanical properties were measured in triplicate on rectangular samples (length × width × thickness: 30 mm × 15 mm × 20 μm) at a loading rate of 100 mm min−1 on an Instron 3369 universal mechanical tester (Instron, UK).The glass transition temperature (TG) of the composites was determined by differential scanning calorimetry (DSC) measurements (Q20, TA Instruments) with temperatures ranging from 25 to 150 °C at 10 °C min−1 heating and cooling rates. The electrical resistances of the composites were measured using a two-probe method with a digital multimeter (model Siglent SDM3065X).
The morphologies and elemental distributions of the nano-additives within the PVA/MA matrix were characterized by scanning electron microscopy (SEM, JEOL InTouchScope, JSM-IT500HR) and energy-dispersive X-ray spectroscopy (EDS, JEOL, Ex-74600U4L2Q model). The size distributions of the nano-additives were determined from the SEM images using the ImageJ Software Package (1.52a). The average roughnesses (Ra) of the composites were determined from profilometer measurements using a KLA Tencor D-600 Stylus Profiler instrument.
The vibrational properties of the composites were characterized by Fourier transform infrared spectroscopy (FTIR, PerkinElmer spectrometer) and Raman spectroscopy (inVia Raman microscope, RENISHAW, 532 nm laser source, laser power 5%, exposure time 10 s). The X-ray diffraction (XRD) patterns were obtained using a X'pert multipurpose X-ray diffraction system (PANalytical, λ = 1.54 Å, Cu Kα radiation). Surface chemical compositions were characterized by X-ray photoelectron spectroscopy (XPS, Thermo Scientific ESCALAB 250 Xi, mono-chromated Al Kα) with a photon and pass energy of 1486.7 and 50 eV, respectively. The XPS data were analyzed with the Advantage software and a calibration using the C 1s peak at 284.8 eV.
Sensor devices were fabricated by drop-casting the dope solutions onto silver–palladium (Ag–Pd) electrodes. These electrode composites were then cross-linked following the same procedure as previously described. The electrochemical sensing experiments were performed on an electrochemical station (CHI650E).
Ionic diffusion tests were performed in a diffusion cell with LiCl, KCl, NaCl or their mixtures in one compartment of the cell (feed) and DI water on the other compartment (permeate). The conductivity in the compartments was measured using a conductivity meter (HI 8733 model). The elemental concentration in the solutions was measured using inductively coupled plasma optical emission spectroscopy (ICP-OES, Avio 500DV). Electro-diffusion experiments were also performed using the diffusion cell. A DC voltage was applied across the two compartments using platinum (Pt) electrodes placed in the feed and the permeate compartments. A DC voltage was also directly applied to the material either in series with one of the electrodes or as a stand-alone electrode.
Zeta potentials were determined using the Zeta Potential Analyzer (SurPASS, Anton Paar). Two 2 cm × 1 cm samples were mounted facing each other to form a capillary of 100 μm width; in which a measuring electrolyte of 0.001 M KCl was streamed through until reaching equilibrium. Potassium hydroxide (KOH, 0.1 M) was used for basic titration from pH 5 to 8. The streaming potential measurement was used to calculate surface zeta potential using Attract 2.0 software.
The composites fabrication, characterization, and testing were performed in a controlled laboratory environment of 21 °C average room temperature and 50% relative humidity.
Results and discussion
Composite properties
The composites used in this study have a charged and permeable polymetric PVA/MA matrix and post-transition metal nano-additives as selective fillers and were prepared as illustrated in Fig. 1a. The dope solutions were cast at different thicknesses, cured, and separated from the casting substrate in a coagulation bath to form the composites. The resulting composites fabricated with EGaIn nano-additives (named Ga–In composite thereafter) before and after coagulation bath are shown in the pictures in Fig. 1b and c. The typical Ga–In composites used for later experiments were 20 μm thick, mechanically strong, and flexible.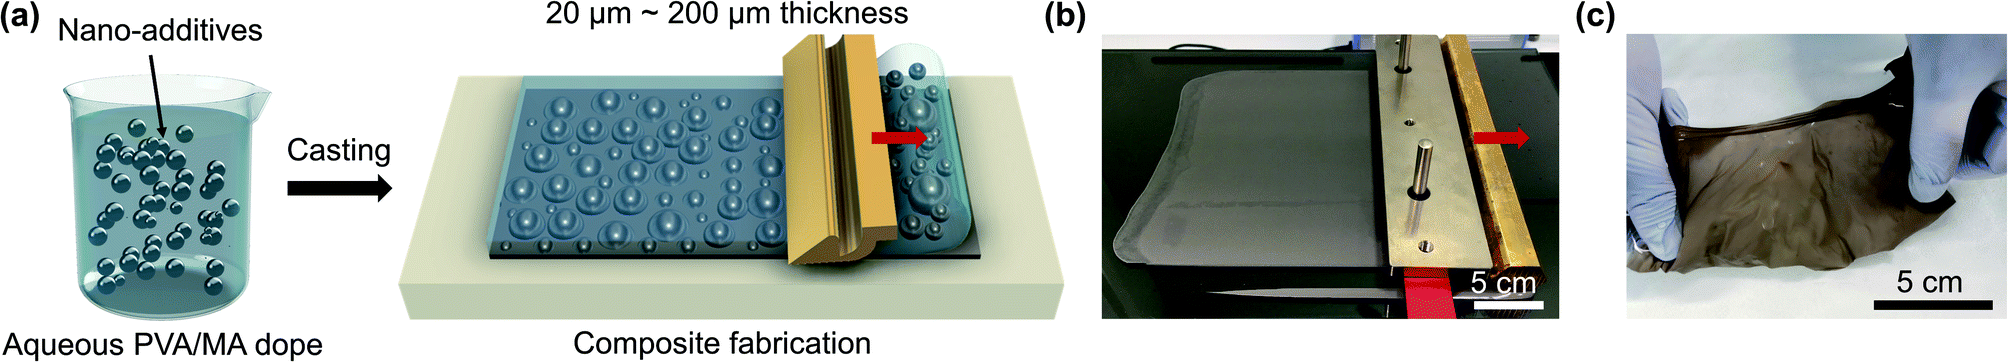 | ||
| Fig. 1 (a) Schematic illustration of the composite fabrication process. Photos of the Ga–In composites (b) before and (c) after peeling. | ||
The EGaIn nano-additives presented spherical morphologies with a size distribution of 0.5 ± 0.2 μm after 30 min of sonication (Fig. 2a). The effect of the sonication duration on the EGaIn nano-additives is reported in Fig. S1.† The average size of the EGaIn nano-additives was shown to decrease with the sonication time with no noticeable size reduction after 30 min of sonication. EGaIn alloy was chosen due to its low melting point (∼15.7 °C) that allows the formation of nano-additives in mild conditions using low-energy agitation methods compatible with a PVA-based polymeric matrix. Similarly, the as-prepared post-transition metals Ga and In nano-additives showed narrow size distributions as expected for such preparation procedure (Fig. S2, ESI†).9,35–38 As shown with the Ga–In composite surface in Fig. 2b, uniform composites with densely packed nano-additives were fabricated. The Ga–In composite showed a rough and textured surface with an average roughness of 0.66 μm, which could provide an advantage for ionic separation and sensing due to the increased exchange surface area as opposed to particulate separation.39,40 Similar composite morphologies were observed for the pure Ga and In composites as seen in Fig. S3 and S4,† respectively. The EDS elemental mapping of the sample surface (Fig. 2c) and the cross-section (Fig. 2d) showed separated Ga and In domains across the Ga–In composite, which was attributed to phase separation of the EGaIn particles during sonication.41 Furthermore, a strong oxidation of the Ga-rich phases was also observed from the oxygen elemental mapping matching the Ga elemental distribution. Similarly, the Ga particles across the Ga-composite were strongly oxidized and presented a crystalline shape representative of Ga oxide species as seen in Fig. S3.† Conversely, the pure In composite showed a distribution of round-shaped In particles that retained the initial shape of the nano-additives (Fig. S2b and S4†). It can also be inferred from the cross-section views that the nano-additives were dispersed uniformly across the thickness direction for all three Ga, In and Ga–In composites.
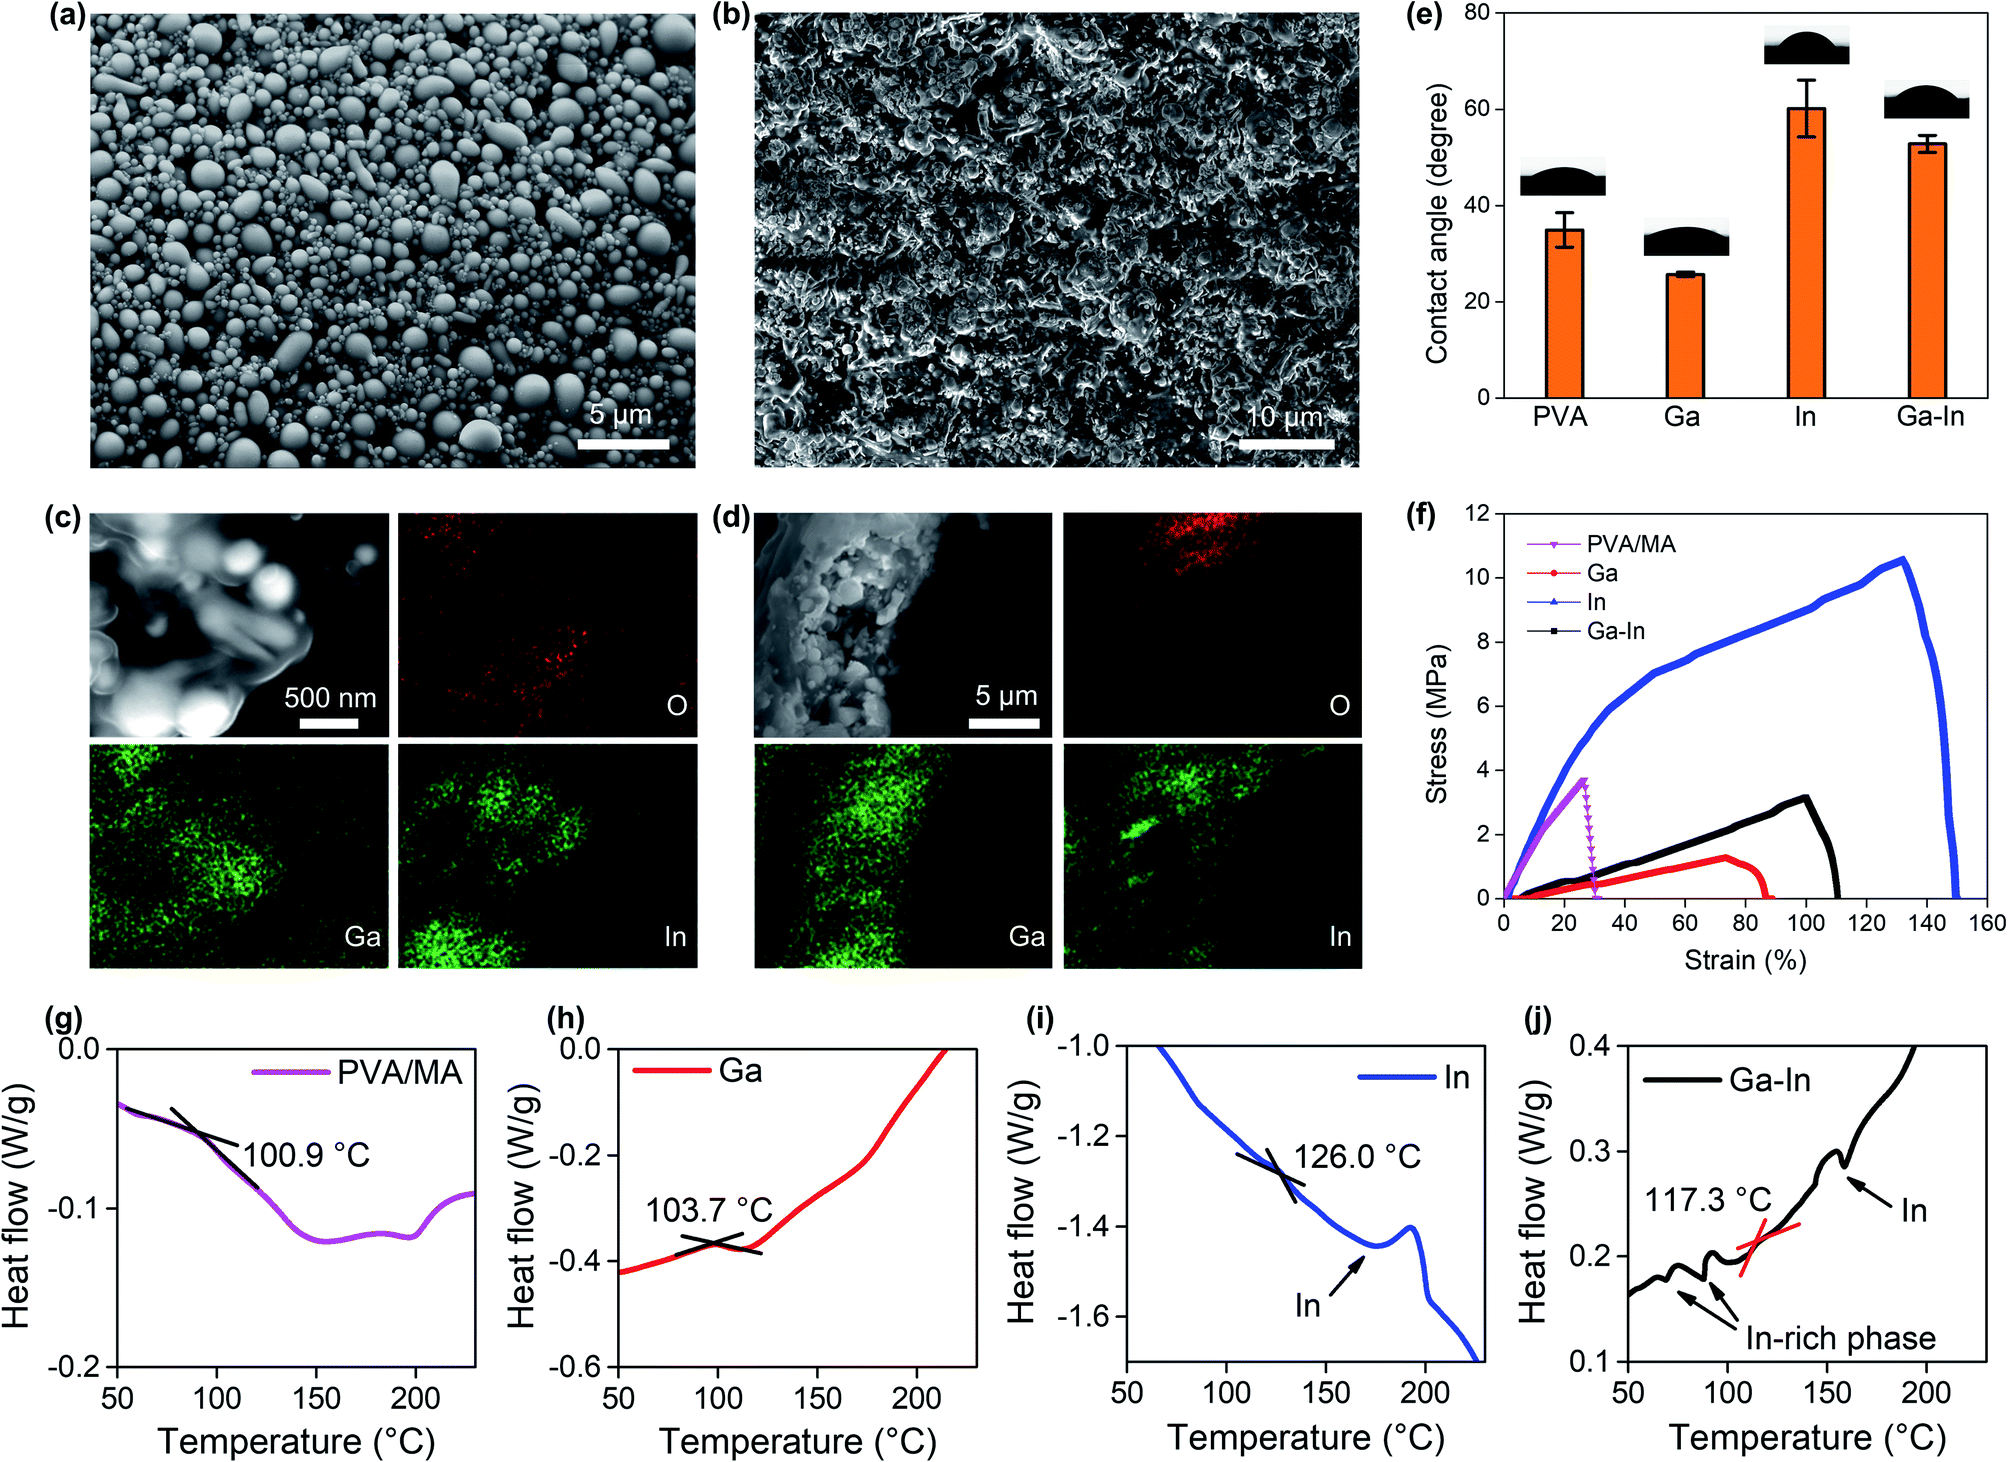 | ||
| Fig. 2 (a) SEM image of the EGaIn nano-additives. (b) SEM image of the surface of the Ga–In composite. EDS mapping of (c) the surface and (d) the cross-section of the Ga–In composite. (e) Water contact angle measurements at the surface of the composites. (f) Stress–strain curves of the composites. DSC analysis of the (g) PVA/MA, (h) Ga, (i) In and, (j) Ga–In composites. | ||
The surface wettability (hydrophilicity and hydrophobicity) of the composites, which were characterized by water contact angle, gives indication of the surface energy of the composites.42 The contact angle of the composite containing Ga nano-additives was lower as compared to the virgin PVA/MA indicating increased hydrophilicity, while in contrast the inclusion of In nano-additives increased the contact angle and produced a more hydrophobic composite (Fig. 2e). The trade-off between the influence of Ga and In resulted in an intermediate contact angle for the Ga–In composite. The change in contact angle was attributed to presence of the Ga oxide species.41
Tensile tests showed that the addition of the nano-additives into the PVA/MA matrix significantly affected both the ultimate tensile strength and Young's modulus (E) of the composites as shown in Fig. 2f. Again, the Ga–In composite showed an intermediate E (0.029 MPa) and breaking strain in comparison to the Ga (E = 0.016 MPa) and In composites (0.096 MPa). Interestingly, the degree of oxidation of the nano-additives was related to the mechanical properties of the composites. Adding Ga and Ga–In nano-additives to PVA/MA was found to reduce the E since the additives introduced highly oxidized post-transition metal nano-fillers. The higher E of the Ga–In composite as compared to the pure Ga composite can be understood by considering the inclusion of solid In nano-additives due to phase separation (Fig. 2c and d). By contrast, adding only solid In nano-additives showed a dramatic increase of the ultimate tensile strength of the composite as well as a slight increase of E.
DSC was used to measure the glass transition temperature TG of the composites. The TG of all three composites was increased as a result of the nano-additive inclusion as compared to PVA/MA polymer, indicating increased domains of crystallinity across the polymer phase of the composites (Fig. 2g–j).43 Among the three types of nano-additives, the Ga composite showed the slightest increase from 100.9 °C (PVA/MA, Fig. 2g) to 103.7 °C (Fig. 2h) while the In composite had the largest increase to 126.0 °C (Fig. 2i), with the TG of the Ga–In composite (117.3 °C, Fig. 2j) setting between the two. When In was involved (both In and Ga–In composites), sharp peaks around 156.6 °C (In melting point) was observed from the DSC curves, which were attributed to the melting of the In or In-rich (for the Ga–In composite) nano-additives, given that glass transition usually exhibits as a smooth transition.35,43
These results suggested that the presence of different post-transition metal, alloy, and oxide nano-additives to PVA/MA effectively modified the surface wettability, mechanical and thermal properties of the polymer matrix. The underlying mechanisms will be discussed later with the support of further material characterizations.
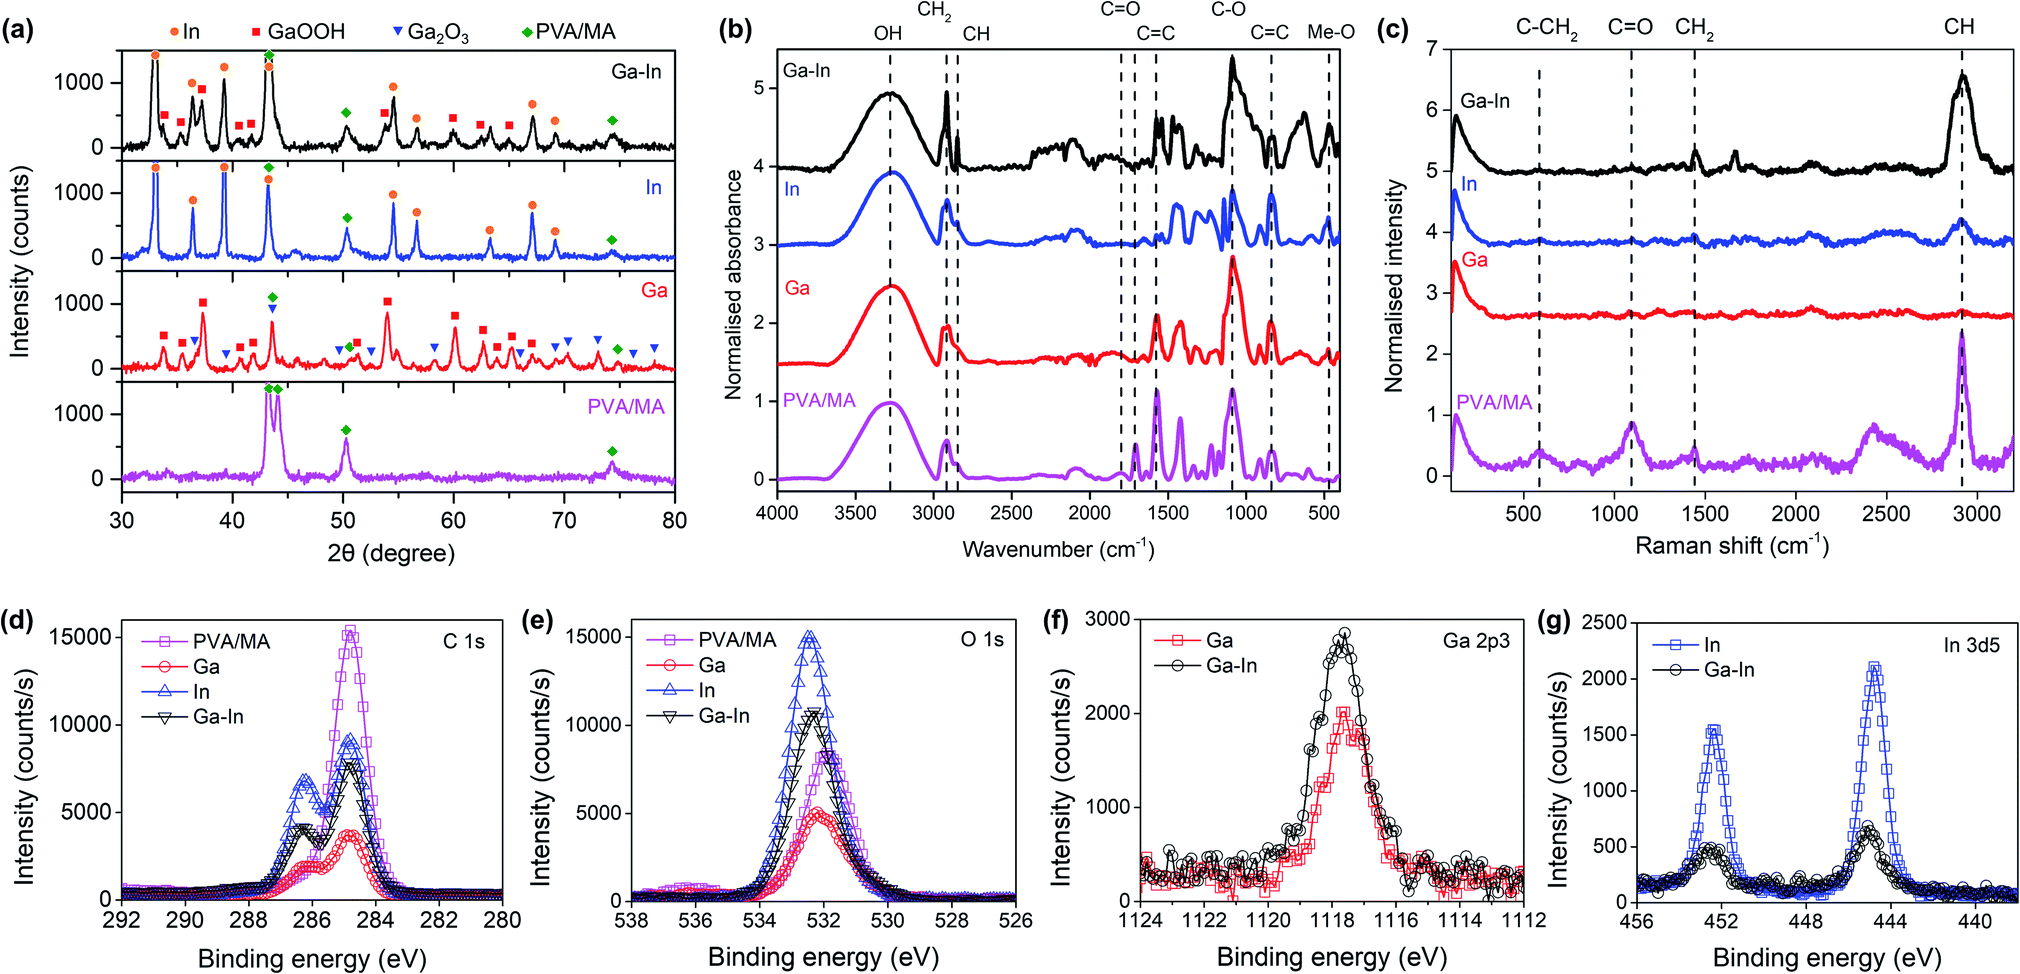
XRD analysis of the composites revealed that in the Ga composite, the Ga metal was eventually fully oxidized to form Ga2O3 and its hydrate form GaOOH (Fig. 3a). By comparison, In was largely preserved in the metallic state. The Ga–In composite also showed the existence of metallic In and the absence of metallic Ga. Comparing the XRD patterns of the composites with the PVA/MA polymer, the right-side shoulder of the characteristic PVA/MA twin peaks (2θ ≈ 43°) became insignificant (this region may also include contributions when Ga2O3 exists), indicating the alteration of the crystallinity of the PVA/MA in the composites.43 The intensity of the composites at 2θ ≈ 51°, which was exclusively contributed by PVA/MA, showed a noticeable increasing trend in the order Ga, Ga–In, and In. In this regard, the XRD results confirmed our discussion about the crystallinity change of the composites based on the DSC tests.
 | ||
| Fig. 3 (a) XRD patterns of the composites and their analysis. (b) FTIR spectra and (c) Raman spectra of the composites and their analysis. (d) High-resolution C 1s XPS spectra of the composites, and (e) high-resolution O 1s XPS spectra. (f) High-resolution Ga 2p3 XPS spectra of the Ga and Ga–In composites. (g) High-resolution In 3d5 XPS spectra of the In and Ga–In composites. | ||
As demonstrated in Fig. 3b, FTIR revealed the decreased absorbance of the composites from the C![[double bond, length as m-dash]](https://www.rsc.org/images/entities/char_e001.gif) O and CC (1707 cm−1 and 1570 cm−1, respectively), suggesting the reorganization of the PVA/MA polymeric network with the breakdown of the cross-linked chains.9,43,44 This was thought to be primarily responsible for the increased stretchability of the composites observed in the tensile tests (Fig. 2f). Increased absorbance occurred in the composites at near 500 cm−1 (denoted as Me–O), which corresponded to the coordination of the Ga and/or In with the oxygen functional groups in the polymer. The two In-containing (In and Ga–In) composites showed enhanced absorbance of –CH2– and CH while the Ga composite experienced a decrease in the corresponding regions. Since the –CH2– and CH are representative of the PVA/MA polymeric network, we expected the oxidized Ga species (Ga2O3 and GaOOH) in the composites to cause a shortening of the PVA chains, while metallic In largely preserved the PVA structure without the same shortening effect.
O and CC (1707 cm−1 and 1570 cm−1, respectively), suggesting the reorganization of the PVA/MA polymeric network with the breakdown of the cross-linked chains.9,43,44 This was thought to be primarily responsible for the increased stretchability of the composites observed in the tensile tests (Fig. 2f). Increased absorbance occurred in the composites at near 500 cm−1 (denoted as Me–O), which corresponded to the coordination of the Ga and/or In with the oxygen functional groups in the polymer. The two In-containing (In and Ga–In) composites showed enhanced absorbance of –CH2– and CH while the Ga composite experienced a decrease in the corresponding regions. Since the –CH2– and CH are representative of the PVA/MA polymeric network, we expected the oxidized Ga species (Ga2O3 and GaOOH) in the composites to cause a shortening of the PVA chains, while metallic In largely preserved the PVA structure without the same shortening effect.
The FTIR results were well matched by Raman spectroscopy as seen in Fig. 3c. The intensity of the band corresponding to CO (1090 cm−1) decreased with the addition of the nano-additives and, that of the –CH2– (1438 cm−1) and CH (2912 cm−1) bands increased with metallic In, while decreased with Ga oxide species.9,43,44
XPS showed a decreasing trend of the C–C peak intensity in the C 1s region (284.8 eV) in the sample order PVA/MA, In, Ga–In, and Ga composites (Fig. 3d).44 Meanwhile, an increasing of the C–O peak intensity in the sample order PVA/MA, Ga, Ga–In also appeared. The enhanced C–O peak intensity was also shown in the O 1s region (Fig. 3e), where the O 1s peak of the PVA/MA was shifted to higher binding energy (from ∼531.8 eV to over 532.0 eV) in all three composite samples, indicating increasing contribution of the C–O bonding. The results confirmed again that the breaking the polymer matrix and the resulting formation of the C–O bonding due to its coordination with the partially oxidized nano-additives. The Ga 2p3 and In 3d5 regions are shown in Fig. 3f and g, respectively, and XPS spectra deconvolutions are presented in Fig. S5 and S6.†
The preferential oxidation of the Ga over In nano-additives can be explained by the favorable Gibbs free energy of Ga oxide formation over In oxide, and was also previously reported to take place in EGaIn alloy.12,35,45
Applications
The developed composites presented sufficient mechanical stabilities, desirable textured hydrophilic surfaces, negatively charged functional chemical groups and incorporated the post-transition metal nano-additives in metallic form (In) or/and oxide and hydroxide species (Ga). Based on our initial hypothesis, we then investigated the composite materials for sensing and separation of Li+ from Na+ and K+ in aqueous solution.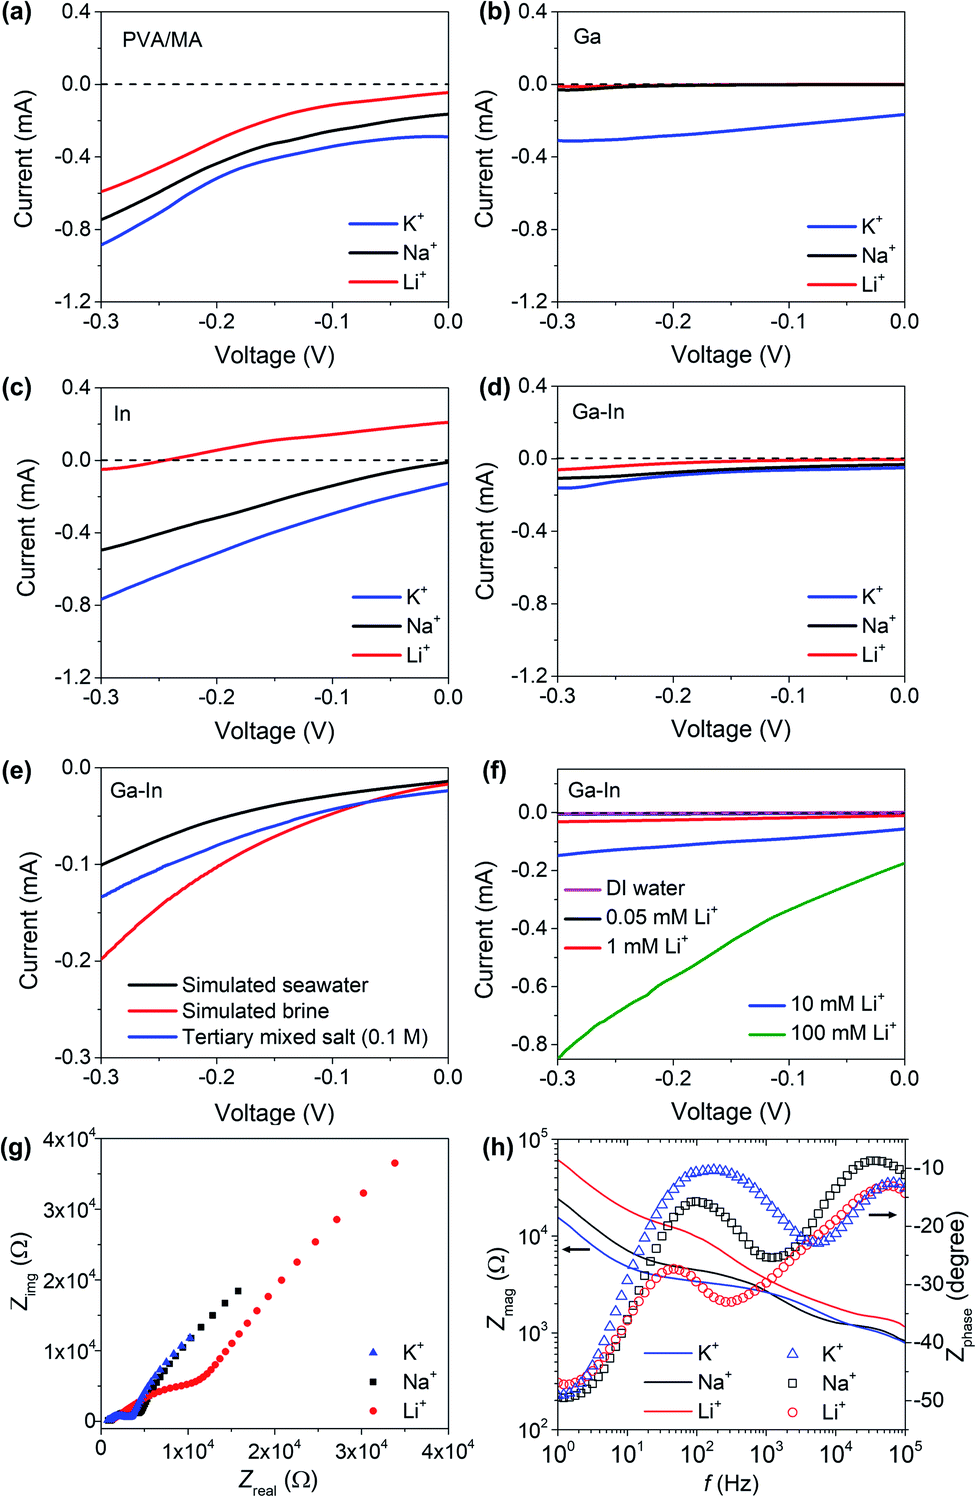 | ||
| Fig. 4 (a) LSV analysis of plain PVA/MA composite, (b) Ga composite, (c) In composite and (d) Ga–In composite in Li+, Na+ and K+ electrolytes. (e) LSV analysis of the Ga–In composite in simulated seawater, brine and tertiary solutions. (f) LSV analysis of the Ga–In composite in Li+ electrolytes. (g) EIS analysis and (h) Bode plots of the Ga–In composite in Li+, Na+ and K+ electrolytes. | ||
The LSV curves of the Ga–In composite in simulated continental brine, seawater and tertiary equimolar (0.1 M) Li+, Na+ and K+ mixtures are presented in Fig. 4e and showed an intensity-response following the relative ionic strength of the solutions. Compositions of the simulated solutions are reported in Table S1.†47 The LSV curves of the Ga–In composite in Li+ solutions with concentrations ranging from 0.05 and 100 mM were also assessed and presented in Fig. 4f. The minimum detection limit for Li+ was determined as 0.05 mM. The Ga–In composite showed a linear response in the range of 0.05 to 100 mM as presented in Fig. S7b.† The effect of the pH on the ionic diffusion trough the Ga–In composite was studied from pH = 5 to pH = 8.5, which corresponded to the reported range of pH values for brines and seawater, respectively. The LSV curves of the Ga–In composite in the tertiary mixed salt solutions showed a limited effect of the pH at 7 and 8.5 (Fig. S7c†). However, in more acidic conditions (pH = 5), the ionic diffusion was reduced, which can be attributed to the lower ionization state of the PVA matrix.32 The effect of the temperature on the ionic diffusion through the Ga–In composite was also assessed from 10 °C to 40 °C (Fig. S7d–f†). The ionic diffusion was shown to increase with the rising temperature due to the possible ionic mobility increase in solution and within the PVA matrix, similar to previous reports.32
The electrochemical impedance spectroscopy (EIS) analysis was performed on the Ga–In composite (Fig. 4g). In the Nyquist plot, semicircles were observed in the higher frequency range in all salt solutions.48–50 In the solution containing Li+, a distinct large semicircle indicated the presence of extra ohmic losses due to impeded diffusion. In the lower frequency range, the Ga–In composite also shows higher resistance for Li+ as compared to Na+ and K+. In the Bode plots of the Ga–In composite (Fig. 4h), the impedance increased steadily in the frequency range from 1.0 × 10⁵ to 1.0 Hz. Phase shifts were observed to peak at 250 Hz, 1200 Hz, and 6000 Hz for Li+, Na+, and K+, respectively. The relatively high phase shift for the Ga–In composite in the presence of Li+ at lower frequencies further suggests the impeded diffusion of the Li+ ions through the matrix of the Ga–In composite as compared to K+ and Na+.48,49 These results confirmed our assumptions that the PVA/MA matrix would allow the diffusion of K+ and Na+, as the post-transition metal fillers, and particularly Ga oxides and hydroxides, specifically hinder the diffusion of Li+ through the material via specific interactions.
 | ||
| Fig. 5 (a) Schematic representation of the diffusion cell used for the selectivity experiments in pure diffusion regime. (b) Ionic conductivity as a function of the diffusion time for the In and Ga–In composites in Li+ and mixed Li+/Na+ electrolytes. (c) Ionic conductivity as a function of the diffusion time for the Ga–In composite in single Li+, Na+ and K+ electrolytes. (d) ICP-OES mass balance between the feed and permeate compartments of a mixed Li+/Na+ separation experiment (120 min). (e) ICP-OES mass balance between the feed and permeate compartments after four successive Li+/Na+ separation experiments (60 min each). (f) Li+/Na+ separation experiments (120 min) for three different Ga–In composite thicknesses. (g) Relative concentration changes in the feed for a mixed Li+/Na+/K+ separation experiment (110 h) as determined by ICP-OES, and (h) in the permeate. (i) Selectivity ratios as a function of the diffusion time (110 h) as determined by ICP-OES. | ||
The Ga–In composites were shown to exhibit selective separation properties rather than absorptive mechanisms as confirmed by the mass balance calculations between the feed and permeate compartment for a mixed Li+/Na+ diffusion experiment (Fig. 5d), determined by ICP-OES and after 2 h of diffusion. The reversible nature of the separation mechanism and reusability of the materials was further assessed after a series of 1 h diffusion for mixed Li+/Na+ feed solutions. The mass balances and selectivity ratios were determined from ICP-OES measurements as presented in Fig. 5e. The Li+ and Na+ mass balances between the feed and permeate compartments were found to be within the measurement errors with an average Na+/Li+ selectivity ratios of 3.8 ± 0.1 confirming the reusable nature of the material.
The role of the nano-additives on the Li+ selectivity mechanisms of the Ga–In composite was confirmed by studying the diffusion of mix Li+/Na+ solutions across Ga–In composite with increasing thicknesses from 20 μm to 200 μm as seen in Fig. 5f. Increasing the thickness from 20 to 200 microns decreased the diffusivity by over 2 orders of magnitude (120 times) over 2 h. However, the Li+/Na+ selectivity ratios were conserved after pure diffusion experiments (Fig. S9d†), which indicated that the selectivity is arising from specific interactions with the nano-additives and particularly Ga oxide and hydroxide species, as opposed to an increase in composite resistance due to longer path length through the thicker composite material.51,52 In addition, the Ga–In composites were formed with EGaIn additives of different average sizes (Fig. S2†). The SEM images of the surfaces of the Ga–In composites, containing different average sizes, are shown in Fig. S10† and presented different coverage of the PVA/MA matrix by the EGaIn additives. The Ga–In composites prepared with the 1.2 ± 0.4 and 0.7 ± 0.3 μm EGaIn additives (10 and 20 min sonication times, respectively) showed surface clusters of micron-sized particles. In contrast the Ga–In composites prepared with the 0.5 ± 0.2 μm (30 and 40 min sonication times) EGaIn additives showed a more uniform surface distribution. The roughness measurements of the composites are presented in Fig. S11† and followed the SEM observations, with a Ra decreasing as a function of the average sizes of the additives. The ionic diffusion performance of the Ga–In composites were evaluated and presented in Fig. S9e.† The Ga–In composites containing clusters of micron-sized EGaIn additives (10 and 20 min sonication time) showed higher non-selective ionic diffusivities that included high Li+ transport through the composites and into the permeate as determined by ICP-OES (Fig. S9f†). These results further confirmed that the selectivity of the composites likely arises from interactions with the nano-additives present in the composites.
Finally, the continuous operation of the Ga–In composite was assessed for up to 5 days of separation experiment of a mixed tertiary Li+/Na+/K+ feed solution in pure diffusion regime. The relative concentration changes in the feed and permeate compartments were monitored by ICP-OES as seen in Fig. 5g and h, respectively and by conductivity measurements (Fig. S9g and h†). The Ga–In composite was shown to continuously operate during the 5 day long experiment with a constant separation factor as presented in Fig. 5i. Furthermore, the ionic diffusion rates were shown to decrease after the first 24 h of separation. For potential practical application, the feed and permeate would be refreshed during this timeframe for optimum separation efficiency.
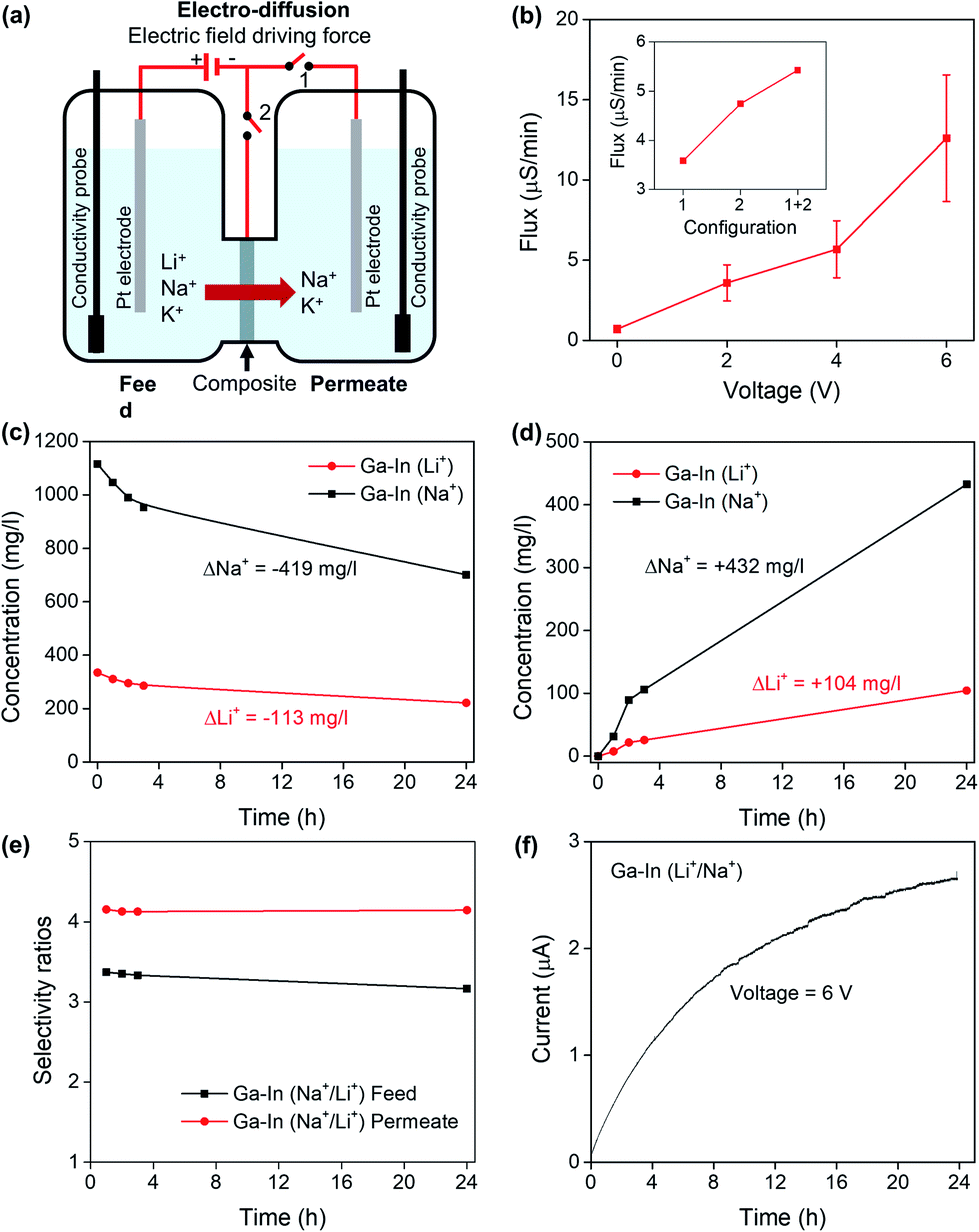 | ||
| Fig. 6 (a) Schematic representation of the electro-diffusion experiments showing the three different configurations studied (1, 2 and 1 + 2). (b) Ionic fluxes as a function of the applied DC voltage for the Ga–In composite in Li+ electrolyte and insert showing the ionic fluxes as a function of the electrode configuration for the Ga–In composite in Li+ electrolyte. (c) Relative change of ionic concentration in the feed compartment as a function of the electro-diffusion time for the Ga–In composite in mixed Li+/Na+ electrolyte at constant applied voltage (6 V), and (d) in the permeate compartment. (e) Calculated selectivity ratios as a function of the electro-diffusion time. (f) Change of intensity across the diffusion cell as a function of the electro-diffusion time. | ||
The separation of Li+/Na+ feed solutions was performed with an applied DC voltage of 6 V across the feed and permeate compartments for 24 h. The relative concentration changes across the compartments are presented in Fig. 6c and d and showed conservation of mass between the cathodic (feed) and anodic (permeate) compartments following a similar behavior as in the pure diffusion regime. Conductivity measurements in the anodic and cathodic compartments are reported in Fig. S12b and c,† respectively. The selectivity ratios were also shown to be constant across the duration of the experiment (Fig. 6e) and similar to the pure diffusion experiments. The evolution of the intensity is reported in Fig. 6f and showed a steady rise following the increase of conductivity in the permeate compartment as seen in Fig. S12c.† The Ga–In composites were shown to perform in an electro-diffusion regime without loss of Na+/Li+ selectivity while increasing the ionic flux by up to 17.8 times.
Mechanism and durability assessment
The inner morphology of the Ga–In composite, which can be related to the thickness of the material, was previously demonstrated to not affect the selectivity of the material but only the rate of diffusion (Fig. 5f and S9d†). As Li+, Na+ and K+ present the same valence and close ionic radii for physical separation, the selectivity of the Ga–In composite is related to the specific energy of interaction and stabilization between the ions and the charged domains across the composite.18,31 The selectivity of the Ga–In composite was also demonstrated to be independent of the driving force, i.e. osmotic pressure in pure diffusion or electric field in electro-diffusion regime (Fig. 6e). In these regards, it is supposed that the Ga–In composite presents specific binding sites for Li+ ions and non-specific obstacles to Na+ and K+ transport, respectively.The overall charge of the composites and plain PVA/MA was determined by zeta potential measurements as reported in Fig. 7a. The strong negative charge of the plain PVA/MA can be explained by the negatively charged hydroxyl and carbonyl functional groups across the polymeric matrix, which should provide only limited selectivity to Li+ based on the difference in charge density between Li+, Na+ and K+ ions.55,56 However, the charge surface of the PVA/MA matrix could not explain alone the impaired transport of Li+ across the Ga–In composites. The zeta potential of the Ga–In composite was 25% higher than the plain PVA/MA and similar to that of plain Ga composite. This indicates that the Li+ selectivity is likely due to strong and specific binding sites with the Ga oxide and hydroxide compounds present at the surface of the composite. The zeta potential measurements of the In composite revealed a less negatively charged surface than the other composites indicating strong coordination between the metallic In nano-additives and the functional groups of the PVA/MA matrix. A graphical representation of the proposed selectivity phenomena across the Ga–In composite is presented in Fig. 7b. The selectivity and separation performance of the Ga–In composites could be optimized with the formation of uniform nano-additives via controlled dealloying of the EGaIn particles, which could provide more enhanced active surface area and selective interstitial volume across the composites.57,58
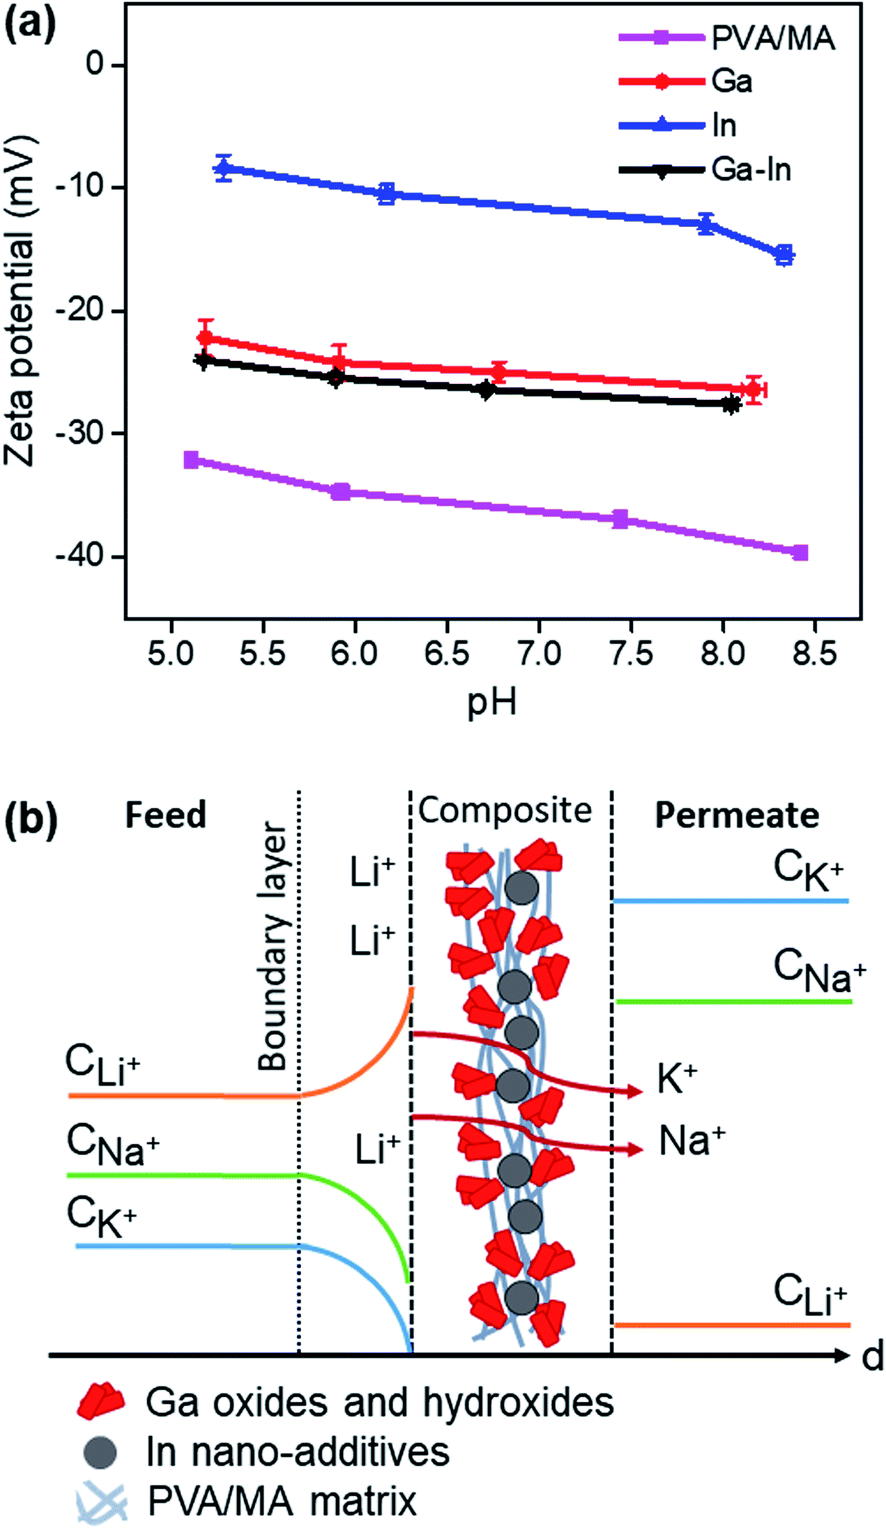 | ||
| Fig. 7 (a) Zeta potential measurements of the composites as a function of the pH. (b) Schematic representation of the proposed Li+ selectivity mechanism across the Ga–In composite. | ||
Finally, the stability of the Ga–In composite was assessed after 110 h of diffusion in mixed Li+/Na+/K+ solutions. The SEM/EDS of the cross-section (Fig. S13a†) showed a similar structure and elemental distribution as the pristine Ga–In composite with round-shaped In nano-additives and Ga-rich domains matching the O elemental mapping, indicating a stable morphological structure. XRD, FTIR and Raman analyses, showed in Fig. S13b–d,† respectively, showed virtually identical spectra and patterns as compared to the pristine Ga–In composite, which indicated a chemically stable material.
Conclusions
Post-transition metal/polymer composites have been developed for the separation and sensing of alkali metal ions. The liquid EGaIn alloy was processed into nano-additives in an aqueous PVA/MA solution at room temperature. The dealloying of Ga from the EGaIn nano-additive into Ga oxide and hydroxide species provided specific binding sites for Li+, while the metallic In stabilized the polymeric matrix. The Ga–In composite exhibited exceptional Li+ selectivity, good mechanical strength, and stability. In order to reduce the high cost associated with Ga and In, other post-transition metals such as tin or bismuth or their alloys could be further explored. The PVA matrix could also be replaced by naturally derived polymers such as cellulose or chitosan and cured with natural polyphenol species as mild cross-linking agents. While Ga and In metals have been independently studied for lithiation reactions, their alloys and metal/oxide combination present new opportunities for alkali metal separation and sensing.Author contributions
S. M.: investigation, conceptualization, formal analysis, and writing – original draft. M. M., M. M., R. A.: resources and formal analysis. C. Z., S. C., F. C., W. X., Z. C., J. T., M. A. R.: resources. J. Z.: resources, formal analysis. A. R.: resources and conceptualization. G. L.: resources, conceptualization and, writing – review & editing. K. K.-Z., J. T., F.-M. A.: conceptualization, writing – review & editing and supervision.Conflicts of interest
There are no conflicts to declare.Acknowledgements
This work was supported by the Australian Research Council (ARC) Laureate Fellowship grant (FL180100053).Notes and references
- K. Kalantar-Zadeh, J. Tang, T. Daeneke, A. P. O'Mullane, L. A. Stewart, J. Liu, C. Majidi, R. S. Ruoff, P. S. Weiss and M. D. Dickey, ACS Nano, 2019, 13, 7388–7395 Search PubMed.
- K. Zuraiqi, A. Zavabeti, F.-M. Allioux, J. Tang, C. K. Nguyen, P. Tafazolymotie, M. Mayyas, A. V. Ramarao, M. Spencer, K. Shah, C. F. McConville, K. Kalantar-Zadeh, K. Chiang and T. Daeneke, Joule, 2020, 4, 2290–2321 Search PubMed.
- S. Ni, Q. Chen, J. Liu, S. Yang, T. Li, X. Yang and J. Zhao, J. Power Sources, 2019, 433, 126681 Search PubMed.
- M. Nagao, A. Hayashi and M. Tatsumisago, Electrochemistry, 2012, 80, 734–736 Search PubMed.
- A. Santhosha, L. Medenbach, J. R. Buchheim and P. Adelhelm, Batter. Supercaps, 2019, 2, 524–529 Search PubMed.
- Y. Wu, L. Huang, X. Huang, X. Guo, D. Liu, D. Zheng, X. Zhang, R. Ren, D. Qu and J. Chen, Energy Environ. Sci., 2017, 10, 1854–1861 Search PubMed.
- J. Sangster and A. Pelton, J. Phase Equilib., 1991, 12, 33–36 Search PubMed.
- W. Alexander, L. Calvert, R. Gamble and K. Schinzel, Can. J. Chem., 1976, 54, 1052–1060 Search PubMed.
- S. Merhebi, M. Mayyas, R. Abbasi, M. J. Christoe, J. Han, J. Tang, M. A. Rahim, J. Yang, T. T. Tan, D. Chu, J. Zhang, S. Li, C. H. Wang, K. Kalantar-Zadeh and F.-M. Allioux, ACS Appl. Mater. Interfaces, 2020, 12, 20119–20128 Search PubMed.
- J. Tang, S. Lambie, N. Meftahi, A. J. Christofferson, J. Yang, M. B. Ghasemian, J. Han, F.-M. Allioux, M. A. Rahim, M. Mayyas, T. Daeneke, C. F. McConville, K. G. Steenbergen, R. B. Kaner, S. P. Russo, N. Gaston and K. Kalantar-Zadeh, Nat. Nanotechnol., 2021, 16, 431–439 Search PubMed.
- K. Xu, B. Y. Zhang, M. Mohiuddin, N. Ha, X. Wen, C. Zhou, Y. Li, G. Ren, H. Zhang, A. Zavabeti and J. Z. Ou, Nano Today, 2021, 37, 101096 Search PubMed.
- A. Zavabeti, J. Z. Ou, B. J. Carey, N. Syed, R. Orrell-Trigg, E. L. H. Mayes, C. Xu, O. Kavehei, A. P. O'Mullane, R. B. Kaner, K. Kalantar-Zadeh and T. Daeneke, Science, 2017, 358, 332–335 Search PubMed.
- M. Zhang, X. Wang, Z. Huang and W. Rao, Biosensors, 2020, 10, 170 Search PubMed.
- B. Swain, Sep. Purif. Technol., 2017, 172, 388–403 Search PubMed.
- C. B. Tabelin, J. Dallas, S. Casanova, T. Pelech, G. Bournival, S. Saydam and I. Canbulat, Miner. Eng., 2021, 163, 106743 Search PubMed.
- G. Martin, L. Rentsch, M. Höck and M. Bertau, Energy Storage Mater., 2017, 6, 171–179 Search PubMed.
- F. Meng, J. McNeice, S. S. Zadeh and A. Ghahreman, Miner. Process. Extr. Metall. Rev., 2021, 42, 123–141 Search PubMed.
- A. Razmjou, M. Asadnia, E. Hosseini, A. Habibnejad Korayem and V. Chen, Nat. Commun., 2019, 10, 5793 Search PubMed.
- E. Li, J. Kang, P. Ye, W. Zhang, F. Cheng and C. Yin, J. Mater. Chem. B, 2019, 7, 903–907 Search PubMed.
- J. Lu, H. Zhang, J. Hou, X. Li, X. Hu, Y. Hu, C. D. Easton, Q. Li, C. Sun, A. W. Thornton, M. R. Hill, X. Zhang, G. Jiang, J. Z. Liu, A. J. Hill, B. D. Freeman, L. Jiang and H. Wang, Nat. Mater., 2020, 19, 767–774 Search PubMed.
- Y. Sun, X. Guo, S. Hu and X. Xiang, J. Energy Chem., 2019, 34, 80–87 Search PubMed.
- A. Razmjou, G. Eshaghi, Y. Orooji, E. Hosseini, A. H. Korayem, F. Mohagheghian, Y. Boroumand, A. Noorbakhsh, M. Asadnia and V. Chen, Water Res., 2019, 159, 313–323 Search PubMed.
- H. Zhang, J. Hou, Y. Hu, P. Wang, R. Ou, L. Jiang, J. Z. Liu, B. D. Freeman, A. J. Hill and H. Wang, Sci. Adv., 2018, 4, eaaq0066 Search PubMed.
- C. Zhang, F.-M. Allioux, M. A. Rahim, J. Han, J. Tang, M. B. Ghasemian, S.-Y. Tang, M. Mayyas, T. Daeneke, P. Le-Clech, R. B. Kaner, D. Esrafilzadeh and K. Kalantar-Zadeh, Chem. Mater., 2020, 32, 4808–4819 Search PubMed.
- G. Chen, H. Wang, R. Guo, M. Duan, Y. Zhang and J. Liu, ACS Appl. Mater. Interfaces, 2020, 12, 6112–6118 Search PubMed.
- B. Yuan, C. Zhao, X. Sun and J. Liu, Adv. Funct. Mater., 2020, 30, 1910709 Search PubMed.
- M. Zhang, P. Zhang, C. Zhang, Y. Wang, H. Chang and W. Rao, Appl. Mater. Today, 2020, 19, 100612 Search PubMed.
- W. Hu, Y. Li, S.-Y. Tang, L. Li, Q. J. Niu and S. Yan, Adv. Mater. Interfaces, 2021, 2100038, DOI:10.1002/admi.202100038.
- Y. Ohm, C. Pan, M. J. Ford, X. Huang, J. Liao and C. Majidi, Nat. Electron., 2021, 4, 185–192 Search PubMed.
- M. J. Ford, D. K. Patel, C. Pan, S. Bergbreiter and C. Majidi, Adv. Mater., 2020, 32, 2002929 Search PubMed.
- R. M. Putri, C. D. Sundari, O. Floweri, T. R. Mayangsari, A. L. Ivansyah, S. P. Santosa, I. M. Arcana and F. Iskandar, J. Non-Cryst. Solids, 2021, 556, 120549 Search PubMed.
- A. Kumar and S. S. Han, Int. J. Polym. Mater., 2017, 66, 159–182 Search PubMed.
- B. Zhao, W. Ma, P. Zhang, Q. Zhang, J. Zhong and H. Matsuyama, Chem. Pap., 2020, 74, 3913–3923 Search PubMed.
- X. Cheng, W. Cai, X. Chen, Z. Shi and J. Li, RSC Adv., 2019, 9, 15457–15465 Search PubMed.
- J. Tang, R. Daiyan, M. B. Ghasemian, S. A. Idrus-Saidi, A. Zavabeti, T. Daeneke, J. Yang, P. Koshy, S. Cheong, R. D. Tilley, R. B. Kaner, R. Amal and K. Kalantar-Zadeh, Nat. Commun., 2019, 10, 4645 Search PubMed.
- F.-M. Allioux, S. Merhebi, J. Tang, S. A. Idrus-Saidi, R. Abbasi, M. G. Saborio, M. B. Ghasemian, J. Han, R. Namivandi-Zangeneh, A. P. O'Mullane, P. Koshy, R. Daiyan, R. Amal, C. Boyer and K. Kalantar-Zadeh, Adv. Funct. Mater., 2020, 30, 1907879 Search PubMed.
- H. Lu, S.-Y. Tang, Z. Dong, D. Liu, Y. Zhang, C. Zhang, G. Yun, Q. Zhao, K. Kalantar-Zadeh, R. Qiao and W. Li, ACS Appl. Nano Mater., 2020, 3, 6905–6914 Search PubMed.
- R. Abbasi, M. Mayyas, M. B. Ghasemian, F. Centurion, J. Yang, M. Saborio, F.-M. Allioux, J. Han, J. Tang, M. J. Christoe, K. M. Mohibul Kabir, K. Kalantar-Zadeh and M. A. Rahim, J. Mater. Chem. C, 2020, 8, 7805–7811 Search PubMed.
- C. E. Goodyer and A. L. Bunge, J. Membr. Sci., 2012, 409–410, 127–136 Search PubMed.
- Y. Fang and S. J. Duranceau, Membranes, 2013, 3, 196–225 Search PubMed.
- S. Cai, M. Mayyas, M. G. Saborio, M. B. Ghasemian, J. Tang, T. Daeneke, J. Han, A. A. Esmailpour, F.-M. Allioux and K. Kalantar-Zadeh, J. Mater. Chem. C, 2020, 8, 16593–16602 Search PubMed.
- T. Liu, D. Chen, Y. Cao, F. Yang, J. Chen, J. Kang, R. Xu and M. Xiang, J. Membr. Sci., 2021, 618, 118679 Search PubMed.
- Z. Xie, M. Hoang, T. Duong, D. Ng, B. Dao and S. Gray, J. Membr. Sci., 2011, 383, 96–103 Search PubMed.
- F.-M. Allioux, S. Merhebi, J. Tang, C. Zhang, A. Merenda, S. Cai, M. B. Ghasemian, M. A. Rahim, M. Maghe, S. Lim, J. Zhang, L. Hyde, M. Mayyas, B. V. Cunning, R. S. Ruoff and K. Kalantar-Zadeh, Carbon, 2021, 171, 938–945 Search PubMed.
- W. Zhang, J. Z. Ou, S.-Y. Tang, V. Sivan, D. D. Yao, K. Latham, K. Khoshmanesh, A. Mitchell, A. P. O'Mullane and K. Kalantar-zadeh, Adv. Funct. Mater., 2014, 24, 3799–3807 Search PubMed.
- M. Mayyas, M. Mousavi, M. B. Ghasemian, R. Abbasi, H. Li, M. J. Christoe, J. Han, Y. Wang, C. Zhang, M. A. Rahim, J. Tang, J. Yang, D. Esrafilzadeh, R. Jalili, F.-M. Allioux, A. P. O'Mullane and K. Kalantar-Zadeh, ACS Nano, 2020, 14, 14070–14079 Search PubMed.
- S. Yang, F. Zhang, H. Ding, P. He and H. Zhou, Joule, 2018, 2, 1648–1651 Search PubMed.
- M. Mayyas and V. Sahajwalla, Chem. Eng. J., 2019, 358, 980–991 Search PubMed.
- J. Lyu, M. Mayyas, O. Salim, H. Zhu, D. Chu and R. K. Joshi, Mater. Today Energy, 2019, 13, 277–284 Search PubMed.
- R.-L. Xie, Z.-M. Zong, F.-J. Liu, Y.-G. Wang, H.-L. Yan, Z.-H. Wei, M. Mayyas and X.-Y. Wei, RSC Adv., 2015, 5, 45718–45724 Search PubMed.
- J. Veerman, Energies, 2020, 13, 1946 Search PubMed.
- H. Strathmann, Ion-exchange membrane separation processes, Elsevier, 2004 Search PubMed.
- F.-M. Allioux, L. He, F. She, P. D. Hodgson, L. Kong and L. F. Dumée, Sep. Purif. Technol., 2015, 147, 353–363 Search PubMed.
- F.-M. Allioux, S. Balme and L. F. Dumée, Mater. Horiz., 2018, 5, 1185–1193 Search PubMed.
- G. Liu, L. Zhang, S. Mao, S. Rohani, C. Ching and J. Lu, Sep. Purif. Technol., 2015, 152, 55–63 Search PubMed.
- M. Mohammad, M. Lisiecki, K. Liang, A. Razmjou and V. Chen, Appl. Mater. Today, 2020, 21, 100884 Search PubMed.
- A. Razmjou, J. Mansouri and V. Chen, J. Membr. Sci., 2011, 378, 73–84 Search PubMed.
- A. Razmjou, A. Resosudarmo, R. L. Holmes, H. Li, J. Mansouri and V. Chen, Desalination, 2012, 287, 271–280 Search PubMed.
Footnote |
| † Electronic supplementary information (ESI) available. See DOI: 10.1039/d1ta02664j |
| This journal is © The Royal Society of Chemistry 2021 |