
 Open Access Article
 This Open Access Article is licensed under a Creative Commons Attribution-Non Commercial 3.0 Unported Licence
Controlling phase separation in thermoelectric Pb1−xGexTe to minimize thermal conductivity†
Hong
Lian
*,
Anil
Kumar‡
,
Václav
Ocelík
,
Jacob
Baas
,
Jamo
Momand
 ,
Bart J.
Kooi
and
Graeme R.
Blake
*
,
Bart J.
Kooi
and
Graeme R.
Blake
*
Zernike Institute for Advanced Materials, University of Groningen, Nijenborgh 4, 9747 AG, Groningen, The Netherlands. E-mail: h.lian@rug.nl; g.r.blake@rug.nl
First published on 10th May 2021
Abstract
Intensive studies have been carried out over the past decade to identify nanostructured thermoelectric materials that allow the efficient conversion of waste heat to electrical power. However, less attention has been paid to the stability of such materials under operating temperatures, typically 400 °C or higher. Conventionally nanostructured ceramics tend to undergo grain growth at high temperature, lowering the density of interfaces and raising the thermal conductivity, which is detrimental to device performance. Therefore it is preferable to identify materials with stable nanostructures, for example systems that undergo spontaneous phase separation. Here we investigate PbTe–GeTe alloys, in which spinodal decomposition occurs on initial cooling from above 580 °C, forming complex nanostructures consisting of Ge-rich and Pb-rich domains on different size scales. The resulting dense arrangement of interfaces, combined with mass fluctuation associated with Pb–Ge mixing, enhances phonon scattering and strongly reduces the thermal conductivity. Here we focus on the nominal composition Pb0.49Ge0.51Te and show that by tuning the synthesis procedure, we are able to control the pattern of compositional domains and the density of interfaces between them. This allows low lattice thermal conductivities to be maintained even after thermal cycling over the operating temperature range.
1. Introduction
As the large-scale development of fossil energy continues, the alarm for humanity has already sounded. Among methods of harvesting energy from the environment and maximizing the efficient use of existing energy sources, thermoelectric conversion technology based on the Seebeck effect is gaining more and more attention. An important indicator to measure the quality of thermoelectric materials is the figure of merit ZT = (S2σ/κtot)T, where S, σ, T, and κtot represent the Seebeck coefficient, electrical conductivity, absolute temperature, and total thermal conductivity (the sum of lattice and electronic components κL and κe), respectively. How to maintain a high Seebeck coefficient and electrical conductivity while minimizing the thermal conductivity is a challenging problem and is the focus of much research. Various approaches have been followed in attempts to increase ZT. Carrier concentration optimisation and band structure engineering, for example by introducing resonant states and inducing band convergence,1–5 can enhance the power factor (PF = S2σ). The lattice component of the thermal conductivity κL can to a large extent be optimized without affecting the other parameters, for example by nanostructuring,5–8 utilizing intrinsic anharmonicity,9,10 scattering phonons in liquid-like superionic conductors11,12 or from interstitial point defects and vacancies,13–16 designing composite materials or heterostructures,17,18 and deploying a matrix containing nanoprecipitates.6,19–21PbTe and GeTe-based compounds are narrow-gap IV–VI semiconductors and are promising thermoelectric materials for applications in the mid-temperature range of 200 °C to 500 °C. The performance of PbTe can be improved by alloying, for example in the systems PbTe–PbSe,22 PbTe–SnTe,23 and PbTe–AgSbTe.24 The resulting atomic substitutions produce mass fluctuations, increasing the degree of short-wavelength phonon scattering and reducing κL. Furthermore, PbTe–AgSbTe was shown to undergo chemical phase segregation where the size of the microstructural features decreases for fast-quenched samples.25 Here we focus on the alloy PbTe–GeTe, which has previously been studied for certain specific compositions. For example, Pb0.13Ge0.87Te26 exhibits a high ZT of up to ∼2 when doped with Bi2Te3. The compositions Pb0.36Ge0.64Te and Pb0.13Ge0.87Te have an intrinsically complex microstructure that depends on the preparation process,26–28 leading to a room temperature κL much lower than that of PbTe or GeTe. The microstructure is comprised of Ge-rich and Pb-rich domains, which are formed due to the presence of a miscibility gap in the PbTe–GeTe phase diagram and consequent spinodal decomposition on cooling from the melt. This spontaneous and unavoidable chemical phase separation might be advantageous in certain thermoelectric materials as it represents a simple route to obtain inhomogeneous structural features with interfaces that can effectively scatter phonons.29 Since spinodal decomposition is thermodynamically driven, such systems will tend to retain chemical phase separation at the operating temperatures of thermoelectric devices. In contrast, most artificially nanostructured thermoelectric materials will tend to undergo grain growth at high temperature, leading to a more homogeneous structure; this decreases the density of interfaces and is detrimental to obtaining low κL.
Within the Pb1−xGexTe system, Murphy et al. used first-principles simulations to predict that the anharmonic contribution to κL is minimized in the vicinity of the composition-driven soft phonon mode phase transition between the cubic rocksalt phase of Pb-rich compositions and the rhombohedrally distorted, ferroelectric phase of Ge-rich compositions.30 It was predicted that the minimum κL should be reached at the composition Pb0.51Ge0.49Te. In this paper, we investigate in detail how to control the microstructure that is spontaneously formed for the optimal Pb0.51Ge0.49Te composition proposed by Murphy et al.30 We show that large (>100 μm) grains of the same crystallographic orientation contain hierarchical patterns of compositional domains that are either Pb-rich or Ge-rich, ranging from >10 μm to <100 nm in size. The microstructure/nanostructure can be tuned by adjusting the annealing temperature and time during the preparation process, and certain features of the compositional domain patterns are retained even after subsequent annealing in the temperature range relevant for the operation of thermoelectric modules. We study the influence of the microstructure on κL, and conclude that the presence of a high density of compositional phase domains covering a range of size scales is most conducive to minimizing κL.
2. Experimental
The five samples of Pb0.51Ge0.49Te were prepared using elemental Pb, Ge, and Te (99.99% purity, Alfa Aesar), which were mixed, ground and placed in a quartz tube that was evacuated using a rotary vane pump, sealed with a flame and then heated over 1 h to 850 °C. At this temperature the mixture is in the liquid phase,31 where it was held for 1 h before undergoing different cooling processes. The quartz tube was continuously rotated during holding at 850 °C in order to optimize the homogeneity of the liquid. Different cooling procedures were then employed, as shown in Fig. 1a. Sample A was obtained by quenching directly from 850 °C to room temperature in water. Quenching can allow high-temperature phases to be obtained at room temperature; in this case it was hoped that quenching could stabilize a sample with the character of the Pb1−xGexTe solid solution that is found in a 100 °C range in the phase diagram below the melting point.27 The other samples underwent intermediate annealing steps after slowly cooling from the liquid phase to the solid solution region at 600 °C (Samples D and E), or to 500 °C (Samples B and C), which is below the spinodal decomposition temperature and thus in a temperature region where GeTe and PbTe-rich domains are expected to nucleate and grow. The ingots obtained after quenching (Samples A–D) or slowly cooling (Sample E) to room temperature were cut into several pieces and the surfaces were subsequently ground using 500 and 800 mesh sandpaper, followed by polishing with 9, 3, and 1 μm diamond suspensions. Final preparation for observation by scanning electron microscopy (SEM) involved lapping with a 40 nm silica suspension. | ||
| Fig. 1 (a) Cooling procedures used in the preparation of different samples. (b) Powder XRD patterns of the five Pb0.51Ge0.49Te samples. | ||
Powder X-ray diffraction (XRD) patterns were recorded using a Bruker D8 diffractometer with Cu Kα radiation. The diffraction patterns were fitted using the GSAS software.32 The microstructure was also studied with scanning electron microscopy (SEM), energy dispersive X-ray spectroscopy (EDS), and electron backscatter diffraction (EBSD) using a FEI Nova NanoSEM 650 equipped with an EDAX EDS/EBSD system using an Octane EDS detector and Hikari Plus EBSD camera. Team v.4.5 and OIM Analysis v.8.0 software were used to perform semiquantitative EDS and EBSD data analysis, respectively. The cubic structure of PbTe with a lattice parameter of 0.64 nm and the set of main reflections 0![[2 with combining macron]](https://www.rsc.org/images/entities/char_0032_0304.gif) 0,
0,  ,
,  ,
,  ,
,  ,
,  and 06 were used to index the obtained Kikuchi patterns. TEM lamellae of different regions of the samples were prepared using a Helios G4 CX dual beam system. These lamellae were analyzed by EDS in a JEOL 2010 TEM, where the spectra were fitted with the Cliff–Lorimer (MBTS) correction method without absorbance as implemented in the NSS 2.3 software package from Thermo Scientific.
Seebeck coefficient (S) and electrical conductivity (σ) measurements were simultaneously measured using a Linseis LSR-3 apparatus. Thermal diffusivity (α) was measured using the laser flash method using a Linseis LFA1000 apparatus. In all cases data were collected on warming from 50 °C to 400 °C with 25 °C steps. Up to three data points for each value (S, σ and α) were averaged after evaluating the quality of the fitted model and excluding abnormal values at each temperature. Thermal conductivity was calculated using the formula κ = αρCp. Here the specific heat capacity Cp was calculated using the Dulong–Petit approximation, which has previously been shown to be valid for IV–VI tellurides;5 the density ρ was determined using the measured mass and volume; values of ρA = 6.81 gcm−3, ρB = 6.43 gcm−3, ρC = 6.49 gcm−3, ρD = 6.75 gcm−3 and ρE = 6.56 gcm−3 were obtained for Samples A–E, thus there is no obvious dependence of density on cooling rate.
3. Results and discussion
3.1. Crystal structure analysis
Five samples of Pb0.51Ge0.49Te were prepared using different cooling processes during the initial synthesis (Fig. 1a). The corresponding room temperature powder XRD patterns are shown in Fig. 1b. In each case all peaks could be assigned to coexisting cubic PbTe(Ge) and rhombohedral GeTe(Pb) phases. This phase coexistence can most clearly be distinguished in the 2θ range from 27° to 30°, containing the cubic 200 peak and the rhombohedral peak. Samples A and D have two distinct rhombohedral GeTe(Pb) phases. Samples A, C and D have a particularly broad, asymmetric cubic 200 peak at ∼28° which implies that a range of cubic PbTe(Ge) phases with slightly different lattice parameters and hence different chemical compositions are present. The cooling protocol used during synthesis therefore has a great impact on the way in which the spinodal decomposition occurs. In order to examine the phase coexistence in Pb0.51Ge0.49Te in more detail, SEM was employed to study the microstructure. This investigation is described below, together with a more in-depth analysis of the XRD patterns.
3.2. Morphological analysis
Fig. 2 shows SEM-BSE (backscattered electron) images of all five samples, where brighter contrast corresponds to a greater concentration of heavier atoms. Further images are shown in Fig. S1.†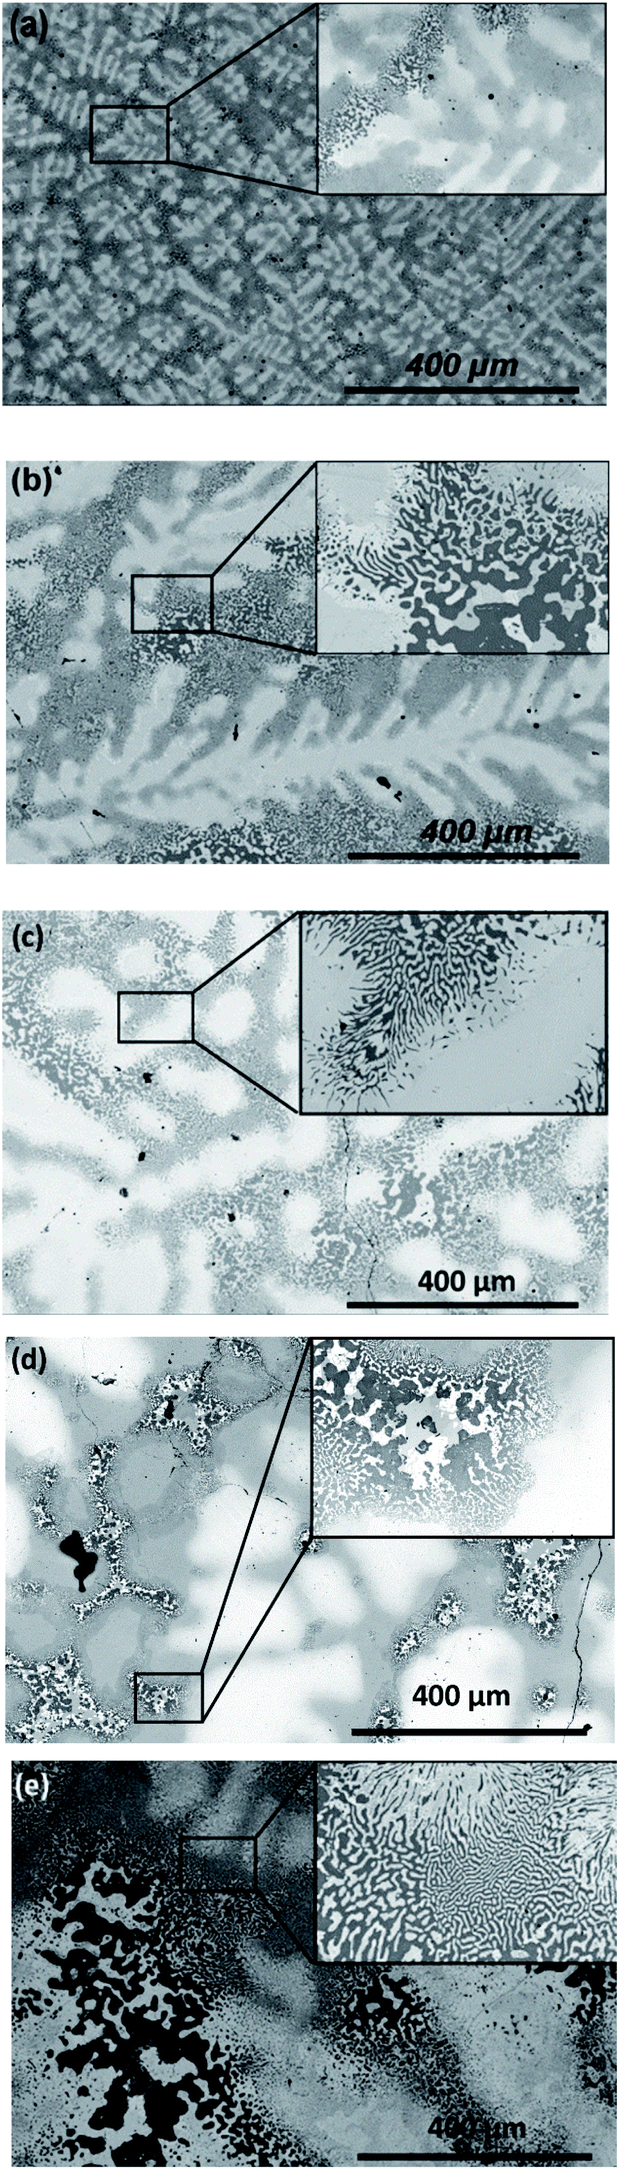 | ||
| Fig. 2 (a)–(e) SEM-BSE images of Pb0.51Ge0.49Te (Samples A–E). | ||
Sample A shows Pb-rich dendrites with lengths of up to ∼150 μm and widths of ∼20 μm dispersed in a darker matrix (Fig. 2a). The boundaries between the dendrites and matrix (see inset) are not sharp. Locally, there are areas in which the matrix segregates into sub-micron Pb-rich and Pb-depleted areas with sharper interfaces between them. Samples B and C (Fig. 2b and c) also contain Pb-rich dendrites, but with dimensions (>500 μm long and ∼50 μm wide) that are much larger than the dendrites in Sample A. The matrix is almost completely segregated into Pb-rich and Pb-depleted areas with sizes ranging from sub-micron to tens of microns with sharp interfaces between them. Samples D and E (Fig. 2d and e) exhibit even wider (∼200 μm) Pb-rich dendrites dispersed in a Pb-depleted matrix. Inside the matrix, smaller (Sample D) and larger (Sample E) areas with Pb-rich and Pb-depleted zones are formed. The inset to Fig. 2e demonstrates that in Sample E, which underwent the longest treatment at high temperature and the slowest cooling rate, the Pb-rich dendrites have started to decompose into a complex pattern of much smaller regions in similar fashion to the matrix.
The fact that Samples A and D were rapidly quenched from 850 °C (liquid phase) and 600 °C (solid solution region of the phase diagram27) respectively allow us to conclude that the extensive micron-scale patterning formed inside the darker contrast matrix in the other three samples is the result of spinodal decomposition, which takes place below ∼580 °C. In Samples B and C, which were held just below the spinodal decomposition temperature for 10 minutes on initial cooling, almost all of the matrix has decomposed into Pb-rich and Pb-deficient regions that are visible in wide-area SEM-BSE images.
The elemental compositions of regions with light and dark contrast in the SEM-BSE images were determined using EDS for two representative samples: Sample A (Fig. 3a), which was rapidly quenched from the melt, and Sample E (Fig. 3b), which was slowly air-cooled. For Sample A, EDS spectra were taken in four regions: spot 1 is inside a Pb-rich dendrite; spot 2 is in the Pb-depleted matrix; spots 3 and 4 are Pb-rich and Pb-depleted regions within a phase-segregated area of the matrix, respectively. The inset of Fig. 3a demonstrates that there is no sharp compositional boundary between the dendritic phase (1) and the matrix (2). Spot 2 contains a Ge![[thin space (1/6-em)]](https://www.rsc.org/images/entities/char_2009.gif) :Pb atomic ratio of 56:44; this mixed composition is surprising due to the miscibility gap in the phase diagram, and we examine this region further using TEM as discussed below.
:Pb atomic ratio of 56:44; this mixed composition is surprising due to the miscibility gap in the phase diagram, and we examine this region further using TEM as discussed below.
 | ||
| Fig. 3 SEM-BSE images of (a) directly quenched Sample A and (b) slowly cooled Sample E. The numbers on the SEM images indicate points at which EDS spectra were measured; the corresponding compositions (atom%) of Te, Ge and Pb are shown in the tables. | ||
For Sample E shown in Fig. 3b, only two distinct areas of light and dark contrast are observed, suggesting that the sample has undergone almost complete spinodal decomposition. This is supported by the EDS analysis, from which areas 1 and 2 contain Ge:Pb in the ratios 11:89 and 92:8, respectively. A similar analysis of Samples B, C and D is presented in Fig. S2.†
From the above SEM-BSE and EDS observations it can be concluded that as Sample A was prepared by a rapid quenching process, there was insufficient time for spinodal decomposition to take place completely. Sample A therefore provides insight into how the decomposition process occurs. The structures of the four representative areas in Fig. 3a were analyzed in more detail by extracting lamellae of ∼10 μm using a focused ion beam (see Fig. S3†) and studying them using scanning transmission electron microscopy (STEM) combined with EDS. Fig. 4a shows lamella 1, which was cut from the Pb-rich dendritic phase. A large number of point defects and line defects are visible in the STEM image, but the chemical compositions determined for three spots in this region show that the entire area is Pb-rich, consistent with the wider area analysis performed by SEM-BSE (Fig. 3a). Fig. 4b shows lamella 2, which was extracted from a uniform contrast region of the matrix where there is a roughly equal proportion of Pb and Ge (Fig. 3a). However, STEM shows that the matrix is segregated into sub-micron Pb-rich and Ge-rich regions that are not resolved by SEM imaging. Lamella 3 was taken from an area of the matrix in which large-scale phase segregation is apparent (Fig. 4c). The Pb-rich and Ge-rich regions are several microns in size and are also clearly visible in the corresponding STEM image. There are many point defects and line defects in the Pb-rich phase. In the Ge-rich phase the herringbone twin domain structure typical of GeTe and other similar rhombohedral crystal structures33 is visible. Lamella 4 in Fig. 4d was extracted from a region of the matrix in which a fine phase segregation pattern is visible; the corresponding STEM images show that Pb-rich and Ge-rich regions of a few hundred nm coexist in rather disorganized fashion. Further TEM images and EDS elemental maps of the lamellae cut from Sample A are shown in Fig. S4 and S5.†
 | ||
| Fig. 4 SEM-BSE images of four different regions of Sample A. For each region a lamella was extracted at the outlined position: (a) lamella 1, (b) lamella 2, (c) lamella 3, (d) lamella 4. STEM images of the lamellae (bottom left of each panel) were obtained, and EDS analysis on selected areas of the lamellae (indicated by circles in the STEM images, results shown in bottom right of each panel) was performed. | ||
Using the new insight gained above into the coexistence of Pb-rich and Ge-rich phases, we next examined the XRD patterns of Samples A–E in more detail to obtain a better picture of phase coexistence on the bulk scale. The XRD patterns shown in Fig. 5a–e were fitted with a combination of Ge-rich rhombohedral and Pb-rich cubic phases, using the chemical compositions determined by EDS analysis (for example shown in Fig. 3 and 4 for Samples A and E).
 | ||
| Fig. 5 (a)–(e) Observed (black data points), fitted (red line) and difference (blue line) partial XRD patterns of Samples A–E. (f) Refined unit cell volume of different phases within each sample as a function of chemical composition determined by EDS analysis. The volume of the cubic unit cell has been divided by 3 for a direct comparison with the rhombohedral cell. The plot includes literature values of the unit cell volumes of GeTe and PbTe.34,35 | ||
The most complex XRD patterns were obtained for Samples A and D, which were both quenched directly from the solid solution region of the phase diagram. In both cases (Fig. 5a and d) there are two distinct rhombohedral phases as evidenced by a pair of  peaks separated by approximately 1° in units of 2θ. This is consistent with the EDS study of Sample A, which shows that the phase segregated regions of the matrix contain Ge-rich domains containing <5% Pb (Fig. 4c and d), whereas regions of the matrix with uniform SEM-BSE contrast still contain up to 17% Pb in the Ge-rich domains (Fig. 4b).
The latter probably give rise to the lower angle  peak which has an asymmetric profile, suggesting that this phase comprises a range of lattice parameters and hence variable chemical composition. The cubic 200 peak, associated with Pb-rich regions, is also asymmetric and was modelled approximately by two cubic phases. However, the peak profile is smooth which again implies a range of compositions, as observed from the EDS data in Fig. 4. The Pb-rich regions probed in both the dendrites and different parts of the matrix contain from 8% to 19% Ge, which will give rise to broadening of the cubic 200 peak. The fact that such mixed Pb/Ge domains still exist, and on different length scales, indicates that spinodal decomposition is incomplete in these two samples due to the fast quenching rate.
The XRD patterns of Samples B and C, both annealed at 500 °C (below the spinodal decomposition temperature) before quenching, can be fitted rather well using a single cubic and rhombohedral phase, although the cubic 200 peak of Sample C is somewhat asymmetric, suggesting a narrow range of Pb-rich compositions (Fig. 5b and c). This is consistent with the SEM-BSE images in Fig. 2b and c, which show phase segregation into well-defined light and dark regions throughout the matrix, often with stripe-like morphology. The relatively symmetric and sharp XRD peaks imply that the Pb-rich phase in the matrix has a similar chemical composition to that in the dendrites.
For Sample E, which was slowly cooled in air after annealing in the solid-solution region, the XRD pattern shown in Fig. 5e can be well fitted by single cubic and rhombohedral phases. Both the cubic 200 peak and the rhombohedral  peak are sharper than for the other samples, suggesting that slow cooling leads to coexisting phases with better defined compositions. It is likely that spinodal decomposition is the most complete in this sample, which is consistent with the less well-defined dendrites in the SEM-BSE image (Fig. 2e) and the observation that most of the sample area is comprised of light and dark regions with stripe-like morphology.
The unit cell volumes of the various phases of all five samples determined by XRD analysis are shown as a function of chemical composition (as determined by EDS) in Fig. 5f. Most data points lie close to a straight line connecting the unit cell volumes of pure GeTe (here the rhombohedral setting with α ≈ 60° is used) and PbTe, which confirms the validity of the EDS analysis and shows that up to 20% of Pb(Ge) can be incorporated in the structure of GeTe(PbTe). The single outlying data point for Sample D is likely explained by sub-micron phase segregation that EDS was unable to resolve.
Fig. 6 shows a simultaneous EBSD/EDS microstructural characterization of a large area in Sample A. Fig. 6a is a BSE image clearly showing the size and distribution of Pb-rich dendrites (light contrast). Two cracks are visible as well as several small circular pores in the form of black dots. The corresponding inverse pole figure map in Fig. 6b was obtained by indexing EBSD patterns collected while scanning the whole area and assuming the presence of the cubic phase; the rhombohedral GeTe structure is closely related to the cubic structure by a small distortion along the [111] direction. Here grain boundaries are represented by drawing a black line between two pixels that have a crystallographic misorientation larger than 5 degrees. This map is clear evidence that three large crystallographic grains are present (their orientations are visualized via 001 axonometric projections of the cubic crystal), separated by complicated and rugged grain boundaries. This demonstrates that although the Pb-rich dendrites and the surrounding matrix have different elemental compositions, their crystallographic orientations are largely the same. Small subgrains inside the large grains correspond to Pb-rich and Ge-rich areas where spinodal decomposition has already occurred, as the elemental distribution maps with highlighted grain boundaries clearly show. Further areas with spinodally decomposed phases appear at the rugged grain boundaries between large grains. Fig. 7 shows a similar EBSD microstructural characterization of Sample E, focusing on a decomposed Pb-rich dendrite. This figure clearly shows that during spinodal decomposition not only new compositional phases but also new grain boundaries are formed at the place where a single crystal of the Pb-rich phase originally existed.
 | ||
| Fig. 6 (a) Back-scattered electron (BSE) image from a large area of Sample A. (b) 001 inverse pole figure map taken from the same area, together with EDS elemental maps to visualize the distribution of Pb, Te and Ge. The black lines on all maps indicate grain boundaries, defined by a crystallographic misorientation of >5°. | ||
 | ||
| Fig. 7 (a) Back-scattered electron (BSE) image of a decomposed dendrite in Sample E. (b) 001 Inverse pole figure map from the same area together with EDS elemental maps to visualize the distribution of Pb, Te and Ge. | ||
3.3. Thermoelectric properties
The temperature dependence of the Seebeck coefficient S and the electrical resistivity ρ of all five samples is shown in Fig. S6.† The samples were measured on heating to 400 °C (lead is easily volatilized at higher temperatures) over three successive heating cycles, cooling back to room temperature between each cycle. The Seebeck coefficient is positive over the entire temperature range, the same behavior as p-type GeTe, indicating that hole carriers dominate the thermoelectric transport. During initial heating to ∼250 °C samples A and D have much higher S and ρ than the other samples, perhaps due to their more chemically inhomogeneous nature that hinders charge transport. However, in subsequent heating cycles both S and ρ become more similar for the different samples, lying in the range 105–120 μV K−1 and 21–30 μΩ m respectively at 400 °C.Fig. 8 shows the thermal conductivity of the five samples, again comparing the first and third heating cycles. The thermal conductivity of all five samples is much lower (Fig. 8a) than the end members of the series, reported as 2.3 W m−1 K−1 for PbTe36 and 7.2 W m−1 K−1 for GeTe1 at room temperature. Samples A and C exhibit particularly low thermal conductivities of <0.5 W m−1 K−1 during initial heating to 400 °C, but these values almost double during the second and third heating cycles (Fig. 8b). Sample A has the lowest initial thermal conductivity of only ∼0.35 W m−1 K−1 between room temperature and 200 °C, and is still lowest after three thermal cycles reaching a steady value of ∼0.8 W m−1 K−1 above 150 °C.
 | ||
| Fig. 8 Temperature dependence of total thermal conductivity for Samples A–E during (a) the first heating cycle and (b) the third heating cycle. | ||
The contributions of the electronic and lattice thermal conductivity can be evaluated using the Wiedemann–Franz formula κe = LσT, where L is the Lorentz factor evaluated from the measured Seebeck coefficient using the relation  .37 The lattice thermal conductivity κL is then evaluated by the formula κtot = κe + κL; both components of κtot are plotted versus temperature in Fig. 9. Sample A has the lowest lattice thermal conductivity, increasing from ∼0.05 W m−1 K−1 at 400 °C during initial heating to ∼0.35 W m−1 K−1 in the third heating cycle.
 | ||
| Fig. 9 Temperature dependence of (a), (b) electronic (κe) and (c), (d) lattice (κL) thermal conductivity of Samples A–E in the first and third heating cycles. | ||
A key reason for the extremely low values of κL in Pb0.51Ge0.49Te is the spinodal decomposition that takes place in all samples, resulting in inhomogeneous microstructures with compositional domains ranging from <100 nm to tens of microns in size. The domain boundaries will act as effective phonon scattering centers. Nevertheless, there is considerable variation in κL between different samples in Fig. 9c; we argue that this can be explained by differences in the microstructure, which in turn depend on the sample cooling procedure. Here it is useful to compare the difference in compositional domain size and hence interface density between a fast cooled sample (A, directly quenched from 850 °C) and a slowly cooled sample (E, held at 600 °C before cooling in air). In Fig. 3 it appears that the compositional domains in sample E are coarser than in Sample A. This difference can be quantified by estimating the interface density in representative SEM-BSE images covering approximate areas of 70 × 90 μm, as shown in Fig. S7.† Sample A has more than double the interface density of Sample E, which is likely the main reason for the lower κL that is experimentally measured in Fig. 9.
The influence of crystallographic grain boundaries on κL is much less important than that of compositional boundaries. As shown in Fig. 6b, the crystallographic domains in Sample A are hundreds of microns in size. Although the domain size decreases to tens of microns in the slow-cooled Sample E (Fig. 7b), the higher density of crystallographic domain boundaries has little effect on κL (Fig. 9c); the effect of the compositional phase segregation on smaller length scales is dominant.
The increase in κL from the first to the third heating cycle, especially for Sample A (Fig. 9c and d), suggests that significant microstructural changes occur as result of annealing. As discussed above and visible in Fig. 4b, the matrix component of Sample A contains substantial regions in which considerable Ge and Pb mixing remains; this results in a distinct rhombohedral GeTe phase containing up to 17% Pb and thus a larger unit cell volume, manifested by a  peak shifted to lower angle in the XRD pattern (Fig. 5a).
Fig. 10 shows a partial XRD pattern of Sample A after heating to 400 °C and cooling slowly back to room temperature. It is clear that the sample has undergone significant changes; the XRD pattern can now be fitted using a model containing one cubic Pb-rich and one rhombohedral Ge-rich phase. Only a trace of the original second rhombohedral phase is still visible at 2θ = 29°. However, the rhombohedral  peak is significantly broader than the cubic 200 peak, suggesting that the chemical composition of the rhombohedral phase is not as well defined.
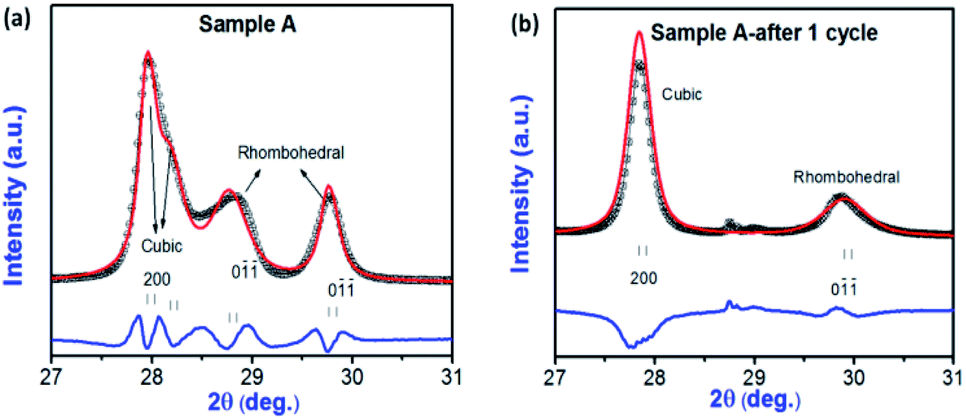 | ||
| Fig. 10 Observed (black data points), fitted (red line) and difference (blue line) XRD profiles of Sample A: (a) in the as-prepared state and (b) after heating to 400 °C and subsequently cooling to room temperature. | ||
These changes are consistent with the SEM-BSE images in Fig. 11, where it is clear that after heating, all of the Pb-depleted matrix in Sample A has decomposed into well-defined light and dark contrast domains, and moreover that decomposition of the metastable Pb-rich dendrites is also in progress. The eventual completion of spinodal decomposition after heat treatment will lead to a two-phase segregation pattern with compositional domains ranging from sub-micron to several microns in size. The resulting mass disorder allows an extremely low κL to be maintained, even though the value doubles with respect to the as-prepared sample which exhibits mass disorder on the unit cell scale in some regions. Nevertheless, sample A retains the lowest κL of all five samples after three thermal cycles, which suggests that a degree of disorder is “locked-in” by the initial quenching process and is unaffected by subsequent annealing.
 | ||
| Fig. 11 SEM-BSE images of representative regions of Sample A (a) before and (b) after heating to 400 °C and cooling back to room temperature. | ||
The power factor (PF) and figure of merit (ZT) determined during initial heating of Samples A–E, and after three heating cycles to 400 °C, are shown in Fig. S8.† There is a large spread in PF and consequently ZT as the microstructures of the samples are still evolving during initial heating. By the third heating cycle the initially quenched Samples A and D exhibit the highest power factors in the 300–400 °C range, and Sample A exhibits the highest ZT value by virtue of its retained low lattice thermal conductivity.
Since the complexity of the microstructure does not appear to be detrimental to the electrical conductivity or Seebeck coefficient, our work suggests that the initial stabilization of domains with multiple chemical compositions is key to high thermoelectric performance in the Pb1−xGexTe system. Although the chemically phase separated microstructure of as-prepared Samples A and D cannot be maintained to the same extent under high-temperature operating conditions, they nevertheless retain some degree of this inhomogeneous character after thermal cycling and exhibit the best thermoelectric performance of the samples studied.
We note that in this work we have made no attempt to optimize the electronic contribution to the thermoelectric performance by chemical doping or further alloying, which has previously proven successful for Pb1−xGexTe with for example Bi2Te3,1,38 Se39 and Yb.40 Another approach was recently followed by Bu et al.,41 who obtained true solid solutions of Pb1−xGexTe (x = 0.4–0.9) by quenching from the single-phase region of the phase diagram at 873 K into ice water, likely at a faster rate than our samples. A single rhombohedral phase was then obtained, avoiding phase decomposition as long as the temperature was kept below 350 K; this allowed the rhombohedral distortion to be tuned by varying the value of x. In turn, the degree of valence band convergence could be optimized, leading to an average ZT of 0.7 in the temperature range 200–350 K for the composition Pb0.58Ge0.42Te (with 7% more Pb than in our current study). Although these quenched samples showed homogeneous microstructures, the lattice thermal conductivity remained low (0.5 W m−1 K−1 at 300 K) due to the scattering of phonons from point defects. Our current study is more focused on high-temperature thermoelectric applications, where we expect that applying doping/alloying to the complex microstructures that we demonstrate here will lead to further improvement in the performance of (Ge,Pb)Te-based materials.
4. Conclusions
We have examined the effect of phase separation phenomena on the thermoelectric properties of Pb0.51Ge0.49Te. The spinodal decomposition that occurs in the PbTe–GeTe system when cooled from above 575 °C results in complex patterns of Ge-rich and Pb-rich domains, which range in size from <100 nm to tens of microns despite the crystallographic orientation domains being larger than 100 μm in size. The densest pattern of composition domains is obtained in samples that are rapidly quenched, which gives rise to the lowest lattice thermal conductivity. Spinodal decomposition in such samples is incomplete, thus mass disorder between Pb and Ge on the unit cell scale further contributes to lowering the thermal conductivity. With further heat treatment, spinodal decomposition progresses leading to a significant increase in thermal conductivity, but the dense arrangement of compositional boundaries in fast-quenched samples is retained to some extent and thermal conductivity remains lower than in samples that were initially cooled more slowly. Our results provide guidelines for minimizing the lattice thermal conductivity in the Pb0.51Ge0.49Te system, which can further be doped to enhance the electronic contribution to the thermoelectric performance.Author contributions
H. Lian: conceptualization, data curation, formal analysis, investigation, methodology, validation, visualization, writing – original draft, writing – review & editing; A. Kumar: conceptualization, methodology; V. Ocelík: data curation, formal analysis, investigation, methodology, software, validation, visualization; J. Baas: methodology, resources; J. Momand: data curation, investigation, methodology, visualization; B. J. Kooi: resources, supervision; G. R. Blake: conceptualization, funding acquisition, methodology, project administration, supervision, validation, writing – review & editing.Conflicts of interest
There are no conflicts of interest to declare.Acknowledgements
H. L. acknowledges financial support from the China Scholarship Council.References
- D. Wu, L. Zhao, S. Hao, Q. Jiang, F. Zheng, J. W. Doak, H. Wu, H. Chi, Y. Gelbstein and C. Uher, J. Am. Chem. Soc., 2014, 136, 11412–11419 CrossRef CAS PubMed.
- J. P. Heremans, V. Jovovic, E. S. Toberer, A. Saramat, K. Kurosaki, A. Charoenphakdee, S. Yamanaka and G. J. Snyder, Science, 2008, 321, 554–557 CrossRef CAS PubMed.
- Y. Pei, X. Shi, A. LaLonde, H. Wang, L. Chen and G. J. Snyder, Nature, 2011, 473, 66–69 CrossRef CAS PubMed.
- L. Zhao, G. Tan, S. Hao, J. He, Y. Pei, H. Chi, H. Wang, S. Gong, H. Xu and V. P. Dravid, Science, 2016, 351, 141–144 CrossRef CAS PubMed.
- S. Perumal, S. Roychowdhury, D. S. Negi, R. Datta and K. Biswas, Chem. Mater., 2015, 27, 7171–7178 CrossRef CAS.
- K. Biswas, J. He, I. D. Blum, C. Wu, T. P. Hogan, D. N. Seidman, V. P. Dravid and M. G. Kanatzidis, Nature, 2012, 489, 414–418 CrossRef CAS PubMed.
- M. G. Kanatzidis, Chem. Mater., 2010, 22, 648–659 CrossRef CAS.
- G. Zhang, B. Kirk, L. A. Jauregui, H. Yang, X. Xu, Y. P. Chen and Y. Wu, Nano Lett., 2012, 12, 56–60 CrossRef CAS PubMed.
- L. Zhao, S. Lo, Y. Zhang, H. Sun, G. Tan, C. Uher, C. Wolverton, V. P. Dravid and M. G. Kanatzidis, Nature, 2014, 508, 373–377 CrossRef CAS PubMed.
- S. N. Guin, A. Chatterjee, D. S. Negi, R. Datta and K. Biswas, Energy Environ. Sci., 2013, 6, 2603–2608 RSC.
- H. Liu, X. Shi, F. Xu, L. Zhang, W. Zhang, L. Chen, Q. Li, C. Uher, T. Day and G. J. Snyder, Nat. Mater., 2012, 11, 422–425 CrossRef CAS PubMed.
- W. Qiu, L. Xi, P. Wei, X. Ke, J. Yang and W. Zhang, Proc. Natl. Acad. Sci. U.S.A., 2014, 111, 15031–15035 CrossRef CAS PubMed.
- E. M. Levin, S. L. Bud'Ko and K. Schmidt Rohr, Adv. Funct. Mater., 2012, 22, 2766–2774 CrossRef CAS.
- J. Shen, X. Zhang, S. Lin, J. Li, Z. Chen, W. Li and Y. Pei, J. Mater. Chem. A, 2016, 4, 15464–15470 RSC.
- W. Li, S. Lin, X. Zhang, Z. Chen, X. Xu and Y. Pei, Chem. Mater., 2016, 28, 6227–6232 CrossRef CAS.
- Y. Pei and D. T. Morelli, Appl. Phys. Lett., 2009, 94, 122112 CrossRef.
- H. Fang, T. Feng, H. Yang, X. Ruan and Y. Wu, Nano Lett., 2013, 13, 2058–2063 CrossRef CAS PubMed.
- H. Fang, H. Yang and Y. Wu, Chem. Mater., 2014, 26, 3322–3327 CrossRef CAS.
- L. Zhao, V. P. Dravid and M. G. Kanatzidis, Energy Environ. Sci., 2014, 7, 251–268 RSC.
- L. Yang, Z. Chen, M. Hong, G. Han and J. Zou, ACS Appl. Mater. Interfaces, 2015, 7, 23694–23699 CrossRef CAS PubMed.
- R. Moshwan, L. Yang, J. Zou and Z. G. Chen, Adv. Funct. Mater., 2017, 27, 1703278 CrossRef.
- Q. Zhang, F. Cao, W. Liu, K. Lukas, B. Yu, S. Chen, C. Opeil, D. Broido, G. Chen and Z. Ren, J. Am. Chem. Soc., 2012, 134, 10031–10038 CrossRef CAS PubMed.
- G. Li, U. Aydemir, B. Duan, M. T. Agne, H. Wang, M. Wood, Q. Zhang, P. Zhai, W. A. Goddard III and G. J. Snyder, ACS Appl. Mater. Interfaces, 2017, 9, 40488–40496 CrossRef CAS PubMed.
- S. V. Barabash, V. Ozolins and C. Wolverton, Phys. Rev. B, 2008, 78, 214109 CrossRef.
- N. Chen, F. Gascoin, G. J. Snyder, E. Müller, G. Karpinski and C. Stiewe, Appl. Phys. Lett., 2005, 87, 171903 CrossRef.
- Y. Gelbstein, J. Davidow, S. N. Girard, D. Y. Chung and M. Kanatzidis, Adv. Energy Mater., 2013, 3, 815–820 CrossRef CAS.
- S. Gorsse, P. Bauer Pereira, R. Decourt and E. Sellier, Chem. Mater., 2010, 22, 988–993 CrossRef CAS.
- S. Gorsse, P. Bellanger, Y. Brechet, E. Sellier, A. Umarji, U. Ail and R. Decourt, Acta Mater., 2011, 59, 7425–7437 CrossRef CAS.
- D. Davila Pineda, A. Rezaniakolaei, O. Brand, G. K. Fedder, C. Hierold, J. G. Korvink and O. Tabata, Thermoelectric energy conversion: basic concepts and device applications, John Wiley & Sons, 2017 Search PubMed.
- R. M. Murphy, É. D. Murray, S. Fahy and I. Savić, Phys. Rev. B, 2017, 95, 144302 CrossRef.
- D. K. Hohnke, H. Holloway and S. Kaiser, J. Phys. Chem. Solids, 1972, 33, 2053–2062 CrossRef CAS.
- A. C. Larson and R. B. von Dreele, Los Alamos National Laboratory LAUR Report 2004, No. 86-748 Search PubMed.
- P. A. Vermeulen, A. Kumar, G. H. Ten Brink, G. R. Blake and B. J. Kooi, Cryst. Growth Des., 2016, 16, 5915–5922 CrossRef CAS.
- S. G. Parker, J. E. Pinnell and L. N. Swink, J. Mater. Sci., 1974, 9, 1829–1832 CrossRef CAS.
- T. Nonaka, G. Ohbayashi, Y. Toriumi, Y. Mori and H. Hashimoto, Thin Solid Films, 2000, 370, 258–261 CrossRef CAS.
- G. A. Akhmedova and D. S. Abdinov, Inorg. Mater., 2009, 45, 854–858 CrossRef CAS.
- H. Kim, Z. M. Gibbs, Y. Tang, H. Wang and G. J. Snyder, APL Mater., 2015, 3, 41506 CrossRef.
- Y. Gelbstein and J. Davidow, Phys. Chem. Chem. Phys., 2014, 16, 20120–20126 RSC.
- J. Li, H. Wu, D. Wu, C. Wang, Z. Zhang, Y. Li, F. Liu, W. Q. Ao and J. He, Chem. Mater., 2016, 28, 6367–6373 CrossRef CAS.
- J. F. Deng, J. Q. Li, R. F. Ye, X. Y. Liu, F. S. Liu and W. Q. Ao, J. Alloys Compd., 2014, 585, 173–177 CrossRef CAS.
- Z. Bu, Z. Chen, X. Zhang, S. Lin, J. Mao, W. Li, Y. Chen and Y. Pei, Mater. Today Phys., 2020, 15, 100260 CrossRef.
Footnotes |
| † Electronic supplementary information (ESI) available. See DOI: 10.1039/d1ta01788h |
| ‡ Current address: Malvern Panalytical B. V., Lelyweg 1, 7602 EA Almelo, The Netherlands. |
| This journal is © The Royal Society of Chemistry 2021 |