
 Open Access Article
 This Open Access Article is licensed under a Creative Commons Attribution-Non Commercial 3.0 Unported Licence
Epitaxial LaMnO3 films with remarkably fast oxygen transport properties at low temperature†
Raquel
Rodriguez-Lamas
 a,
Caroline
Pirovano
b,
Alexander
Stangl
a,
Dolors
Pla
a,
Ragnar
Jónsson
a,
Laetitia
Rapenne
a,
Eirini
Sarigiannidou
a,
Nicolas
Nuns
b,
Hervé
Roussel
a,
Odette
Chaix-Pluchery
a,
Michel
Boudard
a,
Carmen
Jiménez
a,
Rose-Noëlle
Vannier
b and
Mónica
Burriel
*a
a,
Caroline
Pirovano
b,
Alexander
Stangl
a,
Dolors
Pla
a,
Ragnar
Jónsson
a,
Laetitia
Rapenne
a,
Eirini
Sarigiannidou
a,
Nicolas
Nuns
b,
Hervé
Roussel
a,
Odette
Chaix-Pluchery
a,
Michel
Boudard
a,
Carmen
Jiménez
a,
Rose-Noëlle
Vannier
b and
Mónica
Burriel
*a
aUniv. Grenoble Alpes, CNRS, Grenoble INP, LMGP, 38000 Grenoble, France. E-mail: monica.burriel@grenoble-inp.fr
bUniv. Lille, CNRS, Centrale Lille, Univ. Artois, UMR 8181 – UCCS – Unité de Catalyse et Chimie du Solide, F-59000 Lille, France
First published on 19th May 2021
Abstract
Ionic transport-related phenomena are of primary importance for the development and miniaturization of energy conversion devices such as solid oxide fuel cells and electrolysers, oxygen separation membranes and memristive devices. By using LaMnO3 (LMO) epitaxial thin films, we studied the effects of temperature, extended structural defects and strain on the oxygen mass transport properties of this parent compound perovskite by isotope exchange depth profiling. By combining the oxygen transport measurements with a detailed structural characterization using several complementary techniques, we showed that the combination of extended defects and strain relaxation accelerates the oxygen transport across the LMO film. Additionally, we demonstrated that the oxygen diffusion at 500 °C is extraordinary high due to the prevalence of the orthorhombic structure in the film, together with a high concentration of oxygen vacancies. These promising results open new perspectives for the use of LMO below its transition temperature for low temperature solid-state electrochemical applications in which oxygen diffusion is the key parameter determining the device performance.
Introduction
In the early 2000s with the need for new ionic solid-state electrochemical micro devices for energy conversion and storage devices, such as micro batteries and micro fuel cells, and for information storage, such as redox-based resistance random access memories (ReRAM), research on fast ion transport phenomena and their applications became a hot topic. Amidst the materials required for these applications, oxygen ion conductors (OIC), mixed ionic-electronic conductors (MIEC)1 and composites of both (OIC + MIEC)2 are of particular interest.In this field, micro solid oxide fuel cells (μ-SOFCs) are one of the most promising candidates as power sources for portable electronic devices, as they have been predicted to have the highest energy density and specific energy.3–6 In these devices the catalytic reduction of oxygen ions takes place at the cathode, which requires materials with both high oxygen surface exchange and diffusion coefficients at operating temperatures, typically above 400 °C.3,6–8
The surface exchange kinetics and ionic conductivity can be improved by introducing strain in the lattice, as reported for a large number of electrolyte and electrode-type materials,9–14 including many perovskite oxides. In addition, the role of dislocations in the ion diffusion has also been studied for several epitaxial perovskite films.15–17 For SrTiO3, dislocations normal to the oxygen diffusion direction slow down the ion transport, while those parallel to the diffusion direction do not accelerate it.15,16 In contrast, in the case of La0.8Sr0.2MnO3 (LSM) manganites, it has been claimed that dislocations in the form of half loops starting parallel to the oxygen diffusion direction accelerate oxygen transport.17 It has also been reported for several polycrystalline perovskite compositions18–21 that grain boundaries (GBs) highly enhance both oxygen exchange and diffusion.
In this work, we investigated the ionic mass transport properties using the parent compound LaMnO3+δ (LMO) as a promising oxygen electrode for μ-SOFCs. LMO possesses a distorted perovskite structure, consisting of corner sharing MnO6 oxygen octahedra with a central Mn atom, and La cations occupying the 12-fold coordination site formed in the middle of the cube of eight such octahedra. The LMO crystal structure undergoes two phase transitions upon heating. For stoichiometric LMO (δ = 0) the first transition occurs at a temperature close to 477 °C, which corresponds to a Jahn–Teller (JT) transition from an orthorhombically distorted perovskite structure (O′), with very different a and b cell parameters, to a second orthorhombic structure (O) characterized by a strong unit cell symmetrization with almost identical a, b and  cell parameters.22,23 Both orthorhombic phases are described by the same space group (Pbnm). At ∼737 °C the second transition takes place, corresponding to a change from orthorhombic to rhombohedral (R-3c) symmetry. It is important to note that the temperature of these structural transitions will depend on the exact LMO stoichiometry and that for higher oxygen contents (δ > 0) the temperatures of these transitions are lower than for the stoichiometric compound.24 Furthermore, at room temperature the LMO can be in the O′ orthorhombic phase (for δ close to 0), in the O phase (for intermediate δ), or in the rhombohedral phase (for high δ), depending on the oxygen off-stoichiometry due to preparation/annealing conditions. These structural transitions correspond to Mn3+ to Mn4+ valence changes which occur at Mn4+ percentages of 14 and 22%, respectively.22,24–26 In this line, in a previous study we developed different deposition strategies which allow to tune the oxygen content in LMO polycrystalline films.27 We demonstrated that the evolution of the crystal structure from orthorhombic to rhombohedral was bound to the increase in Mn+4 content.27 It should be pointed out that the apparent hyperstoichiometry in LaMnO3+δ under oxidizing conditions (δ > 0) has been ascribed to the presence of cation vacancies (
 and
and  in Kröger–Vink notation) in the perovskite structure.28
In addition to the presence of point defects, in the form of substitutional ions, cation and oxygen vacancies, LMO epitaxial thin films also present a number of extended defects, such as planar defects, stacking faults or dislocations, which form in the film to partially release the substrate-induced macroscopic strain. Here, epitaxial LMO films with low and high densities of extended defects were obtained by growing them by pulsed injection metal organic chemical vapor deposition (PI-MOCVD) on two different substrates: SrTiO3 (STO) and LaAlO3 (LAO). The oxygen exchange and diffusion properties close to 500 and 600 °C of the epitaxial LMO films were evaluated by the Isotope Exchange Depth Profile (IEDP) methodology combined with Time-of-Flight Secondary Ion Mass Spectrometry (ToF-SIMS). The combined influence of temperature, strain and extended defects on the oxygen mass transport properties was evaluated. We show how the incorporation of oxygen into the LMO film and the oxygen ion transport can be smartly maximized by working at low temperatures, at which the orthorhombic phase is the predominant one in the film, and by playing with the strain and extended defects' concentration induced by the film-substrate mismatch.
Experimental
Thin film deposition
LMO thin films were grown by PI-MOCVD in a JIPELEC PI-MOCVD reactor. This technique allows to grow uniform and conformal films over large areas and within a circular area of 4 cm diameter for this particular reactor. Here, we deposited LMO films with a controlled thickness and composition on 10 × 10 mm2 single crystal STO (001) and LAO (100) substrates (from CrysTech). The film growth method is described in the previous work by Rodriguez-Lamas et al.27 The specific deposition conditions used here were: a deposition temperature of 700 °C, a 50% Ar and 50% O2 atmosphere with a total pressure of 5 Torr and a precursor solution of La(thd)3 and Mn(thd)3 in m-xylene (where La/Mn = 2) with a total metallic precursor concentration of 0.023 M. The injection conditions were selected to obtain dense LMO thin films (11–12 nm thick), through the injection of 2500 pulses with a pulse frequency of 2.5 Hz and 2 ms of electrovalve opening time. After growth, the dense thin films were cooled down in the same O2 partial pressure for approximately 20 minutes, and then cooled down in an Ar atmosphere. Thicker LMO films (∼ 66 nm) were also deposited by the injection of 6000 pulses. Their Raman spectra are shown in the ESI.†Structural characterization
The structural characterization of the LMO film was performed by X-ray diffraction (XRD) in Bragg–Brentano θ–2θ configuration in a Bruker D8 Advance series II diffractometer, with monochromatic CuKα1 radiation (λ = 1.5406 Å) and 1D detector (Bruker Lynxeye). The diffractogram was collected from 20 to 110° (2θ) with a step of 0.011° and 2 s counting time by step. The sample was spinning during the measurement.In addition, Raman spectroscopy was carried out to elucidate the exact phase structure using a Jobin Yvon/Horiba Labram spectrometer equipped with a liquid nitrogen cooled CCD detector. The 514.5 nm excitation line of an Ar+ laser was focused to a 1 μm2 spot on the sample using an objective 100×. The laser power on the sample surface was close to 0.7 mW. Spectra were calibrated at room temperature using a silicon reference sample with a theoretical position of 520.7 cm−1.
Scanning electron microscopy (SEM) was used for surface morphology and homogeneity characterization using a FEG Gemini SEM 500 microscope. Images were acquired with an energy of 3 kV in high vacuum mode and at a working distance of 2.6 mm. Atomic force microscopy (AFM) was used to measure the roughness of the films. AFM topography scan in tapping mode was performed in an AFM (Veeco) Digital Instruments Dimension 3100 through the Nanoscope interface, and the Gwyddion software was used for data treatment (extraction of the root mean square, RMS, roughness data). Cross-sections of the samples were prepared by the semi-automated polishing tripod technique with the MultiPrepTM system (Allied High Tech Products, Inc.). The PIPS II from GATAN system was used for the final polishing. Transmission electron microscopy (TEM) and high resolution TEM (HRTEM) images were recorded with a JEOL JEM 2010 LaB6 microscope operating at 200 kV with a 0.19 nm point-to-point resolution to observe the crystal structure and microstructure of the films cross-section. In order to quantify the strain induced in the epilayer due to the lattice mismatch between the substrate and the LMO film, HRTEM images were analysed using the Geometric Phase Analysis (GPA) method.29,30
Isotope exchange depth profiling technique
For 18O/16O isotope exchange experiments, the samples were placed in an exchange rig equipped with a quartz tube. They were pre-annealed in pure oxygen of natural isotopic abundance (0.20% of 18O) at ∼200 mbar for 1 h at the same temperature as the subsequent exchange experiment. In order to avoid crack formation in the samples, the furnace was heated and cooled using a 5 °C min−1 rate. Once back to room temperature, natural oxygen was pumped out. Then, 18O enriched oxygen (Ptotal ∼200 mbar) was introduced into the tube and 18O/16O exchanges were carried out with the same heating/cooling rate. Two different intermediate temperatures in the range of μ-SOFCs operation were selected, i.e. 504 °C and 609 °C, with 8 h and 1 h plateaux, respectively. For the sake of simplicity, in the future description we will indicate 500 °C and 600 °C as the exchange temperatures. Note that the effective 18O exchange time was calculated taking into account the finite increase/decrease in the sample temperature.31 To quantify the 18O isotope content in the gas phase, prior to the experiments, a piece of silicon wafer was annealed at 1000 °C for 3 h to grow a SiO2 layer, which was analysed by SIMS, obtaining an 18O fraction of 0.895. For further structural analysis, some pristine pieces of the same LMO samples were annealed in air using an equivalent thermal history to that of the isotopic exchanged samples (adding the times corresponding to the pre-anneal in 16O and to the exchange in 18O).A ToF-SIMS V instrument (ION-TOF GmbH Germany) equipped with a Bi liquid metal ion gun (LMIG) for analysis and a caesium (Cs+) gun for sputtering was used for the oxygen isotope analyses. Negative secondary ions were collected and the data were obtained in burst mode operation (6 pulses), applying Poisson correction. More details on this ToF-SIMS operation mode can be found in ref. 32. Charge effects were compensated by means of a 20 eV pulsed electron flood gun. A 300 × 300 μm2 surface area was sputtered with the Cs+ ion beam (1 keV, 85 nA) before analysis with the Bi3+ primary ion beam (25 keV, 0.25 pA) rastered over a 100 × 100 μm2 surface area. Several SIMS depth profiles were measured for each of the exchanged samples to ensure reproducibility of the measurements and homogeneity of the studied films.
In order to estimate the oxygen diffusion (D*) and exchange (k*) coefficients of the dense LMO thin films, the oxygen concentration profiles were analysed using the analytical solutions to the diffusion equation for a plane sheet model developed by Crank33 (see section Model describing oxygen exchange and diffusion and Fig. SI 2 in the ESI for further details of the physical model used†) and fitted by least squares. In addition, when a proper fit was not obtained using a single homogeneous film model, the finite element method (FEM) was used to simulate the oxygen concentration profiles and extract the mass transport parameters using the Chemical Reaction Engineering and optimization module by COMSOL Multiphysics.
Results and discussion
Structural characterization of the LMO films
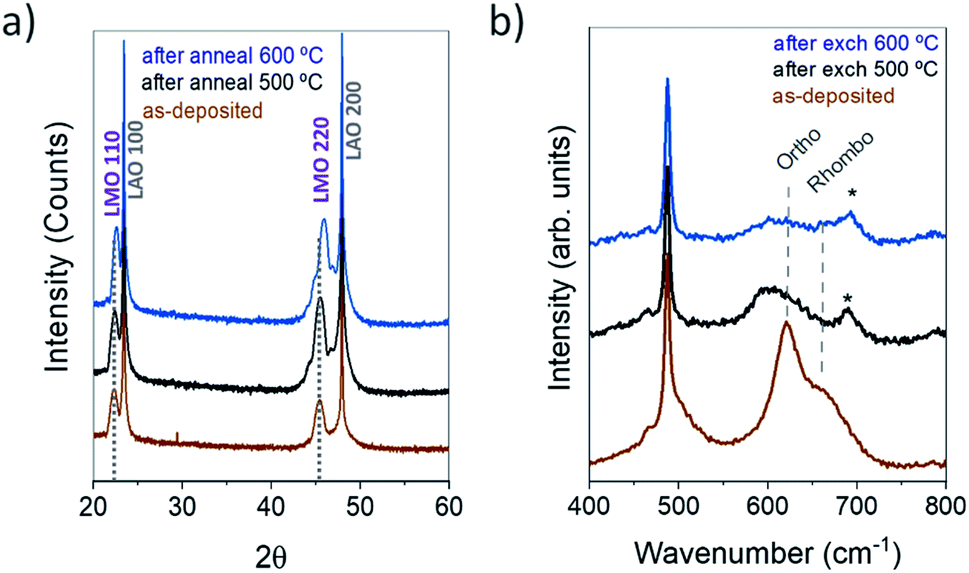
In the diffractograms of the as-deposited LMO films grown on STO (Fig. 1a) and on LAO (Fig. 1b) by the injection of 2500 pulses, only the hh0 (hk0, with h = k) reflections of orthorhombic LMO (Pbnm space group) can be observed in addition to the substrate reflections, confirming the good crystalline quality, single phase and single orientation of the LMO films. In the case of LMO/STO, the LMO reflections appear at the left side and partly overlapped with the STO reflections due to the close matching cell parameters. The out-of-plane pseudocubic cell parameters obtained are of 3.98 Å for the LMO/LAO film and about 3.95 Å for the LMO/STO film, although this is an approximate value due to the film-substrate peak overlapping. For simplicity, throughout the article the LMO films have been indexed using the Pbnm space group characteristic of stoichiometric LaMnO3 with low oxygen content. However, as will be later explained, in some cases after an annealing/exchange process, the LMO films could be composed of a mixture of orthorhombic (Pbnm) and rhombohedral (R-3c) phases.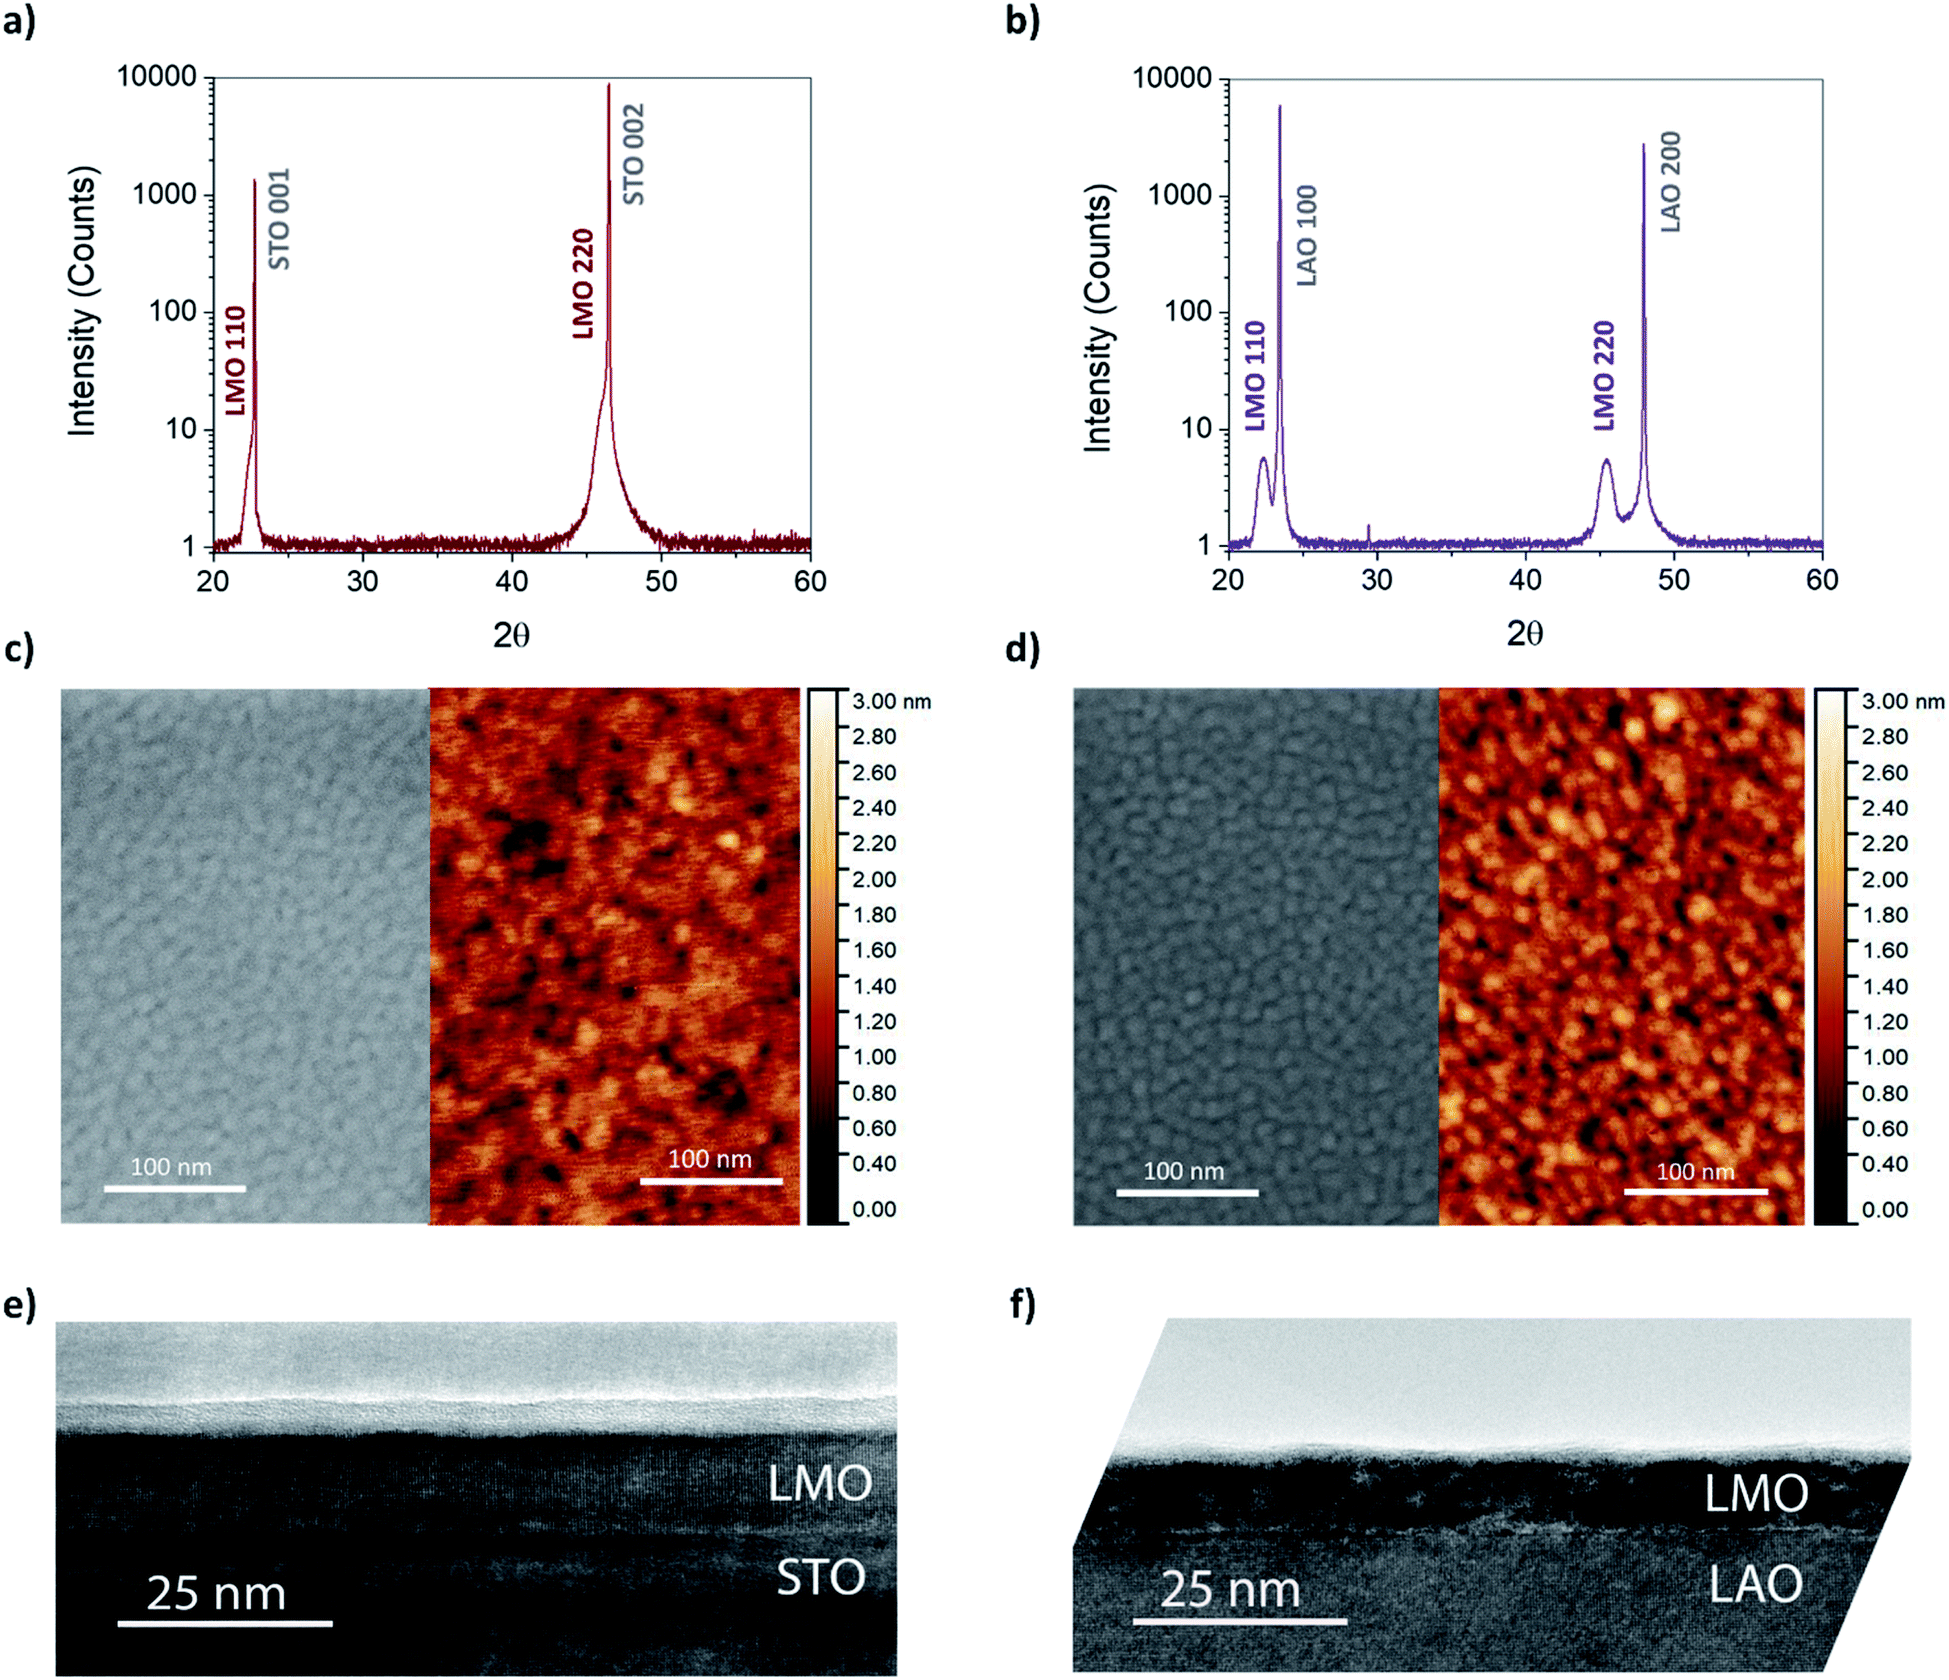 | ||
| Fig. 1 Structural characterization of the dense thin LMO films. XRD θ–2θ patterns obtained for as-deposited films: (a) LMO/STO, (b) LMO/LAO. LMO, LAO and STO peaks are indexed in the orthorhombic, pseudocubic and cubic systems, respectively. SEM (left) and AFM (right) top views including the AFM height scale (right), providing a topography image and a roughness reference of the films after the exchange at 500 °C: (c) LMO/STO, (d) LMO/LAO, respectively. TEM bright field cross-section image of the films exchanged at 500 °C: (e) LMO/STO, ∼12 nm thick, seen along the [001] zone axis for STO and (f) LMO/LAO, ∼11 nm thick, seen along the [001] zone axis for LAO. | ||
While the thin film deposition occurs at a temperature above the phase transition (TJT ≈ 477 °C),22,23 during the cooling of the sample a cooperative Jahn–Teller (JT) transition is expected to take place in LMO, resulting in an orthorhombic crystallographic structure with highly distorted MnO6 octahedra. The cell parameters used as reference are given in Table 1, they were measured by Ritter et al. for LMO bulk samples obtained by annealing in Ar (δ = 0) and as prepared (δ = 0.07).34 As schematically represented and explained by Pomar et al.,35 when grown on single crystal perovskite substrates and in order to accommodate the JT structural distortion at room temperature, stoichiometric LMO can present 2 different orientations, namely 〈110〉 and 〈001〉, which correspond to the orthorhombic Pbnm c parameter in-plane or out-of-plane, respectively.35 The d[110]LMO and d[001]LMO Mn–Mn distances, corresponding to these 2 orientations for the Pbnm orthorhombic LMO, are included in Table 1. For both STO and LAO substrates, a 〈110〉 orientation is favoured due to a better matching of film and substrate cell parameters.35 For low oxygen content (δ = 0), due to the JT distortions, d[110]LMO is considerably higher compared to d[001]LMO, while the two distances become much closer in value for δ = 0.07.
| δ | a (Å) | b (Å) | c (Å) | d [110]LMO (Å) | d [001]LMO (Å) |
|---|---|---|---|---|---|
| 0 | 5.5330 | 5.7273 | 7.6681 | 3.982 | 3.834 |
| 0.07 | 5.5069 | 5.4948 | 7.7638 | 3.890 | 3.882 |
The large cell parameters obtained for our LMO films (∼3.95 Å for LMO/STO and 3.98 Å for LMO/LAO) are in good agreement with a 〈110〉 orientation and a low δ value. The top view by SEM and AFM of films after 18O exchanges at 500 °C and 600 °C are given in Fig. 1c and d. Both analyses reveal grain sizes in the nanoscale (∼10–12 nm) and a very flat and homogeneous surface morphology with a film RMS roughness of only 0.33 ± 0.03 nm for LMO/STO and of 0.40 ± 0.03 nm for LMO/LAO. The cross-section TEM images presented in Fig. 1e and f demonstrate fully dense and homogeneous LMO films with thicknesses of 12.3 ± 0.3 nm and 11.2 ± 0.4 nm for LMO/STO (Fig. 1e) and LMO/LAO (Fig. 1f), respectively. However, in contrast to the high crystal quality films grown on STO, the LMO films grown on LAO exhibit a large amount of extended defects, as noticed at this low magnification scale.
Oxygen mass transport properties of the LMO films
To evaluate the oxygen surface exchange and transport across the LMO layer, the films were exchanged in 18O at 500 °C and 600 °C (see sketch of the isotope exchange process in Fig. 2a). These temperatures were selected as they correspond to operating conditions which are commonly used for μ-SOFCs.6,37 It is worth noting that for each temperature both samples were exchanged simultaneously. After the isotopic exchange, the 18O concentration profiles through the LMO/STO and LMO/LAO films were measured by ToF-SIMS. The depth profiles showing the secondary ion species of interest (LaO2−, MnO−, TiO−, 18O− and 16O) after the 18O exchange at 600 °C for 1 h obtained for LMO/STO and LMO/LAO are shown in Fig. SI 1a and b in the ESI.† | ||
| Fig. 2 (a) Scheme of the isotopic exchanges in LMO dense films. Comparative normalized 18O isotopic fraction for LMO films grown on STO and LAO exchanged (b) at 500 °C for 8 h and (c) at 600 °C for 1 h. The magenta diamond pattern indicates the film/substrate interface region which is not taken into account for the fitting due to the intermixing of ion species from the LMO film and the substrate. The blue background pattern corresponds to the total thickness of the film (11–12 nm). | ||
The normalized 18O isotopic fraction C′ depth profiles calculated from the SIMS measurements for the LMO films exchanged at 500 °C and 600 °C are plotted in Fig. 2b and c, respectively. C′(x) is calculated according to eqn (1) and (2):
 | (1) |
 | (2) |
The normalized concentration profiles for the LMO/STO thin films (red squares in Fig. 2b and c) show curved profiles, with a decrease in concentration from the top surface towards the bottom interface, as expected. In the case of LMO/LAO thin films exchanged at 500 °C (blue circles in Fig. 2b), the profile shows a high normalized isotopic concentration close to 0.78. The profile is rather flat throughout the majority of the film thickness, with a decrease in 18O concentration at the top surface and at the bottom interface. The fact that the signals corresponding to surface contaminant species (such as F− and Cl−) steeply drop over a very small depth from the top surface strongly suggests that the normalized isotopic profiles obtained across the LMO films correspond to a real diffusion process, and not to the ion-beam mixing (see explanation and Fig. SI 1c and d in the ESI†). The much higher isotopic concentration reached, together with a much flatter profile when compared to the film grown on STO substrate, indicates that both the oxygen surface exchange and diffusion coefficients at 500 °C are much higher for the film grown on LAO.
Oxygen tracer diffusion (D*) and surface exchange (k*) coefficients were obtained by non-linear least squares regression curve fitting of the measured diffusion profiles to the solution of Fick's second law solved for diffusion in an infinite solid slab by Crank.33 The corresponding equations and the boundary conditions for the plane sheet model are detailed in the ESI (schematics of the model shown in Fig. SI 2†). To validate the results, several concentration profiles were measured in different regions of the sample obtaining always similar results. Note that as the penetration of the Cs+ ion beam reaches several nanometers, a mixture of oxygen ions from the film and the substrate is measured when the interfacial zone is reached. Accordingly, the region of 1 nm closest to the substrate was not taken into account for the fit (marked as a magenta background region in Fig. 2b and c). Exemplarily for 600 °C, the fits for the plane sheet model (single region) are shown in Fig. SI 3a and b.†
As a first approximation, this simple model (homogeneous diffusion coefficient through the LMO film) has the advantage of allowing the extraction of the effective oxygen transport parameters and the direct comparison between films grown on different substrates and exchanged simultaneously. However, it should be pointed out that the fitted curves deviate somewhat from the experimental data. This observation is very common in thin films, and has been previously reported for other epitaxial layers such as La2NiO4 (ref. 38) and (La1−xSrx)2CoO4 (ref. 39) with Ruddlesden–Popper structure, and Sr-doped LMO (LSM)17,18 with perovskite structure. These deviations can have different origin, such as fast diffusion through dislocations, or arise due to composition, defect-chemistry and/or strain-related differences in the film as a function of depth. In particular, the slightly “humped” shape of the LMO/LAO concentration profile at 500 °C (blue circles in Fig. 2b), with low 18O concentration values in the first nanometers of the top surface, had been also previously observed for (La1−xSrx)2CoO4 (ref. 39) films, and attributed to either the presence of surface segregation in the outermost surface region of the film, or to the back-diffusion of 16O at room temperature. Here, we propose that the very similar profile measured for LMO/LAO could have a similar origin, in this case due to potential La-cation segregation, or to oxygen back-exchange. As for the 600 °C profiles of the LMO films on both substrates (Fig. 2c), the origin of the deviation from the ideal solution is discussed in detail in the following section.
The D* and k* values obtained from the fits are reported in Table 2. At 600 °C both oxygen transport coefficients are similar, but slightly higher for the films grown on LAO  However, remarkably, at 500 °C the effective surface exchange coefficient (k*) is 3 times larger for the LMO film grown on LAO. At 500 °C it was not possible to obtain an exact
  coefficient due to the shape of the concentration profile. Nevertheless, in order to obtain the minimum D* value
  in the bottom film region, a fitting was also carried out taking into account only the film region with a slight curvature (from 1 to 5.5 nm approximately). This led to a
  of 1.2 ± 0.1 × 10⁻¹⁶ cm2 s−1, already more than three times larger than the
  at the same temperature. The real
  is expected to be larger; however, a more accurate determination is not possible in this case, as given the thin thickness and fast diffusion, the system is indeed in the surface limited regime.
| Temp (°C) | k* (cm s−1) | D* (cm2 s−1) | ||
|---|---|---|---|---|
| LMO/STO | LMO/LAO | LMO/STO | LMO/LAO | |
| 500 | 1.8 ± 0.4 × 10⁻¹¹ | 5.8 ± 0.5 × 10⁻¹¹ | 3.8 ± 0.2 × 10⁻¹⁷ | >1.2 × 10⁻¹⁶ |
| 600 | 2.6 ± 0.1 × 10⁻¹⁰ | 3.1 ± 0.1 × 10⁻¹⁰ | 6.2 ± 0.4 × 10⁻¹⁷ | 7.8 ± 0.5 × 10⁻¹⁷ |
The average k* and D* values from Table 2 are presented in Arrhenius plots in Fig. 3, together with values reported in literature for LMO pellets with different La/Mn stoichiometry at high temperatures. Prior to the 18O exchange step, the pellets had been pre-equilibrated in 16O2 atmosphere at the given exchange temperature. In the case of the surface exchange coefficient k* (Fig. 3a), the values obtained for the LMO/STO films fit perfectly the tendency shown for LaMnO3 and La0.9MnO3 pellets40 (by low temperature extrapolation). However, as previously mentioned, the  at 500 °C is almost three times higher than
  and it is also higher than that expected for the polycrystalline bulk samples, indicating that the microstructural differences between the films could lead to an enhancement in the LMO/LAO oxygen transport properties.
 | ||
| Fig. 3 Arrhenius plots of the oxygen tracer: (a) surface exchange and (b) diffusion coefficients for LMO/STO and LMO/LAO epitaxial films grown by PI-MOCVD (this work). Comparison with data obtained for LaMnO3 and La0.9MnO3 pellets from Berenov et al.40 | ||
Fig. 3b shows that the diffusion coefficients at 600 °C have (similar) slightly higher values than those expected from LaMnO3 and La0.9MnO3 pellets40 by low temperature extrapolation following the same slope (activation energy). However, at 500 °C extraordinarily fast D* values have been measured for both films, larger by at least one order of magnitude than those expected by simple low temperature extrapolation. For LMO/STO, the values are close to those measured at 600 °C, while they are even larger for LMO/LAO. It should be noted that in the case of the LMO/LAO, the plotted  values correspond to a minimum
  in the bottom part of the film, while the real
  value throughout the film could not be measured due to the fast diffusion. To the best of our knowledge, these unexpectedly high diffusion coefficients at 500 °C had never been reported. Their origin will be explained in a subsequent section.
Regions with different oxygen mass transport properties
In contrast to the numerous studies related to the oxygen transport properties in polycrystalline18,20 and epitaxial17 LSM thin films, to the best of our knowledge oxygen transport coefficients had only been previously studied for bulk LMO, and never for LMO in the form of thin films. In both polycrystalline and epitaxial LSM films, extended structural defects parallel to the diffusion direction (grain boundaries and dislocations) are considered as the origin of the enhanced k* and D* values, and of the appearance of two distinct slopes in the diffusion profile. For LSM films the profile fitting was carried out using a model with two parallel diffusion paths: bulk and grain boundaries for the polycrystalline films,18,20 and bulk and dislocations for the LSM epitaxial films grown on LAO.17 In the latter case, an additional dislocation-free LSM interfacial region with a different diffusion coefficient had to be added in the model to properly fit the profiles.In order to understand the observed deviations from an ideal diffusion profile in the LMO thin films, an in-depth analysis of the microstructure of the LMO layers was carried out. The HRTEM high magnification images (Fig. 4) show an epitaxial growth for both LMO/STO and LMO/LAO films, but with remarkable differences depending on the substrate. Fig. 4a presents a HRTEM bright field image and the selected area electron diffraction (SAED) pattern of the LMO film on STO, showing a high quality film, free of extended defects, with a perfect cube on cube (perovskite on perovskite) growth. In contrast, the HRTEM bright field image in Fig. 4c confirms the elevated density of extended defects in the LMO/LAO thin films.
 | ||
| Fig. 4 HRTEM cross section images, corresponding diffraction patterns and inverse Fourier transform filtered images of the LMO films exchanged at 500 °C. The epitaxial growth of the LMO film can be observed on top of both STO and LAO substrates (cube on cube). (a) HRTEM image of a 12 nm epitaxial LMO/STO film seen along the STO [001] zone axis. SAED inset at the interface area taken in the STO [001] zone axis (LMO [001] zone axis), (b) Fourier transform showing the reciprocal space related to the same section as in (a). The inverse Fourier transform was performed applying a mask on the (−110) and (010) spatial frequencies of LMO and STO respectively to show only the planes perpendicular to the surface proving a perfect parallelism of these planes across the interface and throughout the whole film, (c) HRTEM image and corresponding SAED of a 11 nm epitaxial LMO/LAO film along the LAO [001] zone axis (LMO [001] zone axis). The white dotted lines mark the top LMO surface and the LMO/LAO interface. (d) Fourier transform showing the reciprocal space related to same section as in (c). The inverse Fourier transform was performed applying a mask on the (−110) and (010) spatial frequencies of LMO and LAO respectively to show only the planes perpendicular to the surface. No dislocations nor other extended defects are observed in the LMO/STO film, while a considerable number of extended defects are observed in the LMO/LAO film. | ||
First, we focused on the LMO/STO films and tried to explain the origin of the differences between the theoretical and real oxygen concentration profiles (see red squares and solid blue line as example of fit in Fig. SI 3a†). Indeed, the oxygen concentration profiles measured for the LMO/STO films (Fig. 2b and c) can be well fitted by FEM using models with different regions: either parallel diffusion paths corresponding to dislocations/subgrain boundaries and bulk, or two regions in series with different D* values. However, for the LMO/STO films the selective area electron diffraction (SAED) pattern along the [001]STO zone axis (inset in Fig. 4a) shows that the film is clamped on the substrate with Qx,STO = Qx,LMO. The inset in Fig. 4b shows the Fourier transform extracted from Fig. 4a in which a mask is applied to the diffraction spots corresponding to the 010STO and −110LMO reflections. The inverse Fourier transform of the masked region (Fig. 4b) shows only the diffraction planes normal to the interface, it proves the very good epitaxial relationship of the planes across the interface and throughout the whole film, and thus confirms the absence of extended defects such as dislocations or subgrain boundaries. As the LMO thin film deposited on STO can be considered as a dense film, free of extended defects, showing epitaxial cube on cube growth on top of the STO substrate, we conclude that we have not found any experimental structural evidence to support the FEM model with parallel diffusion pathways for the LMO/STO films.
Next, in order to verify if the LMO/STO film consists of two regions in series (close and far from the bottom interface) with different D* values related to different strain states, the GPA method has been carried out in the HRTEM images of the LMO/STO thin films (Fig. 5a). The corresponding GPA strain (ε) images shown in Fig. 5b and c are calculated based on the following equations and by using a Gaussian mask of g/4 on the 100 spatial frequency of STO:
 | (3) |
 | (4) |
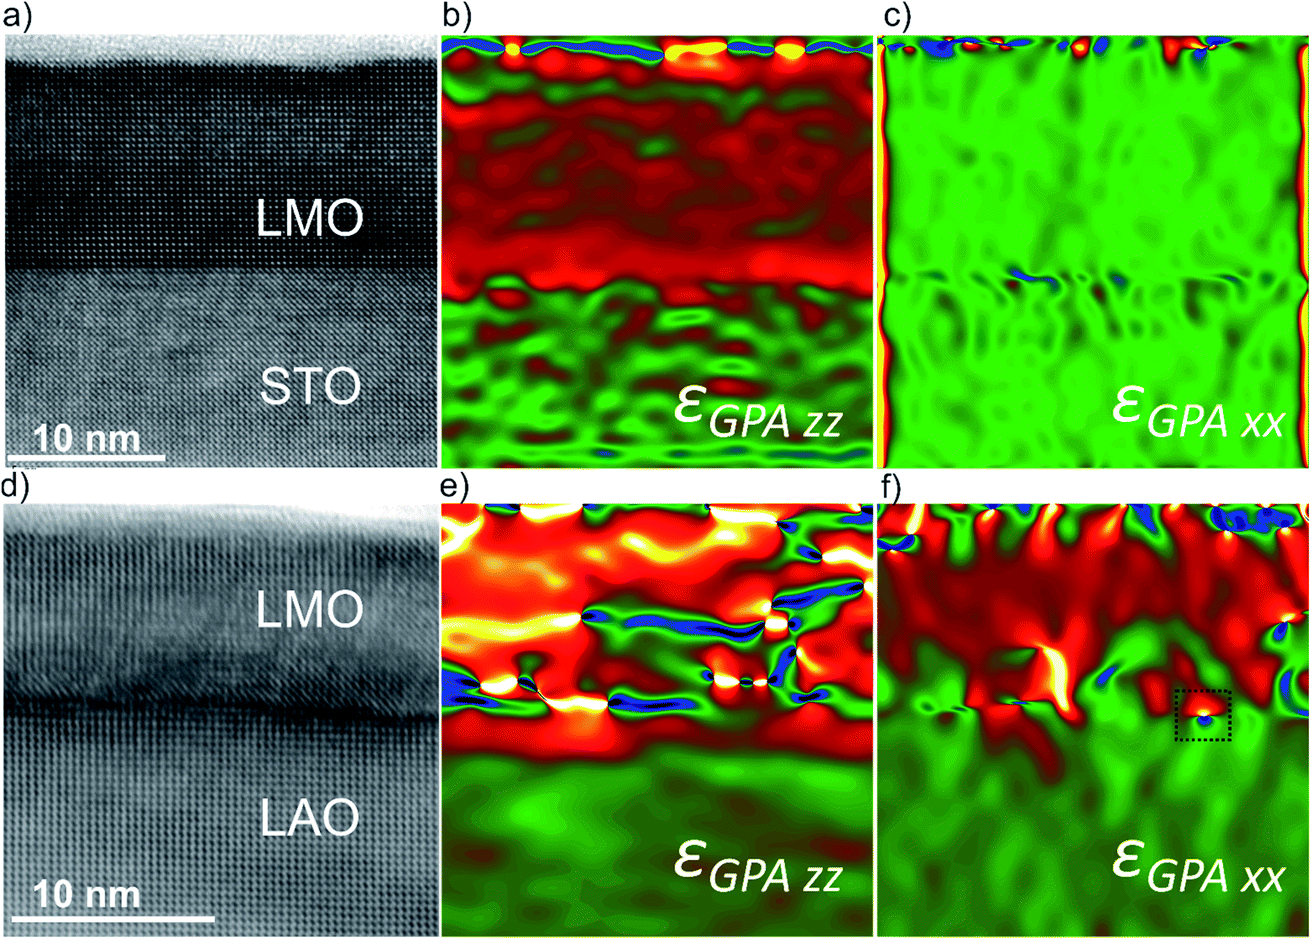 | ||
| Fig. 5 (a) HRTEM image of the 12 nm epitaxial LMO/STO film exchanged at 500 °C seen along the STO [001] zone axis. (b) Corresponding GPA strain image (εGPAzz) of the LMO layer with respect to the STO substrate along the [−1–10]LMO//[100]STO. The STO substrate is used as reference (i.e. εGPAzz = 0%) while the average εGPAzz in the LMO film is found equal to 2.3 ± 1%. (c) Corresponding GPA strain image (εGPAxx) of the LMO layer with respect to the STO substrate along the [−110]LMO//[010]STO. A negligible εGPAxx has been found. (d) HRTEM image of the 11 nm epitaxial LMO/LAO film exchanged at 500 °C seen along the LAO [001] zone axis. (e) Corresponding GPA strain image (εGPAzz) of the LMO layer with respect to the LAO substrate along the [−110]LMO//[010]LAO. The LAO substrate is used as reference (i.e. εGPAzz = 0%). An average εGPAzz in the LMO film is difficult to estimate due to the presence of a large number of extended defects. (f) Corresponding GPA strain image (εGPAxx) of the LMO layer with respect to the LAO substrate along the [−1–10]LMO//[010]LAO. The LAO substrate is used as reference (i.e. εGPAxx = 0%) while the average εGPAxx in the LMO film is found equal to 2.5 ± 1%. The square denotes the presence of a misfit dislocation in the LAO/LMO interface. | ||
The average calculated GPA out-of-plane strain (εGPAzz) is found equal to 2.3 ± 1% (Fig. 5b). The theoretical corresponding GPA strain (relative to STO) of relaxed LMO is expected to be equal to 1.9% for δ = 0 and −0.39% for δ = 0.07. In Fig. 5c, the GPA strain in the basal plane (εGPAxx) of LMO on STO is found to be negligible (zero in average). This means that assuming δ = 0 the LMO {110} planes are elastically compressed by ∼1.9% in order to adapt the d-spacing of the {010} STO planes. Fig. 5b further supports this assumption since no misfit dislocations are observed in the LMO/STO interface area when filtering the image. Within the experimental error, our GPA analysis concludes that both, the out-of-plane and in-plane strains are constant throughout the LMO film thickness. Therefore, a FEM model with two distinct regions in series with different D* in depth cannot be explained by different strain states.
Thus, we propose that the observed deviations from an ideal diffusion profile could come from local stoichiometry variations across the film, while the perovksite crystallographic structure is preserved through the film. Indeed, as can be clearly observed in Fig. SI 3a,† an excellent fit of the concentration profile is obtained if a model with two regions in series (with different D* values) is used. The best fit is obtained for a slow  at the top LMO region, a fast
  at the bottom LMO region, and the change from region 1 (slow) to region 2 (fast) at 7 nm from the bottom interface (leaving this distance as a free fitting parameter). Since the oxygen self-diffusivity (D*) is proportional to the vacancy diffusivity (Dv) and to the oxygen vacancy concentration,
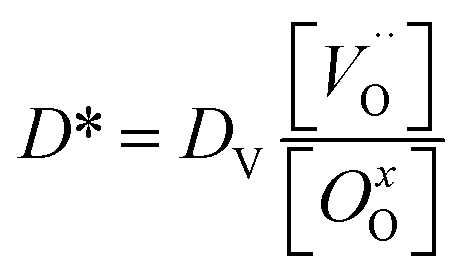 | (5) |
 and [OxO] denote the concentration of oxygen vacancies and regular oxide ions in Kröger–Vink notation, the variation of either of these values would lead to a change in D*. On the one hand, a surface space-charge layer depleted of oxygen vacancies would lead to a lower diffusion coefficient due to a lower amount of mobile point defects (lower concentration of oxygen vacancies).32 On the other hand, the presence of La and Mn cation vacancies in LMO could strongly inhibit the long-range diffusion of oxygen vacancies (Dv), as calculated by molecular dynamic simulations.41 The SIMS depth profile for 600 °C (Fig. SI 1a†) shows, in fact, that the La concentration is not constant throughout the whole film, but is indeed higher in the region close to the bottom LMO/STO interface. The LaO2− counts are also plotted in Fig SI 3c,† together with their second derivative. The fact that the position of the maximum of the second derivative (7 nm) coincides with the mathematically fitted position for the change between slow to fast diffusion regions, reinforces the hypothesis of a direct relationship between oxygen diffusion and concentration of cation vacancies. These results are in agreement with the faster
  being related to a close-to-stoichiometry La/Mn ratio (ideally no La vacancies) at the bottom LMO region, and the slower
  related to an off-stoichiometry La/Mn ratio, with a La-deficiency (higher concentration of La cation vacancies as point defects) at the top LMO region.
Next, we focused on the correlation between the diffusion profile and the microstructure for the LMO/LAO films. The HRTEM bright field image of the LMO/LAO film was taken along the [001]LAO zone axis, as shown in Fig. 4c. The Fourier transform analysis of the related area, shown in Fig. 4d, confirms the presence of a large number of extended defects across the entire thickness of the film in the form of extra plane lines with occasional discontinuities corresponding to defective crystallographic planes perpendicular to the surface. This type of extended defects correspond generally to collective shifting of planes.
In order to investigate the strain state of the LMO/LAO thin films the GPA method has been carried out in HRTEM images like the one given in Fig. 5d. The corresponding GPA strain (ε) images shown in Fig. 5e and f are calculated based on eqn (3) and (4) but using the LAO spatial frequencies and a Gaussian mask of g/4 on the 100 spatial frequency of LAO. The LAO substrate is used as reference both in the calculation of εGPAzz and εGPAxx, meaning that its value is considered equal to zero. In Fig. 5e, the average εGPAzz inside the LMO film is difficult to estimate due to the overlap of the strain fields of the large number of extended defects present. The average calculated GPA strain in the basal plane εGPAxx is found equal to 2.5 ± 1% (Fig. 5f). The theoretical corresponding GPA strain (relative to LAO) of relaxed LMO is expected to be equal to 4.2% for δ = 0 and 1.8% for δ = 0.07. This means that assuming δ = 0 more than 50% of the elastic strain is relieved through the introduction of misfit dislocations in the interface. The residual strain as calculated by the GPA is equal to 1.7% (i.e. 4.2% to 2.5%) and is still present in the compressed LMO film as elastic strain. A typical misfit dislocation is denoted in Fig. 5f by a square frame in the LMO/LAO interface area.
We propose that the presence of these extended defects, which promotes the partial relaxation of the compressive strain imposed by the substrate in the LMO/LAO films, leads to higher surface exchange and diffusion coefficients (Fig. 3). This can be justified considering the model reported by Bagués et al.42 for LSM/LAO films, where the formation and accumulation of oxygen vacancies is promoted around the dislocation core area. In their study, by a combination of transmission electron microscopy imaging and spectroscopic techniques, the authors provided experimental evidence of the presence of oxygen vacancies in the tensile region of the dislocation, the reduction of neighboring Mn cations generating electrostatic interactions and leading to the formation of  antisite defects. Here, in the case of LMO/LAO films, the atomic and chemical structure around defects is also expected to be compensated by a complex balance between point and extended defect formation and elastic strain, which ultimately leads to globally higher mass transport coefficients. It should be noted that the shape of the LMO/LAO profiles at 600 °C are qualitatively similar to those measured by Navickas et al. for LSM epitaxial films,17 explained in their case by a model including the presence of fast diffusion half-loop dislocations, which they propose would have a higher concentration of oxygen vacancies than the bulk. In the same work,17 the authors measured an increase in the “bulk” diffusivity, together with an enhanced diffusivity along the dislocations, both of which increased with film thickness.
The SIMS depth profile of LMO/LAO for 600 °C (Fig. SI 1b†) also shows an increase in the LaO2− counts at the bottom region, as previously observed for the film grown on STO (Fig. SI 1a†). This means that these stoichiometry variations are not related to the strain imposed by the substrate, but most probably to chemical changes at the first stages of the chemical deposition. However, it should be pointed out that in this case to obtain a good fit of the profiles a third thin interface region should be added in series (see Fig. SI 3b†). The optimized fit for this profile is obtained for  at the top LMO region,
 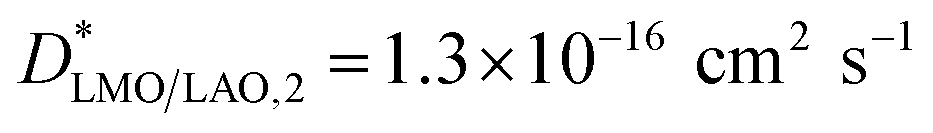 below, and a third interface region at the bottom with a slow
  The optimized change from region 1 (slow) to region 2 (fast) at 7 nm, and the change from region 2 to region 3 at 2.3 nm from the bottom interface (leaving these distances as free fitting parameters). Although profiles with changes in slope close to the bottom interface have been previously reported in the literature for thin films, the origin of these changes is not yet fully understood. The possible causes could come from substrate–film interface effects or cation intermixing, as reported to occur for LSM/LAO films,42 the twinning of the LAO substrate (which is not the case for STO) and/or from an oxygen diffusion component into the LAO substrate (not totally blocking). On the other hand, here again the maximum of the second derivative of the LaO2− counts (Fig. SI 3d†) coincides with the optimized fitted position for the change from region 1 to region 2, confirming that small changes in La stoichiometry could have a direct effect in the oxygen diffusion coefficient.
By the structural and functional comparison of the properties of both dense thin films, we confirm that the presence of extended defects and misfit dislocations in the LMO films grown on a substrate with a large mismatch (LAO) together with the concomitant relaxation of the compressive strain enhances the oxygen mass transport properties of the LMO films. The origin of this effect, particularly large at 500 °C, will be discussed next.
Origin of the enhanced oxygen mass transport properties at 500 °C
We have shown that the oxygen concentration profiles and the amount of oxygen incorporated into the LMO films depend strongly on the substrate used as template for the LMO deposition. While the oxygen transport coefficients of the films grown on STO at 600 °C are close to those extrapolated from high temperature measurements for polycrystalline samples, the LMO/LAO film presented slightly higher k* and D* values. However, the most remarkable observation is the ultra-fast LMO oxygen diffusion measured at 500 °C (on both substrates), which is at least one order of magnitude higher than expected (by the high-temperature activation energy, see Fig. 3b), and considerably higher for the LMO/LAO case. Additionally, at 500 °C the LMO films grown on LAO also present a remarkably high surface exchange coefficient.In order to understand the origin of the fast exchange and diffusion, XRD measurements were carried out both on the pristine LMO thin films and on films annealed reproducing the complete thermal history of isotopically exchanged samples, but in this case using air as environment gas (instead of 18O). In Fig. 6a, no displacement of the LMO Bragg peak positions is observed when comparing the as-deposited LMO/LAO film with the sample annealed at 500 °C for 9 h (to reproduce 1 h + 8 h annealing). In contrast, a shift of the LMO peaks towards higher 2θ values is observed in the case of the sample annealed at 600 °C for 2 h, indicating a decrease in the out-of-plane interplanar distance. The pseudocubic LMO out-of-plane parameters thus obtained indicate no parameter change for the LMO/LAO film annealed at 500 °C (3.98 Å in both cases) and a decrease of 0.04 Å to 3.94 Å after annealing at 600 °C. Similarly, a cell parameter decrease of approximately 0.06 Å (from 3.95 Å to 3.89 Å) is obtained for the film deposited on STO substrate and annealed at 600 °C, although in this case the exact value is less precise due to the film-substrate peak overlapping. This shortening of the average out-of-plane cell parameter is in good agreement with an increase of the Mn4+ concentration, and thus to the presence of a lower amount of oxygen vacancies in the structure. From the changes in cell parameters it can be deduced that at 600 °C oxygen from the gas phase has been incorporated into the LMO film. According to the point defect model for LMO,43 oxygen incorporation can occur by the oxidation of Mn3+ to Mn4+ and concomitant cation vacancy formation:
 | (6) |
 | ||
| Fig. 6 (a) XRD patterns obtained for the epitaxial LMO/LAO thin film as deposited and after anneals at 500 and 600 °C. LMO and LAO peaks indexed in the orthorhombic and pseudocubic systems, respectively. (b) Raman spectra of the LMO/LAO thin films as deposited and after the exchanges at 500 and 600 °C. The positions of the orthorhombic and rhombohedral lines in the pristine spectrum are indicated by the grey dashed lines. The exact assignment of the peak * is not clear, and might correspond to the Mn2O3 or to the LaMnO3 phase. The narrow line at 487 cm−1 is related to the LAO substrate. For both figures, the pattern in brown corresponds to the as-deposited (pristine) LMO film, the black one was obtained after annealing (exchange) at 500 °C and the blue one after annealing (exchange) at 600 °C. | ||
Or by the annihilation of oxygen vacancies and concomitant oxidation of Mn2+ to Mn3+:
 | (7) |
In which Mn2+ would be present thanks to a charge disproportionation reaction. Both oxidation reactions lead to a decrease in the oxygen vacancy concentration  , and thus a proportional decrease in oxygen self-diffusivity (D*) is expected (see eqn (5)).
Moreover, Börgers et al. demonstrated by molecular-dynamic simulations that at high temperatures and for high Mn vacancy concentrations, antisite-vacancy associates can form in LMO, leading to a drastic increase in the activation enthalpy for oxygen-vacancy migration, and thus to a decrease in Dv.41 Thus, the formation of cation vacancies presented in eqn (6), could lead to an additional decrease in the oxygen vacancies' diffusivity (Dv) in LMO, and thus to a decrease in D*.
To confirm this assumption and have a better understanding of the structural changes taking place, Raman spectroscopy was carried out on the LMO/LAO films before and after the isotopic exchange treatments (see Fig. 6b). As pointed out by Iliev et al.,44 the exact positions of the Raman modes for LMO, and particularly for the rhombohedral phase, are sample-sensitive and vary within a range of 15–20 cm−1 for different reports, probably due to slightly different sample compositions. Here, the as-deposited LMO film presents a main sharp mode centered at 612 cm−1, characteristic of the LMO orthorhombic structure, related to a symmetric stretching vibration of the oxygen ions in the MnO6 octahedra. This in-plane stretching vibration is determined by the Mn–O distances and thus activated by Jahn–Teller (JT) distortions.45 It is overlapped with a broad mode centered around 660 cm−1, probably related to the LMO rhombohedral structure (Eg antistretching mode) and also activated by JT distortions.44 This signature seems to attest a mixed orthorhombic/rhombohedral structure at the local scale which cannot be observed using XRD. The coexistence of orthorhombic and rhombohedral phases had already been reported for Sr-substituted LMO (La0.7Sr0.3MnO3, LSMO) in the form of LSMOm/STOn multilayers and had been attributed to a tensile-strain-induced rhombohedral-to-orthorhombic phase transition;46 in that case, the rhombohedral symmetry was the one expected at room temperature for the 30% Sr substituted phase.
As shown in Fig. 6b, after performing the exchanges in an 18O-enriched atmosphere, a shift of the stretching mode towards smaller wavenumbers occurs. In Fig. SI 4 (ESI†), this shift can also be observed in the higher intensity Raman spectra measured for thicker LMO films (∼66 nm), which were simultaneously exchanged with the thin LMO films (2500 pulses) presented in this study. This shift is due to the replacement of 16O atoms with 18O atoms of larger mass. The peak * (marked with an asterisk) might correspond to the Mn2O3 phase, as reported in literature.47 However, the presence of Mn2O3 has not been observed by any of the other characterization techniques neither in the annealed nor in the exchanged samples. Although the exact assignment of the peak * is not clear, we consider that it most probably comes from the LaMnO3 phase. Indeed a similar mode has been often observed at wavenumbers higher than the one of the main Eg antistretching mode in other Raman studies of this compound.44,48
In addition to the isotopic shift, a clear evolution in the profile of the Raman lines is visible (Fig. 6b and Fig. SI 4†). The observed broadening and intensity decrease can originate from an increase in lattice disorder due to both the introduction of 18O atoms in the oxygen lattice and an increase in the oxygen content in the LMO lattice contributing to an evolution towards a more rhombohedral structure. Such an oxygen increase would increase the concentration of Mn4+ ions inside the lattice and thus decrease JT distortions and the intensity of the JT activated modes in the Raman spectra.49 Dubey et al. observed the described Raman changes in epitaxial thin films of LMO grown by Pulsed Laser Deposition and annealed in different oxygen environment. In their work, the increase in oxygen stoichiometry observed by Raman spectroscopy was also confirmed by a decrease in unit cell volume observed by XRD.49 Although all the Raman spectra measured in this work present a combination of orthorhombic and rhombohedral modes, the relative intensity of these modes strongly depends on the temperature of the 18O exchange. The differences are most clearly observable for the thick films (Fig. SI 4b†) for which the rhombohedral component is much more pronounced after the exchange at 600 °C, while the orthorhombic component is the main line observed after the exchange at 500 °C. Hence the evolution of the symmetric stretching and JT modes in Raman spectra point towards an increase in oxygen content in the structure after the exchange at 600 °C, thus leading to a decrease in oxygen vacancy concentration in the LMO film and consequently to a lower diffusion coefficient. These D* values at 600 °C are in perfect agreement with the diffusion coefficients previously measured in the literature for bulk LMO samples at higher temperatures.
To the best of our knowledge, oxygen diffusion had never been measured before for LMO thin films nor at such low temperatures, particularly below or close to the orthorhombic to rhombohedral transition temperature. As explained in the introduction, the transition temperature for LMO (∼737 °C for δ = 0 and lower for higher δ values)22–24 depends on the oxygen and cation stoichiometry, and can also be affected by the strain imposed by the substrate. Although for our epitaxially strained films it is not possible to assign a transition temperature due to the coexistence of phases, at 500 °C the XRD and Raman measurements show globally a more orthorhombic structure and larger pseudocubic cell parameters. It can thus be concluded that the surprisingly high oxygen diffusion coefficients measured at this lower temperature (Fig. 3b) come in fact from a more orthorhombic structure in the LMO film, with a higher concentration of oxygen vacancies. These results confirm the simulations carried out by Woodley et al.,50 who had predicted a low activation energy for the orthorhombic phase compared to the cubic one, resulting from the structural distortions. The orthorhombic lattice distortions lead to three different Mn–O bond distances within the MnO6 octahedra, and thus to several possible oxygen paths and to a preferred direction of the O2− transport, in which the activation energy is minimized.
Conclusions
In this work we have measured for the first time the oxygen mass transport properties of the functional LMO perovskite at low temperatures (500–600 °C). Dense thin LMO films were grown on STO and LAO single crystals by PI-MOCVD. While the LMO films grown on STO are perfectly epitaxial and without observable extended defects, those grown on LAO, with a higher film-substrate mismatch, release the strain by the formation of a high density of extended defects. Interestingly, these structural defects, together with the induced compressive strain relaxation, are favorable for the oxygen diffusion and surface exchange processes, and lead to enhanced mass transport coefficients. Indeed, exceptionally high oxygen diffusion coefficients were measured at 500 °C for the epitaxial LMO dense thin films, particularly for LMO/LAO. The combination of XRD and Raman measurements for samples with different history provide evidence of changes in structure in the 500–600 °C temperature range. While all samples present the co-existence of orthorhombic and rhombohedral phases, the orthorhombic phase is more dominant for the 500 °C exchanged samples. For samples exchanged at this low temperature larger cell parameters have been measured, which have been related to a higher concentration of oxygen vacancies, possibly accompanied with a lower concentration of cation vacancies. These compelling results show a great potential for the design of low temperature μ-SOFC electrodes, by crossing the border of the phase transition temperature, as well as by playing with the presence of extended defects and with the strain induced by the substrate. Moreover, these strategies could also be extended in the future to other applications which rely on fast oxygen ion transport, such as oxygen permeation membranes or memristive devices.Availability of data
All sample datasets and source code related to this work can be found under CC BY 4.0 license in the zenodo repository: 10.5281/zenodo.4749662.Author contributions
Raquel Rodriguez-Lamas: methodology, investigation, formal analysis, writing – original draft; Caroline Pirovano: methodology, investigation, formal analysis, writing – review & editing; Alexander Stangl: methodology, investigation, formal analysis, writing – review & editing; Dolors Pla: methodology, formal analysis, writing – review & editing; Ragnar Jónsson: formal analysis; Laetitia Rapenne: investigation, formal analysis; Eirini Sarigiannidou: formal analysis; Nicolas Nuns: investigation; Hervé Roussel: investigation; Odette Chaix-Pluchery: investigation, formal analysis, writing – review & editing; Michel Boudard: formal analysis, writing – review & editing; Carmen Jiménez: conceptualization, supervision, methodology, writing – review & editing; Rose-Noëlle Vannier: methodology, writing – review & editing; Mónica Burriel: conceptualization, supervision, methodology, formal analysis, writing – original draft, review & editing.Conflicts of interest
There are no conflicts to declare.Acknowledgements
This work has been partially supported by the ANR funded projects “Alps Memories” (ANR-15-CE24-0018) and “MicroSwitch” (ANR-14-ACHN-0012) and has also received funding from the European Union's Horizon 2020 research and innovation program under the Marie Skłodowska-Curie Grant Agreement No. 746648—PerovSiC (for D. P.) and under grant agreement no. 824072—Harvestore (for A. S.). It has been supported by CNRS, Grenoble INP and UGA and from the facilities, and the scientific and technical assistance of the CMTC platform. Chevreul institute (FR 2638), the French ministry of research, the Région Hauts de France and FEDER are acknowledged for supporting and funding the surface analyses platform (ToF-SIMS). We thank F. Chiabrera (from IREC) for the COMSOL model used for the simulations.References
- I. Garbayo, F. Baiutti, A. Morata and A. Tarancón, J. Eur. Ceram. Soc., 2019, 39, 101–114 CrossRef CAS.
- Z. Gao, L. V. Mogni, E. C. Miller, J. G. Railsback and S. A. Barnett, Energy Environ. Sci., 2016, 9, 1602–1644 RSC.
- A. Evans, A. Bieberle-Hütter, J. L. M. Rupp and L. J. Gauckler, J. Power Sources, 2009, 194, 119–129 CrossRef CAS.
- F. Chiabrera, I. Garbayo, N. Alayo and A. Tarancón, eds L. Fonseca, M. Prunnila and E. Peiner, 2017, p. 102460S.
- A. Bieberle-Hütter, D. Beckel, A. Infortuna, U. P. Muecke, J. L. M. Rupp, L. J. Gauckler, S. Rey-Mermet, P. Muralt, N. R. Bieri, N. Hotz, M. J. Stutz, D. Poulikakos, P. Heeb, P. Müller, A. Bernard, R. Gmür and T. Hocker, J. Power Sources, 2008, 177, 123–130 CrossRef.
- I. Garbayo, D. Pla, A. Morata, L. Fonseca, N. Sabaté and A. Tarancón, Energy Environ. Sci., 2014, 7, 3617–3629 RSC.
- S. B. Adler, Chem. Rev., 2004, 104, 4791–4844 CrossRef CAS PubMed.
- J. D. Carter, T. A. Cruse, B. J. Ingram and M. Krumpelt, in Handbook of Fuel Cells, John Wiley & Sons, Ltd, Chichester, UK, 2010 Search PubMed.
- J. A. Kilner, Nat. Mater., 2008, 7, 838–839 CrossRef CAS PubMed.
- B. Yildiz, MRS Bull., 2014, 39, 147–156 CrossRef CAS.
- M. Acosta, F. Baiutti, A. Tarancón and J. L. MacManus-Driscoll, Adv. Mater. Interfaces, 2019, 6, 1–15 Search PubMed.
- K. Wen, W. Lv and W. He, J. Mater. Chem. A, 2015, 3, 20031–20050 RSC.
- A. Kushima, S. Yip and B. Yildiz, Phys. Rev. B: Condens. Matter Mater. Phys., 2010, 82, 115435 CrossRef.
- M. Kubicek, Z. Cai, W. Ma, B. Yildiz, H. Hutter and J. Fleig, ACS Nano, 2013, 7, 3276–3286 CrossRef CAS PubMed.
- S. P. Waldow and R. A. De Souza, ACS Appl. Mater. Interfaces, 2016, 8, 12246–12256 CrossRef CAS PubMed.
- V. Metlenko, A. H. H. Ramadan, F. Gunkel, H. Du, H. Schraknepper, S. Hoffmann-Eifert, R. Dittmann, R. Waser and R. a De Souza, Nanoscale, 2014, 6, 12864–12876 RSC.
- E. Navickas, Y. Chen, Q. Lu, W. Wallisch, T. M. Huber, J. Bernardi, M. Stöger-Pollach, G. Friedbacher, H. Hutter, B. Yildiz and J. J. Fleig, ACS Nano, 2017, 11, 11475–11487 CrossRef CAS PubMed.
- E. Navickas, T. M. Huber, Y. Chen, W. Hetaba, G. Holzlechner, G. Rupp, M. Stöger-Pollach, G. Friedbacher, H. Hutter, B. Yildiz and J. Fleig, Phys. Chem. Chem. Phys., 2015, 17, 7659–7669 RSC.
- A. M. Saranya, A. Morata, D. Pla, M. Burriel, F. Chiabrera, I. Garbayo, A. Hornés, J. A. Kilner and A. Tarancón, Chem. Mater., 2018, 30, 5621–5629 CrossRef CAS PubMed.
- A. M. Saranya, D. Pla, A. Morata, A. Cavallaro, J. Canales-Vázquez, J. A. Kilner, M. Burriel and A. Tarancón, Adv. Energy Mater., 2015, 5, 1500377 CrossRef.
- R. De Souza, J. Kilner and J. Walker, Mater. Lett., 2000, 43, 43–52 CrossRef CAS.
- J. Rodríguez-Carvajal, M. Hennion, F. Moussa, A. H. Moudden, L. Pinsard and A. Revcolevschi, Phys. Rev. B: Condens. Matter Mater. Phys., 1998, 57, R3189–R3192 CrossRef.
- A. G. Rudskaya, N. B. Kofanova, L. E. Pustovaya, B. S. Kulbuzhev and M. F. Kupriyanov, Phys. Solid State, 2004, 46, 1922–1926 CrossRef CAS.
- A. K. Bogush, V. I. Pavlov and L. V. Balyko, Cryst. Res. Technol., 1983, 18, 589–598 CrossRef CAS.
- A. Wold and R. J. Arnott, J. Phys. Chem. Solids, 1959, 9, 176–180 CrossRef CAS.
- J. Töpfer and J. B. Goodenough, J. Solid State Chem., 1997, 130, 117–128 CrossRef.
- R. Rodriguez-Lamas, D. Pla, O. Chaix-Pluchery, B. Meunier, F. Wilhelm, A. Rogalev, L. Rapenne, X. Mescot, Q. Rafhay, H. Roussel, M. Boudard, C. Jiménez and M. Burriel, Beilstein J. Nanotechnol., 2019, 10, 389–398 CrossRef CAS PubMed.
- J. A. M. van Roosmalen and E. H. P. Cordfunke, J. Solid State Chem., 1994, 110, 109–112 CrossRef CAS.
- M. J. Hÿtch, E. Snoeck and R. Kilaas, Ultramicroscopy, 1998, 74, 131–146 CrossRef.
- J. L. Rouvière and E. Sarigiannidou, Ultramicroscopy, 2005, 106, 1–17 CrossRef PubMed.
- D. R. Killoran, J. Electrochem. Soc., 1962, 109, 170 CrossRef.
- R. De Souza, J. Zehnpfenning, M. Martin and J. Maier, Solid State Ionics, 2005, 176, 1465–1471 CrossRef CAS.
- J. Crank, The Mathematics of Diffusion, Clarendon Press, 1979 Search PubMed.
- C. Ritter, M. Ibarra, J. De Teresa, P. Algarabel, C. Marquina, J. Blasco and J. García, Phys. Rev. B: Condens. Matter Mater. Phys., 1997, 56, 8902–8911 CrossRef CAS.
- A. Pomar, Z. Konstantinović, N. Bagués, J. Roqueta, L. López-Mir, L. Balcells, C. Frontera, N. Mestres, A. Gutiérrez-Llorente, M. Šćepanović, N. Lazarević, Z. V. Popović, F. Sandiumenge, B. Martínez and J. Santiso, Front. Physiol., 2016, 4, 1–14 Search PubMed.
- J. Roqueta, A. Pomar, L. Balcells, C. Frontera, S. Valencia, R. Abrudan, B. Bozzo, Z. Konstantinović, J. Santiso and B. Martínez, Cryst. Growth Des., 2015, 15, 5332–5337 CrossRef CAS.
- D. Pla, A. Sánchez-González, I. Garbayo, M. Salleras, A. Morata and A. Tarancón, J. Power Sources, 2015, 293, 264–273 CrossRef CAS.
- M. Burriel, G. Garcia, J. Santiso, J. A. Kilner, R. J. Chater and S. J. Skinner, J. Mater. Chem., 2008, 18, 416–422 RSC.
- Y. Chen, H. Téllez, M. Burriel, F. Yang, N. Tsvetkov, Z. Cai, D. W. McComb, J. A. Kilner and B. Yildiz, Chem. Mater., 2015, 27, 5436–5450 CrossRef CAS.
- A. Berenov, Solid State Ionics, 1999, 122, 41–49 CrossRef CAS.
- J. M. Börgers and R. A. De Souza, Phys. Chem. Chem. Phys., 2020, 22, 14329–14339 RSC.
- N. Bagués, J. Santiso, B. D. Esser, R. E. A. Williams, D. W. McComb, Z. Konstantinovic, L. Balcells and F. Sandiumenge, Adv. Funct. Mater., 2018, 28, 1704437 CrossRef.
- Y.-L. Lee and D. Morgan, Phys. Chem. Chem. Phys., 2012, 14, 290–302 RSC.
- M. N. Iliev and M. V Abrashev, J. Raman Spectrosc., 2001, 32, 805–811 CrossRef CAS.
- M. N. Iliev, M. V. Abrashev, J. Laverdière, S. Jandl, M. M. Gospodinov, Y.-Q. Wang and Y.-Y. Sun, Phys. Rev. B: Condens. Matter Mater. Phys., 2006, 73, 064302 CrossRef.
- J. Kreisel, G. Lucazeau, C. Dubourdieu, M. Rosina and F. Weiss, J. Phys. Condens. Matter, 2002, 14, 315 CrossRef.
- T. Gao, H. Fjellvåg and P. Norby, Anal. Chim. Acta, 2009, 648, 235–239 CrossRef CAS PubMed.
- V. Podobedov, a Weber and D. Romero, Phys. Rev. B: Condens. Matter Mater. Phys., 1998, 58, 43–46 CrossRef CAS.
- A. Dubey, V. G. Sathe and R. Rawat, J. Appl. Phys., 2008, 104, 113530 CrossRef.
- S. M. Woodley, J. D. Gale, P. D. Battle and C. R. A. Catlow, J. Chem. Phys., 2003, 119, 9737–9744 CrossRef CAS.
Footnote |
| † Electronic supplementary information (ESI) available. See DOI: 10.1039/d0ta12253j |
| This journal is © The Royal Society of Chemistry 2021 |