
 Open Access Article
 This Open Access Article is licensed under a Creative Commons Attribution-Non Commercial 3.0 Unported Licence
Optimizing kesterite solar cells from Cu2ZnSnS4 to Cu2CdGe(S,Se)4†
Robert B.
Wexler
 a,
Gopalakrishnan Sai
Gautam‡
a and
Emily A.
Carter
*ab
a,
Gopalakrishnan Sai
Gautam‡
a and
Emily A.
Carter
*ab
aDepartment of Mechanical and Aerospace Engineering, Princeton University, Princeton, NJ 08544-5263, USA. E-mail: eac@princeton.edu
bOffice of the Chancellor and Department of Chemical and Biomolecular Engineering, University of California, Los Angeles, CA 90095, USA. E-mail: eac@ucla.edu
First published on 1st April 2021
Abstract
Kesterite solar cells, based on the prototypical absorber material Cu2ZnSnS4 (CZTS), are cheap, nontoxic, and chemically stable, thus rendering them promising, beyond-Si photovoltaic technologies. Their efficiencies, however, are limited by the formation of defects that decrease the short-circuit current by creating deep traps where nonradiative recombination of photoexcited charge carriers occurs via the Shockley–Read–Hall mechanism. To suppress the formation of these defects, specifically the most deleterious 2CuZn + SnZn antisite cluster, we devised an ion substitution strategy involving complete Cd- and Ge-substitution and partial selenization, ultimately arriving at the optimal composition, Cu2CdGeS3Se (CCdGSSe). Using density functional theory and ab initio thermodynamics, we predict that complete Cd- and Ge-substitution leads to a 125% increase in the formation energy of the deep-trap-inducing 2CuCd + GeCd. Additionally, 25% selenization optimizes the predicted band gap (1.43–1.47 eV, as calculated from a hybrid functional) with respect to the Shockley–Queisser limit. In addition to providing a practical and novel ion substitution strategy, we also elucidate the mechanisms of defect suppression and promotion by Ge and Se, highlighting the key role of the inert pair effect and metal-chalcogen bond covalency, respectively. Due to its ideal thermodynamic and electronic characteristics, CCdGSSe should reinvigorate research on kesterite-based solar cells, optimizing the rich materials space afforded by ion substitution and post-quinary compositions.
Introduction
The potential impact of solar energy is unmistakable as it far exceeds global energy needs while simultaneously combating global warming due to its sustainability and carbon-neutrality. To capitalize on this opportunity, the scientific community has spent many decades searching for materials that efficiently convert sunlight to electricity.1 A number of solar-cell technologies have been commercialized, most notably those based on Si;2–5 thin-film technologies such as CdTe,6–8 Cu(In,Ga)Se2,9–11 GaAs,12–14 and hybrid organic–inorganic halide perovskites;15–17 conductive organic polymers;18–20 and molecular dyes.21–23 Although eco-friendly printing techniques have been used to fabricate inexpensive, nontoxic organic/polymer solar cells,24,25 solar cells with higher efficiency made of promising inorganic materials are as yet unable to supplant fossil-fuel power stations for a number of reasons, including because they contain expensive (Te, In, and Ga) and/or toxic (Cd, Pb, and As) elements or, in the case of perovskite solar cells, have poor resistance to moisture.26–28 Consequently, solar-energy conversion efficiency, cost, toxicity, ease of production, and stability all must be considered concurrently to design an efficient, scalable, and environmentally friendly solar infrastructure. Over the last decade, there has been growing interest in the solar absorber material Cu2ZnSnS4 (CZTS), which contains inexpensive and nontoxic elements, possesses ideal sunlight absorption characteristics (namely, a band gap of ≈1.39–1.52 eV (ref. 29)), and is stable, even in the presence of moisture.30–33 Unfortunately, under processing conditions (i.e., annealing at 600 K (ref. 34 and 35)), defects can form (e.g., antisites, vacancies, and their clusters), which leads to solar-cell inefficiencies.36,37Two important parameters for optimizing kesterite solar cells are the band gap (Eg) and the concentration of Shockley–Read–Hall (SRH) recombination centers38,39 (xSRH), as illustrated in Fig. 1. The band gap of the absorber, which depends on the polymorph (EStanniteg < EKesteriteg, typically40,41), is proportional to the open-circuit voltage (Voc) of the solar cell whereas xSRH is a good measure of the short-circuit current (Isc), with lower concentrations corresponding to higher currents. Given that efficiency is proportional to the product of Voc and Isc, it is clear that increasing Isc by decreasing xSRH increases solar cell efficiency (from high to low xSRH, contours become greener in Fig. 1). The Voc, however, cannot be increased without bound as the Shockley–Queisser limit42 dictates an optimal Eg of 1.34 eV,43 with quasi-exponential decline in efficiency upon deviations away from that value.
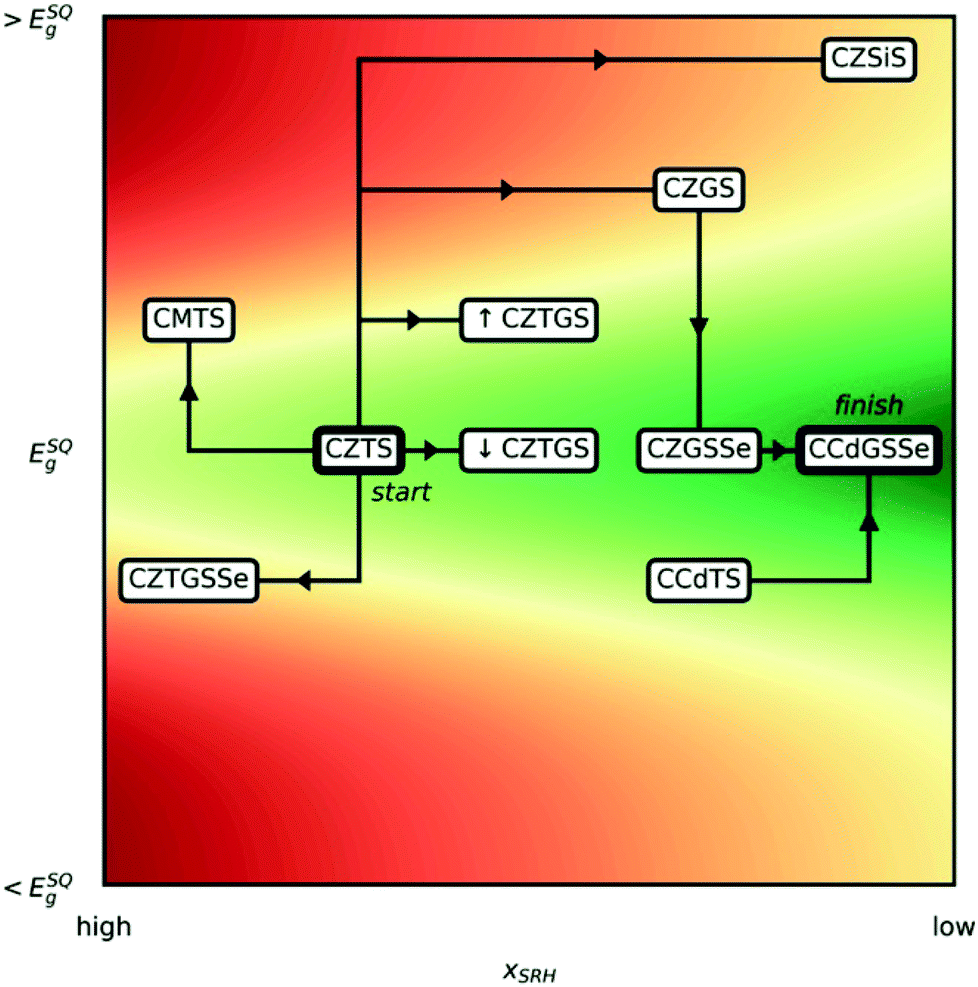 | ||
| Fig. 1 Schematic road map of substitution strategies considered, from Cu2ZnSnS4 (CZTS) to Cu2CdGeS3Se (CCdGSSe), where C is Cu1+, Z is Zn2+, M is Mg2+, T is Sn4+, G is Ge4+, ↓CZTGS is Cu2ZnSn0.875Ge0.125S4, and ↑CZTGS is Cu2ZnSn0.5Ge0.5S4. The horizontal and vertical axes correspond, respectively, to the concentration of Shockley–Read–Hall recombination centers (xSRH)38,39 and the band gap (Eg), where ESQg is the band gap that maximizes the Shockley–Queisser (SQ) limit.42,43 Red and green contours indicate regions of lower and higher solar cell efficiency, respectively. | ||
While in principle CZTS can host a wide range of neutral and charged defects including antisites, vacancies, and their clusters, the effects of the neutral defects listed in Table 1 on the physics and performance of kesterite solar cells are both significant and well-understood. We label defects using a simplified Kröger–Vink notation MS (in Table 1 and thereafter), where M corresponds to the point defect species, which can be an atom (e.g., Cu) or a vacancy (V), and S indicates the lattice site that the species occupies. For CuX + XCu, Cu+ and X2+ cations swap sites. This leads to the formation of shallow donor (XCu) and acceptor (CuX) levels within the band gap, resulting in spatial fluctuations of the conduction and valence band edges. These fluctuations reduce the effective band gap, thus lowering the Voc of the material.36,44–49 For Cu vacancies (VCu), a Cu+ site is unoccupied, leaving the crystal Cu-deficient. Previous quantum mechanics simulations predicted that Cu vacancies reduce potential fluctuations along the valence band edge, which can mitigate any band gap reduction caused by CuX + XCu clusters.36 Consequently, VCu tends to mitigate any reduction in Voc, consistent with the Cu-poor synthesis conditions that typically are employed to achieve highest efficiency.34,50–52 Finally, for 2CuX + YX, three X2+ are replaced by two Cu+ and one Y4+, leaving the crystal X2+-deficient and Cu+/Y4+-rich. Previous quantum mechanics studies indicate that 2CuZn + SnZn generates localized trap states near the center of the band gap, which promote SRH recombination and, therefore, reduce the Isc of CZTS.41,53,54 We note that interface recombination also can reduce the Voc,55,56 however, the goal of the present work was to suppress the formation of bulk defects that are well-known, via both experiment and theory, to be detrimental to kesterite solar cell efficiency.
| Defect | Effect on the physics of kesterite solar cells | Primary effect on solar cell parameters |
|---|---|---|
| CuX + XCu | Causes electrostatic potential fluctuations | Decreases Voc |
| VCu | Mitigates potential fluctuations along valence band edge | Increases Voc |
| 2CuX + YX | Causes Shockley–Read–Hall recombination | Decreases Isc |
Density functional theory (DFT) and thermodynamic analyses have been employed to improve fundamental understanding of how to control defect formation and to identify promising doping schemes to limit the formation of detrimental defects and improve solar cell performance. For example, theory57,58 and experiment59–61 both conclude that Ag-containing phases are more ordered in the 1+ and Zn2+ sublattices (i.e., lower concentration of CuX + XCu defects) due to the anisotropic expansion of the unit cell upon replacement of Cu by Ag.59 Specifically, Ag2ZnSnSe4 affords a higher predicted maximum photovoltaic efficiency than Cu2ZnSnS4,58 consistent with experiments.62–70 The alkali metals are another promising group of isovalent replacements for Cu,62–73 with theory indicating that <25% Na-doping in CZTS suppresses the formation of CuZn + ZnCu.72 In addition to the Cu+ site, several studies establish isovalent doping on the Zn2+ site as a promising strategy to improve the performance of CZTS-based solar cells as well. Among the 2+ cations considered, which includes the alkaline earth72,74,75 and transition metals,57,76–78 Cd has been identified, by both theory57 and experiment,77 as one of the most effective at reducing 1+/2+ and 2+/4+ cation disorder. Finally, on the 4+ site, Ge stands out as an exceptional candidate for substitution, as numerous studies, mostly experimental, have shown that the combination of partial Ge- and Se-alloying, where the latter serves primarily to optimize the band gap, leads to significant increases in both the Voc and Isc and thus solar-cell efficiency.58 However, there remains scarce mechanistic understanding of these dopants' influence on defect formation and consequently uncertainty regarding promising directions for improved materials design.
To address this need, here we present predictions of bulk stability, band gap, and formation energies for the key defects in Table 1 and analyze the trends to develop not only a deeper understanding of the quantum mechanical effects that govern defect formation but also a practical strategy for overcoming the efficiency stagnation of kesterite solar-cell technologies over the last six years.79 To provide a clear picture of the ion substitution strategies we adopted, we first outline the path from CZTS to our newly proposed quinary chalcogenide, Cu2CdGeS3Se (CCdGSSe) in Fig. 1. Since CZTS offers a nearly optimal band gap (≈1.5 eV),80 one would like post-CZTS absorbers to horizontally traverse our schematic road map (Fig. 1). First, we find that Mg- and Si-substitution for Zn and Sn, respectively, increases Eg and, for Mg-substitution, increases xSRH as well, which will lead to inefficient solar cells. Therefore, we do not consider Mg and Si further in the main text (see Tables S1–S3 in Section S1 of the ESI†). Second, we find that complete Ge-substitution (CZGS) decreases xSRH but increases Eg. While partial Ge-substitution (CZTGS) increases Eg by a lesser extent, we find that this approach is not as promising as partial selenization (CZGSSe). Third, inspired by recent studies on Cu2CdSnS4 (CCdTS),57,77 we find that complete Cd-substitution, along with Ge-substitution coupled with partial selenization, provides the optimal band gap and significantly decreases xSRH, thus identifying CCdGSSe as a promising candidate for improving the efficiencies of kesterite-based solar cells. By discussing the steps in our roadmap, we reveal both the independent and concerted effects of Ge, Se, and Cd on defect thermodynamics and electronic structure that leads to the optimization of kesterite solar cells, resulting in CCdGSSe.
Computational methods
DFT calculations
We calculated polymorph relative energies, defect formation energies, and band gaps using spin-polarized DFT as implemented in the Vienna Ab initio Simulation Package (VASP),81–83 which employs the projector augmented-wave (PAW) method.84,85 We used a 520 eV kinetic energy cutoff for the plane wave basis set and initialized atomic magnetic moments of 0.6 μB in a ferromagnetic configuration so as not to preclude open shell configurations induced by uncompensated neutral defects, e.g., VCu, which generates a hole that oxidizes Cu+, Zn2+, and/or Sn4+. That being said, we find that all final configurations are nonmagnetic. For the calculation of bulk thermodynamic quantities such as polymorph relative energies and defect formation energies, we used both the strongly constrained and appropriately normed (SCAN) meta-generalized-gradient approximation (meta-GGA)86 and the Heyd–Scuseria–Ernzerhof (HSE) hybrid87–90 exchange–correlation functionals, where the latter was used to evaluate our most promising candidate, CCdGSSe. For band gap calculations, we used both DFT-HSE and the Perdew–Burke–Ernzerhof (PBE)91 GGA augmented by a Hubbard U term (PBE+U) where U was derived from unrestricted Hartree–Fock (UHF) calculations92,93 of binary transition metal (TM) oxide clusters.94 For PBE+U calculations, we adopted the rotationally invariant approach introduced by Dudarev et al.95 where U = 3.6 eV, 4.5 eV, and 4.8 eV were applied on Cu 3d, Zn 3d, and Sn 4d/Ge 3d, respectively.94U = 4.8 eV was not derived specifically for Ge 3d but the charge state of Sn and Ge should be the same and therefore we used the value derived for Sn here. For Cd-containing compounds, we used DFT-HSE instead of PBE+U despite its significant computational expense since DFT-HSE yields better agreement with experimental band gaps,96–102 which was needed to evaluate accurately CCdGSSe.We used the PBE PAW data sets recommended by the Materials Project103 for Cu (4s1 5d10), 2+ cations [Zn (4s2 3d10), Mg (2p6 3s2), and Cd (5s2 4d10)], 4+ cations [Sn (5s2 4d10 5p2), Ge (4s2 3d10 4p2), and Si (3s2 3p2)], and 2− anions [S (3s2 3p4) and Se (4s2 4p4)]. Additionally, we applied 0.05 eV of Gaussian electronic smearing to accelerate self-consistent field (SCF) convergence and sampled 32 Γ-point-centered k-points per Å−1 to integrate over the Brillouin zone (symmetry was not used to reduce the number of k-points). Fast Fourier transform grids and real space projectors were set using the “accurate” VASP precision mode. All structures were optimized using the conjugate gradient algorithm. For bulk structures we relaxed the lattice constants, angles, and ion positions. For defect structures, however, we optimized the ion positions in a fixed cell corresponding to the predicted equilibrium lattice parameters of the defect-free bulk. For DFT-HSE calculations, due to their computational cost, we used the DFT-SCAN-relaxed geometries followed by a single SCF DFT-HSE calculation. Note that we did not use a SCAN+U framework for any energy evaluation or structure relaxation because we previously found good agreement between DFT-SCAN-predicted and experimental formation enthalpies among binary transition metal sulfides.57 Finally, we set convergence thresholds of 1 × 10⁻⁵ eV for SCF loops and 3 × 10⁻² eV Å−1 for structure optimization loops.
The ESI† in ref. 104 contains additional details regarding the convergence of bulk thermodynamic quantities with respect to the kinetic energy cutoff, k-point grid density, and the inclusion of semicore states in the PBE PAW data sets for Cu and Ge.
We performed charged defect calculations using the PBE+U+D functional instead of SCAN because the latter grossly underestimates the band gaps of CZTS57 and CZGS.104 Further details about the phonon calculations to evaluate the thermodynamic stability of CCdGSSe can be found in Fig. S1–S3 and Table S4 in Section S2 of the ESI.†
Structural models
![[4 with combining macron]](https://www.rsc.org/images/entities/char_0034_0304.gif) and I2m, respectively) but differ in terms of their cation layer composition along c, where kesterite has alternating 1+/2+ and 1+/4+ layers and stannite has alternating 1+ and 2+/4+ layers. The main difference between wurtzite (space group: P63mc) and kesterite/stannite is the underlying S-arrangement.
and I2m, respectively) but differ in terms of their cation layer composition along c, where kesterite has alternating 1+/2+ and 1+/4+ layers and stannite has alternating 1+ and 2+/4+ layers. The main difference between wurtzite (space group: P63mc) and kesterite/stannite is the underlying S-arrangement.
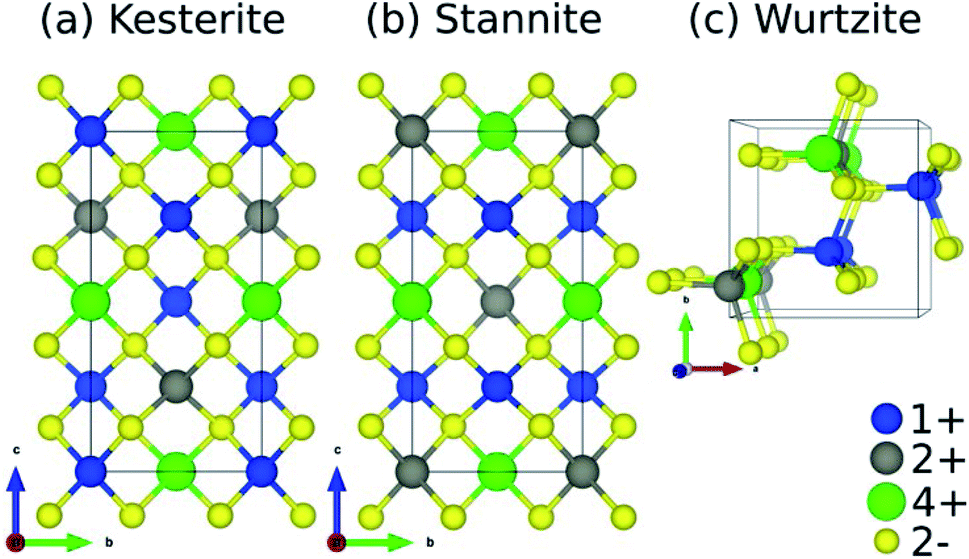 | ||
| Fig. 2 Crystal structures of quaternary chalcogenides adopting the (a) kesterite, (b) stannite, and (c) wurtzite polymorphs. The prototypical composition for kesterite solar cells is Cu2ZnSnS4 where Cu1+, Zn2+, Sn4+, and S2− occupy the 1+ (blue spheres), 2+ (grey), 4+ (green), and 2− (yellow) sites, respectively. | ||
For Se-substituted CZGS (i.e., CZGSSe), we considered all symmetry-unique S/Se configurations for xSe = Se/(S + Se) = 0.5 in the 16-atom conventional cell of kesterite and stannite CZGS. We used pymatgen's105 structure matcher, which is powered by spglib,106 to generate the symmetry-unique configurations of which there are 12 for kesterite and 10 for stannite (see Fig. S6 in Section S3.2 of the ESI†). Finally, for CCdGSSe, in the same way as for CZGSSe, we considered all symmetry-unique S/Se configurations for xSe = 0.25 in kesterite (there are five), stannite (five), and wurtzite (11) Cu2CdGeS4 (CCdGS; see Fig. S7 in Section S3.3 of the ESI†). We included the wurtzite polymorph for CCdGSSe because it is observed experimentally for CCdGS107 and CCdGSe108 and it is nearly isoenergetic with stannite. Wurtzite is not relevant, however, for the quaternary chalcogenides containing Zn (CZTS, CZGS, CZTSe, or CZGSe) because it is less stable than the kesterite (ground state) and stannite (metastable) phases (see Table S5 in Section S4 of the ESI†).
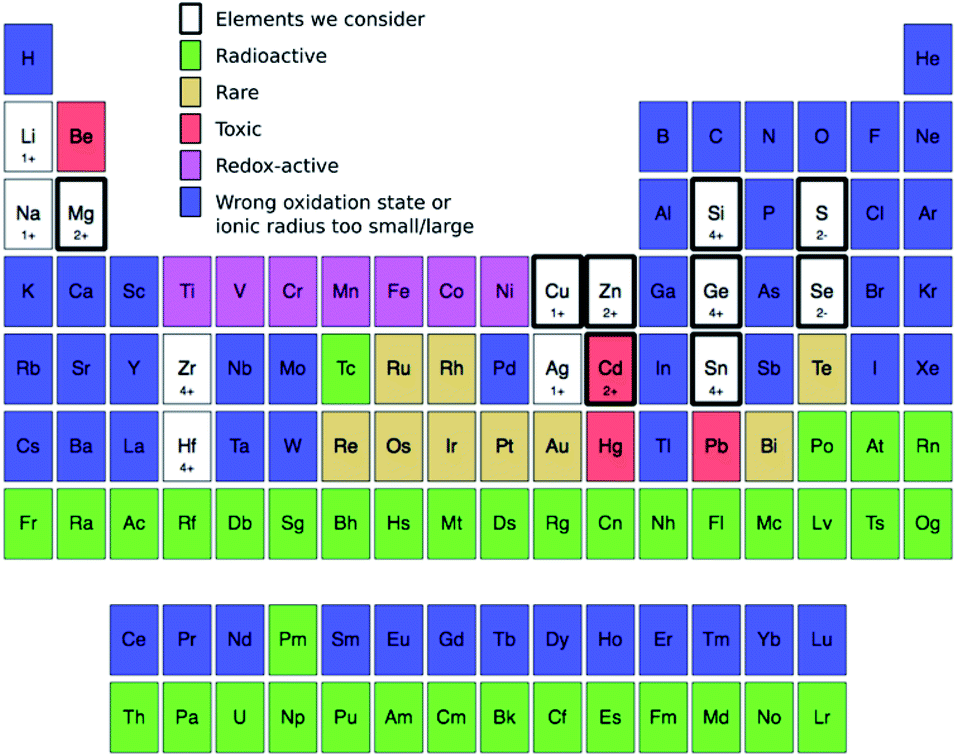 | ||
| Fig. 3 Elements we consider in this study (thick black rectangles) to occupy the 1+, 2+, 4+, and 2− sites in Fig. 2: Cu (1+), Zn (2+), Cd (2+), Mg (2+), Sn (4+), Ge (4+), Si (4+), S (2−), and Se (2−). We filter these elements from the known 118 by removing, in the following order, those that are radioactive168 (green), rare (gold),132 redox-active (magenta), have either the wrong oxidation state or whose ionic radius is too different (blue). For ionic radius, we eliminate all elements that are too small (i.e., <30%) or too large (>170%) compared to the ionic radius of four-fold-coordinated Cu1+, Zn2+, Sn4+, and S2− corresponding to the occupation of 1+, 2+, 4+, and 2− sites, respectively.149 While the use of toxic elements (red) should be restricted,169 we retain them under consideration. For the remaining elements, we provide their most likely oxidation state in the prototype kesterite structure (Fig. 2a), e.g., Ge is 4+ and Se is 2−. | ||
Ab initio thermodynamics
Neutral defect formation energies were calculated as
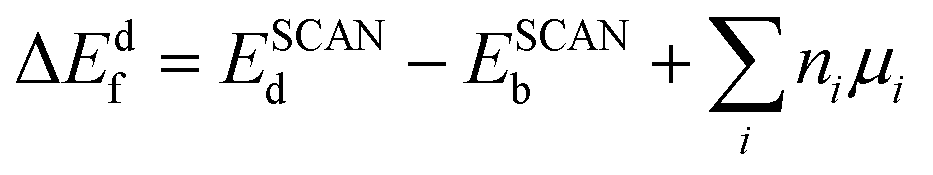 | (1) |
For completeness, we did consider the following charged defects and defect clusters to examine the possible role of defect transition levels in our newly proposed CCdGSSe: CuCd (q = −1, 0, 1), CdCu (q = −1, 0, 1), GeCd (q = −1, 0, 1, 2), VCu (q = −1, 0, 1), VS (q = −1, 0, 1, 2), VSe (q = −1, 0, 1, 2), VS + CuCd (q = −1, 0, 1), VSe + CuCd (q = −1, 0, 1), and GeCd + CuCd (q = −1, 0, 1). Charged defect (cd) formation energies were calculated as ΔEcdf = ΔEdf + qEF + Ec where EF is the Fermi energy of the pristine bulk structure and Ec is the electrostatic correction term, calculated using the correction scheme of Kumagai and Oba119 as implemented in the Spinney package.120 For further details about the correction scheme, we refer the interested reader to ref. 57, as we used the same approach here. The PBE+U dielectric tensor of CCdGSSe used in our charge defect calculations is: εxx = εyy = 10.5, εzz = 9.97, εxy = εyz = −0.06, and εzx = 0.06.
Results
Effect of Ge-substitution in CZTS
Given the deep-trap-inducing nature of 2CuZn + SnZn antisite clusters in CZTS53 and the primary role played by the SnZn antisite,41 we first explore the replacement of Sn4+ with varying amounts of Ge4+. Fig. 4 shows the effect of dilute (light blue), high (dark blue), and complete (purple) Ge-substitution in CZTS (green) on kesterite vs. stannite polymorph preference (panel a), neutral defect formation energies under experimentally relevant Cu-poor conditions (panel b), and the PBE+U band gap (panel c). First, our results show that Ge-substitution does not affect polymorph preference (panel a) with kesterite being the ground-state polymorph (EStannite − EKesterite > 0 eV per formula unit) for all xGe (see Table S5 in Section S4 of the ESI† for CZTS and CZGS wurtzite data). That Ge increases the relative stability of kesterite vs. stannite for all but dilute Ge-substitution is in general agreement with other theoretical work59,121,122 and the experimental observation of enhanced grain growth in Ge-doped CZTSSe.123–125 Recent scanning electron microscope images show that grain growth and crystallinity in CZTGS is not improved for xGe > 0.2121 but this could be due to suboptimal annealing conditions for each Ge composition during fabrication.107,126,127 Accordingly, non-dilute Ge-substitution should favor kesterite formation and suppress Eg/Voc lowering due to the kesterite→stannite phase transition.80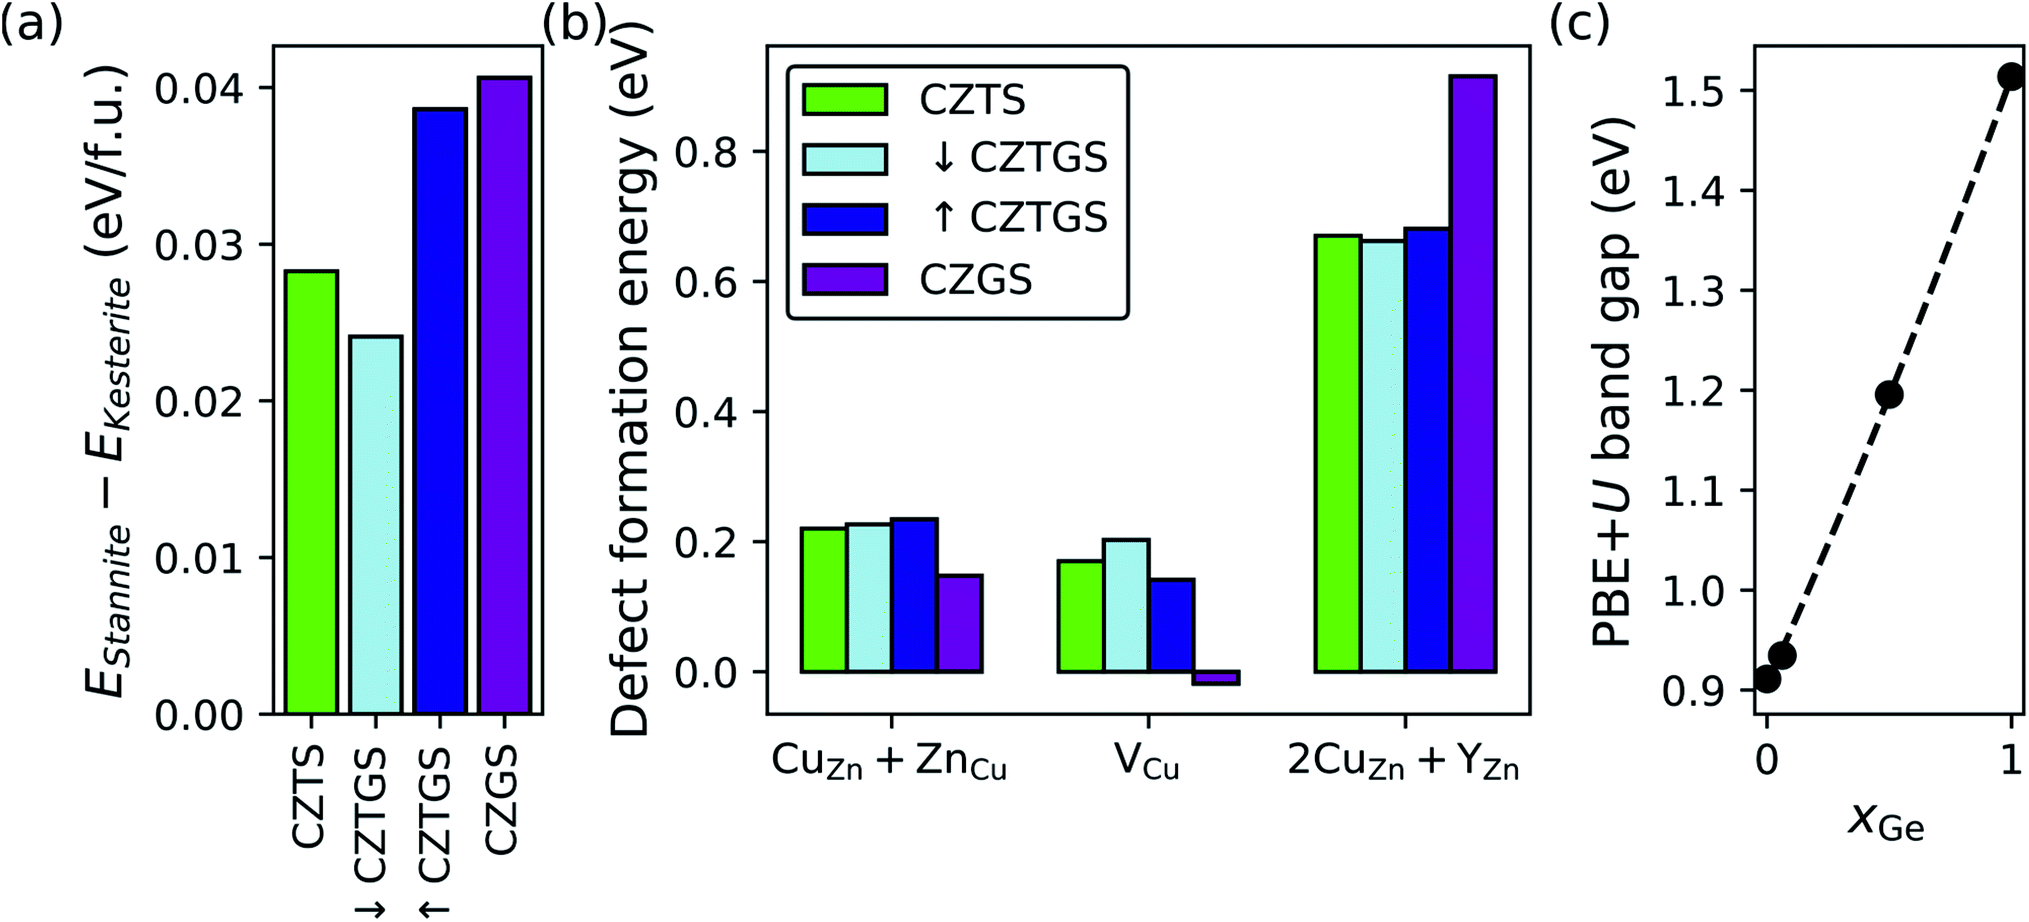 | ||
| Fig. 4 Effect of Ge-substitution on (a) the DFT-SCAN relative stability of the stannite and kesterite polymorphs, (b) DFT-SCAN defect formation energies under Cu-poor conditions, and (c) the PBE+U band gap. In (b) Y is either Sn or Ge, whichever gives the lower defect formation energy; Y is Sn for CZTS, ↓CZTGS, and ↑CZTGS; and Ge for CZGS. (c) xGe is Ge/(Sn + Ge). Minimum energy defect configurations can be found in Fig. S9–S11 in Section S9.1 of the ESI.† | ||
Next, we analyze trends in defect formation energies as a function of xGe (panel b). For the CuZn + ZnCu antisite clusters, we find that, while partial Ge-substitution does not influence their formation (0.22 eV for CZTS57 and ∼0.23 eV for both ↓CZTGS and ↑CZTGS), complete substitution has a promoting effect (0.15 eV for CZGS), which can be explained by the greater covalency of Ge–S bonds (ΔEN = 0.57, where EN is the Pauling electronegativity) compared to Sn–S bonds (ΔEN = 0.62). Ge–S bond covalency, which is greatest for complete Ge-substitution, reduces the charge density on S and promotes covalency across the Cu–S and Zn–S bonds. In turn, higher covalency reduces the effective 1+ and 2+ charges on the Cu and Zn, respectively, and consequently, the electrostatic energy penalty for CuZn + ZnCu disorder. Therefore, CZGS should be more susceptible to Cu/Zn-disorder-induced potential fluctuations, as is seen in ref. 59, and potential Voc deficit. Several studies found that partial Ge-substitution in CZTSSe increases the Voc,124,128–131 however, we emphasize that these materials are selenized and, as we will explain in the next section, selenization suppresses stannite and promotes VCu in CZGS.
For Cu vacancies, with the exception of ↓CZTGS (0.20 eV), we predict that Ge-substitution decreases their formation energy (0.17 eV for CZTS,57 0.14 eV for ↑CZTGS, and −0.02 eV for CZGS) to the extent that DFT-SCAN predicts a nonzero equilibrium concentration of VCu in CZGS at 0 K. In all likelihood, this negative value for VCu in CZGS is an artifact of DFT-SCAN's tendency to produce lower values of ΔEdf compared to DFT-PBE, PBE+U, SCAN+U, and DFT-HSE.104 For example, compared to DFT-HSE, DFT-SCAN predicts the ΔEdf for VCu to be lower by 0.53 eV in CZTS104 and 0.58 eV in CZGS. Importantly, qualitative trends in ΔEdf are XC-functional-insensitive (see Fig. S5 in the ESI† for ref. 104) and we therefore simply interpret this negative value as “high to complete Ge-substitution promotes VCu formation”.
The decrease in the VCu formation energy upon complete replacement of Sn with Ge can be rationalized as follows. The Ge–S 298 K neutral diatomic bond dissociation enthalpy (BDE = 5.54 ± 0.03 eV) is substantially larger than that of Sn–S (4.84 eV)132 and, by replacing Sn–S bonds with stronger Ge–S bonds, Ge-substitution effectively weakens Cu–S bonds. As a result, less energy is required for Cu to break its bonds with S and form vacancies. In terms of solar cell parameters, the low ΔEdf for VCu in CZGS should mitigate the Voc-lowering effects associated with complete Ge-substitution.
Finally, for 2CuZn + YZn antisite clusters, where Y is either Sn or Ge, it is clear that complete Ge-substitution strongly suppresses their formation (0.92 eV) compared to CZTS (0.67 eV), ↓CZTGS (0.66 eV), and ↑CZTGS (0.68 eV). The difference between CZTS and CZGS (0.25 eV) can be attributed to the inert pair effect, which stabilizes the 2+ oxidation state of Sn and, therefore, stabilizes Sn on the Zn2+ site by reducing it from 4+ to 2+. Ge, on the other hand, only exists stably in a 4+ oxidation state, as evidenced by the positive ΔG298 for the reduction of GeS2 to GeS (0.80 eV), i.e., Ge(IV)S2 → Ge(II)S + S.133 Furthermore, Ge-substitution suppresses 2CuZn + YZn only under complete substitution because Ge does not affect the 2CuZn + SnZn formation energies and these defect clusters will continue to form as long as Sn, which is susceptible to reduction via the inert pair effect, is present in the structure. Hence, unless the more redox active Sn is completely replaced by the less redox active Ge, the ΔEdf for 2CuZn + YZn should remain close to that for CZTS. With that being said, partial Ge-substitution still can suppress the formation of 2CuZn + YZn by reducing xSn, thus shedding light on the experimentally observed increase in minority charge carrier lifetimes for Ge-alloyed (xGe = 0.3) CZTSSe.130
Via its substantial suppression of 2CuZn + YZn, as compared to other strategies in the literature,77 CZGS should offer a significant reduction in the rate of SRH recombination vs. CZTS. Unfortunately, despite the promising defect thermodynamics of CZGS, the band gap depends strongly on xGe (panel c) with a quasi-linear increase from CZTS (0.91 eV for PBE+U and ≈1.5 eV in experiments80) to CZGS (1.51 eV for PBE+U and ≈2.1 eV in experiments134). In summary, while only CZGS suppresses 2CuZn + YZn (rightward trajectory in Fig. 1), its Eg is well above ESQg (upward trajectory), thus prompting our next ion substitution strategy.
Effect of selenization on CZGS
One way to reduce the band gap of CZGS is Se-substitution (also known as selenization);134–138 this has been used extensively to reduce/optimize the band gap of CZTS.139,140 Band gap reduction in both CZTS and CZGS upon selenization can be explained by the slightly lower electronegativity of Se (2.55 on the Pauling scale141,142) compared to S (2.58), which pushes the valence band edge (comprising mostly Cu 3d and anion p states) up in energy but does not affect the conduction band edge (mostly Sn 5s).139 As a result, the band gap shrinks and the extent to which it does depends on xSe = Se/(S + Se). In Fig. 5, we consider both 50% (light green bars) and 100% (cyan bars) selenization (CZGSSe and CZGSe, respectively) in CZGS (yellow bars). Fig. 5a shows that the crystal structure of the lowest energy S/Se configuration of kesterite CZGSSe (see Section S3.2 in the ESI†) is composed of alternating S and Se (011) planes (red lines). As expected, our results show that selenization decreases EPBE+Ug (panel b) from 1.51 eV (CZGS) to 0.59 eV (CZGSe), with the magnitude of the decrease in excellent agreement with the experimental134,137,138 and theoretical literature.135 Additionally, we find that the PBE+U band gap of CZGSSe (0.92 eV) is approximately equal to the optimal CZTS value (black dotted line at 0.91 eV). With respect to polymorph preference, the introduction of 50% Se (CZGSSe) marginally stabilizes the low-Eg stannite polymorph (green, panel c) relative to CZGS (yellow) but not with respect to CZTS (black dotted line), thus signaling that selenization should not exacerbate polymorphism-derived Voc deficits.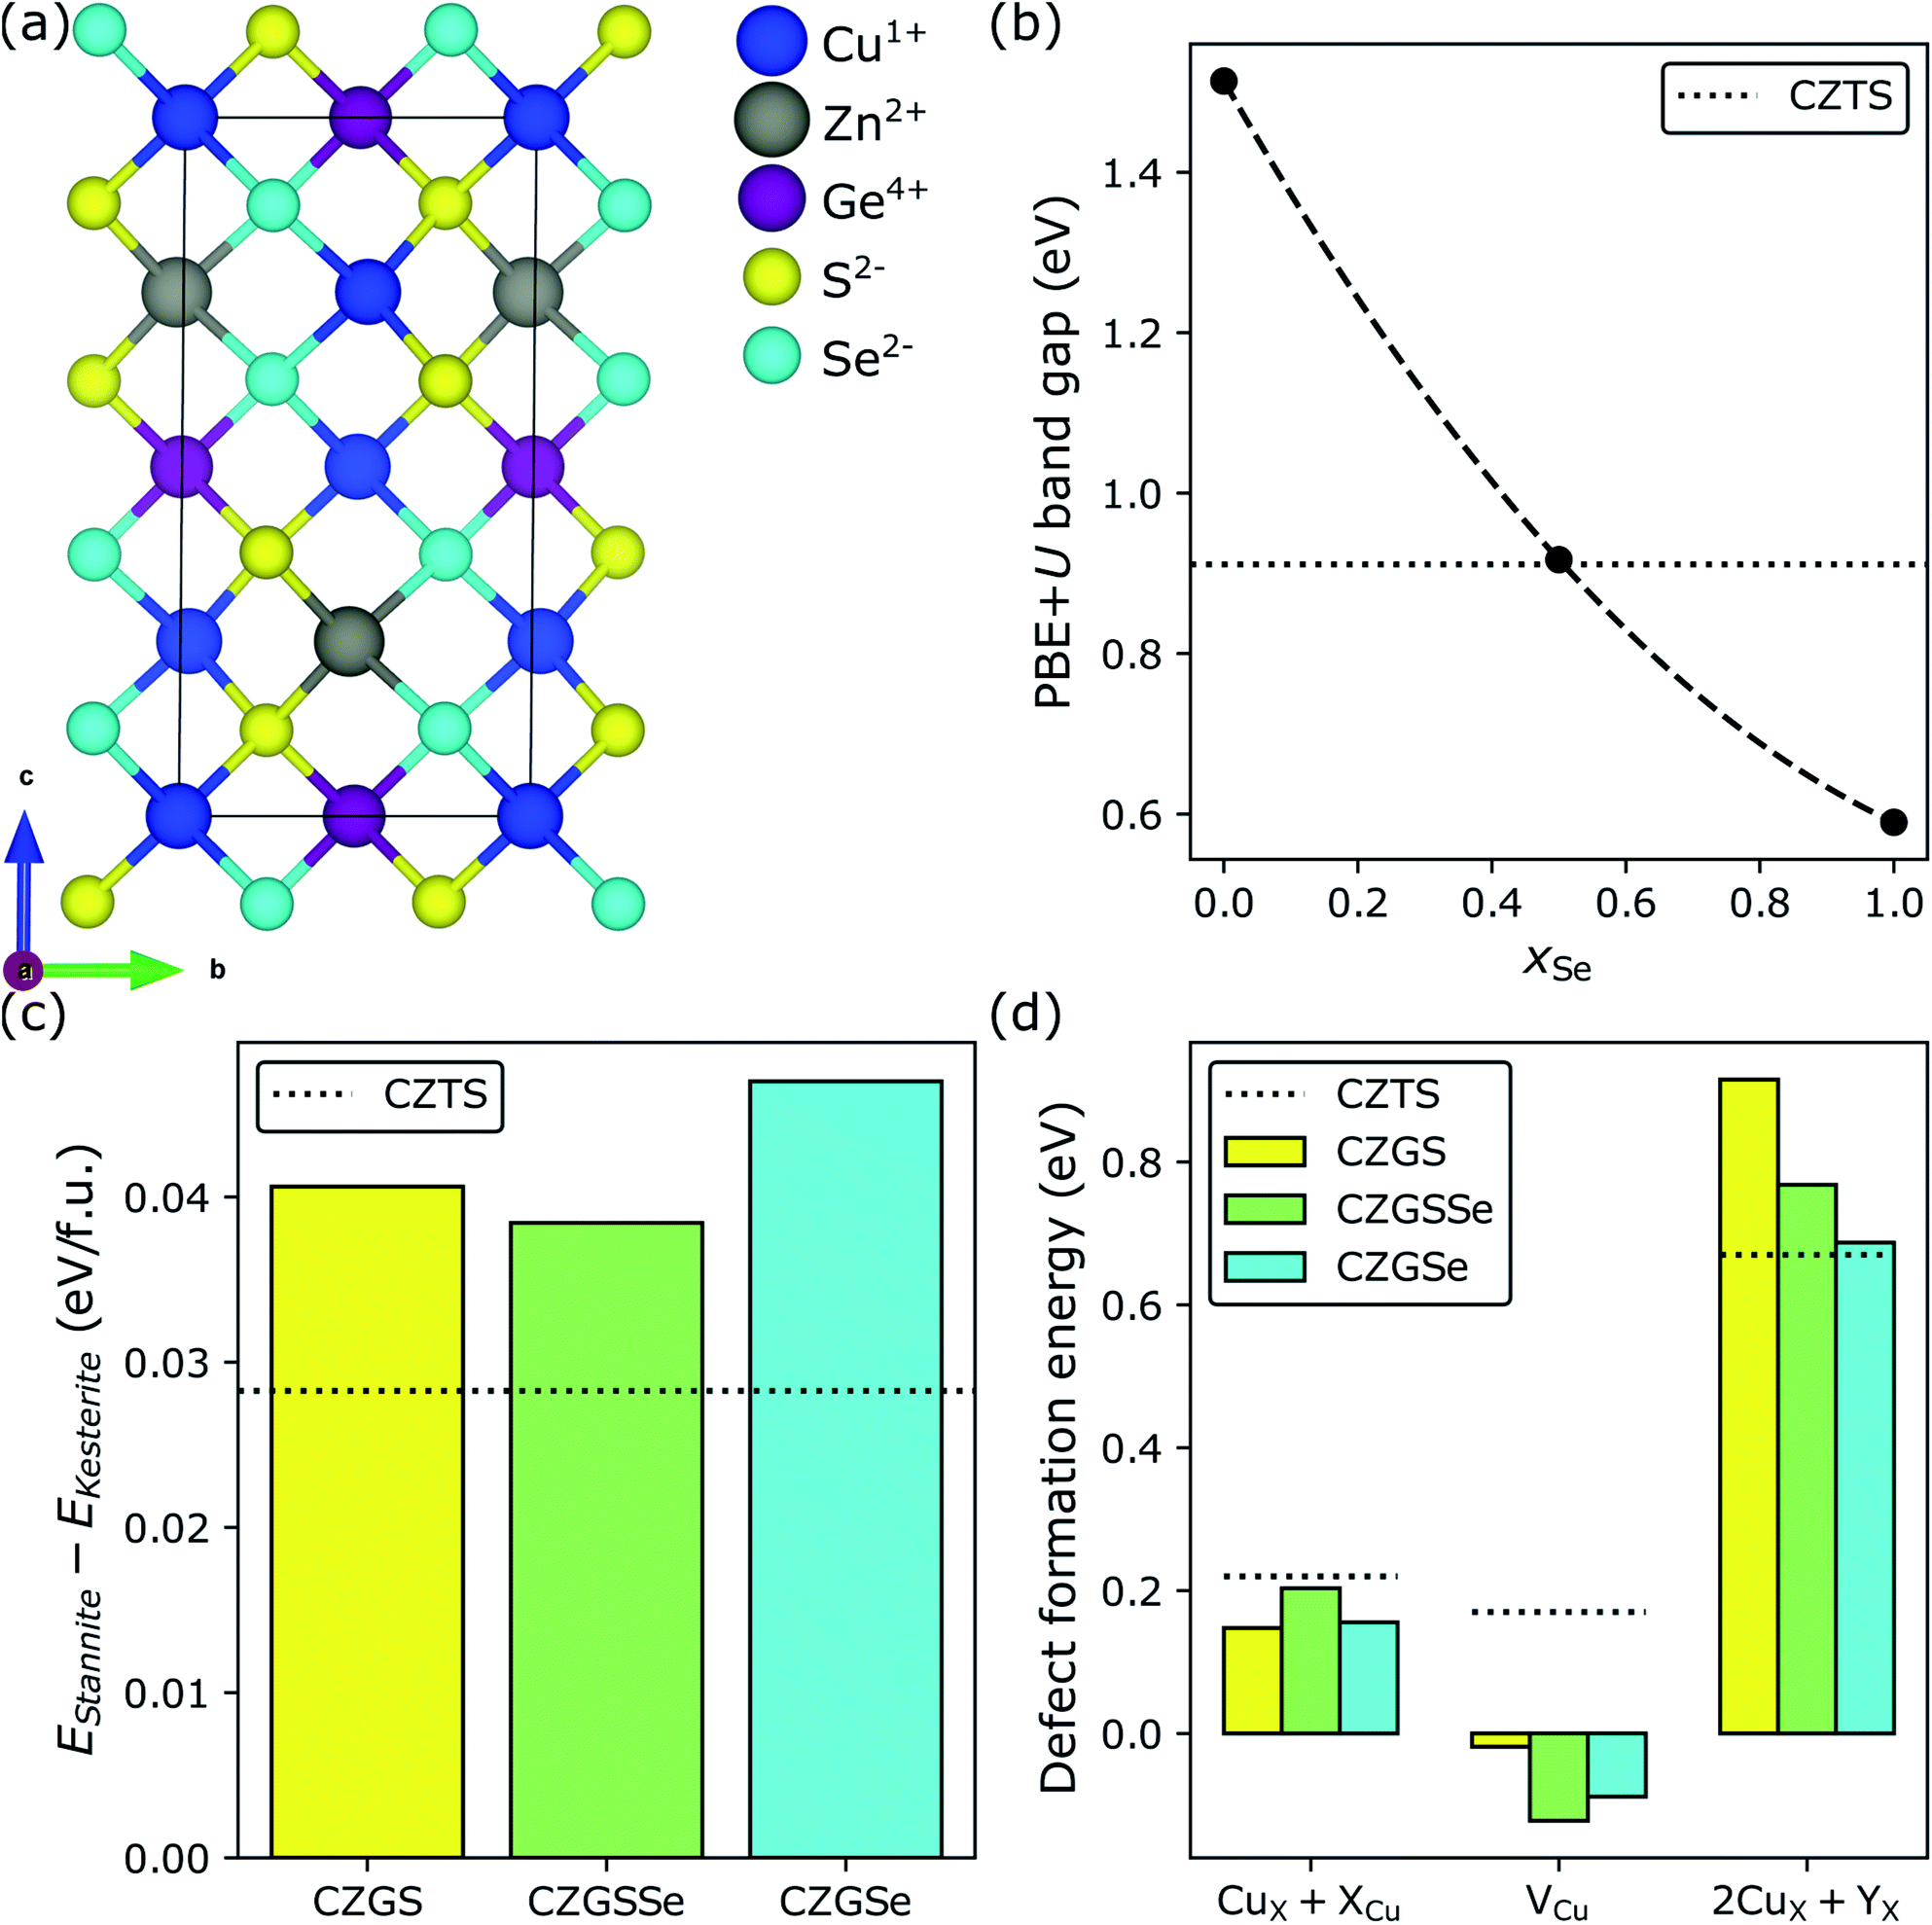 | ||
| Fig. 5 Selenization of CZGS. (a) Crystal structure of the minimum-energy configuration of Cu2ZnGeS2Se2 (CZGSSe), where the anion ordering is similar to how cations order in CuIn(S,Se)2. Effect of selenization on (b) the PBE+U band gap, (c) the DFT-SCAN relative stability of the stannite and kesterite polymorphs, and (d) DFT-SCAN defect formation energies under Cu-poor conditions. Minimum-energy defect configurations can be found in Fig. S12 and S13 in Section S9.2 of the ESI.† | ||
In view of the favorable band gap and stability of kesterite CZGSSe, we investigate the dependence of defect formation energies on xSe (panel d). First, we find, as do powder neutron diffraction measurements,59 that selenization slightly suppresses the formation of Voc-reducing CuZn + ZnCu antisite clusters relative to CZGS (0.15 eV for CZGS versus 0.20 and 0.16 eV for CZGSSe and CZGSe, respectively; CZTS is 0.22 eV). Furthermore, we predict that selenization promotes Eg-increasing/Voc-restoring Cu vacancies (−0.02 eV for CZGS versus −0.12 and −0.09 eV for CZGSSe and CZGSe, respectively), due to the decrease in bond strength from Cu–S (BDE = 2.85 ± 0.15 eV) to Cu–Se (2.64 ± 0.15 eV)132 and the endoergicity of Cu2S + Se → Cu2Se + S (ΔG298 = 0.12 eV). In spite of these promising trends, selenization counteracts the Ge-induced suppression of Isc-lowering 2CuZn + GeZn antisite clusters (0.92 eV for CZGS > 0.77 eV for CZGSSe > 0.69 eV for CZGSe ≈ 0.67 eV for CZTS, black dotted line). We ascribe this phenomenon to the following mechanism. While 2CuZn + GeZn is charge-balanced, the balancing charges (two holes and two electrons from 2CuZn and GeZn, respectively) are slightly delocalized.104 Therefore, it is reasonable to expect that the stability of 2CuZn + GeZn depends, to some extent, on the anion's tolerance for delocalization. Since Se is less electronegative (and more polarizable) than S, it should be able to accommodate more delocalization and, therefore, stabilize 2CuZn + GeZn. Thus, selenization of CZGS should decrease Isc, counteracting the beneficial suppression of CuZn + ZnCu and promotion of VCu. A final ion substitution step therefore must be taken in order to minimize the need for Eg-remediating but Isc-decreasing selenization in CZGS.
Cooperative effect of Cd-substitution and selenization on CZGS
Recently, it was predicted and subsequently observed that replacing the Zn in CZTS with Cd, under Cu-poor conditions, decreases its band gap and suppresses the formation of the deep-trap-level-inducing 2CuX + SnX, where X is either Zn or Cd.57,77 For these reasons, Cd-substitution in CZGS should limit the extent to which selenization is necessary and further suppress the formation of Isc-lowering defects. To test this hypothesis, in Fig. 6, we consider complete Cd-substitution in CZGS, leading to CCdGS (grey bars), and with 25% (purple bars) and 100% selenization (magenta bars), where the former was chosen as an intermediate Se-substitution condition by interpolating between the DFT-HSE band gaps of CCdGS and CCdGSe to find the value of xSe for which EHSEg[CCdGSSe] ≈ EHSEg[CZTS] = 1.49 eV.143,144Fig. 6a and b show the ground state S/Se configuration in stannite and wurtzite CCdGSSe, respectively (see Section S3.3 in the ESI†). In what follows, we examine both of these polymorphs because they are nearly isoenergetic (panel c) and more stable than kesterite (Ex − EKesterite < 0). Fortunately, the DFT-HSE band gaps of stannite and wurtzite CCdGSSe are similar in terms of their dependence on xSe (panel d) and achieve optimality at 25% selenization (1.43 and 1.47 eV for stannite and wurtzite, respectively), which suggests that, despite the polymorphism that is likely present in real samples, the energy offset between bands at stannite–wurtzite interfaces and, therefore, interfacial recombination rates145–148 should be small. Furthermore, optimality at xSe = 0.25 indicates that complete Cd-substitution cuts the need for Se-substitution in half, compared to CZGS → CZGSSe.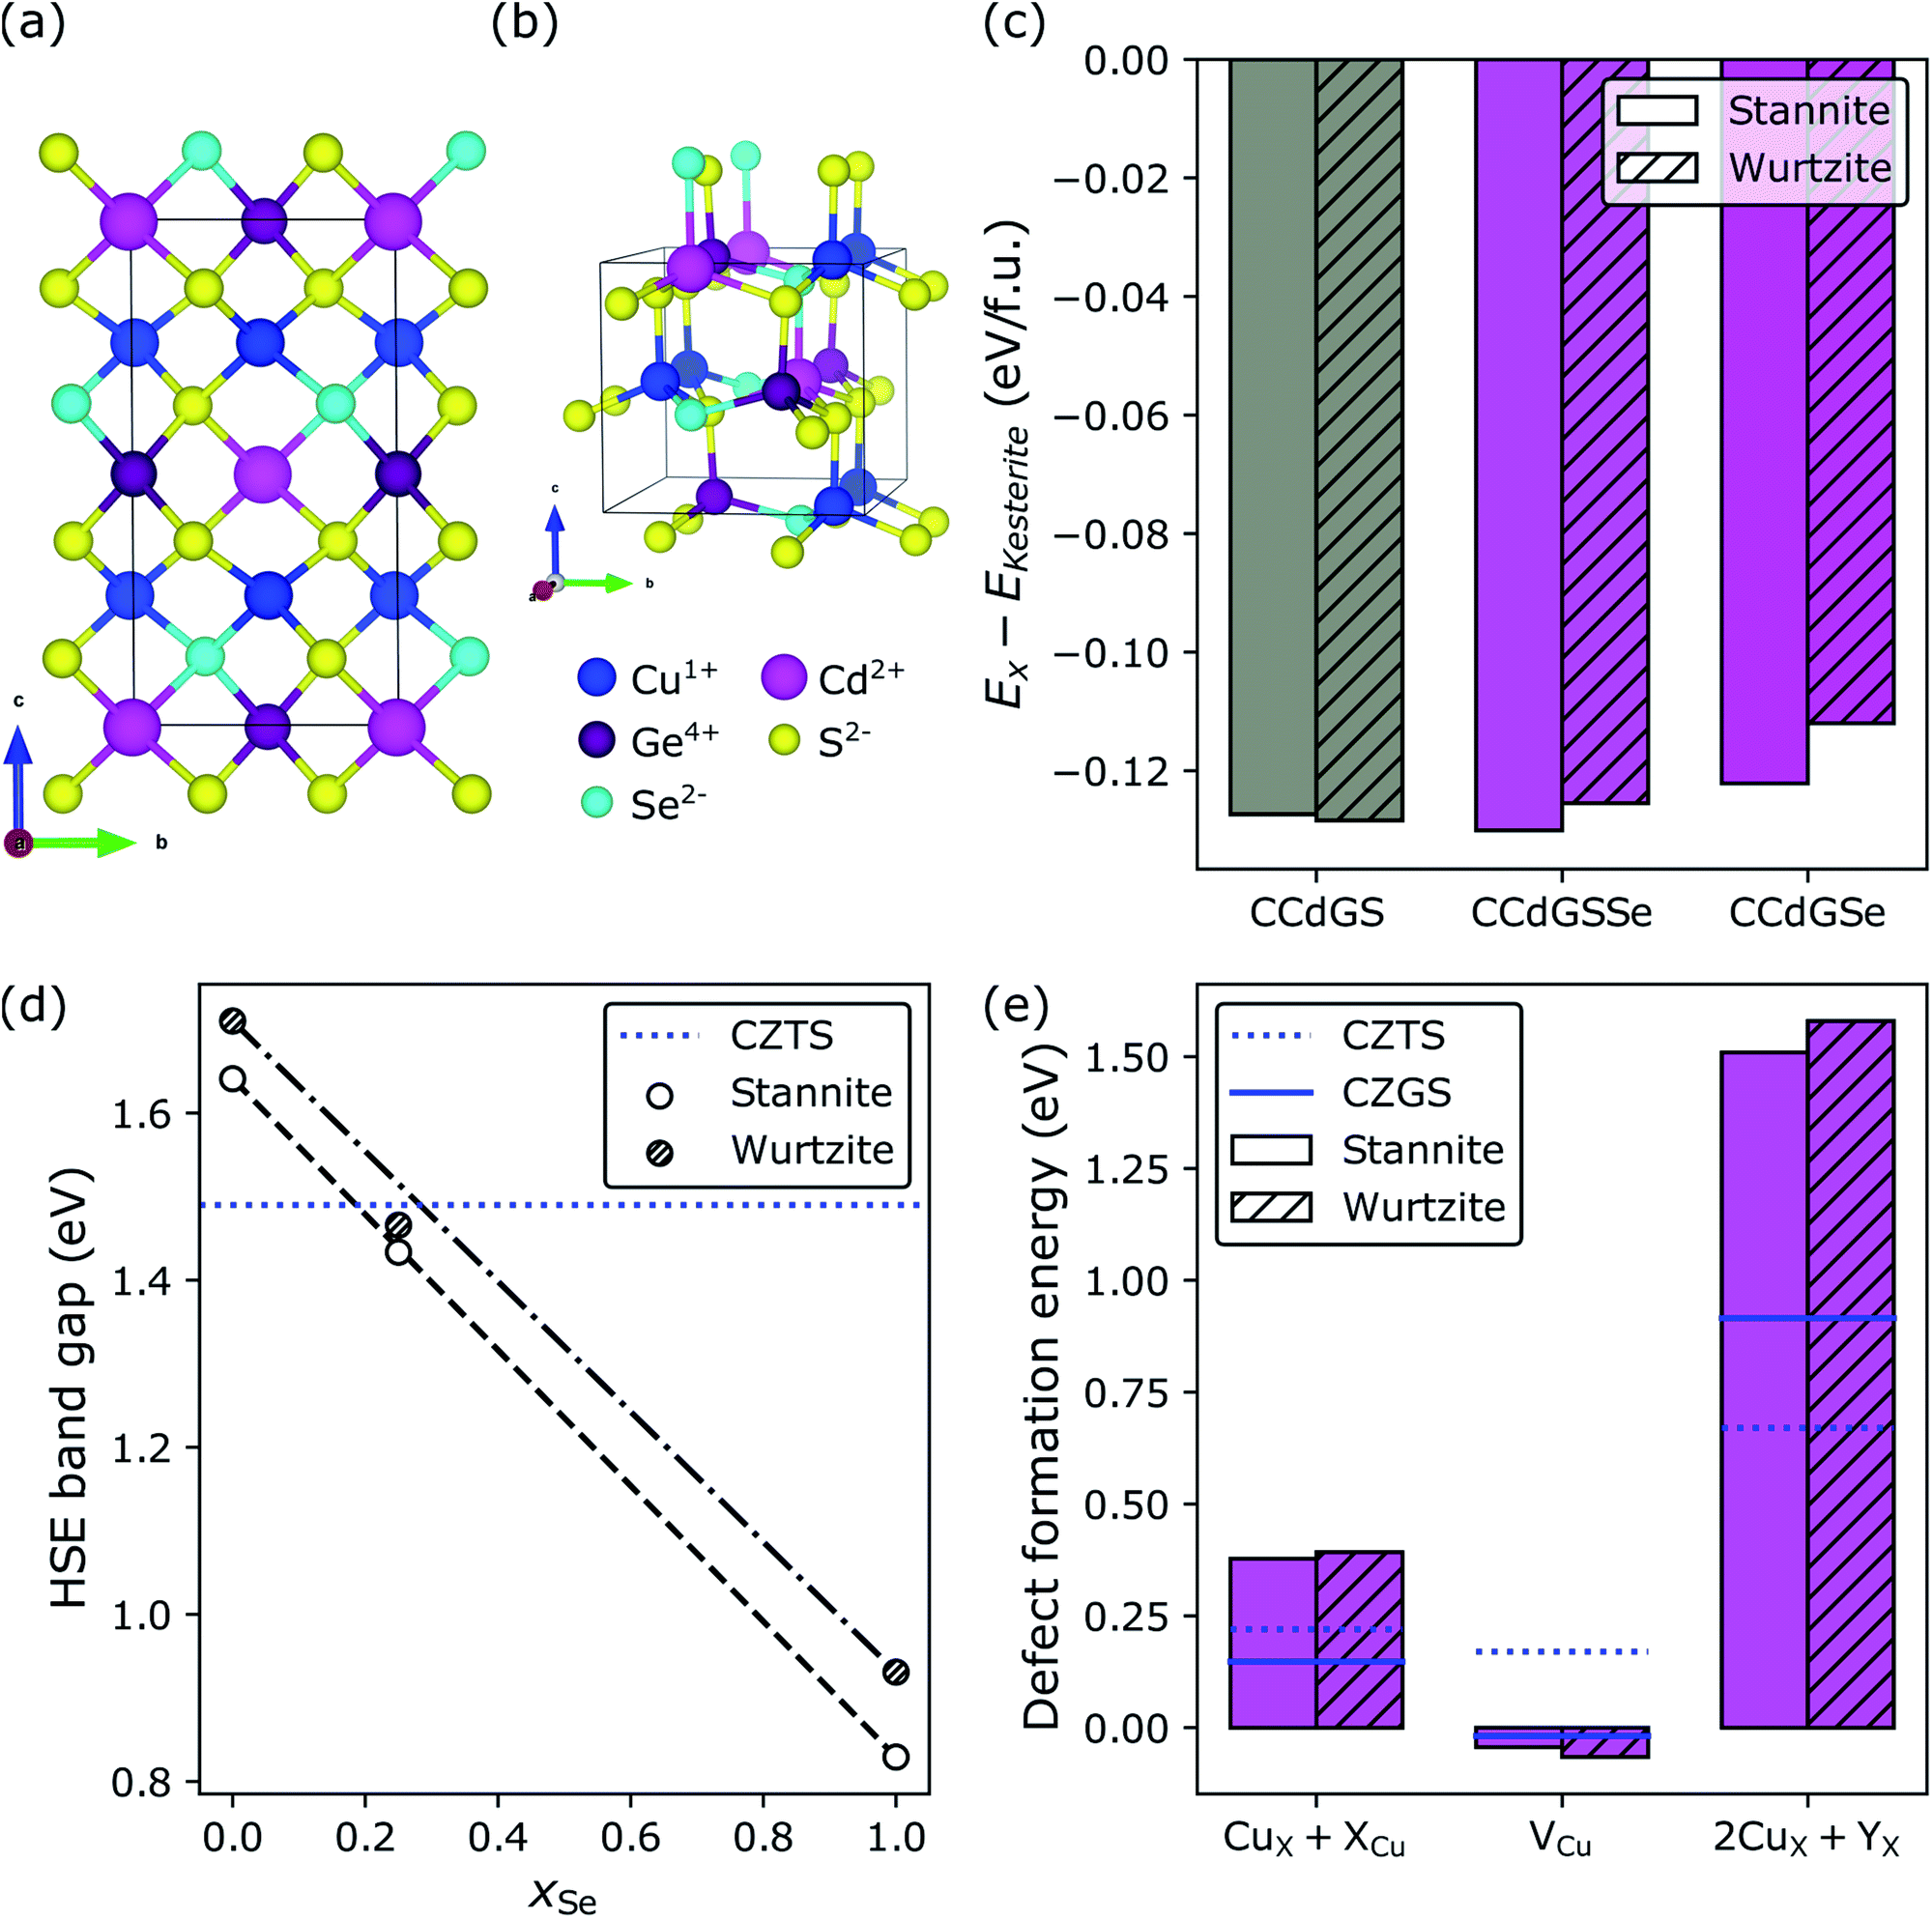 | ||
| Fig. 6 Cd-substitution and selenization of CZGS. Crystal structures of the minimum-energy configurations of the (a) stannite and (b) wurtzite polymorphs of Cu2CdGeS3Se (CCdGSSe). Effect of Cd-substitution and selenization on (c) the DFT-HSE relative stabilities of the stannite, wurtzite, and kesterite polymorphs, (d) the DFT-HSE band gap (CZTS value is from ref. 143 while the other band gaps were calculated by us), and (e) DFT-SCAN defect formation energies under Cu-poor conditions for CCdGSSe. Minimum-energy defect configurations can be found in Fig. S14 and S15 in Section S9.3 of the ESI.† | ||
Perhaps the most dramatic effect of Cd-substitution is on the defect thermodynamics of CZG(S,Se). Fig. 6e reveals that Cd-substitution suppresses the formation of Voc-lowering CuCd + CdCu antisite clusters in CCdGSSe (0.38 eV and 0.39 eV for stannite and wurtzite, respectively) compared to CuZn + ZnCu in CZTS (blue dotted line at 0.22 eV) and more than doubles the CuZn + ZnCu ΔEdf in CZGS (blue solid line at 0.15 eV). The suppression of CuX + XCu can be attributed to the larger ionic radius of Cd2+ compared to Cu+ and Zn2+.149 Additionally, Cd-substitution promotes the formation of Voc-increasing Cu vacancies (−0.04 eV and −0.07 eV for stannite and wurtzite, respectively) compared to CZTS (0.17 eV), while the ΔEdf for VCu in CCdGSSe is quite similar to CZGS (−0.02 eV). Thus, the stronger Ge–S bonds (versus Sn–S bonds) primarily govern the ease of formation of VCu in Ge-containing quaternary/quinary chalcogenides. Most importantly, Cd-substitution leads to a remarkably strong suppression of 2CuCd + GeCd in CCdGSSe (1.51 and 1.58 eV in stannite and wurtzite, respectively) relative to CZTS (0.67 eV) and CZGS (0.92 eV). The much higher ΔEdf corresponds to a roughly seven orders of magnitude decrease in xSRH (see Section S10 in the ESI†) under CZTS annealing conditions (600 K),34,35i.e., the maximum temperature to which CZTS is heated during synthesis, thus constituting an upper bound for crystalline defect concentrations. The significant suppression of 2CuCd + GeCd can be attributed to the large ionic radius difference between Cd2+ (0.78 Å in tetrahedral coordination) and Ge4+ (0.39 Å).149 Note that the local anionic configuration of CCdGSSe does not affect significantly its defect formation energies ( , see Fig. S16 and Table S10 in Section S11 of the ESI†).
To the best of our knowledge, there are neither reports on the synthesis of CCdGSSe (no entries in both the ICSD and Chemical Abstracts Service), experimental/computational characterizations of its solar cell parameters (Eg/Voc, Isc, and FF), nor publications/patents detailing the fabrication of CCdGSSe-based solar cells. Therefore, CCdGSSe may provide the innovation necessary to improve the efficiency of kesterite-inspired solar cells beyond their 12.6% efficiency record for CZTSSe79 that has remained stationary since 2013, and propel them toward competitiveness150 with Si (26.7%)3 and hybrid perovskites (25.2%).151
Discussion
Having discussed Ge-, Se-, and Cd-substitution individually (in order to reveal their independent effects on defect thermodynamics and electronic structure), we now, in Fig. 7, compare the performance of CZTS (green), CZGS (red), CZGSSe (blue), and CCdGSSe (magenta). The origin, i.e., (0,0,0), is the center of the black triangle and the axes, i.e., the closed line segments bounded by the origin and the vertices of the black triangle, correspond to the intrinsic stability/instability (energy above the convex hull at 0 K, Ehull), the band gap (Eg), and the formation energy of deep-trap inducing 2CuX + YX defect clusters (ΔEdf), which directly relate to the synthesizability, Voc, and Isc, respectively. Each axis is normalized as: (1) ΔEdf = 0 ≡ 0.67 eV (taken from CZTS under Cu-poor conditions) and = 1 ≡ 1.54 eV (average of stannite- and wurtzite-CCdGSSe); (2) Ehull = 0≡0.073 eV per atom (from CZGSSe) and 1 ≡ 0 eV per atom; and (3) Eg of 0 and 1 correspond to 0.60 eV and 0 eV deviations from the EHSEg of CZTS, where we plot the DFT-HSE band gaps for CZTS,143 CZGS,152 and CCdGSSe (this work), and an experimental gap for CZGSSe.134Fig. 7 shows that the performance of CZTS (roughly the area of the green triangle) comes from its stability (Ehull = 0 eV per atom) and optimal band gap (EHSEg = 1.49 eV (ref. 143) ≈ ESQg). However, CZTS is limited by the ease with which Isc-reducing 2CuZn + SnZn defect clusters form (ΔEdf = 0.67 eV). Complete Ge-substitution (CZGS, red), on the other hand, suppresses the formation of these detrimental defects (ΔEdf = 0.92 eV), leading to a performance increase along the ΔEdf axis, but widens the band gap (EHSEg = 2.09 eV (ref. 152)) too far beyond that of the nearly optimal CZTS value. Partial selenization (CZGSSe, blue) can be used to improve the band gap (Eexpg = 1.65 eV (ref. 134)) but it also reduces both the Ge-induced suppression of deep defects (ΔEdf = 0.77 eV) and the intrinsic stability of the material (Ehull = 0.073 eV per atom, ≈2.8 × kBT at 298 K). Remarkably, complete Cd-substitution (CCdGSSe, magenta) practically eliminates Isc-decreasing 2+/4+ disorder (ΔEdf = 1.54 eV), optimizes the band gap (Eg = 1.45 eV), and effectively stabilizes the material (Ehull = 0.005 eV per atom < kBT at 298 K, which is likely thermally accessible).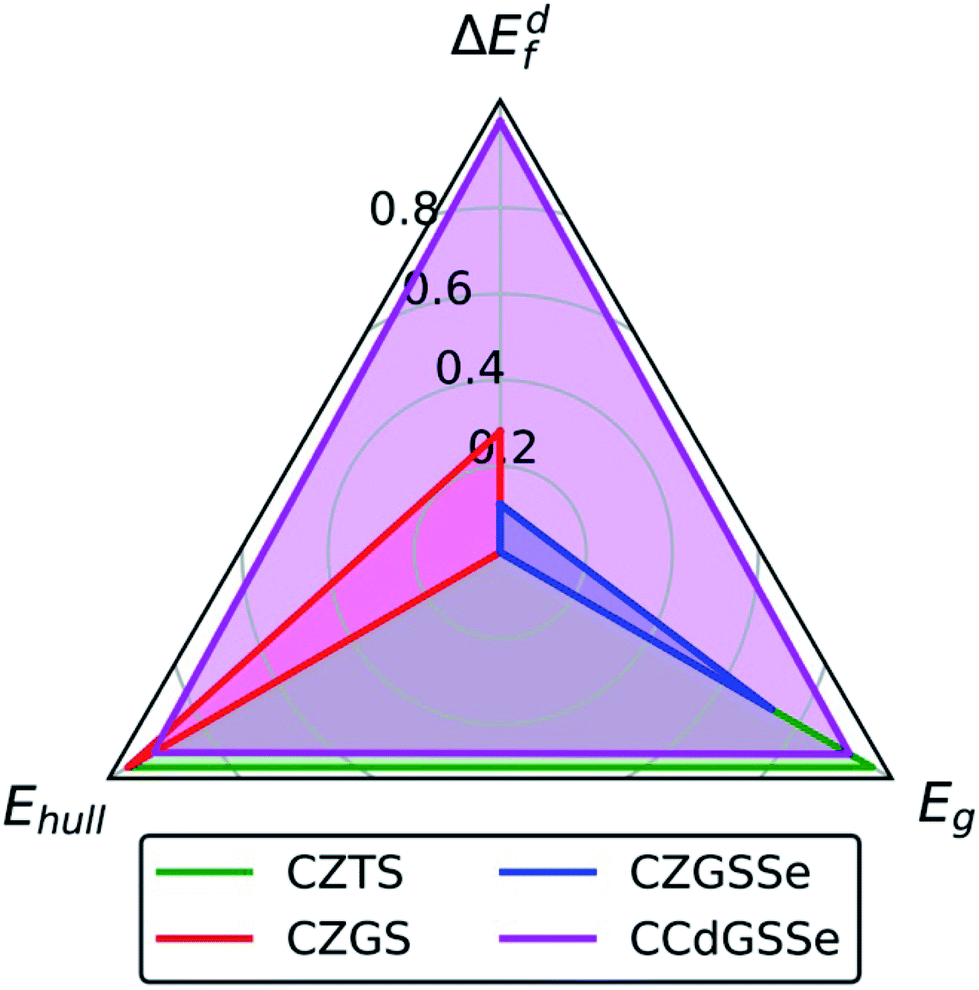 | ||
| Fig. 7 Variation in performance among CZTS, CZGS, CZGSSe, and CCdGSSe where ΔEdf is the normalized 2CuX + YX formation energy under Cu-poor conditions, Ehull is the energy/atom above the hull, and Eg is the normalized absolute deviation of the band gap from that of CZTS. Normalization, i.e., (x − xmin)/(xmax − xmin), is used to bring all values of the performance indicator x into the range [0,1]. For ΔEdf, values of 0 and 1 correspond to the 2CuZn + SnZn and polymorph-averaged 2CuCd + GeCd formation energies under Cu-poor conditions for CZTS (0.67 eV) and CCdGSSe (1.54 eV), respectively. For Ehull, values of 0 and 1 correspond to 0.073 eV per atom (CZGSSe) and 0 eV per atom above the hull, respectively (see Table S11 in Section S12 of the ESI†). For Eg, values of 0 and 1 correspond to 0.60 eV and 0 eV deviations from the DFT-HSE band gap of CZTS.143 | ||
The stability of CCdGSSe is supported by reports of the synthesis and characterization of the closely related compounds Cu2CdGeS4 (ref. 107) and Cu2CdGeSe4,108,153–155 which differ from CCdGSSe only in S–Se ratio. For both compounds, we predict Ehull = 0 eV per atom, which is consistent with their synthesizability (see Table S11 in Section S12 of the ESI†). Additionally, we predict that CCdGS and CCdGSe prefer the wurtzite and stannite polymorphs, respectively [see Fig. 6c], which agrees with X-ray diffraction measurements.107,108,153–155 The excellent agreement between theory and experiment for these very closely related compounds CCdGS and CCdGSe suggests that our prediction of the bulk stability of CCdGSSe should be reliable.
We also calculated the thermodynamics of CCdGSSe phase separation, i.e., Cu2CdGeS3Se → 3/4Cu2CdGeS4 + 1/4Cu2CdGeSe4, and Fig. S1 in Section S2 of the ESI† shows that the configurational entropy of ideal S/Se mixing on the anion sublattice stabilizes CCdGSSe at temperatures above 133 K. Note that the 0 K convex hull at the composition of Cu2CdGeS3Se actually consists of Cu2GeS3 + CdSe and not the mixture of wurtzite-Cu2CdGeS4 and stannite-Cu2CdGeSe4. We find that the S/Se mixing entropy and vibrational entropic contributions stabilize CCdGSSe with respect to the decomposition into Cu2GeS3 + CdSe at temperatures above 879 K (see Fig. S2 and S3 and Table S4 in Section S2 of the ESI†), which is comparable with typical sulfurization temperatures of CZTS and CCdTS, i.e., 580–600 °C or 853–873 K.77
The calculated band gap of CCdGSSe (1.45 eV) is bounded by the measured band gaps of CCdGS (1.85–2.05 eV)118,156–158 and CCdGSe (1.14–1.27 eV)138,159–161 (see Table S12 in Section S13 of the ESI†), which suggests that our prediction of the optimality of the band gap of CCdGSSe is accurate. Since the measured band gaps of quinary metal sulfide-selenides are proportional to xSe,140,162 that of CCdGSSe should be approximately 1.67–1.86 eV, as found by linear interpolation. While this is slightly greater than the nearly ideal band gap of CZTS (1.49 eV (ref. 143)), further selenization to Cu2CdGeS2Se2 (xSe = 0.5) optimizes the interpolated band gap (1.50–1.66 eV) and does not influence our conclusion that complete Cd- and Ge-substitution strongly suppresses the formation of detrimental defects (see Table S13 in Section S13 of the ESI†).
It also is crucial to know, for a given Fermi level, the most stable charge state and deep/shallow character of the defect and its potential trapping ability. We therefore calculated the formation energies of the following charged defects and defect clusters in stannite CCdGSSe, which are consistent with those considered in ref. 58: VCu, CuCd, CdCu, VS, VSe, GeCd, VS + CuCd, and VSe + CuCd. The left panel of Fig. 8 shows that only VCu (q = −1, 0), CuCd (q = −1, 0), and CdCu (q = 1) should form in appreciable quantities for Fermi energies between the valence-band maximum (VBM) and conduction-band minimum (CBM), and under Cu-poor conditions (i.e., when CCdGS, Cd4GeS6, GeS2, S, and Se are in equilibrium). The defect transition levels in the right panel of Fig. 8 agree qualitatively with those for CZTSe, CZTS, CZGSe, and Ag2ZnSnSe4 in ref. 58, with the exception of GeCd, which exhibits deep donor levels within the valence band. The formation energy of GeCd (1.44–1.45 eV), however, is well above that of the neutral 2CuZn + SnZn antisite cluster in CZTS (0.84 eV),104 which constitutes an upper bound on the formation energy of defects that affect solar cell parameters. GeCd + CuCd also has deep donor and acceptor levels, however, we discard this defect as well because of its high formation energy. Therefore, CCdGSSe should exhibit lower non-radiative recombination than CZTS.
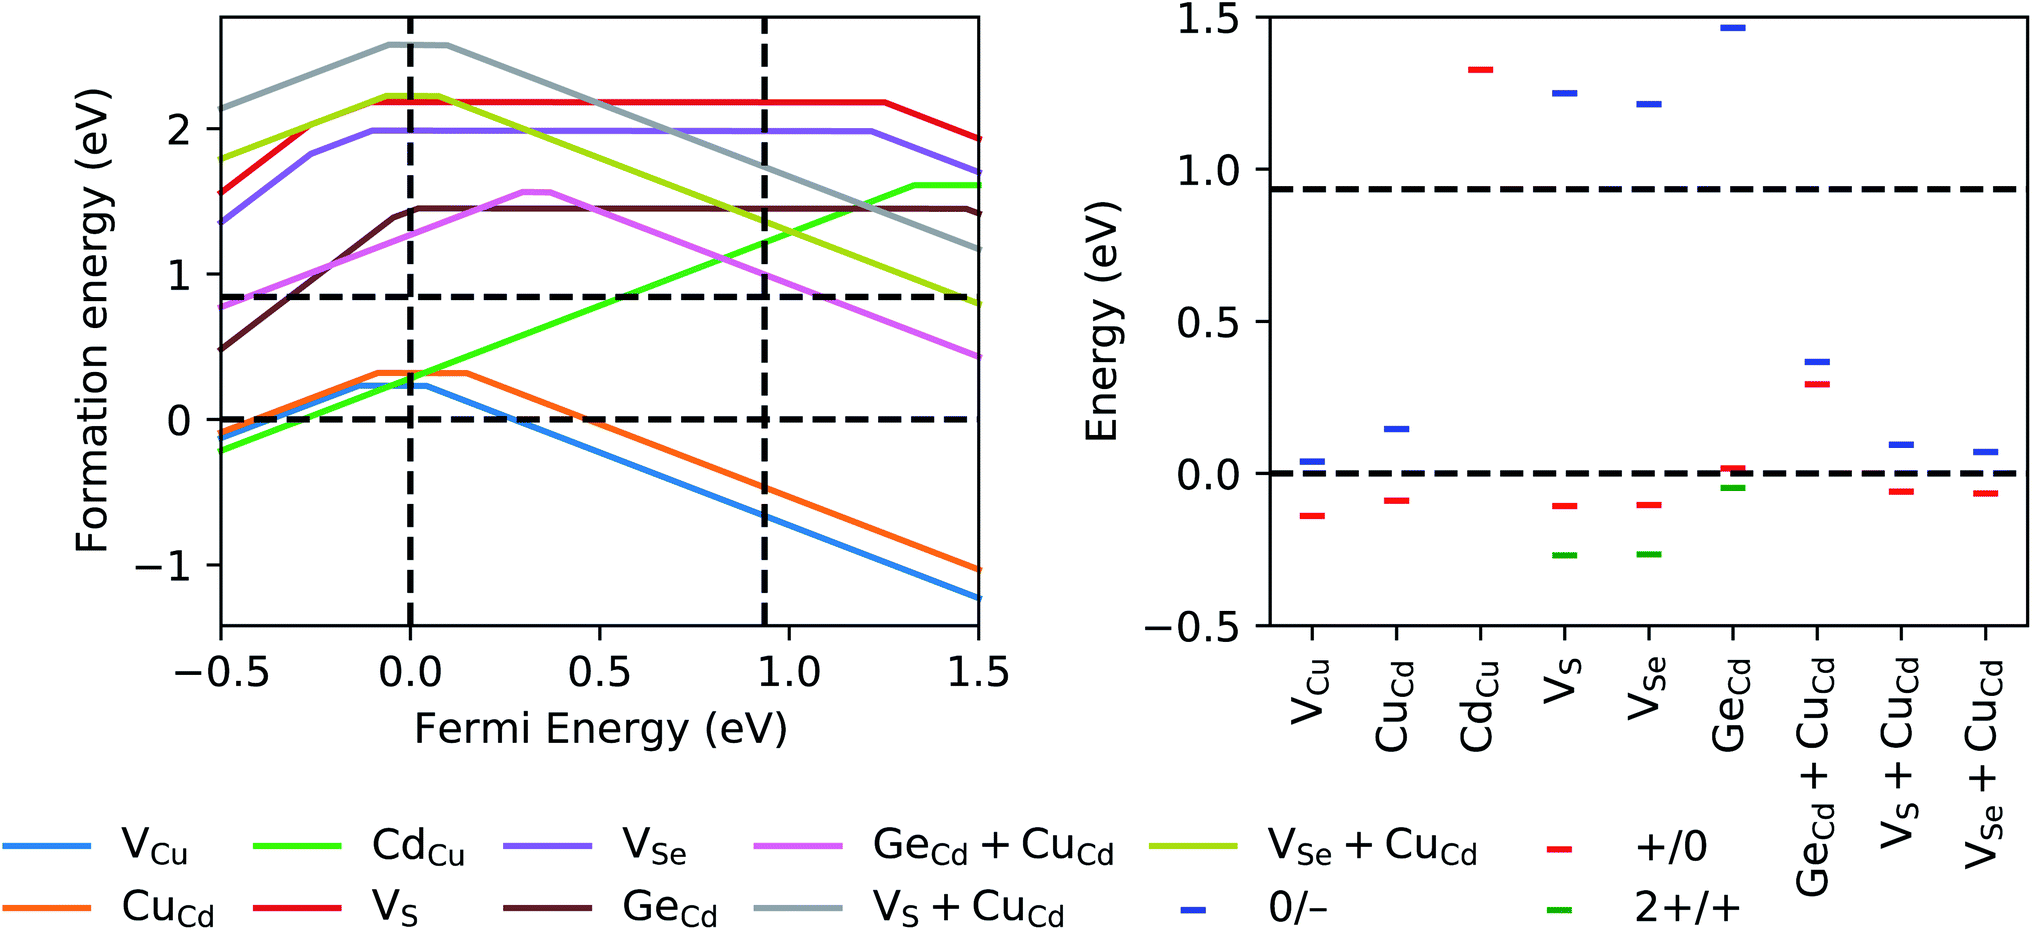 | ||
| Fig. 8 (Left) GGA+U+D formation energies under Cu-poor conditions (i.e., when CCdGS, Cd4GeS6, GeS2, S, and Se are in equilibrium) of various charged vacancies, antisites, vacancy-antisite clusters, and antisite clusters considered within stannite CCdGSSe, plotted as a function of the Fermi energy. Vertical, dashed, black lines at 0 eV and 0.93 eV indicate the GGA+U+D VBM and CBM, respectively, where the zero of the Fermi energy is arbitrarily set to the VBM. For VCu, CuCd, CdCu, GeCd + CuCd, VS + CuCd, and VSe + CuCd, three ionized states are considered, namely, q = −1 (negatively charged, slope of −1), q = 0 (neutral, zero slope), and q = 1 (positively charged, slope of 1). For VS, VSe, and GeCd, we also consider q = 2 (doubly positively charged, slope of 2). The solid lines indicate the minimum formation energy at each Fermi energy, indicative of the most stable charged state of the defect. Horizontal, dashed, black lines at 0 eV and 0.84 eV respectively indicate the threshold for exothermic defect formation and the GGA+U+D formation energy of the neutral 2CuZn + SnZn antisite cluster,104 which causes Shockley–Read–Hall recombination in CZTS.41,53,54 The latter constitutes an upper bound on the formation energy of defects that affect solar cell parameters. (Right) Transition levels of the defects in left panel. Blue, red, and green dashes respectively signify acceptor (q, 0 → −1), donor (q, 1 → 0), and donor (q, 2 → 1) transition levels. | ||
The acceptor transition levels of VCu and CuCd at EF − EVBM = 39 meV and 146 meV, respectively, agree quantitatively with those in ref. 118, i.e., 27–34 meV and 157 meV, respectively. Therefore, VCu and CuCd likely are present in detectable quantities for CCdGSSe but we expect the absolute CuX concentrations to be lower than in CZTS (ΔEdf = −0.20 eV for CuZn in CZTS versus 0.02 eV for CuCd in CCdGSSe – see Table S8 in Section S7 in the ESI†). The right panel of Fig. 8 also shows that only CdCu has a donor transition level that is close to the conduction band but it is within the band itself. Therefore, we cannot assign the defects and/or defect complexes we considered to the experimentally observed deep donor transition levels at ∼50–120 meV below the CBM.118
In addition to developing a feasible and original ion substitution scheme for optimizing kesterite solar cells, we also clarify the mechanisms of defect suppression and promotion by Ge and Se, emphasizing the crucial role of the inert pair effect and metal-chalcogen bond covalency, respectively. These insights reveal three important materials design considerations for tuning defect formation in kesterite-type absorbers via ion substitution: (1) bond order (BO) conservation, (2) cation redox inactivity, and (3) anion polarizability. The BO conservation principle states that the sum of the strengths of the bonds to an anion from its adjacent cations is nearly equal to its valence.163 In other words, if some of the anion–cation bonds become stronger, e.g., upon cation substitution, then the others must become weaker in order to conserve the BO of the anion. Such bond strength reciprocity can be used, for example, to tune the formation energy of Voc-increasing Cu vacancies. By replacing Sn with an element that forms stronger bonds with S, such as Ge (BDE = 5.54 ± 0.03 eV for Ge–S vs. 4.84 eV for Sn–S),132 BO conservation dictates that the Cu–S bonds must become weaker; therefore, Cu vacancies should form more easily in CZGS than CZTS, as is shown in Fig. 4b (ΔEdf = −0.02 eV for CZGS vs. 0.17 eV for CZTS). This same principle is illustrated upon examination of how the formation energies of neutral chalcogen vacancies and their neutral clusters with CuX antisites, which also have been predicted theoretically to be strong electron traps,164 change with X and Y. Table S14 in Section S14 of the ESI† shows that generally Cd (Ge) decreases (increases) the formation energies of these defects compared to Zn (Sn). The effect of compositional changes on the formation energies of these defects again can be rationalized on the basis of 298 K neutral diatomic bond dissociation enthalpies (BDEs): Cd–S bonds (2.16 ± 0.22 eV) are weaker than Zn–S bonds (2.33 ± 0.13 eV) and Ge–S bonds (5.53 eV) are stronger than Sn–S (4.84 eV). Note that uncertainties in the Ge–S and Sn–S BDEs are unavailable.132
To illustrate the effect of cation redox activity on defect formation, consider the 2CuZn + SnZn antisite cluster. While Zn exhibits only one normal oxidation state (2+), Cu and Sn exhibit two (1+ and 2+ for Cu and 2+ and 4+ for Sn), where Sn2+ is stabilized by the inert pair effect. The redox activities of Cu and Sn promote the formation of CuZn and SnZn antisites, respectively, because they both can adopt the 2+ oxidation state of Zn, thereby reducing the electrostatic energy penalty associated with the formation of these antisites and, consequently, their clusters. Replacing Sn (2+ and 4+) with an element that is redox inactive, such as Ge (4+), should suppress the formation of Isc-reducing Zn/4+ disorder, as is shown in Fig. 4b (ΔEdf = 0.92 eV for CZGS vs. 0.67 eV for CZTS).
A final point to consider when designing kesterite solar cell materials is the polarizability of the anion. To explain its significance, we again consider the recombination-inducing 2CuZn + YZn antisite cluster, now focusing on the case where Y = Ge. Despite the fact that this defect is neutral and globally charge compensated (i.e., 2CuZn and GeZn produce two holes and two electrons, respectively, which cancel each other out), the generated charge carriers are, to some extent, delocalized.104 Since Ge4+ is resistant to reduction, with reduction being a likely consequence of localized electrons, the stability of this particular defect depends on the anion's tolerance for delocalization, which can be measured in terms of its polarizability. Given that Se (3.89 × 10⁻²⁴ cm3) is more polarizable than S (2.87 × 10⁻²⁴ cm3),132 it should be able to stabilize this detrimental defect, which is precisely what we find in Fig. 5d, where the formation energy of 2CuZn + GeZn decreases almost linearly with increasing xSe.
Based on these considerations, there are a few ion substitution strategies worth exploring further. Note that we, by no means, intend to suggest that the following strategies are exhaustive or the only ones worth pursuing; they are simply those that were inspired by the considerations above. First, while several studies involve Ge- and Se-co-substitution,121–125,127–131,134,165,166 few vary xGe and xSe concurrently;59,136,138 for that reason, there may be room to further improve CZGSSe via concurrent and comprehensive variation of xGe and xSe. Additionally, since we consider only three possible compositions of CCdGSSe and a few, albeit important, defects, opportunities exist for theory to provide a better understanding of its composition-dependent properties and experiments to validate and augment its performance, e.g., via cell fabrication. Another strategy that has proven effective is to replace Cu+ with redox inactive 1+ cations such as the alkali metal cations62–72 and Ag+.57–61,167 While quaternary and quinary chalcogenides containing these cations have been studied extensively, there remains a great need to explore their post-quinary combinations in conjunction with Ge-, Se-, and Cd-substitution. For example, we suggest Na-doping in either CCdGSSe or CZGSSe (to avoid Cd) as a promising pathway to further mitigate the formation of disorder-causing and Voc-reducing antisites and improve the performance of kesterite-based solar cells.
Conclusions
This work introduces the new photovoltaic material CCdGSSe, which we predict to be nearly thermodynamically stable, have an ideal band gap, and offer substantial suppression of the defects that plague the efficiency of other Cu2ZnSnS4-based materials, based on extensive DFT-based calculations. Additionally, we ascribe mechanisms to the dependence of key, performance-affecting defect formation energies on Ge and Se content, revealing how: (1) bond order conservation can be used to tune vacancy formation energies (e.g., decrease the formation energy of Voc-increasing Cu vacancies); (2) the inert pair effect of Sn leads to its redox flexibility and thus promotes Isc-reducing Zn/Sn disorder; and (3) the polarizability of Se stabilizes the local charge imbalances created by cation disorder, thereby reducing the thermodynamic barrier for defect cluster formation. These insights and the materials design principles gleaned in this work should provide the community of CZTS researchers with a heightened intuition for how to optimize kesterite solar cell materials, hopefully enabling this promising photovoltaic technology to reach its full potential.Conflicts of interest
There are no conflicts to declare.Acknowledgements
E. A. C. thanks the U.S. Department of Energy, Office of Science, Basic Energy Sciences, under Grant DE-SC0002120 for funding this project. The authors thank Princeton Research Computing resources at Princeton University, a consortium of groups including the Princeton Institute for Computational Science and Engineering and the Princeton University Office of Information Technology's Research Computing department.Notes and references
- J. Jean, P. R. Brown, R. L. Jaffe, T. Buonassisi and V. Bulović, Energy Environ. Sci., 2015, 8, 1200–1219 RSC.
- F. Haase, C. Hollemann, S. Schäfer, A. Merkle, M. Rienäcker, J. Krügener, R. Brendel and R. Peibst, Sol. Energy Mater. Sol. Cells, 2018, 186, 184–193 CrossRef CAS.
- K. Yoshikawa, H. Kawasaki, W. Yoshida, T. Irie, K. Konishi, K. Nakano, T. Uto, D. Adachi, M. Kanematsu, H. Uzu and K. Yamamoto, Nat. Energy, 2017, 2, 17032 CrossRef CAS.
- C. Battaglia, A. Cuevas and S. De Wolf, Energy Environ. Sci., 2016, 9, 1552–1576 RSC.
- K. Peng, Y. Xu, Y. Wu, Y. Yan, S.-T. Lee and J. Zhu, Small, 2005, 1, 1062–1067 CrossRef CAS PubMed.
- S. G. Kumar and K. S. R. K. Rao, Energy Environ. Sci., 2014, 7, 45–102 RSC.
- X. Wu, Sol. Energy, 2004, 77, 803–814 CrossRef CAS.
- J. Ma and S.-H. Wei, Phys. Rev. Lett., 2013, 110, 235901 CrossRef PubMed.
- M. Nakamura, K. Yamaguchi, Y. Kimoto, Y. Yasaki, T. Kato and H. Sugimoto, IEEE Journal of Photovoltaics, 2019, 9, 1863–1867 Search PubMed.
- J. Ramanujam and U. P. Singh, Energy Environ. Sci., 2017, 10, 1306–1319 RSC.
- S. Siebentritt, M. Igalson, C. Persson and S. Lany, Prog. Photovoltaics, 2010, 18, 390–410 CAS.
- B. M. Kayes, H. Nie, R. Twist, S. G. Spruytte, F. Reinhardt, I. C. Kizilyalli and G. S. Higashi, in 2011 37th IEEE Photovoltaic Specialists Conference, IEEE, 2011, pp. 000004–000008 Search PubMed.
- P. Dutta, M. Rathi, D. Khatiwada, S. Sun, Y. Yao, B. Yu, S. Reed, M. Kacharia, J. Martinez, A. P. Litvinchuk, Z. Pasala, S. Pouladi, B. Eslami, J.-H. Ryou, H. Ghasemi, P. Ahrenkiel, S. Hubbard and V. Selvamanickam, Energy Environ. Sci., 2019, 12, 756–766 RSC.
- A. J. Ritenour, J. W. Boucher, R. DeLancey, A. L. Greenaway, S. Aloni and S. W. Boettcher, Energy Environ. Sci., 2015, 8, 278–285 RSC.
- S. D. Stranks, G. E. Eperon, G. Grancini, C. Menelaou, M. J. P. Alcocer, T. Leijtens, L. M. Herz, A. Petrozza and H. J. Snaith, Science, 2013, 342, 341–344 CrossRef CAS PubMed.
- M. Saliba, T. Matsui, J.-Y. Seo, K. Domanski, J.-P. Correa-Baena, M. K. Nazeeruddin, S. M. Zakeeruddin, W. Tress, A. Abate, A. Hagfeldt and M. Grätzel, Energy Environ. Sci., 2016, 9, 1989–1997 RSC.
- W.-J. Yin, J.-H. Yang, J. Kang, Y. Yan and S.-H. Wei, J. Mater. Chem. A, 2015, 3, 8926–8942 RSC.
- H.-L. Yip and A. K. Y. Jen, Energy Environ. Sci., 2012, 5, 5994 RSC.
- Y. Li, Acc. Chem. Res., 2012, 45, 723–733 CrossRef CAS PubMed.
- Y. Lin, J. Wang, Z.-G. Zhang, H. Bai, Y. Li, D. Zhu and X. Zhan, Adv. Mater., 2015, 27, 1170–1174 CrossRef CAS PubMed.
- B. O'Regan and M. Grätzel, Nature, 1991, 353, 737–740 CrossRef.
- Z. Ning, Y. Fu and H. Tian, Energy Environ. Sci., 2010, 3, 1170 RSC.
- A. Hagfeldt, G. Boschloo, L. Sun, L. Kloo and H. Pettersson, Chem. Rev., 2010, 110, 6595–6663 CrossRef CAS PubMed.
- L. Ye, Y. Xiong, Q. Zhang, S. Li, C. Wang, Z. Jiang, J. Hou, W. You and H. Ade, Adv. Mater., 2018, 30, 1705485 CrossRef PubMed.
- W. Zhao, Y. Zhang, S. Zhang, S. Li, C. He and J. Hou, J. Mater. Chem. C, 2019, 7, 3206–3211 RSC.
- A. Kakekhani, R. N. Katti and A. M. Rappe, APL Mater., 2019, 7, 041112 CrossRef.
- S. K. Wallace, J. M. Frost and A. Walsh, J. Mater. Chem. A, 2019, 7, 312–321 RSC.
- F. Ye, H. Wu, M. Qin, S. Yang, G. Niu, X. Lu, J. Wang, D. B. Mitzi and W. C. H. Choy, ACS Appl. Mater. Interfaces, 2020, 12, 24498–24504 CrossRef CAS PubMed.
- S. Delbos, EPJ Photovoltaics, 2012, 3, 35004 CrossRef CAS.
- H. Azimi, Y. Hou and C. J. Brabec, Energy Environ. Sci., 2014, 7, 1829–1849 RSC.
- H. Zhou, H.-S. Duan, W. Yang, Q. Chen, C.-J. Hsu, W.-C. Hsu, C.-C. Chen and Y. Yang, Energy Environ. Sci., 2014, 7, 998 RSC.
- H. Zhou, W. C. Hsu, H. S. Duan, B. Bob, W. Yang, T. Bin Song, C. J. Hsu and Y. Yang, Energy Environ. Sci., 2013, 6, 2822–2838 RSC.
- K. Woo, Y. Kim and J. Moon, Energy Environ. Sci., 2012, 5, 5340–5345 RSC.
- A. Redinger, D. M. Berg, P. J. Dale and S. Siebentritt, J. Am. Chem. Soc., 2011, 133, 3320–3323 CrossRef CAS PubMed.
- G. Wang, W. Zhao, Y. Cui, Q. Tian, S. Gao, L. Huang and D. Pan, ACS Appl. Mater. Interfaces, 2013, 5, 10042–10047 CrossRef CAS PubMed.
- K. Yu and E. A. Carter, Chem. Mater., 2016, 28, 864–869 CrossRef CAS.
- J. J. Scragg, T. Ericson, T. Kubart, M. Edoff and C. Platzer-Björkman, Chem. Mater., 2011, 23, 4625–4633 CrossRef CAS.
- W. Shockley and W. T. Read, Phys. Rev., 1952, 87, 835–842 CrossRef CAS.
- R. N. Hall, Phys. Rev., 1952, 87, 387 CrossRef CAS.
- K. Yu and E. A. Carter, Chem. Mater., 2015, 27, 2920–2927 CrossRef CAS.
- S. Chen, J. H. Yang, X. G. Gong, A. Walsh and S. H. Wei, Phys. Rev. B: Condens. Matter Mater. Phys., 2010, 81, 35–37 Search PubMed.
- W. Shockley and H. J. Queisser, J. Appl. Phys., 1961, 32, 510–519 CrossRef CAS.
- S. Rühle, Sol. Energy, 2016, 130, 139–147 CrossRef.
- J. J. S. Scragg, L. Choubrac, A. Lafond, T. Ericson and C. Platzer-Björkman, Appl. Phys. Lett., 2014, 104, 041911 CrossRef.
- S. Schorr, Sol. Energy Mater. Sol. Cells, 2011, 95, 1482–1488 CrossRef CAS.
- B. G. Mendis, M. D. Shannon, M. C. Goodman, J. D. Major, R. Claridge, D. P. Halliday and K. Durose, Prog. Photovoltaics, 2014, 22, 24–34 CAS.
- D. P. Halliday, R. Claridge, M. C. J. Goodman, B. G. Mendis, K. Durose and J. D. Major, J. Appl. Phys., 2013, 113, 223503 CrossRef.
- G. Rey, A. Redinger, J. Sendler, T. P. Weiss, M. Thevenin, M. Guennou, B. El Adib and S. Siebentritt, Appl. Phys. Lett., 2014, 105, 112106 CrossRef.
- J. J. S. S. Scragg, J. K. Larsen, M. Kumar, C. Persson, J. Sendler, S. Siebentritt and C. Platzer Björkman, Phys. Status Solidi, 2016, 253, 247–254 CrossRef CAS.
- S. Chen, A. Walsh, X.-G. Gong and S.-H. Wei, Adv. Mater., 2013, 25, 1522–1539 CrossRef CAS PubMed.
- K. Yu and E. A. Carter, Chem. Mater., 2016, 28, 4415–4420 CrossRef CAS.
- A. Redinger, D. M. Berg, P. J. Dale, N. Valle and S. Siebentritt, in 2011 37th IEEE Photovoltaic Specialists Conference, IEEE, 2011, pp. 000025–000025 Search PubMed.
- S. Chen, L. W. Wang, A. Walsh, X. G. Gong and S. H. Wei, Appl. Phys. Lett., 2012, 101, 223901 CrossRef.
- Y. S. Yee, B. Magyari-Köpe, Y. Nishi, S. F. Bent and B. M. Clemens, Phys. Rev. B: Condens. Matter Mater. Phys., 2015, 92, 195201 CrossRef.
- C. Frisk, T. Ericson, S.-Y. Li, P. Szaniawski, J. Olsson and C. Platzer-Björkman, Sol. Energy Mater. Sol. Cells, 2016, 144, 364–370 CrossRef CAS.
- M. Courel, J. A. Andrade-Arvizu and O. Vigil-Galán, Mater. Res. Express, 2016, 3, 095501 CrossRef.
- G. Sai Gautam, T. P. Senftle and E. A. Carter, Chem. Mater., 2018, 30, 4543–4555 CrossRef CAS.
- S. Kim, J. A. Márquez Prieto, T. Unold and A. Walsh, Energy Environ. Sci., 2020, 1–11 Search PubMed.
- P. Mangelis, A. Aziz, I. da Silva, R. Grau-Crespo, P. Vaqueiro and A. V Powell, Phys. Chem. Chem. Phys., 2019, 21, 19311–19317 RSC.
- C. Ma, H. Guo, K. Zhang, N. Yuan and J. Ding, Mater. Lett., 2017, 186, 390–393 CrossRef CAS.
- Z. Xu, Z. Guan, J. Yang and Q. Li, ACS Appl. Energy Mater., 2019, 2, 2779–2785 CrossRef CAS.
- Y. T. Hsieh, Q. Han, C. Jiang, T. Bin Song, H. Chen, L. Meng, H. Zhou and Y. Yang, Adv. Energy Mater., 2016, 6, 1–6 Search PubMed.
- G. Altamura, M. Wang and K. L. Choy, Sci. Rep., 2016, 6, 1–9 CrossRef PubMed.
- Y. Yang, L. Huang and D. Pan, ACS Appl. Mater. Interfaces, 2017, 9, 23878–23883 CrossRef CAS PubMed.
- H. Xin, S. M. Vorpahl, A. D. Collord, I. L. Braly, A. R. Uhl, B. W. Krueger, D. S. Ginger and H. W. Hillhouse, Phys. Chem. Chem. Phys., 2015, 17, 23859–23866 RSC.
- Z. Wang, N. Brodusch, R. Gauvin and G. P. Demopoulos, Nano Energy, 2018, 53, 130–134 CrossRef CAS.
- B. Liu, J. Guo, R. Hao, L. Wang, K. Gu, S. Sun and A. Aierken, Sol. Energy, 2020, 201, 219–226 CrossRef CAS.
- S. Grini, K. V. Sopiha, N. Ross, X. Liu, T. S. Bjørheim, C. Platzer-Björkman, C. Persson and L. Vines, Adv. Energy Mater., 2019, 9, 1900740 CrossRef.
- A. Mondal, C. Scheinert and J. G. Radich, ACS Appl. Energy Mater., 2019, 2, 250–259 CrossRef CAS.
- J. Kim, G. Y. Kim, T. T. T. Nguyen, S. Yoon, Y.-K. Kim, S.-Y. Lee, M. Kim, D.-H. Cho, Y.-D. Chung, J.-H. Lee, M.-J. Seong and W. Jo, Phys. Chem. Chem. Phys., 2020, 22, 7597–7605 RSC.
- W. Xiao, J. N. Wang, X. S. Zhao, J. W. Wang, G. J. Huang, L. Cheng, L. J. Jiang and L. G. Wang, Sol. Energy, 2015, 116, 125–132 CrossRef CAS.
- S. Berman, G. Sai Gautam and E. A. Carter, ACS Sustainable Chem. Eng., 2019, 7, 5792–5800 CrossRef CAS.
- M. Johnson, S. V. Baryshev, E. Thimsen, M. Manno, X. Zhang, I. V. Veryovkin, C. Leighton and E. S. Aydil, Energy Environ. Sci., 2014, 7, 1931–1938 RSC.
- R. Chen and C. Persson, J. Appl. Phys., 2017, 121, 203104 CrossRef.
- L. Weston and C. Stampfl, Phys. Rev. Mater., 2018, 2, 085407 CrossRef CAS.
- A. Karabulut, A. Sarilmaz, F. Ozel, İ. Orak and M. A. Şahinkaya, Curr. Appl. Phys., 2020, 20, 58–64 CrossRef.
- S. Hadke, S. Levcenko, G. Sai Gautam, C. J. Hages, J. A. Márquez, V. Izquierdo-Roca, E. A. Carter, T. Unold and L. H. Wong, Adv. Energy Mater., 2019, 9, 1902509 CrossRef CAS.
- X. Jia, H. Guo, C. Ma, K. Zhang, N. Yuan and J. Ding, Appl. Phys. Lett., 2017, 111, 1–5 Search PubMed.
- W. Wang, M. T. Winkler, O. Gunawan, T. Gokmen, T. K. Todorov, Y. Zhu and D. B. Mitzi, Adv. Energy Mater., 2014, 4, 1301465 CrossRef.
- A. Walsh, S. Chen, S. H. Wei and X. G. Gong, Adv. Energy Mater., 2012, 2, 400–409 CrossRef CAS.
- G. Kresse and J. Hafner, Phys. Rev. B: Condens. Matter Mater. Phys., 1993, 47, 558–561 CrossRef CAS PubMed.
- G. Kresse and J. Hafner, Phys. Rev. B: Condens. Matter Mater. Phys., 1994, 49, 14251–14269 CrossRef CAS PubMed.
- G. Kresse and J. Furthmüller, Phys. Rev. B: Condens. Matter Mater. Phys., 1996, 54, 11169–11186 CrossRef CAS PubMed.
- P. E. Blöchl, Phys. Rev. B: Condens. Matter Mater. Phys., 1994, 50, 17953–17979 CrossRef PubMed.
- G. Kresse and J. Hafner, J. Phys.: Condens. Matter, 1994, 6, 8245–8257 CrossRef CAS.
- J. Sun, A. Ruzsinszky and J. Perdew, Phys. Rev. Lett., 2015, 115, 036402 CrossRef PubMed.
- J. Heyd, G. E. Scuseria and M. Ernzerhof, J. Chem. Phys., 2003, 118, 8207–8215 CrossRef CAS.
- J. Heyd and G. E. Scuseria, J. Chem. Phys., 2004, 121, 1187–1192 CrossRef CAS PubMed.
- J. Heyd, G. E. Scuseria and M. Ernzerhof, J. Chem. Phys., 2006, 124, 219906 CrossRef.
- A. V. Krukau, O. A. Vydrov, A. F. Izmaylov and G. E. Scuseria, J. Chem. Phys., 2006, 125, 224106 CrossRef PubMed.
- J. P. Perdew, K. Burke and M. Ernzerhof, Phys. Rev. Lett., 1996, 77, 3865–3868 CrossRef CAS PubMed.
- N. J. Mosey and E. A. Carter, Phys. Rev. B: Condens. Matter Mater. Phys., 2007, 76, 155123 CrossRef.
- N. J. Mosey, P. Liao and E. A. Carter, J. Chem. Phys., 2008, 129, 014103 CrossRef PubMed.
- K. Yu and E. A. Carter, J. Chem. Phys., 2014, 140, 121105 CrossRef PubMed.
- S. L. Dudarev, G. A. Botton, S. Y. Savrasov, C. J. Humphreys and A. P. Sutton, Phys. Rev. B: Condens. Matter Mater. Phys., 1998, 57, 1505–1509 CrossRef CAS.
- B. G. Janesko, T. M. Henderson and G. E. Scuseria, Phys. Chem. Chem. Phys., 2009, 11, 443–454 RSC.
- T. M. Henderson, J. Paier and G. E. Scuseria, Phys. Status Solidi B, 2011, 248, 767–774 CrossRef CAS.
- W. P. Huhn and V. Blum, Phys. Rev. Mater., 2017, 1, 033803 CrossRef.
- A. J. Garza and G. E. Scuseria, J. Phys. Chem. Lett., 2016, 7, 4165–4170 CrossRef CAS PubMed.
- M. J. Lucero, T. M. Henderson and G. E. Scuseria, J. Phys.: Condens. Matter, 2012, 24, 145504 CrossRef CAS PubMed.
- J. Paier, M. Marsman, K. Hummer, G. Kresse, I. C. Gerber and J. G. Ángyán, J. Chem. Phys., 2006, 124, 154709 CrossRef CAS PubMed.
- M. Marsman, J. Paier, A. Stroppa and G. Kresse, J. Phys.: Condens. Matter, 2008, 20, 064201 CrossRef CAS PubMed.
- A. Jain, S. P. Ong, G. Hautier, W. Chen, W. D. Richards, S. Dacek, S. Cholia, D. Gunter, D. Skinner, G. Ceder and K. A. Persson, APL Mater., 2013, 1, 011002 CrossRef.
- R. B. Wexler, G. Sai Gautam and E. A. Carter, Phys. Rev. B: Condens. Matter Mater. Phys., 2020, 102, 054101 CrossRef CAS.
- S. P. Ong, W. D. Richards, A. Jain, G. Hautier, M. Kocher, S. Cholia, D. Gunter, V. L. Chevrier, K. A. Persson and G. Ceder, Comput. Mater. Sci., 2013, 68, 314–319 CrossRef CAS.
- A. Togo and I. Tanaka, Spglib: a software library for crystal symmetry search, 2018, pp. 1–11, https://arxiv.org/abs/1808.01590 (written at version 1.10.4) Search PubMed.
- E. Parthé, K. Yvon and R. H. Deitch, Acta Crystallogr., Sect. B: Struct. Crystallogr. Cryst. Chem., 1969, 25, 1164–1174 CrossRef.
- L. D. Gulay, Y. E. Romanyuk and O. V. Parasyuk, J. Alloys Compd., 2002, 347, 193–197 CrossRef CAS.
- J. W. Lekse, B. M. Leverett, C. H. Lake and J. A. Aitken, J. Solid State Chem., 2008, 181, 3217–3222 CrossRef CAS.
- M. Pandey and K. W. Jacobsen, Phys. Rev. Mater., 2018, 2, 105402 CrossRef CAS.
- X. Wang, J. Li, Z. Zhao, S. Huang and W. Xie, J. Appl. Phys., 2012, 112, 023701 CrossRef.
- J. He, Y. Guo, W. Huang, X. Zhang, J. Yao, T. Zhai and F. Huang, Inorg. Chem., 2018, 57, 9918–9924 CrossRef CAS PubMed.
- A. Babayigit, A. Ethirajan, M. Muller and B. Conings, Nat. Mater., 2016, 15, 247–251 CrossRef CAS PubMed.
- S. Ikegami, Sol. Cells, 1988, 23, 89–105 CrossRef CAS.
- S. P. Albright, J. F. Jordan, B. Ackerman and R. R. Chamberlin, Sol. Cells, 1989, 27, 77–90 CrossRef CAS.
- S. D. Hodgson, W. S. M. Brooks, A. J. Clayton, G. Kartopu, V. Barrioz and S. J. C. Irvine, Nano Energy, 2013, 2, 21–27 CrossRef CAS.
- G. Bergerhoff and I. D. Brown, Acta Crystallogr., Sect. A: Found. Crystallogr., 1981, 37, C342 CrossRef.
- J. Krustok, T. Raadik, X. Li, M. Kauk-Kuusik, K. Timmo, S. Oueslati and M. Grossberg, J. Phys. D: Appl. Phys., 2020, 53, 275102 CrossRef CAS.
- Y. Kumagai and F. Oba, Phys. Rev. B: Condens. Matter Mater. Phys., 2014, 89, 195205 CrossRef.
- M. Arrigoni and G. K. H. Madsen, The Spinney package, https://spinney.readthedocs.io/en/latest/, accessed 8 February 2021 Search PubMed.
- N. Saini, J. K. Larsen, K. V. Sopiha, J. Keller, N. Ross and C. Platzer Björkman, Phys. Status Solidi, 2019, 216, pssa.201900492 Search PubMed.
- S. Nakamura, T. Maeda and T. Wada, Jpn. J. Appl. Phys., 2010, 49, 121203 CrossRef.
- D. B. Khadka, S. Kim and J. Kim, J. Phys. Chem. C, 2016, 120, 4251–4258 CrossRef CAS.
- M. Neuschitzer, J. Marquez, S. Giraldo, M. Dimitrievska, M. Placidi, I. Forbes, V. Izquierdo-Roca, A. Pérez-Rodriguez and E. Saucedo, J. Phys. Chem. C, 2016, 120, 9661–9670 CrossRef CAS.
- S. Giraldo, E. Saucedo, M. Neuschitzer, F. Oliva, M. Placidi, X. Alcobé, V. Izquierdo-Roca, S. Kim, H. Tampo, H. Shibata, A. Pérez-Rodríguez and P. Pistor, Energy Environ. Sci., 2018, 11, 582–593 RSC.
- A. F. Moodie and H. J. Whitfield, Acta Crystallogr., 1986, B42, 236–247 CAS.
- S. Niedenzu, G. Gurieva and S. Schorr, Thin Solid Films, 2019, 669, 625–628 CrossRef CAS.
- S. Bag, O. Gunawan, T. Gokmen, Y. Zhu and D. B. Mitzi, Chem. Mater., 2012, 24, 4588–4593 CrossRef CAS.
- I. Kim, K. Kim, Y. Oh, K. Woo, G. Cao, S. Jeong and J. Moon, Chem. Mater., 2014, 26, 3957–3965 CrossRef CAS.
- C. J. Hages, S. Levcenco, C. K. Miskin, J. H. Alsmeier, D. Abou-Ras, R. G. Wilks, M. Bär, T. Unold and R. Agrawal, Prog. Photovoltaics, 2015, 23, 376–384 CAS.
- A. D. Collord and H. W. Hillhouse, Chem. Mater., 2016, 28, 2067–2073 CrossRef CAS.
- CRC Handbook of Chemistry and Physics, ed. J. R. Rumble, CRC Press, Taylor & Francis Group, 100th edn, 2019 Search PubMed.
- O. Kubaschewski and C. B. Alcock, Metallurgical Thermochemistry, Pergamon Press, 5th edn, 1959, vol. 12 Search PubMed.
- C. P. Heinrich, T. W. Day, W. G. Zeier, G. J. Snyder and W. Tremel, J. Am. Chem. Soc., 2014, 136, 442–448 CrossRef CAS PubMed.
- D. Chen and N. M. Ravindra, J. Alloys Compd., 2013, 579, 468–472 CrossRef CAS.
- D. B. Khadka and J. Kim, J. Phys. Chem. C, 2015, 119, 1706–1713 CrossRef CAS.
- Q. Yi, J. Wu, J. Zhao, H. Wang, J. Hu, X. Dai and G. Zou, ACS Appl. Mater. Interfaces, 2017, 9, 1602–1608 CrossRef CAS PubMed.
- H. Matsushita, T. Ichikawa and A. Katsui, J. Mater. Sci., 2005, 40, 2003–2005 CrossRef CAS.
- S. Chen, X. G. Gong, A. Walsh and S.-H. Wei, Appl. Phys. Lett., 2009, 94, 041903 CrossRef.
- S. Ahn, S. Jung, J. Gwak, A. Cho, K. Shin, K. Yoon, D. Park, H. Cheong and J. H. Yun, Appl. Phys. Lett., 2010, 97, 021905 CrossRef.
- L. Pauling, J. Am. Chem. Soc., 1932, 54, 3570–3582 CrossRef CAS.
- A. L. Allred, J. Inorg. Nucl. Chem., 1961, 17, 215–221 CrossRef CAS.
- J. Paier, R. Asahi, A. Nagoya and G. Kresse, Phys. Rev. B: Condens. Matter Mater. Phys., 2009, 79, 1–8 CrossRef.
- N. Sarmadian, R. Saniz, B. Partoens and D. Lamoen, J. Appl. Phys., 2016, 120, 085707 CrossRef.
- A. Crovetto, M. L. N. Palsgaard, T. Gunst, T. Markussen, K. Stokbro, M. Brandbyge and O. Hansen, Appl. Phys. Lett., 2017, 110, 083903 CrossRef.
- H. J. Gu, J.-H. Yang, S. Y. Chen, H. J. Xiang and X. G. Gong, APL Mater., 2019, 7, 091104 CrossRef.
- S. N. Hood, A. Walsh, C. Persson, K. Iordanidou, D. Huang, M. Kumar, Z. Jehl, M. Courel, J. Lauwaert and S. Lee, JPhys Energy, 2019, 1, 042004 CrossRef CAS.
- W. Xiao, J. N. Wang, J. W. Wang, G. J. Huang, L. Cheng, L. J. Jiang and L. G. Wang, Phys. Chem. Chem. Phys., 2016, 18, 12029–12034 RSC.
- R. D. Shannon, Acta Crystallogr., Sect. A: Cryst. Phys., Diffr., Theor. Gen. Crystallogr., 1976, 32, 751–767 CrossRef.
- M. A. Green, E. D. Dunlop, J. Hohl-Ebinger, M. Yoshita, N. Kopidakis and A. W. Y. Ho-Baillie, Prog. Photovoltaics, 2020, 28, 3–15 Search PubMed.
- E. H. Jung, N. J. Jeon, E. Y. Park, C. S. Moon, T. J. Shin, T.-Y. Yang, J. H. Noh and J. Seo, Nature, 2019, 567, 511–515 CrossRef CAS PubMed.
- Y. Zhang, X. Sun, P. Zhang, X. Yuan, F. Huang and W. Zhang, J. Appl. Phys., 2012, 111, 063709 CrossRef.
- M. G. Brik, O. V. Parasyuk, G. L. Myronchuk and I. V. Kityk, Mater. Chem. Phys., 2014, 147, 155–161 CrossRef CAS.
- E. G. Zhukov, S. A. Mkrtchyan, K. Dovletov, A. G. Melikdzhanyan, V. T. Kalinnikov and A. Ashirov, Russ. J. Inorg. Chem., 1984, 29, 1087–1088 Search PubMed.
- E. G. Zhukov, S. A. Mkrtchyan, K. Dovletov, A. G. Melikdzhanyan, V. T. Kalinnikov and A. Ashirov, Russ. J. Inorg. Chem., 1984, 29, 1897–1898 CAS.
- G. Y. Davydyuk, O. V. Parasyuk, Y. E. Romanyuk, S. A. Semenyuk, V. I. Zaremba, L. V. Piskach, J. J. Kozioł and V. O. Halka, J. Alloys Compd., 2002, 339, 40–45 CrossRef CAS.
- G. E. Davidyuk, O. V. Parasyuk, S. A. Semenyuk and Y. E. Romanyuk, Inorg. Mater., 2003, 39, 919–923 CrossRef CAS.
- M. G. Brik, I. V. Kityk, O. V. Parasyuk and G. L. Myronchuk, J. Phys.: Condens. Matter, 2013, 25, 505802 CrossRef CAS PubMed.
- H. Matsushita, T. Maeda, A. Katsui and T. Takizawa, J. Cryst. Growth, 2000, 208, 416–422 CrossRef CAS.
- M. Kauk-Kuusik, X. Li, M. Pilvet, K. Timmo, M. Grossberg, T. Raadik, M. Danilson, V. Mikli, M. Altosaar, J. Krustok and J. Raudoja, Thin Solid Films, 2018, 666, 15–19 CrossRef CAS.
- J. Krustok, T. Raadik, R. Kaupmees, M. Grossberg, M. Kauk-Kuusik, K. Timmo and A. Mere, J. Phys. D: Appl. Phys., 2019, 52, 285102 CrossRef CAS.
- M. Singh, T. R. Rana and J. H. Kim, J. Alloys Compd., 2016, 675, 370–376 CrossRef CAS.
- L. Pauling, The Nature of the Chemical Bond and the Structure of Molecules and Crystals: An Introduction to Modern Structural Chemistry, Cornell University Press, Ithaca, 3rd edn, 1960 Search PubMed.
- S. Kim, J. S. Park and A. Walsh, ACS Energy Lett., 2018, 3, 496–500 CrossRef CAS.
- O. V. Parasyuk, L. V. Piskach, Y. E. Romanyuk, I. D. Olekseyuk, V. I. Zaremba and V. I. Pekhnyo, J. Alloys Compd., 2005, 397, 85–94 CrossRef CAS.
- G. M. Ford, Q. Guo, R. Agrawal and H. W. Hillhouse, Chem. Mater., 2011, 23, 2626–2629 CrossRef CAS.
- C. Wang, S. Chen, J. H. Yang, L. Lang, H. J. Xiang, X. G. Gong, A. Walsh and S. H. Wei, Chem. Mater., 2014, 26, 3411–3417 CrossRef CAS.
- United States Environmental Protection Agency, Radioactive Decay, https://www.epa.gov/radiation/radioactive-decay, accessed 27 April 2020 Search PubMed.
- The European Parliament and The Council of the European Union, Off. J. Eur. Communities: Inf. Not.munities: Legis., 2011, 54, 88–110 Search PubMed.
Footnotes |
| † Electronic supplementary information (ESI) available: Further details about the effect of Mg- and Si-substitution on CZTS; stability of CCdGSSe against phase separation and decomposition; lowest energy ionic configurations for bulk structures of Ge-substituted CZTS and Cd- and Se-substituted CZGS; polymorph stability for quaternary chalcogenides containing Zn; defect generation protocol; ICSD bulk structures; stability of individual point defects vs. clusters; chemical potential limits for CZGSSe and CCdGSSe; lowest energy defect configurations of Ge-substituted CZTS and Cd- and Se-substituted CZGS; effect of Cd- and Se-substitution on the concentration of recombination centers in CZGS; influence of anion order in CCdGSSe on CuCd + CdCu formation energies; intrinsic stability/instability of CTZS/CZGS-based compounds; experimental band gaps of Cu2CdGeS4 and Cu2CdGeSe4 and predicted defect formation energies for Cu2CdGeS3Se and Cu2CdGeS2Se2; and formation energy of anion vacancies in CCdGSSe. See DOI: 10.1039/d0ta11603c |
| ‡ Current address: Department of Materials Engineering, Indian Institute of Science, Bengaluru, Karnataka 560012, India. |
| This journal is © The Royal Society of Chemistry 2021 |