 Open Access Article
Creative Commons Attribution 3.0 Unported Licence
Fast lithium-ion conductivity in the ‘empty-perovskite’ n = 2 Ruddlesden–Popper-type oxysulphide Y2Ti2S2O5†
Kit
McColl‡
 and
Furio
Corà
 *
*
Department of Chemistry, UCL, London, WC1H 0AJ, UK. E-mail: f.cora@ucl.ac.uk
First published on 18th February 2021
Abstract
Materials with Wadsley–Roth (W–R) crystallographic shear and bronze-type structures display fast lithium (Li)-ion diffusion and are of interest as anode materials for high-power Li-ion batteries. Here we use density-functional-theory calculations to investigate Y2Ti2S2O5, a Li-ion anode material that shares structural features with W–R phases. Y2Ti2S2O5 is a layered Ruddlesden–Popper-type oxysulphide displaying a reversible capacity of 128 mA h g−1, with 60% capacity-retention at a charge rate of 20C in micrometer-sized electrode particles. The crystal structure contains an empty central layer of corner-sharing [TiO5S] octahedra, equivalent to a (∞ × ∞ × 2) block of the ReO3-like units that form Wadsley–Roth type phases. Intercalated Li+ ions on this plane occupy distorted ‘rectangular-planar’ sites, and display 2D mobility with single-ion hopping barriers of 64 meV under dilute conditions. The insertion geometry of Li+ is highly frustrated, giving rise to a smooth potential energy surface for Li-hopping and exceptionally low activation barriers. The [TiO5S] units do not experience major distortions or correlated rotations during discharge, due to framework rigidity provided by [Y2S2]2+ rocksalt slabs, meaning the rectangular-planar-like geometry of Li+ is retained across all states of charge. A tetragonal to orthorhombic to tetragonal phase change occurs upon lithiation, with a stable Li+ ordering at x = 1.0 in LixY2Ti2S2O5. Li+–Li+ repulsion has a significant effect on the cation ordering at all Li intercalation levels. Na+ hopping barriers are >1.7 eV, while Mg2+ ions can move with barriers of ∼607 meV, illustrating the how diffusion behaviour varies for ions of different size and charge within W–R-type frameworks. The exceptionally low activation barriers for Li-hopping and well-defined, rigid 2D diffusion plane makes Y2Ti2S2O5 a valuable model system within which to understand Li+ behaviour in high-rate electrode materials, such as the related Wadsley–Roth phases.
Introduction
Next-generation lithium (Li)-ion batteries with fast charging and discharging times are required for improved performance of electric vehicles,1,2 and to aid load-smoothing for smart energy grids,3 Current Li-ion battery technology employs layered carbonaceous graphite anodes which are cheap and have long cycle-life.4,5 However, graphite anodes are poorly suited for high-power applications due to the formation of dendrites and other unwanted side reactions at high (dis)charge rates that can result in catastrophic battery failure.6,7Crystalline transition metal oxides (TMOs) such as spinel Li4Ti5O12 (LTO) are alternative anode materials to graphite and offer improved safety properties in high power applications, able to sustain higher rates without dendrite formation.8–11 Improved Li diffusion rates in crystalline TMOs are sought to achieve higher power densities. Higher diffusion rates can be achieved by nanosizing anode particles to shorten the diffusion lengths required to lithiate an entire anode material particle.2 Such approaches have been successful in LTO,12 but come at the cost of more complex synthesis, increased surface area causing faster degradation, and lower packing density.2 The use of crystalline TMOs with intrinsically fast Li diffusion is therefore favourable for high power applications.
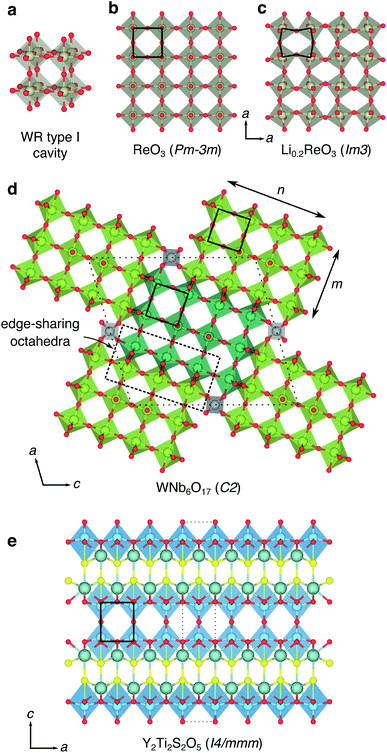
Recently, rapid lithium mobility has been identified in a selection of niobium-based complex oxides with open framework structures, including H- and T-Nb2O5,13–15 TiNb2O7,16 Nb16W5O55 and Nb18W16O93,17 PNb9O25 and VNb9O25 (ref. 18) and Nb18W8O69.19 High charging and discharging rates can be achieved in many of these materials even in large, micrometer-sized particles. They display low voltage vs. Li/Li+ and as such, they are of interest as high-rate Li-ion anode materials. These materials have Wadsley–Roth (W–R) crystallographic shear, or structurally-related bronze-type frameworks (Fig. 1),20 and their structural chemistry is thought to be key to the exceptional rate performance they display.
The structural units of the W–R-type phases were classified by Cava et al., who identified six types of cavities within the frameworks.21 The basic building block is a cage-like unit, derived from the structure of cubic ReO3, consisting of four [MO6] octahedra sharing corners in a (2 × 2 × 2) block, and defined by Cava et al. as a type I cavity (Fig. 1a and b). Type II cavities are found at shear-planes, when a ReO3-like unit is ‘capped’ by a pair of octahedra, edge-sharing with the block (Fig. 1d). Type III–VI cavities consist of more complex arrangements of polyhedra, and can include tetrahedrally-coordinated framework cations.21
The ‘empty-perovskite’, cubic ReO3 is the simplest structure that can be formed from the W–R-type units defined by Cava et al., constructed from only type I cavities, and is a model system for Li-ion intercalation in W–R-type materials (Fig. 1a and b). Li-ions can be introduced into the open cavities of ReO3 and under dilute conditions they move with low activation barriers, leaving the framework relatively undisturbed.22 However, progressive intercalation of Li+ causes correlated rotations of the corner-sharing octahedra (Fig. 1c) and a loss of the cubic framework, greatly increasing activation barriers and eventually leading to structural degradation on cycling.23–25 Similar distortions and structural degradation are observed upon lithiation of the corner-sharing-octahedra frameworks of WO3 (ref. 26) and NbO2F.27
More complex W–R crystallographic shear phases are formed of n × m blocks of corner-sharing octahedra that meet at shear planes, and extend infinitely in columns along the periodic direction normal to the n × m plane (Fig. 1d).20,21,28 These block-edges and corners contain edge-sharing octahedra units that form W–R cavities assigned the designations type II–VI by Cava et al.21 The edge-sharing units bestow structural rigidity, so that the W–R framework does not relax significantly during intercalation.14,17,21,29 This structural property is key to their performance in battery applications, and means the low activation barriers for Li diffusion are retained across different states of charge, leading to exceptional charging and discharging rates.14,17,19
Computational and experimental studies have revealed that Li diffusion is very fast down the centre of the columns in W–R phases, where type I, II or III cavities are linked through corners of their constituent octahedra. However, the diffusion is slower into ‘pocket’-like sites at block edges formed by the corner-sharing motifs of type II and III cavities.19,29 Furthermore, Li-ion hopping is inhibited between blocks in W–R phases, leading to effectively 1D diffusion down the columns.29,30
The implications are thus; whilst shear planes provide structural rigidity that is key to the high Li-ion diffusion across different states of charge, they also restrict Li-ion mobility to 1D channels and introduce sites which Li-ions are slower to transfer in and out of. An ideal W–R-type structure for fast Li-ion diffusion would have 2D or 3D Li-ion connectivity and would contain diffusion pathways through structural units that are connected by corner-sharing octahedra only, whilst retaining framework rigidity.
Y2Ti2S2O5 is a complex layered material, based upon the n = 2 Ruddlesden–Popper (R–P) framework (Fig. 1e).31–33 In a conventional R–P phase, with stoichiometry An+1BnO3n+1 (for n ≥ 2), the corner-sharing framework of octahedra in the ‘perovskite’ layers would be occupied by 12-coordinate A-site cations. In Y2Ti2S2O5, these units are empty, leaving a 2D plane of ‘ReO3-like’ type I Wadsley–Roth cavities into which Li+, Na+ and Mg2+ ions can be intercalated.34–38 Rocksalt-type layers between the type I cavities provide structural rigidity that prevents the correlated distortions observed in ReO3. No type II, or higher classification W–R cavities are present; the structure into which Li intercalation takes place contains only type I units, but with 2D connectivity, rather than the 3D connectivity in ReO3.
Y2Ti2S2O5 has been investigated as a anode material for a Li-ion battery, and has a low average intercalation voltage for Li+ of +0.84 V vs. Li/Li+.38 The structure can accommodate 2 Li+ per formula unit, resulting in a theoretical capacity of 128 mA h g−1. This can be reversibly achieved over 30 cycles in 1.9 mm electrodes, with a small first-cycle hysteresis. High-rate performance is displayed, with 78% capacity retention at 10C and 60% at 20C for carbon-free electrodes containing 30 μm-thick Y2Ti2S2O5 particles.38 Neutron diffraction experiments indicate that inserted Li+ ions occupy approximately square-planar ‘window’ sites in the 2D plane.37 This is a similar insertion environment to those identified for Li+ in the high-rate Wadsley–Roth-type phases from DFT calculations,29,30 suggesting that similar mechanisms are responsible for activating high Li+ mobility in both types of materials.
In this work we use density-functional-theory (DFT) calculations to investigate behaviour of Li+, Na+ and Mg2+ within Y2Ti2S2O5. We begin by detailing the structure of the pristine phase. We then examine Li+ intercalation and mobility at dilute concentrations, and Li-ordering at different levels of intercalation. Next, we compare the behaviour of Li+ with Na+ and Mg2+. Subsequently, we investigate the electronic structure of the pristine material. Finally, we discuss the structure–property relationships in LixY2Ti2S2O5, how the Li-ion diffusion properties could be modified through doping or chemical substitution, and the relevance of the results in relation to other fast Li-ion conducting anode materials such as the Wadsley–Roth phases.
Computational methods
First-principles calculations were performed using the periodic density-functional-theory (DFT) code CRYSTAL17.39 The performance of a range of different functionals was tested (ESI†). For the majority of results presented in this work, electronic exchange and correlation were approximated using the PBEsol functional.40 Electronic structure properties (electronic density of states and band structure) were obtained by fully relaxing the structure using the screened hybrid-exchange functional HSE06,41,42 with Grimme's semiclassical D3 correction.43 Details of structural properties and bandgaps obtained using other functionals are provided in the ESI.† Atom-centered Gaussian basis sets were used for all atoms, available from the CRYSTAL online database (www.crystal.unito.it), with the online label indicated in the ESI.† All-electron basis sets were used to describe the following atoms: Ti, S, O, Li, Na and Mg. An effective core pseudopotential was used for the Y atom. The Coulomb and exchange series were truncated with thresholds of 10−7, 10−7, 10−7, 10−7 and 10−14.44 Reciprocal space was sampled using a Pack–Monkhorst net,45 with a shrinking factor of IS = 8 along each periodic direction, for a total of 75 k-points in the irreducible Brillouin zone of the primitive cell of Y2Ti2S2O5. Modified k-point grids were used for supercell calculations to ensure a consistent sampling of reciprocal space. The self-consistent field (SCF) procedure was performed up to a convergence threshold of ΔE = 10−7 hartree per unit cell. Full geometry optimizations (lattice parameters and atomic positions) were performed using the default convergence criteria in CRYSTAL17. Li+, Na+ and Mg2+ mobility was examined in a (2 × 2 × 1) expansion of the crystallographic unit cell, ensuring a distance of >7 Å between periodic images. Activation barriers for ionic migration were determined using constrained geometry optimisations, with full details of the procedure described in the ESI.†46,47 Li-orderings during intercalation were examined by considering all symmetry-inequivalent configurations in (1 × 1 × 1) and ( ) expansions of the crystallographic unit cell.48 Intercalation voltages, V, were computed using the Nernst equation, which is given by: V = −ΔGzF where ΔG is the Gibbs free energy change, F is the Faraday constant and z is the charge transferred. Under the calculation conditions, 0 K and zero pressure, the Gibbs free energy change is equivalent to the internal energy, ΔG = ΔE. The intercalation voltages were therefore computed as:
 | (1) |
Lattice-gas Monte-Carlo simulations were run using the Python lattice_mc code.50,51 A model of the sites that Li can occupy in the (001) plane of LixY2Ti2S2O5 was constructed, employing a square 2-dimensional unit cell with lattice parameter a = 3.76 Å and two equivalent sites labelled A and B with fractional coordinates [0, 0] and [0.5, 0.5]. A 12 × 12 expansion of the unit cell was taken, for a total of 288 sites, and a network was formed, each site was connected to its 4 nearest neighbours of opposite type only. Mobile particles were distributed randomly across the 288 sites and simulations were performed across the full range of possible lithium stoichiometry, from a single particle on the lattice to a single vacancy. Double-occupancy of sites was forbidden, all sites were set to have equal energy, and the interaction between particles was modelled using a nearest-neighbour energy term only, of n × kBT where n = 0, 1, 2, 3 and 4. Simulations were run using a Metropolis–Hastings Monte-Carlo algorithm for 1000 equilibration steps, followed by 10![[thin space (1/6-em)]](https://www.rsc.org/images/entities/char_2009.gif) 000 production steps, and results were averaged over 5000 simulations to obtain good statistics.
000 production steps, and results were averaged over 5000 simulations to obtain good statistics.
Results and discussion
Crystal structure of Y2Ti2S2O5
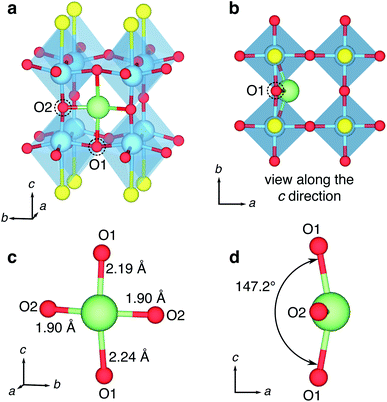
Tetragonal Y2Ti2S2O5 can be described as an A-site cation-defective n = 2 Ruddlesden–Popper (R–P) structure, formed of [Y2S2]2+ rocksalt and empty [Ti2O5]2− slabs layered in the c crystallographic direction (Fig. 2a). The crystallographic unit cell (space group I4/mmm, no. 139) contains five symmetry unique atoms; one of each Y, Ti and S and two symmetry unique O atoms, denoted O1 and O2. The Ti-rich layers comprise pairs of [TiO5] square pyramids, inverted with respect to each other and sharing an O2-ion across their peak. The Ti-ions are also linked through O1-ions at the corners of their pyramid base, forming a square lattice when the structure is viewed along the c direction (Fig. 2b). The Y atoms in the rocksalt layers are nine-fold coordinate, through four Y–O1 bonds and four Y–S bonds to anions in the same layer, and one longer Y–S′ bond ‘across’ the rocksalt layers to the adjacent layer (Fig. 2c).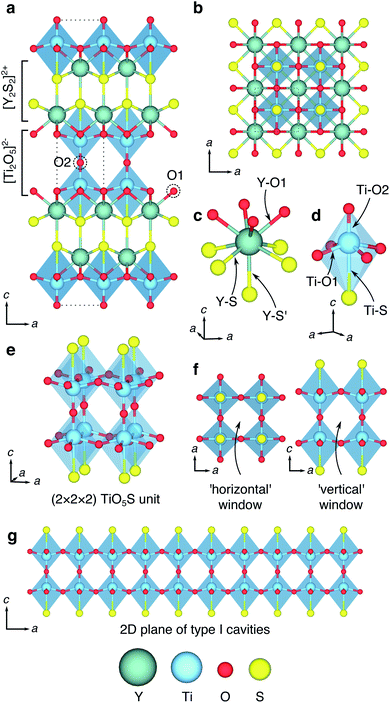 | ||
| Fig. 2 Crystal structure of Y2Ti2S2O5. The tetragonal crystallographic unit cell of Y2Ti2S2O5, viewed along (a) the a direction and (b) the c direction. The dotted line shows a unit cell. The coordination environment of (c) Y atoms and (d) Ti atoms. (e) Structure of the empty ReO3-like central channel, formed of (2 × 2 × 2) octahedra corner-sharing [TiO5S] units, related to the type I Wadsley–Roth cavities first designated by Cava et al.21 (f) Shape of the ‘horizontal’ and ‘vertical’ windows. (g) Illustration of the empty 2D central plane of [TiO5S] type I cavities for intercalation. | ||
In an alternative interpretation of the structure, the Ti ions can be considered to be is a highly distorted octahedral [TiO5S] coordination, with a long interatomic distance (2.87 Å) to a single S atom neighbour at the ‘base’ of the octahedron (Fig. 2d). When assessed in this way the [TiO5S] units form a (2 × 2 × 2) cage (Fig. 2e) that can be related to the ReO3-like type I cavity describe by Cava et al. in Wadsley–Roth type phases (Fig. 1).21 The ReO3-like cavity is tetragonally elongated by the distortions to the Ti octahedra in the c direction. As a result, the shapes of the ‘horizontal’ and ‘vertical’ windows are different (Fig. 2f). The square ‘horizontal’ window defined by four O1 ions has a width of 3.75 Å, corresponding to the a lattice parameter. The rectangular ‘vertical’ windows are defined by two O1 ions and two O2 ions, have a width of a and a height of 4.57 Å (from O1 to O1). The position of the [Y2S2]2+ rocksalt slabs means that type I cavities of TiO5S units in subsequent layers in the c direction are offset from each other, in an AB stacking regime. The Ti–O–S layers form a (∞ × ∞ × 1) slab of Wadsley–Roth type I cavities in the (001) plane (Fig. 2g).
Table S1† reports the crystal structural parameters and bandgap for Y2Ti2S2O5 calculated using a range of different functionals, with and without dispersion corrections. Dispersion compresses the structure, with the greatest change along the c direction, normal to the plane of the layers. Most heavily affected by the dispersion correction are the Y–S bonds between the layers, which contract by 0.13 Å (Table S2†), indicating that dispersion forces make a non-negligible contribution to the bonding between the layers.
The hybrid-exchange functionals B3LYP (20% Hartree–Fock (HF) exchange) and PBE0 (25% HF-exchange), give bandgaps of 2.45 eV and 2.85 eV respectively. Both hybrid functionals overestimate the experimentally-reported bandgap of 1.9 eV–2.0 eV.33,52 PBE finds a bandgap of 1.08 eV, underestimated with respect to experiment. The bandgap calculated with HSE06 is 2.16 eV, close to the value reported from experiment. The PBEsol functional was chosen for the calculation of structural and energetic properties, since it gives a good representation of the crystal structure, with small errors relative to experiment.
Li+ intercalation and mobility under dilute conditions
Our DFT investigation of Li+ insertion began at dilute Li+ concentrations, considering a single Li+ ion in a (2 × 2 × 1) expansion of the crystallographic unit cell, composed of 88 host ions, corresponding to a stoichiometry of Li0.125Y2Ti2S2O5. The stable location for a Li+ ion under these conditions is in a site close to a vertical ‘window’ (Fig. 3a). The Li-ion does not occupy the centre of the type I cavity, consistent with experiment.37 Li+ ions introduced into the horizontal windows migrated to the vertical windows.
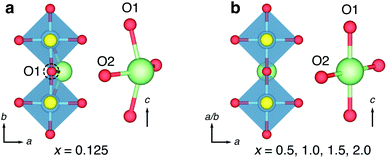
The Li+ ions adopt a four-fold coordinated geometry, that is best described as distorted ‘rectangular-near-planar’. Rather than sitting in an perfectly planar site flush in the ‘window’, directly in line with a O1 ion when the structure is viewed along the c direction, the Li+ is displaced slightly into the type I cavity (Fig. 3b). The Li+ ion binds to two O1 ions along the c direction with distances of 2.19 Å and 2.24 Å, and two O2 ions along the [001] plane of 1.90 Å (Fig. 3c). The distortion from a planar geometry is highlighted by the angle of the O1–Li–O1 bond along the c direction of 147.2° (Fig. 3d). Neutron diffraction experiments by Hyett et al. identified the Li-ion insertion sites as approximately ‘square-planar’, with large anisotropic displacement ellipsoids normal to the plane of the window.37 The computational results presented here clarify that the equilibrium position for the Li-ions at 0 K is displaced slightly into the cavity, into the distorted ‘rectangular-near-planar’ sites. The distortion has important implications for the Li-ion potential energy surface, which are discussed later.
The displacement of the Li+-ion into the type I cavity in Y2Ti2S2O5 arises from the size and shape of the vertical ‘window’ site. The window is too narrow along the a direction to accommodate the Li perfectly, and it is ‘squeezed’ slightly into the cavity. A bond-valence sum calculation gives a value of Vi = 0.88 when the Li+ ion is located in a planar rectangular site in the window. In contrast a value of Vi = 0.99 is found when the Li+ ion is in the optimised position slightly into the cage.
Similar four-coordinate distorted square-planar-like Li+ insertion geometry in ‘window’ positions has been reported from DFT calculations for selected sites within the Wadsley–Roth-type Nb–W–O bronzes29,53 and TiNb2O7,30 as well as in cubic ReO3 under dilute conditions.22 It is notable that a square- or rectangular-planar-like arrangement is an unusual geometry for Li+. An ideal four-fold coordination for the stabilisation of an ion from a set of point charges is tetrahedral geometry, and whilst three-coordinate trigonal-planar Li+ is described in KLiO,54 and a range of five-fold coordination environments are know, four-fold geometry such as square-planar is not discussed in reviews of Li+ coordination chemistry in crystals.55,56
Despite the distorted rectangular-near-planar site being a global minimum on the 0 K potential energy surface at this low level of lithiation, the Li+ ions can be described as having a highly ‘frustrated’ coordination. The insertion geometry of the Li+ ions is destabilised, in comparison to tetrahedral or octahedral geometries that are more commonly observed. ‘Frustrated’ coordination typically results in lower activation barriers for ion-hopping, since the destabilisation reduces the difference in energy between the initial site and the transition state.57 The use of structures with ‘frustrated’ coordination has been proposed to improve ionic mobility for Li+ and multivalent battery cathode materials.58,59
Table 1 reports the crystal structure parameters for LixY2Ti2S2O5 structures. Under dilute conditions of x = 0.125 the structure displays a slight orthorhombic distortion, with an expansion of the b lattice parameter by +0.3%. The structure also experiences a slight contraction of the c lattice parameter, by −0.9%.
| x | Method | Crystal system | a (Å) | b (Å) | c (Å) | Vol (Å3) |
|---|---|---|---|---|---|---|
| 0 | Expt37 | Tetragonal | 3.770 | 22.806 | 324.06 | |
| DFT | 3.759 (−0.3%) | 22.726 (−0.4%) | 321.18 (−0.9%) | |||
| 0.125 | DFT | Orthorhombic | 3.770 | 3.781 | 22.605 | 322.18 |
| 0.5 | DFT | Orthorhombic | 3.796 | 3.856 | 22.267 | 325.89 |
| 0.99 | Expt37 | Orthorhombic | 3.832 | 3.919 | 22.301 | 334.88 |
| 1.00 | DFT | 3.842 (0.3%) | 3.911 (−0.2%) | 21.879 (−1.9%) | 328.75 (−1.8%) | |
| 1.52 | Expt37 | Tetragonal | 3.918 | 22.065 | 338.77 | |
| 1.50 | DFT | 3.927 (0.2%) | 21.541 (−2.4%) | 332.13 (−2.0%) | ||
| 1.85 | Expt37 | Tetragonal | 3.943 | 21.958 | 341.31 | |
| 2.00 | DFT | 3.952 (0.2%) | 21.372 (−2.7%) | 333.77 (−2.2%) |
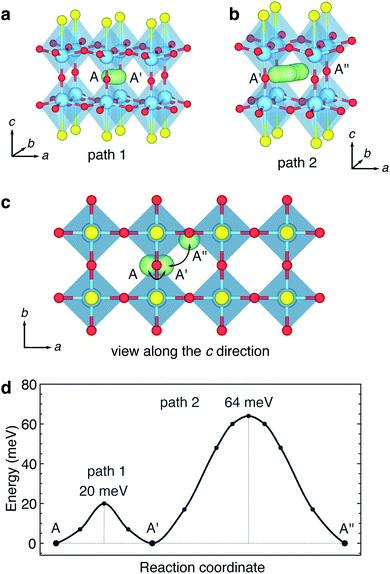
The hopping barriers for paths 1 and 2 are shown in Fig. 4d. The activation barrier for the ‘rattling’ path 1 is 20 meV, and for path 2 the barrier is 64 meV. Comparatively low barriers have been reported from DFT calculations for similar hopping and rattling pathways in the Nb–W–O bronzes.29 These values are amongst the lowest single-ion hopping barriers reported for Li+ diffusion in an electrode or electrolyte materials. For comparison, activation barriers for single-ion hopping in the high-rate LiMn2O4 spinel cathode material are around 300 meV–400 meV,60,61 and barriers of 150 meV–300 meV are found in ‘superionic’ Li+-ion conducting electrolytes.62,63
The very low activation barrier for the ‘rattling’ path 1 of 20 meV is consistent with neutron diffraction results presented by Hyett et al.37 They reported highly elongated anisotropic displacement ellipsoids for the refined positions of Li+ ions occupying approximately square-planar ‘window’ sites within Y2Ti2S2O5 for data collected at 298 K. The equilibrium geometry of Li at 0 K is slightly within the cavity. However, the activation barrier of 20 meV is below kT at 298 K (25.7 meV), thus a rattling motion of Li+ ions along path 1 is expected to occur under ambient conditions. Although Li+ diffusion in Y2Ti2S2O5 will be heavily affected by correlated ion-hopping and ordering at non-dilute Li+ concentrations, the low activation barriers at dilute concentrations suggests that the lithium diffusion will be rapid across different states of charge. The low activation barriers are therefore consistent with the results of Oki and Takagi, who report high discharge rates of 1C–20C in 30 μm-size particles with excellent capacity retention.38
Ground state hull structures of LixY2Ti2S2O5
Reports of chemical37 and electrochemical38 lithiation of Y2Ti2S2O5 exist in the literature. Electrochemical lithiation of Y2Ti2S2O5vs. Li/Li+ results in a sloping voltage curve with two distinct steps at x = 1.0 and x = 1.5.38 Neutron diffraction experiments show that LixY2Ti2S2O5 remains tetragonal during the initial stages of chemical Li+ intercalation. At x ≈ 1, a orthorhombic distortion and an ordering of Li+ ions in parallel windows in the b direction is observed. The orthorhombic Li+ ordering at x = 1.0 corresponds to the step in the voltage profile at x = 1.0.37,38 The tetragonal structure is recovered when x > 1.52.37 In this section, we investigate structural changes and Li-orderings during the lithiation process between 0 ≤ x ≤ 2.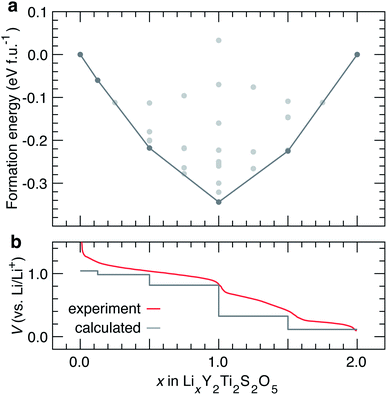 | ||
| Fig. 6 (a) Convex hull for Li intercalation in LixY2Ti2S2O5 between 0 ≤ x ≤ 2. The structures along the ground state hull are reported in Table 1. (b) Corresponding calculated voltage curve, compared against the experimental voltage curve reported by Oki and Tagaki.38 | ||
The experimental voltage curve is gently sloping in profile, with three distinct sloped regions separated by small and slightly softened, but distinct voltage drops at x = 1.0 and x = 1.5. The calculated voltage curve captures the clear step at x = 1.0, and a step at x = 1.5. A number of structures are calculated close to the ground state hull and may be accessible at finite temperatures. Since intercalation occurs in smooth solid-solution mechanism, a finer evaluation of the voltage curve at varying x would require cluster-expansion-based Monte Carlo simulations.
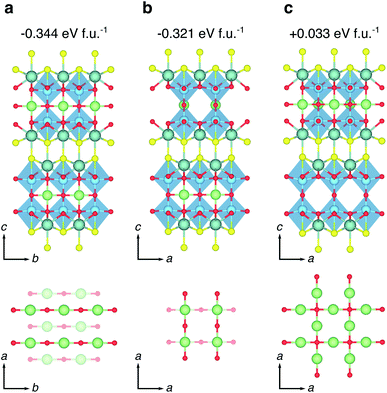 | ||
| Fig. 7 High-symmetry Li orderings at x = 1.0 in LixY2Ti2S2O5. (a) The ground state orthorhombic phase with Li-ions stacked AB, all forming bonds to O2 ions along the b direction. The lattice parameters of this structure are reported in Table 1. (b) A low-energy tetragonal phase obtained from an AA stacking of Li-ions, with Li on one plane forming bonds to O2 ions along the a direction, and Li on the next plane forming bonds to O2 ions along the b direction. (c) A high-energy tetragonal phase obtained from Li ions filling all sites on the same 2D plane, with the next plane empty. The reported energies are formation energies, calculated relative to the endmembers at x = 0 and x = 2. | ||
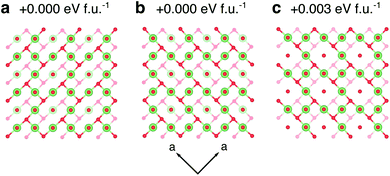 | ||
| Fig. 8 Li orderings in the structure at x = 1.5. (a) and (b) are two symmetry-inequivalent ground-state orderings on the hull. The lattice parameters of (a) and (b) are similar, and the values for (a) are reported in Table 1. (c) A ordering of Li-ions that is +0.003 eV per f.u. above the hull. Solid and transparent units indicate atoms that are offset by one layer in the c direction. | ||
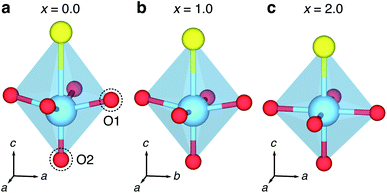 | ||
| Fig. 10 Changing geometry of TiO5S octahedra at different levels of lithiation. (a) Distorted TiO5S units, with an off-centring of Ti along the c direction at x = 0, forming a short Ti–O2 bond, and a long Ti–S interatomic distance, and four equal Ti–O1 bonds. (b) Increasing lithiation to x = 1.0 reduces the distortion in the c direction and causes a orthorhombic distortion, resulting in extended Ti–O1 bonds along the b direction. (c) Full intercalation at x = 2.0 returns the structure to tetragonal and reduces the distortion along the c direction, and no off-centring of Ti. The corresponding Ti–O and Ti–S bond and interatomic distances are reported in Table S3.† | ||
Na+ intercalation and mobility
A limiting factor in the development of batteries based upon intercalation of group I and II metals beyond lithium, is the slow ionic mobility of many of these species (i.e., Na+, Mg2+) in electrode or electrolyte materials.64 Understanding the structural features of materials that give rise to high or low ionic mobility for ions of different size and charge will help guide the design of new materials.59 In this section, we examine the intercalation and mobility of Na+ in Y2Ti2S2O5, and compare its behaviour with that of Li+.The intercalation of sodium ions can be achieved into two different positions within the Y2Ti2S2O5 lattice, depending on thermodynamic or kinetic reaction control.34 At elevated temperatures (600 °C), thermodynamic control results in the insertion of sodium into the vacant 12-coordinate A sites in the type I cavities, producing α-NaY2Ti2O5S2.35 At or below 200 °C, sodium insertion produces β-NaY2Ti2O5S2 where the sodium cations insert into the interlayer space between the [Y2S2]+ rocksalt slabs, and adopt tetrahedral sites. If β-NaY2Ti2O5S2 is heated to 600 °C, α-NaY2Ti2O5S2 is produced.
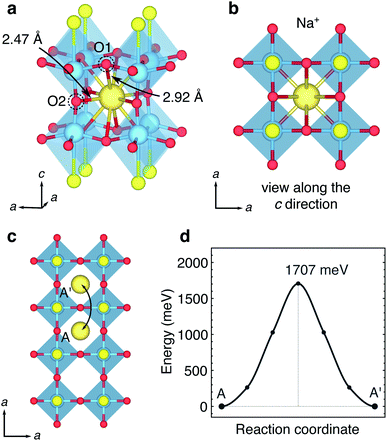
Fig. 11 shows the calculated geometry of a Na+ ion in the central layer at a stoichiometry of (α)-Na0.125Y2Ti2S2O5. The Na+ ion occupies the centre of the type I cavity, in a 12-coordinate environment to four O2 ions in the (001) plane with distances of 2.47 Å, and eight O1 ions with distances of 2.91 Å (Fig. 11a). The insertion of Na causes a small expansion of the unit cell in the (001) plane of 0.3%, retaining the tetragonal symmetry, and a small contraction of the c lattice parameter of −0.4%, consistent with observations from experiment.35
There is one hopping pathway that Na can take, from a 12-coordinate site through a ‘window’ to an equivalent site in the next type I cavity. The path is shown in Fig. 11c, and the activation barrier, shown in Fig. 11d, is 1.7 eV. The transition state geometry is a four-fold rectangular-planar coordination, with two Na–O1 distances of 2.15 Å and two Na–O2 distances of 2.09 Å. The high activation barrier is a result of the large size of Na; in the 12-coordinate A site within the type I cavities the large Na ion is stable and in a deep well on the potential energy surface, whereas the transition state represents a highly unstable geometry.
Our observation of a very high activation barrier for Na hopping between the type I cavity sites is consistent with the kinetic and thermodynamic control products α and β-NaY2Ti2O5S2 reported from experiment.34 It can be expected that sodium intercalation will take place more easily within the rocksalt layers, where the activation barriers will be relatively low due to the weak electrostatic interaction between the mobile Na ion and S ions of the rocksalt framework. However the product of this favourable intercalation pathway, β-NaY2Ti2O5S2, is metastable with respect to the α-NaY2Ti2O5S2 phase, which is thermodynamically preferred due to the stable position of the Na ions in 12 coordinate sites within the type I cavities.
It is interesting to note that K+ ions, which have a larger radius than Na+, can be intercalated between the [Y2S2]2+ rocksalt-type layers to form KY2Ti2S2O5, but cannot be inserted into the cages.36 We hypothesise that K+ may be thermodynamically stable located in the 12-coordinate site within the type I cavities, but its large size means that the ionic hop through the cage window requires an energy barrier that is too high to overcome, and incorporation between the rocksalt slabs is always the observed reaction pathway. Between the layers, K+ ions adopt 8-fold coordinated rectangular cuboidal geometry, in contrast to the tetrahedral geometry observed for Na+ ions in β-NaY2Ti2S2O5.
Our calculations indicate that the intercalation of Na and other large alkali or alkaline earth metal ions will be very challenging in materials composed of the building blocks of W–R phases.
Mg intercalation and mobility
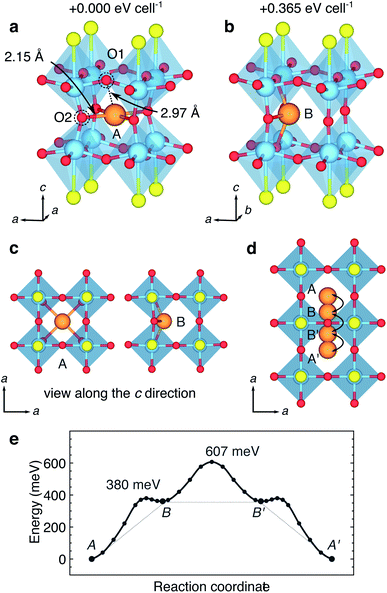
The mobility of divalent Mg2+ within anhydrous crystalline structures is very limited, which represents a stumbling block for the development of batteries based upon Mg2+ intercalation chemistry.64 Typically, mobility is higher within sulphides than oxides, and indeed there are only a handful of oxide materials that report reversible Mg2+ intercalation.65–67 Experimental results indicate that Mg2+ ions can be introduced into Y2Ti2S2O5via a solid-state reaction route at 300 °C, to a stoichiometry of Mg0.32Y2Ti2S2O5. Mg2+ ions were found to occupy 12-coordinated sites within the type I cavities.35Our DFT calculations identify two stable sites for Mg2+ in Y2Ti2S2O5. The first site, and the most stable, is the central site in the type I cavity. The Mg-ions forms four bonds to O2 ions in the ab plane of 2.15 Å and eight to O1 ions of 2.97 Å (Fig. 12a). The geometry may either be described as 12-coordinate, or four coordinate square-planar. There is a clear distortion to the host framework, with the O2 ions drawn in towards the Mg-ion, whilst the O1 ions are less significantly disturbed. A bond-valence sum calculation shows that the Mg-ion is highly under-bonded in this central site, with a value of ∼1.42.
The second site is a four-coordinate distorted rectangular-near-planar window site (Fig. 12b). The geometry is very similar to the position adopted by Li+, but the Mg-ion sits further into the cage, and causes a greater distortion to the host framework than the Li ion. The window site is 0.365 eV higher in energy than the central site. There is no stable site for Mg2+ along the c direction, and a Mg-ion introduced into a ‘horizontal’ window at the top of the type I cavity migrates to the centre of the cage.
Fig. 12e shows the energy profile for Mg2+ moving from a central site in one cage, into the window sites, through the window to second window site and into the centre of the next cage. Hopping from the central site to the window site has a barrier of 0.380 eV. The window site is a very shallow local minimum on the potential energy surface. The hop through the window has a barrier of 0.607 eV with respect to the stable central site, and the remaining section of the migration profile is a reflection of the first section.
The activation barrier of 0.607 eV is relatively low for Mg2+ mobility in a crystalline material, and very low for mobility within an oxide framework.64 Here, the Mg2+ moves within the central [Ti2O5]2− slabs and is not in contact with the S ions, so the diffusion environment is comparable to that of an oxide. The difference in behaviour between Li and Mg-ions is a result of the different charge density of the two ions. Despite being of a similar size, the higher change of the Mg-ion means it causes a strong distortion of the host lattice, and can be stabilised in the central cavity, rather than only at the window. The distortion of the host lattice by the Mg2+ suggests a reason for the low level of Mg2+ intercalation within the central cavities from experiment (x = 0.32), compared to Li+ (x = 2.0) and Na+ (x = 1.0). Once a Mg2+ ion is within a central cavity, the O2 of that cage will be drawn in towards the Mg2+. This will tend to prevent other Mg-ions moving through and into neighbouring cages, since their potential energy surface will be disrupted. The distortion of the host framework by the Mg2+ effectively prevents the ‘frustration’ experienced by Li+, since the distortions act to stabilise the Mg2+ in a deeper well on the potential energy surface. As such, it is not possible to intercalate Mg2+ to a level that results in every other cage being occupied by a Mg-ion (x = 0.5).
The mobility of divalent Mg2+ within a bronze-type framework was recently reported by Johnson et al. in V4Nb18O55,66 which is structurally-related to the tetragonal tungsten bronzes, and has units similar to type I and II W–R-type cavities. Activation barriers of similar magnitude were reported for selected pathways and Mg-ions we found to occupy distorted square- or rectangular-planar insertion sites. Mg2+ intercalation in V4Nb18O55 was limited to a low level. Taken together, these results and other similar reports68,69 indicate that Mg2+ mobility is possible within W–R-type frameworks under dilute conditions, but the high charge of Mg2+ induces distortions to the framework that yield low energy minima on the potential energy surface and limit intercalation to low levels.
Electronic structure of Y2Ti2S2O5
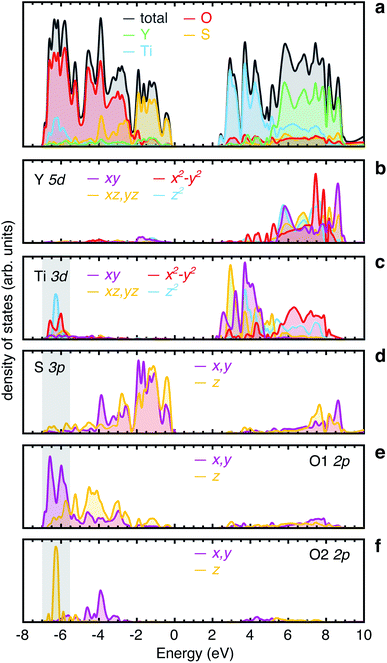
A limiting factor in electrode materials, as well as ionic conductivity, is the electronic transport. Materials with Wadsley–Roth-type structures typically display an insulator-to-metal transition at low levels of lithiation, due to delocalised electrons in the conduction band, which is composed of relatively diffuse Nb 4d orbitals.18,29,30,53,70 Y2Ti2S2O5 is a medium-gap semiconductor33 with a bandgap of ∼2 eV, and it has been applied as a photocatalyst for overall water-splitting under visible light.52 Upon intercalation of Li+ ions, LixY2Ti2S2O5 is reported to behave as a semiconductor at x = 0.3, with some degree of Curie contribution to the magnetic susceptibility, indicating the presence of localised S = 1/2 magnetic moments, attributed to localised electrons on Ti3+ ions. Y2Ti2S2O5 becomes metallic at x > 1, with a predominantly temperature-independent contribution to the magnetic susceptibility, indicative of Pauli paramagnetism.37Fig. 13 shows the electronic density of states for Y2Ti2S2O5, calculated using HSE06-D3. The bandgaps calculated with other functionals are presented in Table S1.† The valence band is mainly composed of occupied O 2p and S 3p states, while the conduction band is predominantly composed of unoccupied Ti 3d and Y 5d states (Fig. 13a). The Y 5d states lie approximately 4 eV above the conduction band minimum (CBM) and mainly overlap with S 3p states (Fig. 13b). The unoccupied Ti 3d states in the conduction band show a characteristic octahedral crystal field splitting, with a t2g band of dxy, dxz and dyz lying below the eg band of dx2−y2 and dz2 orbitals (Fig. 13c). The distortion from regular octahedral symmetry disrupts the crystal field, lowering the energy of the dz2 orbital slightly so that it overlaps with the t2g band. Within the t2g band, the dxy orbital is unique, while the dxz and dyz are equivalent by symmetry. There is almost no contribution from Ti 3d states to the valence band maximum (VBM), which is composed of S 3p states only (Fig. 13c and d). The absence of hybridisation between Ti 3d and S 3p orbitals is consistent with the long Ti–S distance of ∼2.87 Å. There is a small contribution from the Ti 3d states to the lower edge of the valence band at approximately −4 eV (indicated by the grey area). In this region, a sharp peak from the Ti 3dz2 aligns with a highly localised band from the O2 2pz, consistent with the orientational overlap expected from these two orbitals (Fig. 13c and f). The Ti 3dx2−y2 band shows two small peaks at approximately −6 eV and −6.5 eV at the bottom of the valence band, which align with the O1 2px and 2py orbitals, indicating Ti–O covalent interactions (Fig. 13c and e). The calculated bandgap from HSE06-D3 is 2.19 eV.
A previous report of the electronic density of states using the PBE functional showed a very different character, with the valence band maximum composed of overlapping S 3p and O 2p states.52 The overlapping contributions were advanced as evidence for hybridisation between S 3p and O 2p states. However, overlapping peaks in the electronic density of states do not necessarily indicate orbital hybridisation, since orbitals may overlap in energy, but not in space. In the present case, the O2− and S2− anions form separate sub-bands of the valence band, and our results indicate that there is negligible orbital overlap.
Fig. 14 shows the electronic band structure of Y2Ti2S2O5 calculated using HSE06-D3. The VBM and CBM regions both show highly parabolic bands, indicating high electron and hole mobility. The band structure shows a direct bandgap at the Γ and Z points in the Brillouin zone.
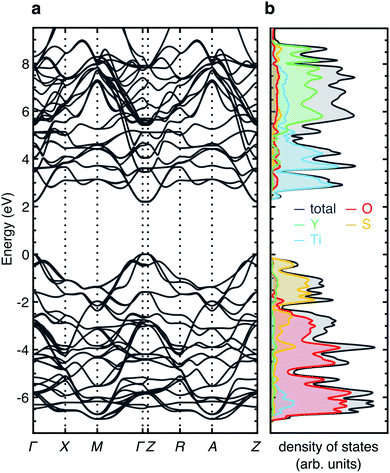 | ||
| Fig. 14 Electronic band structure of Y2Ti2S2O5 calculated using HSE06-D3. (a) Electronic band structure. (b) Total and partial electronic density of states. | ||
Physical origin of the orthorhombic distortion at x = 1 in LixY2Ti2S2O5
The orthorhombic distortion at x = 1 (i.e., half-lithiation) is the primary structural change in the system, causing a clear drop in the voltage curve, and is therefore an important feature to understand. Hyett et al. propose that the orthorhombic distortion is electronically-driven by lifting the degeneracy of the Ti 3dxz and 3dyz orbitals.37 The results presented here show that Li-ions are highly mobile and will fill sites in a correlated fashion during lithiation of Y2Ti2S2O5. This raises the possibility that orthorhombic distortion is a steric effect, initiated by a Li-ion ordering arising from correlated Li-dynamics, rather than arising from a electronic band-filling effect.In Li-ion conductors under dilute conditions, Li-ion mobility can be well described by a single-ion hopping mechanism and in the absence of an external potential, self-diffusion will take place through a random-walk.71,72 However, at non-dilute concentrations significant Li–Li interactions produce pronounced deviations from the random-walk behaviour that occurs in the dilute limit. Li+ motion becomes highly correlated, and the correlation depends on a range of factors including the concentration of mobile species, interactions between those species and the host lattice geometry.50 Depending on these factors, the correlation effects may give rise to Li-orderings at certain states of charge.
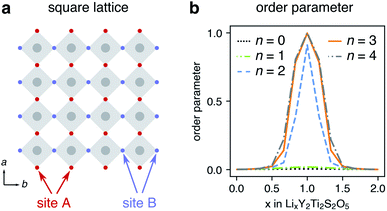
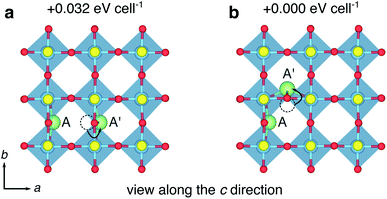
The correlated behaviour of mobile particles in solids can be examined using lattice-gas Monte-Carlo (MC) simulations. The network of sites that Li-ion occupy in LixY2Ti2S2O5 can be described as a square lattice, and a model was constructed to represent this network. Alternating sites were labelled A and B, and each site was connected to neighbours of opposite type only, representing the possible hops Li ions can make from window site to window site along path 2 (Fig. 15a). Lattice-gas MC simulations were run at different levels of lithiation, and an ‘order-parameter’ was computed, taking the absolute difference in site occupation for A and B sites for each simulation. An order parameter of 0 indicates an even population of the two types of sites whereas an order parameter of 1 indicates all A sites occupied with B unoccupied, or all B sites occupied with A unoccupied. We note that distortions of the Li-ions into the ‘windows’ under dilute conditions mean that the Li-ion site network is not perfectly described by a square lattice in this low lithium level. However, a square lattice describes the site network in the region of interest (x > 0.5) that we focus upon here.
Fig. 15b shows the order parameter for different levels of Li concentration, calculated at different values of nearest-neighbour interaction (n). At x = 1 (LiY2Ti2S2O5), the order parameter is a maximum, and is equal to 1 when n > 1, showing that Li-ion order in chains along one 〈100〉 direction. These results are consistent with previous lattice-gas MC simulations of mobile particles on a square lattice.73,74 The lattice-gas MC model is based purely upon nearest-neighbour interactions and omits structural distortions and electronic effects. The results therefore confirm that in the absence of an orthorhombic distortion and band filling, Li-ions will order in LiY2Ti2S2O5 forming chains along the b direction.
Secondly, we examine the Li-ordered structure at x = 1 under modified band-filling conditions. Two electrons were removed from the Ti 3d orbitals in the unit cell of LiY2Ti2S2O5, and charge neutrality was recovered by applying a uniform background screening. From a tetragonal starting cell, the structure was re-optimised. The final structure displays an orthorhombic distortion, with (001)-plane lattice parameters of a = 3.681 Å and b = 3.796 Å, a difference of 0.115 Å. In comparison, the charge-neutral cell lattice parameters are a = 3.841 Å and b = 3.911 Å, a difference of 0.070 Å. Fig. 16a shows the electronic density for the orthorhombically-distorted structure with two electrons removed. The sterically-induced orthorhombic distortion of the structure lowers the energy of the Ti 3dyz orbital, breaking the degeneracy with the Ti 3dxz orbital, despite the Ti 3dyz being unoccupied.
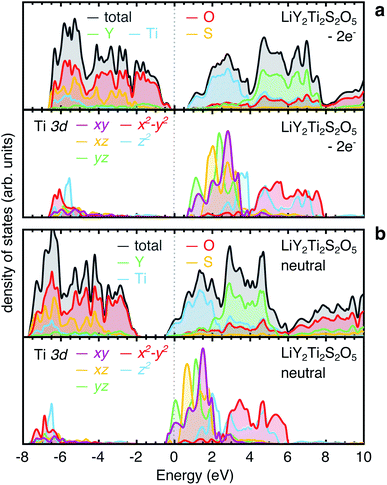 | ||
| Fig. 16 Electronic density of states for LiY2Ti2S2O5 calculated using PBEsol under varying band-filling conditions. (a) Total and atom-projected electronic density of states for the low-energy ordering of Li-ions in LiY2Ti2S2O5 (Fig. 7a), with two electrons removed from the unit cell, and a background screening applied to compensate the removed electrons. (b) Total and atom-projected electronic density of states for the low-energy ordering of Li-ions in LiY2Ti2S2O5, in a charge-neutral cell, under normal band-filling conditions. | ||
This result demonstrates that in the presence of Li-ion chains along the b axis and the absence of band-filling, the orthorhombic distortion is observed. Therefore, we propose that the origin of the orthorhombic distortion is the Li-ion ordering, rather than band-filling effects. The Li-ion ordering arises due to electrostatic repulsion of the Li-ions at half-filling on the square lattice of sites. We note that the region in which the orthorhombic distortion occurs (0.66 < x < 1.52) in LixY2Ti2S2O5, as reported by Hyett et al.,37 corresponds very closely with the region in which the order parameter has an appreciable value from our lattice-gas Monte-Carlo model (0.5 < x < 1.5). This further supports the idea that the Li-ion ordering is the driver for the orthorhombic distortion.
Finally, we analyse the electronic density of states for LiY2Ti2S2O5 in a charge-neutral cell, under normal band-filling conditions (Fig. 16b). The system is metallic, consistent with experimental magnetic susceptibility measurements,37 with electrons filling the Ti 3d orbitals at the bottom of the conduction band. The degeneracy of the Ti 3dxz and Ti 3dyz is indeed lifted, with the Ti 3dyz orbitals stabilised over the Ti 3dxz orbitals (Fig. 16b), consistent with the results of Hyett et al.37 The Ti 3dyz now overlaps with the Ti 3dxy orbital, and the Fermi energy crosses both. The orthorhombic distortion is less for the neutral cell (0.070 Å) than the cell with two electrons removed (0.115 Å), implying that the band-filling acts to lower the effect of the orthorhombic distortion, by partial filling of the Ti 3dxy orbital (which causes isotropic expansion in the (001) plane), rather than filling the Ti 3dyz only.
Discussion
Y2Ti2S2O5 is a model system within which to understand the mechanisms of Li+ ion diffusion in Wadsley–Roth and related bronze-type structures. Wadsley–Roth phases have complex crystal structures with a variety of cavity shapes into which Li+ can be accommodated. They show disordered occupation of cations in [MO6] octahedra, predicted to affect local Li+-hopping energies,30,53 and in some cases fractional occupation of [MO4] tetrahedra within type III and VI cavities.21 Li+ diffusion is predominantly 1D down the block columns in W–R phases. However, movement of Li+ ions perpendicular to the column direction between type I cavities and higher activation barriers for sites for Li+ ions hopping into ‘pocket’ at n × m block edges introduces complexity and additional dimensionality to the potential energy surface for Li+ mobility.29 In contrast, the movement of Li+ is entirely 2D within Y2Ti2S2O5, and the type I cavities are homogeneous across the entire structure, greatly simplifying the potential energy surface for Li+-hopping. Insights into structural properties that activate high Li+ mobility in the simple 2D structure of Y2Ti2S2O5 may provide a basis for understanding the more complex case of Wadsley–Roth type structures.The high-rate performance of Y2Ti2S2O5 as an Li-ion anode material38 can be attributed to the low activation barriers for Li+ hopping between sites. The origin of the very low barriers under dilute conditions in Y2Ti2S2O5 is the unusual four-coordinate distorted rectangular-near-planar type insertion geometry. This geometry is ‘frustrated’ or unstable with respect to more favourable coordination environments such as octahedral or tetrahedral. Similar geometry is also observed in W–R-type phases, when Li-ion occupy type I cavities. The Li-ions are too small to be stable in the central 12 coordinate A site within the cavities and instead reside by the edge, in ‘frustrated’ window sites.
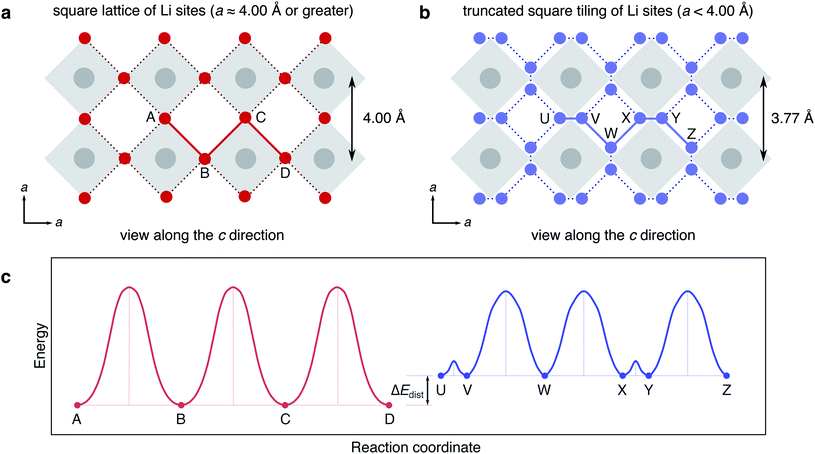
Our results reveal the importance of the size and shape of the type I cavity windows on the Li-ion insertion geometry, and by extension the shape of the potential energy surface for Li-hopping and the diffusion rate. In the case of a large window (with a width and height of ∼4 Å or greater), it would be expected that the Li-ion would reside flush in line with the O1 ion when the structure is viewed along the c direction. Each window would therefore constitute a single insertion site, and Li-ion hopping would take place by direct hops between windows, the network of sites defined by a square lattice (Fig. 17a).
However, in Y2Ti2S2O5 the type I cavities are tetragonally extended and as such, the windows are tall and narrow. The Li-ions cannot reside flush in the windows and are squeezed slightly into the cavities. The position of Li+ in an approximately square-planar window site, identified from neutron diffraction experiments,37 is revealed to be the average of two ‘symmetry-broken’ stable positions either side of the window (at 0 K). This displacement into the cavities has two effects on Li-ion hopping. Firstly, the network of stable sites is modified, since there are equilibrium positions either side of the window. The network is now represented by a truncated square tiling (Fig. 17b). Secondly, the Li-ions are destabilised (or ‘frustrated’) further, and raised higher on the potential energy surface by some value ΔEdist (Fig. 17c).
Li-ion hopping can now take place via two small steps; a rattling through the window, which has a very low barrier (determined by the magnitude of displacement into the cage), and a hop along the edge of the cavity to another window site. Since the Li-ion has been raised on the potential energy surface, this second hop is likely to have a lower activation barrier than the direct hop between window sites (assuming the energy of the transition state remains approximately constant). The displacement into the cavity by the narrow window size therefore has the effect of smoothing the potential energy surface, and giving rise to fast Li-ion diffusion. This effect is likely to be general to Li-ion diffusion within the type I cavities of W–R phases; the window size affects the stability of the insertion site and the magnitude of the activation barrier to Li-ion hopping. We speculate that as the window size is decreased further, the activation barrier for hopping through the window will increase, but the barrier for hopping to a new window site will decrease. The results therefore imply that there is some ‘ideal’ window size to achieve the fastest Li-ion diffusion within type I cavities, that will result in a maximum ‘smoothing’ of the potential energy surface for Li-ion hopping. To test this hypothesis, the varying window size for isostructural materials within the Ln2Ti2S2O5 series (Ln = Nd, Sm, Gd, Tb, Dy, Ho, Er)33 could be exploited, and the Li-ion diffusivity could be compared between the materials. In W–R frameworks the presence of type II and other cavities complicates the picture for Li-ion diffusion, as do effects such as framework cation off-centring, and cation disorder.
At non-dilute Li-concentrations (x > 0.5 in LixY2Ti2S2O5), Li–Li repulsion pushes the Li-ions into an undistorted rectangular planar geometry flush in the ‘windows’ (Fig. 9). The Li-ion hops will now be described by a square lattice of sites. It is expected that activation barriers will remain low, since the rectangular-planar geometry is still ‘frustrated’. The diffusion rate remains high, as is apparent from the experimental discharge rate curves.38 In corner-sharing-only octahedral frameworks such as ReO3, the frustrated geometry of Li is lost on increasing levels of lithiation. The presence of the rocksalt [Y2S2]+ slabs provides rigidity to the type I cavity framework, and the octahedral units do not experience correlated rotations and distortions as Li intercalation levels are increased. The rocksalt slabs therefore have a similar effect to the shear planes in W–R phases, but without reducing the Li-ion diffusion dimensionality to 1D.
As discussed above, in fast Li-ion conductors at non-dilute conditions, Li-ion diffusion will be dominated by Li–Li interactions, resulting in highly correlated ionic motions. This effect is expected to be prevalent in Li-ion conductors based on W–R-motifs. Recently, Griffith and Grey have applied 7Li pulsed-field-gradient nuclear-magnetic-resonance (PFG-NMR) spectroscopy to probe Li+ diffusion in Nb18W8O69 at room temperature (298 K).19 The technique is generally not suitable for measuring diffusion in battery electrodes, since Li+ mobility is too slow in most electrode materials. However, since the diffusion coefficients for Li+ in Wadsley–Roth type materials are orders of magnitude greater than in many battery electrode materials, PFG-NMR spectroscopy measurements are possible. These experiments indicated correlated Li+ diffusion characteristics. However, due to the resolution of the data, and the complex Li+ diffusion in 3 directions within the 2 nm × 2 nm width 5 × 5 blocks, a precise determination of the correlation effects was not possible. The relatively simple 2D diffusion plane of Y2Ti2S2O5, and the high-rate discharge performance make it a model material for investigating correlated Li+ diffusion using experimental techniques. The effects of correlated diffusion on simple square networks of sites are well known from lattice-gas Monte-Carlo simulations,73–76 and could be examined in greater detail in Y2Ti2S2O5 with classical or ab inito molecular dynamics simulations of Li-ion diffusion.
The stable orderings at x = 1 and x = 1.5 are expected to cause a significant drop in the diffusion coefficient, since Li-ion hopping out of these stable orderings will have to overcome Li–Li repulsion effects. The stable orderings arise from Li–Li repulsion effects; if all the sites on a square lattice are similar in energy, orderings will appear at the half-filled lattice to maximise distance between mobile cations. One strategy to inhibit these orderings would be to disrupt the stability of the network of sites through doping or chemical substitution of ions of different size into the framework. For example, substitution of Nb in place of Ti, or Se in place of S may modify the site stability network.
Although our study on Y2Ti2S2O5 is dedicated to understand its intercalation behaviour, analysis of the calculated electronic density of states has also allowed us to investigate the structural–chemical features that enable the same material to be an efficient photocatalyst. The density of states results presented in Fig. 13, calculated using HSE06, clearly show that the VBM arises from S 3p states and the CBM is composed of Ti 3d states. Photo-generated electrons will therefore be located in the Ti 3d band, while holes will be located in the S 3p band. Although we describe the structure of the material as based on type I cavities formed by [TiO5S] octahedra, the highly distorted nature of the Ti octahedra, mean that the Ti–S distance is >2.8 Å, longer than typical Ti–S bonds in other crystalline materials such as TiS2 (∼2.4 Å).77 The spatial overlap between Ti 3d and S 3p orbitals is therefore expected to be small.
Carrier recombination is a crucial mechanism in determining the efficiency of water-splitting photocatalysts. Materials displaying long carrier lifetimes show high efficiency, since photogenerated electron–hole pairs are able to migrate to surfaces to perform work. Various strategies are employed to reduce carrier recombination, one of which is the design of heterostructural interfaces comprised of two materials with tuned band positions for efficient extraction and separation of photogenerated electron–hole pairs into each material.78 Indeed, it has been suggested that a single material is unlikely to mediate the entire sequence of charge and mass transport as well as energy conversion processes necessary for photocatalytic water-splitting.79 However, if a single crystalline material has a structure in which subsets of cations and anions are (i) physically separated in space and (ii) have band energies that form the VBM and CBM, combined with the other band structure properties required for photocatalytic water-splitting, then the entire sequence can be possible within one compound.80
Layered ternary of quaternary oxychalcogenide or oxypnictide compounds such as Ln2Ti2S2O5,31–33 BiCuSeO81 and LaFeAsO82 contain structural sub-units that make distinct contributions to the band edges, and thus combine structural and electronic features that yield the separation of electronic states in both energy and space. We speculate that this mechanism may contribute to the excellent photocatalytic activity of Y2Ti2S2O5 and Sm2Ti2S2O5.52,83 With advances in the design84 and modular synthesis of layered mixed-anion semiconductors,85 it may be possible to employ this strategy for the design of improved photocatalysts that efficiently separate charges and maximise carrier lifetimes.
Conclusions
In this work we have investigated the structure and Li+, Na+ and Mg2+ intercalation properties of the high-rate Li-ion anode materials Y2Ti2S2O5, using DFT calculations and lattice-gas Monte Carlo simulations. Y2Ti2S2O5 has an unusual layered Ruddlesden–Popper-type structure, with an empty central plane formed of TiO5S octahedra, that relate to the type I ‘empty-perovskite’ cavities within structural units that form Wadsley–Roth crystallographic shear phases.Li+, Na+ and Mg2+ ions can be intercalated on this central plane. DFT calculations show that Li-ions adopt a four-coordinate distorted rectangular-near-planar geometry, near the windows of the cavities and ‘rattle’ between to sites either side of the window with activation barriers of 20 meV. Li-ion hopping barriers between adjacent windows are 64 meV under dilute conditions. The low activation barriers relate to the size and shape of the cavities; the tall narrow size of the windows destabilises the Li-ions, pushing them into the type I cavities and reducing the magnitude of the activation barrier they must overcome to move, resulting in a very flat potential energy surface. Since Li-diffusion happens very easily, Li–Li repulsion governs Li-ordering during the intercalation process. Lattice-gas Monte-Carlo simulations show that Li-ions form chains along the b-axis at x = 1, driven Li–Li repulsion. This ordering, an effect of correlated particle interactions, drives an orthorhombic distortion of the structure. The rocksalt-type slabs Y–S provide rigidity to the framework, such that no correlated rotations of the ‘empty-perovskite’ framework occur on Li intercalation.
Na+ hopping barriers are high, which is attributed to the large size and high stability of Na+ within the central 12-coordinated sites of the cavities. The results suggest that W–R-type materials are not good Na-ion conductors. Mg-ions move with single-ion hopping barriers of 0.604 eV, but strong host framework distortions hinder their mobility and limit intercalation to low levels.
Despite focusing on intercalation properties in Y2Ti2S2O5, we have shows that the localisation of valence and conduction band edges in occurs in spatially separated sub-units of the structure. This is likely to decrease the recombination rate of photo-generated charge-carriers, and contribute to the high photocatalytic activity reported for Y2Ti2S2O5 (ref. 52) and isostructural compounds.83 Similar features are expected to occur in other layered ternary or quaternary oxychalcogenides and oxypnictide compounds.
The results presented here for Y2Ti2S2O5 provide insights into the structural origin of fast Li-ion diffusion in materials related to the Wadsley–Roth phases, and will help guide the development of high-power electrode and electrolyte materials.
Conflicts of interest
There are no conflicts to declare.Acknowledgements
K. M. thanks Megan M. Butala and Can P. Koçer for valuable discussions. The authors thank the EPSRC for funding the JUICED project (EP/R023662/1) and acknowledge membership of the UK's HEC Materials Chemistry Consortium, which is funded by EPSRC (EP/L000202, EP/R029431). This work used computational resources provided by the ARCHER UK National Supercomputing Service (http://www.archer.ac.uk) and the UK Materials and Molecular Modelling Hub (MMM Hub), which is partially funded by EPSRC (EP/P020194). The authors acknowledge the use of the UCL Grace and Kathleen High Performance Computing Facilities (Grace@UCL), (Kathleen@UCL), and associated support services, in the completion of this work.References
- Y. Liu, Y. Zhu and Y. Cui, Nat. Energy, 2019, 4, 540–550 CrossRef.
- P. Bruce, B. Scrosati and J.-M. Tarascon, Angew. Chem., Int. Ed., 2008, 47, 2930–2946 CrossRef CAS.
- A. Lennon, Y. Jiang, C. Hall, D. Lau, N. Song, P. Burr, C. P. Grey and K. J. Griffith, MRS Energy Sustain., 2019, 6, E2 CrossRef.
- S. Megahed and B. Scrosati, J. Power Sources, 1994, 51, 79–104 CrossRef CAS.
- M. Winter, B. Barnett and K. Xu, Chem. Rev., 2018, 118, 11433–11456 CrossRef CAS.
- P. Arora, R. E. White and M. Doyle, J. Electrochem. Soc., 1998, 145, 3647–3667 CrossRef CAS.
- J. Vetter, P. Novàk, M. Wagner, C. Veit, K.-C. Möller, J. Besenhard, M. Winter, M. Wohlfahrt-Mehrens, C. Vogler and A. Hammouche, J. Power Sources, 2005, 147, 269–281 CrossRef CAS.
- M. V. Reddy, G. V. Subba Rao and B. V. R. Chowdari, Chem. Rev., 2013, 113, 5364–5457 CrossRef CAS.
- T. Ohzuku, A. Ueda and N. Yamamoto, J. Electrochem. Soc., 1995, 142, 1431–1435 CrossRef CAS.
- K. Zaghib, M. Simoneau, M. Armand and M. Gauthier, J. Power Sources, 1999, 81–82, 300–305 CrossRef CAS.
- X. Sun, P. V. Radovanovic and B. Cui, New J. Chem., 2015, 39, 38–63 RSC.
- L. Sun, J. Wang, K. Jiang and S. Fan, J. Power Sources, 2014, 248, 265–272 CrossRef CAS.
- V. Augustyn, J. Come, M. A. Lowe, J. W. Kim, P.-L. Taberna, S. H. Tolbert, H. D. Abruña, P. Simon and B. Dunn, Nat. Mater., 2013, 12, 518–522 CrossRef CAS.
- K. J. Griffith, A. C. Forse, J. M. Griffin and C. P. Grey, J. Am. Chem. Soc., 2016, 138, 8888–8899 CrossRef CAS.
- D. Chen, J.-H. Wang, T.-F. Chou, B. Zhao, M. A. El-Sayed and M. Liu, J. Am. Chem. Soc., 2017, 139, 7071–7081 CrossRef CAS.
- J.-T. Han, Y.-H. Huang and J. B. Goodenough, Chem. Mater., 2011, 23, 2027–2029 CrossRef CAS.
- K. J. Griffith, K. M. Wiaderek, G. Cibin, L. E. Marbella and C. P. Grey, Nature, 2018, 559, 556–563 CrossRef CAS.
- M. B. Preefer, M. Saber, Q. Wei, N. H. Bashian, J. D. Bocarsly, W. Zhang, G. Lee, J. Milam-Guerrero, E. S. Howard, R. C. Vincent, B. C. Melot, A. Van der Ven, R. Seshadri and B. S. Dunn, Chem. Mater., 2020, 32, 4553–4563 CrossRef CAS.
- K. J. Griffith and C. P. Grey, Chem. Mater., 2020, 32, 3860–3868 CrossRef CAS.
- S. Andersson and A. D. Wadsley, Nature, 1966, 211, 581–583 CrossRef CAS.
- R. J. Cava, D. W. Murphy and S. M. Zahurak, J. Electrochem. Soc., 1983, 130, 2345–2351 CrossRef CAS.
- J. P. Parras, A. R. Genreith-Schriever, H. Zhang, M. T. Elm, T. Norby and R. A. De Souza, Phys. Chem. Chem. Phys., 2018, 20, 8008–8015 RSC.
- R. Cava, A. Santoro, D. Murphy, S. Zahurak and R. Roth, Solid State Ionics, 1981, 5, 323–326 CrossRef CAS.
- R. Cava, A. Santoro, D. Murphy, S. Zahurak and R. Roth, J. Solid State Chem., 1982, 42, 251–262 CrossRef CAS.
- N. H. Bashian, S. Zhou, M. Zuba, A. M. Ganose, J. W. Stiles, A. Ee, D. S. Ashby, D. O. Scanlon, L. F. J. Piper, B. Dunn and B. C. Melot, ACS Energy Lett., 2018, 3, 2513–2519 CrossRef CAS.
- K. Qi, J. Wei, M. Sun, Q. Huang, X. Li, Z. Xu, W. Wang and X. Bai, Angew. Chem., Int. Ed., 2015, 54, 15222–15225 CrossRef CAS.
- N. H. Bashian, M. B. Preefer, J. Milam-Guerrero, J. J. Zak, C. Sendi, S. A. Ahsan, R. C. Vincent, R. Haiges, K. A. See, R. Seshadri and B. C. Melot, J. Mater. Chem. A, 2020, 8, 12623–12632 RSC.
- L. Bursill and B. Hyde, Prog. Solid State Chem., 1972, 7, 177–253 CrossRef CAS.
- C. P. Koçer, K. J. Griffith, C. P. Grey and A. J. Morris, Chem. Mater., 2020, 32, 3980–3989 CrossRef.
- K. J. Griffith, I. D. Seymour, M. A. Hope, M. M. Butala, L. K. Lamontagne, M. B. Preefer, C. P. Koçer, G. Henkelman, A. J. Morris, M. J. Cliffe, S. E. Dutton and C. P. Grey, J. Am. Chem. Soc., 2019, 141, 16706–16725 CrossRef CAS.
- M. Goga, R. Seshadri, V. Ksenofontov, P. Gutlich and W. Tremel, Chem. Commun., 1999, 979–980 RSC.
- C. Boyer, C. Deudon and A. Meerschaut, C. R. Seances Acad. Sci., Ser. 2, 1999, 2, 93–99 CAS.
- C. Boyer-Candalen, J. Derouet, P. Porcher, Y. Moëlo and A. Meerschaut, J. Solid State Chem., 2002, 165, 228–237 CrossRef CAS.
- S. G. Denis and S. J. Clarke, Chem. Commun., 2001, 2356–2357 RSC.
- S. J. Clarke, S. G. Denis, O. J. Rutt, T. L. Hill, M. A. Hayward, G. Hyett and Z. A. Gál, Chem. Mater., 2003, 15, 5065–5072 CrossRef CAS.
- O. J. Rutt, T. L. Hill, Z. A. Gál, M. A. Hayward and S. J. Clarke, Inorg. Chem., 2003, 42, 7906–7911 CrossRef CAS.
- G. Hyett, O. J. Rutt, Z. A. Gál, S. G. Denis, M. A. Hayward and S. J. Clarke, J. Am. Chem. Soc., 2004, 126, 1980–1991 CrossRef CAS.
- H. Oki and H. Takagi, Solid State Ionics, 2015, 276, 80–83 CrossRef CAS.
- R. Dovesi, A. Erba, R. Orlando, C. M. Zicovich-Wilson, B. Civalleri, L. Maschio, M. Rérat, S. Casassa, J. Baima, S. Salustro and B. Kirtman, Wiley Interdiscip. Rev.: Comput. Mol. Sci., 2018, 8, e1360 Search PubMed.
- J. P. Perdew, A. Ruzsinszky, G. I. Csonka, O. A. Vydrov, G. E. Scuseria, L. A. Constantin, X. Zhou and K. Burke, Phys. Rev. Lett., 2008, 100, 136406 CrossRef.
- J. Heyd, G. E. Scuseria and M. Ernzerhof, J. Chem. Phys., 2003, 118, 8207–8215 CrossRef CAS.
- J. Heyd and G. E. Scuseria, J. Chem. Phys., 2004, 121, 1187–1192 CrossRef CAS.
- S. Grimme, J. Antony, S. Ehrlich and H. Krieg, J. Chem. Phys., 2010, 132, 154104 CrossRef.
- C. Pisani, J. Mol. Struct.: THEOCHEM, 2003, 621, 141–147 CrossRef CAS.
- H. J. Monkhorst and J. D. Pack, Phys. Rev. B: Solid State, 1976, 13, 5188–5192 CrossRef.
- K. McColl and F. Corà, J. Mater. Chem. A, 2019, 7, 3704–3713 RSC.
- K. McColl and F. Corà, Phys. Chem. Chem. Phys., 2019, 21, 7732–7744 RSC.
- P. D’Arco, S. Mustapha, M. Ferrabone, Y. Noël, M. D. L. Pierre and R. Dovesi, J. Phys.: Condens. Matter, 2013, 25, 355401 CrossRef.
- K. Momma and F. Izumi, J. Appl. Crystallogr., 2011, 44, 1272–1276 CrossRef CAS.
- B. J. Morgan, J. Open Source Softw., 2017, 2, 247 CrossRef.
- B. J. Morgan, R. Soc. Open Sci., 2017, 4, 170824 CrossRef.
- Q. Wang, M. Nakabayashi, T. Hisatomi, S. Sun, S. Akiyama, Z. Wang, Z. Pan, X. Xiao, T. Watanabe, T. Yamada, N. Shibata, T. Takata and K. Domen, Nat. Mater., 2019, 18, 827–832 CrossRef CAS.
- C. P. Koçer, K. J. Griffith, C. P. Grey and A. J. Morris, J. Am. Chem. Soc., 2019, 141, 15121–15134 CrossRef , PMID: 31448601.
- H. Sabrowsky, P. Mertens and A. Thimm, Z. Kristallogr. - Cryst. Mater., 1985, 171, 1–6 CAS.
- M. Wenger and T. Armbruster, Eur. J. Mineral., 1991, 3, 387–400 CrossRef CAS.
- U. Olsher, R. M. Izatt, J. S. Bradshaw and N. K. Dalley, Chem. Rev., 1991, 91, 137–164 CrossRef CAS.
- L. R. De Jesus, J. L. Andrews, A. Parija and S. Banerjee, ACS Energy Lett., 2018, 3, 915–931 CrossRef CAS.
- G. A. Horrocks, A. Parija, L. R. De Jesus, L. Wangoh, S. Sallis, Y. Luo, J. L. Andrews, J. Jude, C. Jaye, D. A. Fischer, D. Prendergast, L. F. J. Piper and S. Banerjee, Chem. Mater., 2017, 29, 10386–10397 CrossRef CAS.
- Z. Rong, R. Malik, P. Canepa, G. Sai Gautam, M. Liu, A. Jain, K. Persson and G. Ceder, Chem. Mater., 2015, 27, 6016–6021 CrossRef CAS.
- B. Xu and S. Meng, J. Power Sources, 2010, 195, 4971–4976 CrossRef CAS.
- M. Liu, Z. Rong, R. Malik, P. Canepa, A. Jain, G. Ceder and K. A. Persson, Energy Environ. Sci., 2015, 8, 964–974 RSC.
- H. Fang and P. Jena, Proc. Natl. Acad. Sci. U. S. A., 2017, 114, 11046–11051 CrossRef CAS.
- Y. Wang, W. D. Richards, S. P. Ong, L. J. Miara, J. C. Kim, Y. Mo and G. Ceder, Nat. Mater., 2015, 14, 1026–1031 CrossRef CAS.
- P. Canepa, G. Sai Gautam, D. C. Hannah, R. Malik, M. Liu, K. G. Gallagher, K. A. Persson and G. Ceder, Chem. Rev., 2017, 117, 4287–4341 CrossRef CAS.
- J. L. Andrews, A. Mukherjee, H. D. Yoo, A. Parija, P. M. Marley, S. Fakra, D. Prendergast, J. Cabana, R. F. Klie and S. Banerjee, Chem, 2018, 4, 564–585 CAS.
- I. D. Johnson, G. Nolis, K. McColl, Y. A. Wu, D. Thornton, L. Hu, H. D. Yoo, J. W. Freeland, F. Corà, J. K. Cockcroft, I. P. Parkin, R. F. Klie, J. Cabana and J. A. Darr, Inorg. Chem., 2020, 59, 9783–9797 CrossRef CAS.
- M. Lopez, H. D. Yoo, L. Hu, J. L. Andrews, S. Banerjee and J. Cabana, ACS Energy Lett., 2020, 5, 3357–3361 CrossRef CAS.
- R. Wang, C.-C. Chung, Y. Liu, J. L. Jones and V. Augustyn, Langmuir, 2017, 33, 9314–9323 CrossRef CAS , PMID: 28732164.
- H. Yaghoobnejad Asl and A. Manthiram, Chem. Mater., 2019, 31, 2296–2307 CrossRef CAS.
- C. P. Koçer, K. J. Griffith, C. P. Grey and A. J. Morris, Phys. Rev. B, 2019, 99, 075151 CrossRef.
- C. R. A. Catlow, Solid State Ionics, 1983, 8, 89–107 CrossRef CAS.
- R. E. Howard and A. B. Lidiard, Rep. Prog. Phys., 1964, 27, 161–240 CrossRef CAS.
- G. E. Murch, Philos. Mag. A, 1981, 44, 699–709 CrossRef CAS.
- G. E. Murch, Solid State Ionics, 1981, 5, 117–120 CrossRef CAS , Proceedings of the International Conference on Fast Ionic Transport in Solids.
- G. E. Murch, Solid State Ionics, 1982, 7, 177–198 CrossRef CAS.
- R. J. Friauf, J. Appl. Phys., 1962, 33, 494–505 CrossRef CAS.
- J. R. Dahn, W. R. McKinnon, R. R. Haering, W. J. L. Buyers and B. M. Powell, Can. J. Phys., 1980, 58, 207–213 CrossRef CAS.
- J. L. Andrews, et al. , J. Am. Chem. Soc., 2018, 140, 17163–17174 CrossRef CAS.
- J. Cho, A. Sheng, N. Suwandaratne, L. Wangoh, J. L. Andrews, P. Zhang, L. F. J. Piper, D. F. Watson and S. Banerjee, Acc. Chem. Res., 2019, 52, 645–655 CrossRef CAS.
- K. Maeda and K. Domen, J. Phys. Chem. C, 2007, 111, 7851–7861 CrossRef CAS.
- D. D. Fan, H. J. Liu, L. Cheng, J. Zhang, P. H. Jiang, J. Wei, J. H. Liang and J. Shi, Phys. Chem. Chem. Phys., 2017, 19, 12913–12920 RSC.
- H. Eschrig, A. Lankau and K. Koepernik, Phys. Rev. B: Condens. Matter Mater. Phys., 2010, 81, 155447 CrossRef.
- A. Ishikawa, T. Takata, J. N. Kondo, M. Hara, H. Kobayashi and K. Domen, J. Am. Chem. Soc., 2002, 124, 13547–13553 CrossRef CAS.
- G. J. Limburn, M. J. P. Stephens, B. A. D. Williamson, A. Iborra-Torres, D. O. Scanlon and G. Hyett, J. Mater. Chem. A, 2020, 8, 19887–19897 RSC.
- Q. D. Gibson, et al. , J. Am. Chem. Soc., 2020, 142, 847–856 CrossRef CAS.
Footnotes |
| † Electronic supplementary information (ESI) available: Further details of the computational methods employed in the calculations; basis sets and constrained geometry optimisations for the calculations of activation barriers for ionic migration. Supplementary results; calculated crystal structure parameters for Y2Ti2S2O5 with different exchange–correlation functionals, and corresponding calculated bandgaps, calculated bond lengths for Y2Ti2S2O5 and calculated bond lengths in [TiO5S] octahedra for LixY2Ti2S2O5. See DOI: 10.1039/d0ta11358a |
| ‡ Current address: Department of Chemistry, University of Bath, Bath, BA2 7AX, UK & Faraday Institution, Harwell Campus, Didcot, OX11 0RA, UK. |
| This journal is © The Royal Society of Chemistry 2021 |

![[3 with combining macron]](https://www.rsc.org/images/entities/char_0033_0304.gif)
![[1 with combining macron]](https://www.rsc.org/images/entities/char_0031_0304.gif)
