
 Open Access Article
 This Open Access Article is licensed under a
 Creative Commons Attribution 3.0 Unported Licence
Understanding spontaneous dissolution of crystalline layered carbon nitride for tuneable photoluminescent solutions and glasses†
Adam J.
Clancy
 *ad,
Theo M.
Suter
ab,
Alaric
Taylor
b,
Sayantan
Bhattacharya
c,
Thomas S.
Miller
b,
Veronika
Brázdová
a,
Abil E.
Aliev
a,
Adrien A. P.
Chauvet
c,
Furio
Corà
a,
Christopher A.
Howard
*d and
Paul F.
McMillan
*a
*ad,
Theo M.
Suter
ab,
Alaric
Taylor
b,
Sayantan
Bhattacharya
c,
Thomas S.
Miller
b,
Veronika
Brázdová
a,
Abil E.
Aliev
a,
Adrien A. P.
Chauvet
c,
Furio
Corà
a,
Christopher A.
Howard
*d and
Paul F.
McMillan
*a
aDept. Chemistry, UCL, London, WC1H 0AJ, UK. E-mail: a.clancy@ucl.ac.uk; p.f.mcmillan@ucl.ac.uk
bDept. Chemical Engineering, UCL, London, WC1H 0AJ, UK
cDept. Chemistry, The University of Sheffield, Sheffield, S3 7HF, UK
dDept. Physics & Astronomy, UCL, London, WC1H 0AJ, UK. E-mail: c.howard@ucl.ac.uk
First published on 19th December 2020
Abstract
The spontaneous dissolution of 2D polytriazine imide (PTI) carbon nitrides in certain solvents diverges dramatically from the inherent insolubility of other 2D materials such as graphene. Here, the mechanism of dissolution and underlying factors which govern PTI solubility are probed, uncovering a complex and adaptable system. At high concentrations, multi-layered species are co-dissolved, and these solubilised stacks may be further exfoliated to few- or single-layer species with the addition of water. While the PTI sheets are fundamentally soluble, the presence of intercalated lithium salts increases yield and improves the degree of exfoliation, with lithium cations adsorbed on the solvated PTI layers. The tuneable degree of delamination modifies the solutions' photoluminescent properties, which may be trapped in a solid phase following vitrification of the solvent.
Introduction
Carbon nitride materials with high N![[thin space (1/6-em)]](https://www.rsc.org/images/entities/char_2009.gif) :C ratios and polymeric to graphitic structures are currently being investigated for incorporation in devices for energy conversion and storage, as well as for optoelectronics and catalysis applications.1,2 Key properties related to energy and sustainability applications include tuneable wide bandgaps ranging between 2.2–2.8 eV that can be harnessed for solar energy capture and photocatalysis.3–5 Their various nitrogen-centres have Lewis and Brønsted acid–base properties leading to catalysis,6,7 and they are shown to provide effective supports for metal and metal oxide nanoparticle catalysts in fuel cells and electrolyzers.8,9
:C ratios and polymeric to graphitic structures are currently being investigated for incorporation in devices for energy conversion and storage, as well as for optoelectronics and catalysis applications.1,2 Key properties related to energy and sustainability applications include tuneable wide bandgaps ranging between 2.2–2.8 eV that can be harnessed for solar energy capture and photocatalysis.3–5 Their various nitrogen-centres have Lewis and Brønsted acid–base properties leading to catalysis,6,7 and they are shown to provide effective supports for metal and metal oxide nanoparticle catalysts in fuel cells and electrolyzers.8,9
Many carbon nitride materials are synthesised via thermolysis of nitrogen-rich carbonaceous precursors, forming amorphous to nanocrystalline polymer products, incorporating varying amounts of H and O in their structure. In contrast, highly crystalline carbon nitride may be created through reactive polymerisation of dicyandiamide in a molten salt bath (a eutectic mixture of lithium and potassium halides10,11). The synthetic mechanism is currently the subject of ongoing debate.12 The resultant product consists of 1,3,5-triazine rings linked with NH bridges to give slightly buckled 2D sheets of intrinsic porosity with C6N9H3 unit cells, termed polytriazine imide (PTI, Fig. 1). The sheets are stacked to form a layered crystal which is intercalated with the lithium salt of the molten bath (LiX·PTI); the potassium component does not intercalate the final product. The halide anion sits between the PTI sheets (Fig. 1c and d), while the Li+ occupies two types of sites: one partly replacing H atoms of the imide bridges (Fig. 1b),10 while the remainder occurs in sites between the layers to achieve charge balance with the halide anions (Fig. 1c and d). The precise positions are not yet determined.13–15 The intercalated salt may be removed through aqueous Soxhlet extraction, leaving the intercalant free PTI (IF-PTI) which can be subsequently reintercalated through treatment with ionic solutions, or spontaneously intercalated with water molecules if left exposed to a humid atmosphere,15 which move through the channels formed by the aligned interlayer pores.16
 | ||
| Fig. 1 Structure of PTI. (a) C6N9H3 monolayer with highlighted 2D unit cell (green). (b) Structure of one pore with single in-plane Li/H substitution highlighting triazine nitrogens (blue), imide bridging nitrogens (red), and anionic bridging nitrogen (green) from Li+ (purple) replacing an imide-bridge hydrogen. (c and d) Schematic model of LiBr·PTI bilayer with no in-plane Li/H substitutions, viewed (c) along c axis, and (d) orthogonal to c axis and between a/b axes for a 3 × 3 supercell, showing AB stacking of PTI layers and idealised 1:1:1 ratio of pore/Li/Br, with random occupancy of the 3 possible Li+ sites in each layer (C grey; N blue; Br brown; Li purple). | ||
There has been interest in exfoliating carbon nitride materials to create suspensions or solutions in order to optimize the active surface area and create inks for deposition on surfaces and incorporation into devices. Creating suspensions of thermolytically-derived carbon nitrides is hindered by the highly crosslinked nature of their disordered polymeric structures. One approach to free nanoscale moieties involves the application of harsh shear forces through sonication, but such mechanical processing can significantly alter the structure, optoelectronic properties, and surface chemistry.17,18 Alternatively, strong acids may be used to exploit the Brønsted basic pyridinic functionality to form cationic carbon nitrides, for example through dispersion in aqueous nitric acid,19 sulfuric acid,20 or sulfuric acid derivatives such as methanesulfonic acid.21 These acidic solvents are also associated with breaking in-layer bonds22,23 through depolymerisation to free the polymeric nanocrystaline materials from the crosslinked bulk. In contrast, the crystalline PTI compounds can be exfoliated by chimie douce methods, without introducing damage to the layers.24
The van der Waals forces between the layers in stacks of 2D crystals (such as graphene sheets in graphite) present a significant energetic barrier to exfoliation. As a result, much previous work25 revolves around providing high shear, commonly through sonication, to cause exfoliation, before kinetically trapping systems as a (thermodynamically unfavourable) dispersion, by coating the individual nanomaterials with surfactants or particular solvents. The approach leads to an unavoidable trade-off between damage to the structure from intense shear, versus poor exfoliation from insufficient shear. Additive-free sonication of the intercalated LiCl·PTI in water has been shown to lead to stable dispersion of PTI sheets, accompanied by delithiation of the in-plane substituted lithium through a Li+/H+ exchange reaction with the aqueous solvent, leaving metal-free PTI and LiOH in solution.17
Unlike kinetically stable dispersions, thermodynamically favourable, spontaneous dissolution of 2D materials provides solutions without introducing any damage to the atomic framework or diminishing intrinsic properties. Approaches include reducing the material to form the anion in a nanomaterial salt26 or protonating with superacid27 to form the nanomaterial cation in a solution. In both cases, increased solvation energy of the ionic layers and the co-dissolution of a counterion has been proposed as energetic driving forces for the nanomaterial dissolution. Reductive dissolution has been applied to PTI materials previously, forming monolayer species in solution and opening up new organofunctionalisation reactions.28 Further, we have previously shown that spontaneous exfoliation and dissolution is possible without agitation for solid intercalated LiBr·PTI when exposed to polar, aprotic (i.e., without exchangeable H atoms) solvents such as dimethyl sulfoxide (DMSO), N,N-dimethyl formamide (DMF) N-methyl-2-pyrrolidone24 and N,N-dimethyl acetamide.12 Solutions have been shown to be capable of exfoliation down to monolayer thicknesses in the solvated state,12,24 and examination of the nanomaterials formed after evaporation of the solvent using high resolution transmission electron microscopy (HRTEM) and high-speed atomic force microscopy (HS-AFM) revealed hexagonal nanoparticles with the same (30–165 nm) external dimensions and crystalline layered structure as the starting PTI phase, with 2–25 layer thickness maximized at around 9 layers.24
The steady-state photoluminescence (PL) spectra of DMF solutions of LiBr·PTI exhibited a peak near 380 nm with a width that broadened slightly towards the blue-green range with longer wavelength excitation. In contrast, spectra for PTI nanosheets that had been deposited on a substrate from dropcasting a solution exhibited a red-shifted and broad PL extending across the entire visible range (i.e., between ca. 320 nm to beyond 700 nm) with maximum intensity between 400–550 nm for all excitation wavelengths. The narrow PL response observed for the solution phase indicated the presence of few-layered PTI nanosheets, whereas the broad response extending across the visible range observed for the precipitate arose from the wider distribution of layer stacking (supported by our previous HS-AFM and HRTEM results).
In the present work the factors which impact the dissolution process of PTI materials are investigated to highlight the intrinsic solubility of the PTI layers; also tuneable PL behaviour is demonstrated into the blue-visible range. We examined the PL properties for different concentrations of PTI dissolved in DMSO and DMSO–H2O solvent mixtures, and for glasses quenched from the DMSO–H2O solutions. Comparison of the results from this and previous studies provides new insight into the dissolution process and suggests possible future applications for photoexcited catalysis and luminescence of these crystalline nanomaterials.
Experimental
Materials
Dicyandiamide (99%), lithium bromide (anhydrous ≥99%), potassium bromide (≥99.0%), DMSO (anhydrous ≥99.9%), were supplied by Merck and used without further purification. Deuterated DMSO (99.9% deuterated) was purchased from VWR. Quartz tubing was supplied by Robson Scientific. Nitrogen gas and liquid nitrogen were supplied by BOC. Water was purified in house by distillation before use.Synthesis of LiBr·PTI and IF-PTI
LiBr·PTI was prepared from dicyandiamide in a molten eutectic LiBr/KBr mixture as described previously.24 Lithium bromide (5.2 g), potassium bromide (4.8 g), and dicyandiamide (2.0 g) were mixed in an N2-filled glovebox and pretreated by heating under vacuum (400 °C, 1 h) before grinding, sealing under vacuum (∼10−7 mbar) in a quartz ampule, and heating (600 °C, 16 h), before washing with deionized water to remove the bromide salts to give LiBr·PTI powder, with 33.0 wt% LiBr (ESI, Fig. S1†). Powder X-ray diffraction (XRD) patterns of the synthesised material (ESI, Fig. S2†) are consistent with literature.15 The material consisted of columns of stacked PTI layers observed by scanning electron microscopy (SEM), that occasionally exhibited a hollow-square cross-sectional mesostructure (ESI, Fig. S3†). This type of texture has been reported previously by Wirnhier et al.10 IF-PTI was synthesised by deintercalating LiBr·PTI by Soxhlet extraction with water over 2 days, before heating at 100 °C under dynamic vacuum (∼10 mbar) for 1 h in a sealable tube before sealing and transferring to a N2 glovebox, with full deintercalation confirmed by TGA and XRD (ESI, Fig. S1 and S2,† respectively).Formation of PTI in DMSO solutions
In an N2 filled glovebox, dried LiBr·PTI or IF-PTI was placed in a vial, and anhydrous DMSO was added carefully to avoid agitation of the powder. The mixture was left for 2 weeks to give an orange liquid, of which the top ∼1 mL supernatant was decanted using a micropipette.Formation of PTI in DMSO–H2O mixtures
A 32 mg mL−1 loading LiBr·PTI solution was made as described above, and 500 μL was taken from the top of the solution by Eppendorf pipette, and diluted with 9.5 mL of fresh DMSO to give the 100:0 DMSO/H2O sample. Outside the glovebox, aliquots of this solution (1 mL) were further diluted with deionized water (333 μL and 9 mL, respectively) to provide the 75:25 and 10:90 (by volume) DMSO/H2O solutions examined in this study. We note that this procedure differs from direct exposure of the lithium halide-intercalated PTI solid to H2O, resulting in Li+/H+ ion exchange between the starting solid and the aqueous medium during the dissolution process, as studied by Schwinghammer et al.17 No obvious precipitation was seen upon dilution of the DMSO/PTI solution with H2O, even after 2 weeks at room temperature.
Formation and PL studies of PTI/DMSO–H2O glassy solids
PTI solutions in 100:0, 75:25, and 10:90 v/v DMSO:H2O were quenched with liquid nitrogen (LN2). To ensure rapid cooling, a 700 μL PL cell (Hella) was submerged in the LN2, making sure to prevent bubbles becoming trapped within the cell, before 500 μL of solution was added and the cell held submerged in LN2 for ∼60 seconds. To prevent build-up of ice from atmospheric water on the exterior of the cell, several precautions were taken for measuring the PL spectra. First, a beaker of silica desiccant was wrapped in anodised matte black aluminium foil, heated to 150 °C for 2 h before placing in the spectrofluorophotometer cuvette chamber away from the light-sample-detector paths, while the chamber was filled with dry N2 gas and closed. Dry N2 gas was blown over the cell during transfer from the LN2 bath to the (dry) chamber of the spectrofluorophotometer before immediately running the PL spectra.
Characterisation
UV-visible spectra were taken using a Shimadzu UV-2600 spectrometer between 200–750 nm (1.0 nm intervals) using 2.0 nm slit width and 0.1 s accumulation time period, in a 10 mm path length quartz glass cell.PL spectra were obtained using a Shimadzu RF-6000 spectrofluorophotometer with Xe arc lamp illumination, with 5 nm excitation and emission bandwidth. Excitation–emission wavelength scans were measured in a 1 mL quartz (4 × 10 mm) PL cell (Hella) with excitation from 250–800 nm (2 nm resolution), while measuring emission spectra over the same range and with the same resolution at 6000 nm min−1. For LN2 quenched samples, PL measurements were taken between 260–410 nm excitation with 50 nm resolution, and 250–800 nm emission with 2 nm resolution, at 12000 nm min−1. These more limited measurements were performed in lieu of full mappings to accelerate the measurement time (to 10 s) thus avoiding condensation ice build-up and limiting heating of the samples during the experiments.
7Li, 35Cl and 79Br NMR spectra of samples dissolved in DMSO-d6 were recorded using a Bruker AV III 400 spectrometer equipped with a broadband multinuclear probe at 298 K. Lithium and halide NMR measurements were performed on the same samples. 7Li and 35Cl chemical shifts are measured relative to 7Li and 35Cl chemical shifts of LiCl dissolved in DMSO-d6. 79Br chemical shifts are measured relative to 79Br chemical shifts of LiBr dissolved in DMSO-d6.
ICP-MS was performed on a Varian 720 ICP-AES. Solutions were diluted 100× and 1000× into 1 M nitric acid for Br and Li measurements respectively. Measurements were calibrated against a 40 ppb LiBr/1 M nitric acid standard which was run 3 times prior to sample measurements and after every 3 samples to monitor sensitivity drift. Blank 1 M nitric acid was run three times between each calibration measurement, and once between each sample. 7Li and 81Br values were used for quantification, with 6Li and 79Br values also measured and provided in the ESI.†
Thermogravimetric analysis was performed on a Perkin Elmer Pyris 1 TGA instrument under 60 mL min−1 flow of air, with an initial 10 min hold at 100 °C to remove adsorbed water, before heating to 850 °C with a heating rate of 10 °C min−1. Data is normalised to the final weight before the heating stage.
XRD was performed on a Malvern PANalytical X'pert Pro using a Cu Kα source between 0–70° 2θ.
SEM studies of samples were performed by placing samples on conducting carbon tape and sputtering with gold. Micrographs were obtained using a JEOL JSM-6700F field emission instrument.
Transient absorption (TA) spectroscopy was performed at the Lord Porter Laser Laboratory, University of Sheffield. A Ti:Sapphire regenerative amplifier (Spitfire ACE PA-40, SpectraPhysics) which produces 800 nm pulses (40 fs FWHM, 10 kHz, 1.2 mJ) was used as main laser source. A 400 nm pump excitation was generated using second harmonic generation of the 800 nm output in a β-BBO crystal within a commercially available higher harmonic generator (TimePlate, Photop Technologies). Excitation at 350 nm was performed using a commercial optical parametric amplifier (TOPAS-Prime). Only 2% of the amplifier output was used to generate white light super-continuum probe pulses by focusing the 800 nm beam on a CaF2 crystal (in the range 340–790 nm). Detection was achieved using a commercial transient absorption spectrometer (Helios, Ultrafast Systems), which includes a CMOS sensor for the UV-vis spectral range. The relative polarisation of the pump and probe pulses was set at the magic angle (54.7°). The residual 800 nm signal from the probe was removed using a hot mirror (800 nm, 00 deg AOI) before the sample. Temporal resolution of was on the order of 150 fs, measured from the cross correlation between pump and probe. Solutions were held in 2 mm path length quartz cells and were continuously stirred during experiments using a magnetic stirring system.
DFT calculations
Density functional theory (DFT) calculations were performed with CRYSTAL17 using the hybrid exchange B3LYP functional and all-electron split valence plus polarisation basis set for all atoms.29 A PTI slab composed of three atomic layers and overall composition C18N27H9 was cleaved from the bulk PTI structure and described with periodic boundaries along the a and b axes. Both AA′A and ABA layer stackings of IF-PTI were investigated. LiBr·PTI was created by including one lithium and one bromine ion in each slab unit cell, either in the same (LiBr(a)·PTI) or in adjacent (LiBr(x)·PTI) interlayer galleries. The intercalation of LiBr to form LiBr(a)·PTI was more favourable than LiBr(x)·PTI formation (ESI, Fig. S4 & Table S1†). Analogous calculations using LiCl, KCl, and KBr were also performed and these demonstrated that it is energetically unfavourable to intercalate potassium salts regardless of charge-balancing anion or relative arrangement in the layers, explaining the observation that only the lithium component of the eutectic salt bath intercalates the product. LiCl intercalation is also favourable and prefers the same interlayer gallery to form LiCl(a)·PTI, akin to LiBr. Exfoliation energies were calculated as the difference in energy between the slab cell representing the PTI trilayer, and the sum of cells representing a separate monolayer and bilayer. Values are presented in eV per unit cell of the trilayer slab (ESI Table S1†). In presence of LiBr, the lowest energy configuration for both trilayer and bilayer slabs has been employed.Results and discussion
Intrinsic solubility of PTI sheets
While several solvents are known to be suitable for the thermodynamically driven dissolution of PTI, use of DMSO leads to the highest solute concentrations at room temperature,24 so was selected as the solvent for this study. Dissolving LiBr·PTI in DMSO with a range of initial loadings (i.e., mass of initially added material per volume added solvent) shows a linear dependence, with higher loadings increasing the optical absorbance (Fig. 2). Measurements are complicated by features overlapping with solvent absorbance, but the concentration can be seen to rise through the increase of the peak tail absorption (ESI, Fig. S5,†ca. 350–500 nm). Total yields of dissolution are known to be low (evident through a significant undissolved solid fraction) and the DMSO is difficult to remove completely, complicating quantification of concentrations. The co-dissolution of intercalated LiBr during the dissolution of LiBr·PTI provides a window into the behaviour of the dissolved system. Through inductively coupled plasma mass spectrometry (ICP-MS, ESI, Fig. S6 & Table S2†), the concentrations of dissolved lithium and bromine were monitored. Both Li and Br concentrations increase linearly with LiBr·PTI loading, accounting for ∼3% of the total initial LiBr mass present in the LiBr·PTI. The ions in solution must be freed from the solid LiBr·PTI during sheet exfoliation to exist either as free ions in solution or associated with the dissolved sheets, both of which are measured simultaneously in ICP-MS. As not all LiBr in the system is seen in solution, and concentrations are significantly below saturation in DMSO30 (∼3.1 M), it can be assumed the ions are not derived from deintercalation of the salts from the solid material to give solid IF-PTI and solvated Li/Br ions, as seen for aqueous Soxhlet extraction.15 Instead, Li and Br in solution (regardless of whether the ions are PTI-associated/freely solvated) are likely to be due to being initially next to a PTI layer which is exfoliated into solution. The percentage of dissolved PTI is therefore assumed to match that of dissolved LiBr (i.e. 3%), allowing an indirect quantification of dissolution. | ||
| Fig. 2 UV-vis absorbance at 350 nm for LiBr·PTI and IF-PTI in DMSO with 1 cm pathlength, corrected for 20× dilution. Full UV-vis data and trends of absorbance versus weight of PTI component provided in the ESI (Fig. S5†). | ||
The properties of the PTI in solution were probed in more depth using TA spectroscopy (Fig. 3a) of the solution from 1 mg mL−1 loading LiBr·PTI. These spectra exhibit negative differential absorbance at 400–450 nm attributed to stimulated emission and ground state bleaching. Between 450–700 nm, the differential absorbance is positive (with two broad peaks centred around ∼535 nm and 641 nm) representative of excited state absorption. The normalised probe kinetics (Fig. 3b) obey stretched exponential decay (eqn (1)) with a lifetime (τ) of 0.21 ± 0.02 ps and heterogeneity function (β) of 0.12. This behaviour differs significantly from thermolytic carbon nitrides which exhibit signature power law decay31 kinetics.
 | (1) |
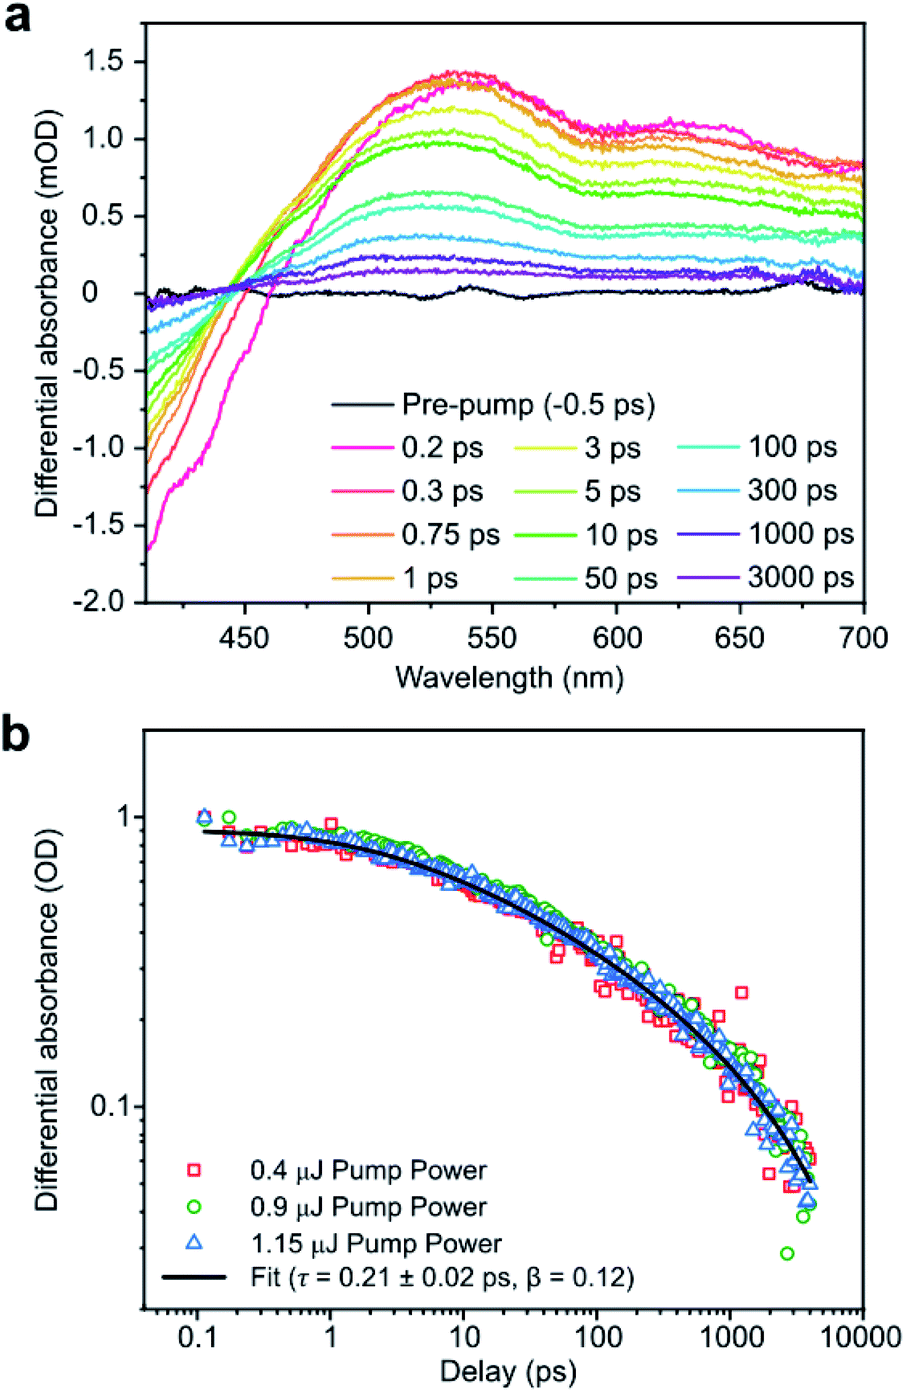 | ||
| Fig. 3 (a) TA spectra of 1 mg mL−1 loading LiBr·PTI solution at 400 nm excitation and 0.9 μJ average pulse energy. (b) Normalized probe kinetics at 505 nm (400 nm excitation) at various pump powers, with fitted stretched exponential. | ||
As β is less than unity, the system must possess multiple relaxation pathways.32 As the kinetics are independent of pulse energy (Fig. 3b), the additional pathways cannot be attributed to supplementary bi-molecular recombination,33 and instead must indicate that the sample is intrinsically heterogeneous. Sample heterogeneity is affirmed by modification of the TA spectral shape using 350 nm excitation (ESI, Fig. S7a†), although elucidation of the actual physical relaxation mechanisms and the nature of quasiparticles involved will require further investigations.
Support for heterogeneity of the solutions and dispersions as a function of concentration can be seen in two-dimensional (2D) photoexcitation-photoluminescence (PE-PL) maps of the LiBr·PTI solutions (Fig. 4). Interestingly, the PL properties of LiBr·PTI in DMSO vary with the concentration of the solution. At low concentration (1 mg mL−1 loading) we observe a result similar to that reported previously for the PTI nanosheets dissolved in DMF,24 with a narrow emission band 350–440 nm (maximized at 380 nm) excited by radiation between 250–270 nm. However, the result obtained for more concentrated samples (16 mg mL−1 loading) resembles that observed for solid PTI films deposited from DMF solution,24 with broad band emission extending between 350–550 nm maximized between 420–490 nm excited by wavelengths from 270–420 nm. Although the broad PL response dominates the 2D PE-PL map, the narrow signal excited by UV wavelengths remains visible as a separate contribution with its intensity unchanged between the different concentrations (Fig. 4b). Our conclusion is that at high concentrations, the solution contains a broad distribution of multiply-stacked PTI sheets, whereas at low concentrations the dissolved PTI nanomaterials consist of only very few-layer (e.g., 1–5) nanosheets.24 The few-layer nanosheets persist within the more concentrated liquid samples, where the PL intensity becomes dominated by the distribution of thicker nanolayered materials that appears to constitute a separate component that emerges as the solution becomes more concentrated. This behaviour contrasts with other spontaneously soluble 2D materials which delaminate in solution to give purely monolayer species.26,34
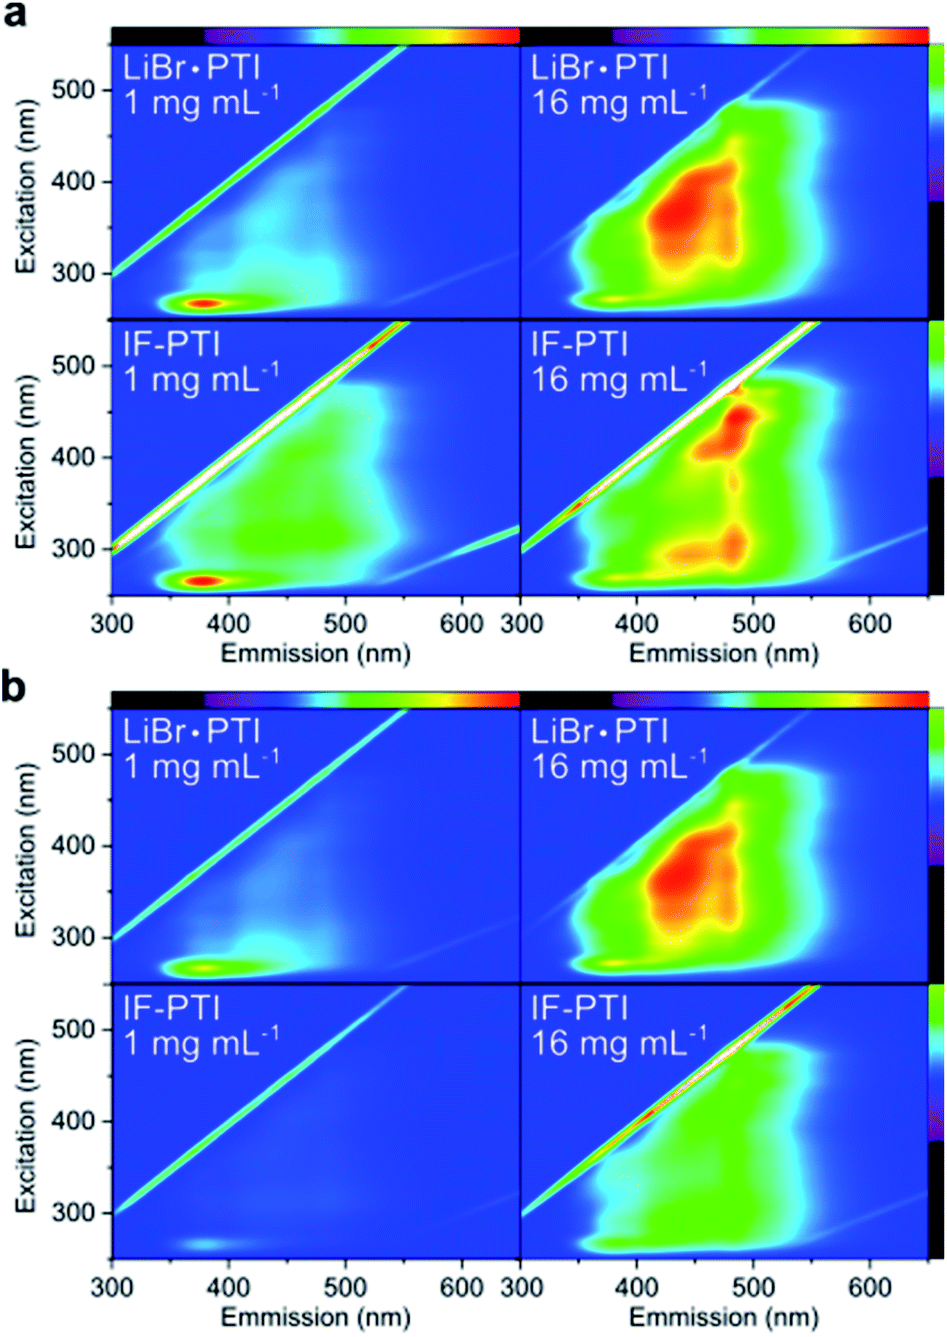 | ||
| Fig. 4 PE-PL maps for LiBr·PTI and IF-PTI at 1 mg mL−1 and 16 mg mL−1 loading, with visible spectrum of emission/exciting wavelengths shown top/right respectively. Data normalised (a) to highest non-elastic scatter in each sample and (b) to most intense peak in LiBr·PTI 16 mg mL−1 to give universal z-scale. | ||
The nature of the solvated PTI sheets is dependent on the state of the Li and Br ions, which may be associated to the PTI sheets. In particular, excess lithium from the initial synthesis reaction, found at deprotonated imide bridges may either be associated to the PTI as neutral C6N9H(3−x)Lix units, or dissociated [C6N9H(3−x)]x− species to give rise to anionic PTI sheets. Nuclear magnetic resonance (NMR) spectroscopy of dissolved LiBr·PTI provides a route to monitor the presence of dissociated solvated ions (ions that remain bound to PTI layers will produce signals that are broadened beyond instrumental resolution by dipolar coupling, quadrupolar interactions, and chemical shift anisotropy effects). The LiBr·PTI solutions show distinct sharp signals (ESI, Fig. S8,†7Li 0.08 ppm, 79Br 3.42 ppm) with negligible shifts from pure LiBr dissolved in the same solvent (7Li −0.09 ppm, 79Br 0.00 ppm) confirming the presence of solvated Li+ and Br− ions. The Li:Br ratio could not be calculated precisely due to the low signal to noise ratio in the 79Br NMR experiments; however, 35Cl/7Li NMR intensities of the analogous LiCl·PTI system (versus LiCl salt) allowed an estimate of solvated Cl−/Li+ ratio of ∼1.4:1 (ESI, Fig. S9†) indicating that an excess of chlorine is present in solution. This indicates that not only in-plane substituted lithium, but a fraction of the intercalated lithium (charge balanced by cointercalated Cl− in the initial solid) remains associated with the PTI sheets to give cationic [C6N9H(3−x)Li(x+y)]y+ solvated species with zLi+ and (y + z)Cl− in solution. With this new understanding, PTI solubility may be attributable to either contribution of the positive charge, akin to negatively charged graphene,35 or intrinsic neutral PTI (C6N9H3) solubility. Here, recent results on deintercalation to intercalant-free (IF-)PTI materials provide an ideal mono-component control to test PTI solubility. During deintercalation, both intercalated Li/Br components and in-plane lithium substitutions are entirely removed to give a pure C6N9H3 layered PTI system.15
For these studies, LiBr·PTI was deintercalated and dried to form IF-PTI and placed in anhydrous DMSO while maintaining the samples in a dry environment. Rigorously dry conditions are required to maintain the intercalant-free nature, as exposure of IF-PTI to ambient atmosphere leads to uptake and subsequent intercalation of water from the atmosphere, as seen in XRD (ESI, Fig. S2a†). In all cases, the IF-PTI could be seen to dissolve spontaneously by observation of a yellow dissolution front extending above the solid phase in the absence of any agitation, indicating that PTI layers are intrinsically soluble. UV-vis spectroscopy showed a similar linear trend of loading with concentration to LiBr·PTI dissolution, again indicating that neutral IF-PTI has intrinsic solubility in DMSO, but at lower concentrations across all loadings. The PE-PL maps of IF-PTI at similar loadings likewise show similar trends to LiBr·PTI (Fig. 4), with the intense sharp signal due to few-stacked layers dominating at low loading (1 mg mL−1). However, in this case the redshifted bands attributed to more-stacked species are more clearly visible, implying a less efficient exfoliation process. Similarly, for the 16 mg mL−1 loading of the IF-PTI sample, the most highly red-shifted emitting signal (centred at ∼480 nm) dominate with the lowest wavelength features being most prominent. The more dramatic red-shifting features also indicate that IF-PTI does not exfoliate into few-layered sheet units as readily as LiBr·PTI and so more highly stacked materials are present in the liquid phase, supporting the observation of less efficient overall dissolution of IF-PTI than LiBr·PTI in DMSO. The absolute intensity of these IF-PTI PL signals is also lower than for LiBr·PTI solutions (Fig. 4b) supporting the lower concentrations indicated by UV-vis spectroscopy (Fig. 2). Thus, while the presence of LiBr is not essential for spontaneous exfoliation and solvation of highly ordered PTI layers, it certainly appears to facilitate these processes.
The intrinsic optoelectronic properties of the IF-PTI were probed by TA spectroscopy (ESI, Fig. S7b–d†). The general behaviour with 400 nm excitation (ESI Fig. S7b†) showed overlap with the behaviour of the LiBr·PTI, with an initial negative differential behaviour at shorter wavelengths and two broad peaks indicative of excited state absorption at longer wavelengths. The subtleties of the features vary between the samples however, with better defined constituent peaks within the broad positive differential features seen for the IF-PTI, more similar to LiBr·PTI pumped with 350 nm excitation. Additionally, the isosbestic points for both 400 nm excited IF-PTI and 350 nm excited LiBr·PTI redshift with increasing time, an effect attributed in graphene/graphene oxide to a reduction of sub-Fermi level occupation due to the heating of electron plasma with increased pump pulse energy.36,37 However, for 400 nm excited LiBr·PTI (Fig. 3a), this shift is absent with the isosbestic point remaining constant at ca. 450 nm during decay. More detailed studies are required to identify the originating quasiparticle behaviour and mechanistic differences between the systems. The kinetics of the TA decay for IF-PTI (ESI, Fig. S7c and d†) show the clear stretched exponential decay, akin to LiBr·PTI, albeit with slower decay behaviour (τ = 1.32 ps). Heterogeneity of the IF-PTI is still evident (β = 0.21 with pump power-independent kinetics) but is less dispersed than the LiBr·PTI. It is unclear if the lessened heterogeneity is due to a more monodisperse distribution of stacking, or the presence of a broad distribution of many-layered species which behave the same optically.
To further investigate the origin of the preferential exfoliation of LiBr·PTI versus IF-PTI, exfoliation energies were calculated for both species using DFT methods. The exfoliation energy of IF-PTI was not significantly affected by stacking order (AA′ 0.22 eV, AB 0.19 eV). The LiBr·PTI constitutes a more stable conformation than isolated PTI and LiBr crystals (by −0.52 eV, ESI Table S1†), and the intercalation of LiBr effectively pins the adjacent layers, increasing the exfoliation energy (0.41 eV). However, this pinning effect is localised, as shown by exfoliation of an unintercalated PTI layer adjacent to LiBr-containing layers requiring similar energy (0.23 eV) to the IF-PTI. This localisation prevents long-range electrostatics of a bulk LiBr·PTI crystal hindering exfoliation of the top layer into solution, and the solvation energy38 of LiBr into DMSO (−9.03 eV) is significantly higher than the increased cost of the pinning. Because the direct exfoliation energy of LiBr·PTI is greater than that of IF-PTI, the exfoliation process does not likely involve a parallel separation of PTI sheets, but must involve gradual exposure of the LiBr-containing galleries, e.g. by parallel slipping or peeling away of successive layer(s), accompanied by gradual dissolution of the newly exposed Li/Br ions, which remain far below the LiBr solubility limit in DMSO.30
Exfoliation and dissolution of PTI in DMSO/water mixtures
The dissolution experiments in DMSO described here were performed under stringently dry conditions, to avoid complications from the extremely hygroscopic character of this solvent. The presence of water in a solvent has been shown to prevent effective LiCl·PTI exfoliation in DMAc solutions previously.12 To monitor the impact of water on solvated PTI, water was added to a pre-exfoliated LiBr·PTI DMSO solution to give a 75:25 DMSO/water mixture. The PL signature changed immediately and dramatically (Fig. 5), leaving only a single narrow emission band between ca. 340–430 nm (maximum at 360–380 nm). We interpret this result as demonstrating that addition of H2O to the DMSO solvent results in a dramatic alteration to the nature of the multi-layer PTI nanosheets present in the higher concentrated solution, with the aqueous component causing further exfoliation to result in the few-layered nanosheets observed in the initial phase to give rise to low solvated concentrations. We propose that the H2O plays a key chemical role in separating the PTI nanosheets when it is placed in contact with the LiBr·PTI solid. Schwinghammer et al.17 have shown that when the related LiCl·PTI compound is exposed to pure H2O they observed an increase in pH and a negative PTI surface potential during the dissolution process, indicating exchange of Li+ and H+ ions between the PTI material and the aqueous solvent, causing an increase in the OH− concentration. In our case, LiBr·PTI was initially placed in contact with anhydrous DMSO, which is aprotic and therefore does not permit such Brønsted acid–base reactions. The addition of water to the liquid solution must facilitate this ionic exchange process with the predissolved PTI, with the resultant basic solution likely further driving deprotonation of imide bridges to increase PTI surface anionic charge and aid exfoliation.
 | ||
| Fig. 5 (Top) PE-PL maps normalised to highest (non-elastic scatter) peak for PTI solutions in (from left to right) pure DMSO, 75:25, and 10:90 DMSO/H2O. Visible spectrum representations of excitation/emission wavelengths provided right/top, respectively. White dashed lines used to indicate excitation wavelengths used in glass-forming quenching experiments (260, 310, 360, and 460 nm). (Bottom) Fluorescence spectra with 310 and 410 nm excitation, normalised to the elastic scatter peak. (From top to bottom) 100:0, 75:25, 10:90 DMSO/H2O v/v PTI solutions. Samples measured at room temperature (solid) and immediately after liquid nitrogen quenching (dashed), and after 2 min ambient warming of the cooled glass for 75:25 DMSO/water (dotted). Data including 260 and 360 nm excitation provided in the ESI (Fig. S11†). | ||
While it is unclear if the PTI in DMSO/water mixture leads to a thermodynamically stable solution or a kinetically trapped dispersion, the PTI remained in the liquid phase without precipitation for over a month. The intrinsic stability of PTI in water/DMSO mixtures opens a route to trapping these PL active species in the amorphous solid state based on the well-known glass-forming ability of DMSO–H2O liquid compositions. Previously, casting PTI-bearing films has resulted in restacking of PTI sheets, altering the optical properties.24 DMSO-water mixtures are known to vitrify39 within a window of 20–60 weight percent (22–62 vol%) following quenching from room temperature into liquid nitrogen (LN2). After quenching solutions in LN2, the 75:25 PTI solution produced an optically transparent pale yellow glass, while solutions in pure DMSO (100:0) and a water-rich 10:90 control mixture gave rise to polycrystalline material (ESI, Fig. S10†). The glass formed from the 75:25 solution showed a PL signature at LN2 temperature that was nearly identical to that for the solution phase recorded at ambient (Fig. 5). Unlike the 75:25 glass, the polycrystalline 100:0 and 10:90 quenched solids only exhibited a weak PL signal at low wavelength (260 nm). This result demonstrates that rapid quenching in LN2 to form an optically homogeneous glass preserves the PTI layer distribution, while avoiding significant loss of the PL signal due to scattering effects. The importance of the glassy matrix was confirmed by allowing the 75:25 glass to warm for ca. 2 min, leading to a cold crystallisation and loss of the PL signal (Fig. 5). Upon completion of melting for all three samples, the PL emission profile returned to that of the initial solution phase, demonstrating that no re-stacking and no precipitation of the PTI nanosheets had occurred during the rapid solvent crystallization/vitrification processes.
Conclusions
The dissolution of 2D PTI nanosheets can be seen to be a complex process. The sheets disperse with a range of stackings, with higher concentrations leading to a greater degree of stacking in solution. While the PTI sheets are intrinsically soluble in DMSO, the presence of intercalating LiBr leads to both a higher yield of dissolution and a higher fraction of monolayer species in solution (despite increasing inter-layer adhesion). The improved exfoliation is thought to be due to the added thermodynamic benefit from the salt solvation, and potentially opens the way to tailoring the degree of exfoliation through introducing new intercalants. Alternatively, the material may be exfoliated further by addition of water to the existing solution which promotes exfoliation of solvated multi-layer species.The modification of the distribution of stackings in solution dramatically alters the photoluminescent properties of the PTI solutions. The quasiparticle mechanics underlying the photoluminescence are complex owing to the heterogeneous nature of the solutions but are notably distinct from thermolysis-derived, polymeric carbon nitride materials studied in most previous investigations. Further, the PL properties may be maintained through vitrification of the solvent, allowing access to photoluminescent solids with PL behaviour consistent with the parent solution, in contrast to typical film-casting experiments which lead to restacking of the sheets.
Author contributions
Sample synthesis was performed by A. J. C., T. M. S., and T. S. M., with dissolution, PL, ICP, UV, and TGA performed by A. J. C. NMR studies were performed by A. E. A. DFT calculations were performed by V. B. & F. C. TA measurements and interpretation was performed by S. B. & A. A. P. C. Vitrification PL was performed by A. J. C. & A. T. Research conception was performed by A. J. C., C. A. H. & P. F. M. with significant input from F. C., T. M. S. & T. S. M. All authors contributed to manuscript preparation.Conflicts of interest
There are no conflicts to declare.Acknowledgements
AJC would like to thank The Society of Chemical Industry and the Ramsay Fellowship Fund. TSM was funded by EPSRC under EP/P023851/1. AJC, TMS, CAH & PFM received funding from the EU Graphene Flagship under Horizon 2020 Research and Innovation program grant agreement no. 785219-GrapheneCore2 and 881603-GrapheneCore3. AAPC and SB are grateful to EPSRC for their support via EP/R045305/1 and EP/R042802/1. Thanks are also extended to Dr Stefan Guldin for access to his laboratory and equipment during this work, and Joshua Crowther for his help with the TA spectroscopy measurements.References
- T. S. Miller, A. B. Jorge, T. M. Suter, A. Sella, F. Corà and P. F. McMillan, Phys. Chem. Chem. Phys., 2017, 19, 15613–15638 RSC
.
- N. Tian, H. Huang, X. Du, F. Dong and Y. Zhang, J. Mater. Chem. A, 2019, 7, 11584–11612 RSC
- A. B. Jorge, D. J. Martin, M. T. Dhanoa, A. S. Rahman, N. Makwana, J. Tang, A. Sella, F. Corá, S. Firth and J. A. Darr, J. Phys. Chem. C, 2013, 117, 7178–7185 CrossRef CAS
- X. Zou, Z. Sun and Y. H. Hu, J. Mater. Chem. A, 2020, 8, 21474–21502 RSC
- L. Zhou, Y. Xu, W. Yu, X. Guo, S. Yu, J. Zhang and C. Li, J. Mater. Chem. A, 2016, 4, 8000–8004 RSC
- J. Lin, Z. Pan and X. Wang, ACS Sustainable Chem. Eng., 2014, 2, 353–358 CrossRef CAS
- Y. Ran, X. Yu, J. Liu, J. Cui, J. Wang, L. Wang, Y. Zhang, X. Xiang and J. Ye, J. Mater. Chem. A, 2020, 8, 13292–13298 RSC
- E. Negro, A. Nale, K. Vezzù, G. Pagot, S. Polizzi, R. Bertoncello, A. Ansaldo, M. Prato, F. Bonaccorso and I. A. Rutkowska, Electrochim. Acta, 2018, 280, 149–162 CrossRef CAS
- V. Di Noto, E. Negro, A. Nale, P. J. Kulesza, I. A. Rutkowska, K. Vezzù and G. Pagot, Electrocatal, 2020, 11, 143–159 CrossRef CAS
- E. Wirnhier, M. Döblinger, D. Gunzelmann, J. Senker, B. V. Lotsch and W. Schnick, Chem.–Eur. J., 2011, 17, 3213–3221 CrossRef CAS
- M. J. Bojdys, J. O. Müller, M. Antonietti and A. Thomas, Chem.–Eur. J., 2008, 14, 8177–8182 CrossRef CAS
- L. F. Villalobos, M. T. Vahdat, M. Dakhchoune, Z. Nadizadeh, M. Mensi, E. Oveisi, D. Campi, N. Marzari and K. V. Agrawal, Sci. Adv., 2020, 6, eaay9851 CrossRef CAS
- E. Wirnhier, M. Döblinger, D. Gunzelmann, J. Senker, B. V. Lotsch and W. Schnick, Chem.–Eur. J., 2011, 17, 3213–3221 CrossRef CAS
- M. B. Mesch, K. Bärwinkel, Y. Krysiak, C. Martineau, F. Taulelle, R. B. Neder, U. Kolb and J. Senker, Chem.–Eur. J., 2016, 22, 16878–16890 CrossRef CAS
- T. M. Suter, T. S. Miller, J. K. Cockcroft, A. E. Aliev, M. C. Wilding, A. Sella, F. Corà, C. A. Howard and P. F. McMillan, Chem. Sci., 2018, 10, 2519–2528 RSC
- F. Foglia, A. J. Clancy, J. Berry-Gair, K. Lisowska, M. C. Wilding, T. M. Suter, T. S. Miller, K. Smith, F. Demmel and M. Appel, Sci. Adv., 2020, 6, eabb6011 CrossRef CAS
- K. Schwinghammer, M. B. Mesch, V. Duppel, C. Ziegler, J. r. Senker and B. V. Lotsch, J. Am. Chem. Soc., 2014, 136, 1730–1733 CrossRef CAS
- S. Yang, Y. Gong, J. Zhang, L. Zhan, L. Ma, Z. Fang, R. Vajtai, X. Wang and P. M. Ajayan, Adv. Mater., 2013, 25, 2452–2456 CrossRef CAS
- J. Zhang, M. Zhang, L. Lin and X. Wang, Angew. Chem., 2015, 127, 6395–6399 CrossRef
- Z. Zhou, J. Wang, J. Yu, Y. Shen, Y. Li, A. Liu, S. Liu and Y. Zhang, J. Am. Chem. Soc., 2015, 137, 2179–2182 CrossRef CAS
- C. Huang, J. Wen, Y. Shen, F. He, L. Mi, Z. Gan, J. Ma, S. Liu, H. Ma and Y. Zhang, Chem. Sci., 2018, 9, 7912–7915 RSC
- L. Zhang, D. Liu, J. Guan, X. Chen, X. Guo, F. Zhao, T. Hou and X. Mu, Mater. Res. Bull., 2014, 59, 84–92 CrossRef CAS
- R. Lin, Z. Li, D. I. Abou El Amaiem, B. Zhang, D. J. Brett, G. He and I. P. Parkin, J. Mater. Chem. A, 2017, 5, 25545–25554 RSC
- T. S. Miller, T. M. Suter, A. M. Telford, L. Picco, O. D. Payton, F. Russell-Pavier, P. L. Cullen, A. Sella, M. S. P. Shaffer, J. Nelson, V. Tileli, P. F. McMillan and C. A. Howard, Nano Lett., 2017, 17, 5891–5896 CrossRef CAS
- C. Backes, T. M. Higgins, A. Kelly, C. Boland, A. Harvey, D. Hanlon and J. N. Coleman, Chem. Mater., 2017, 29, 243–255 CrossRef CAS
- A. J. Clancy, M. K. Bayazit, S. A. Hodge, N. T. Skipper, C. A. Howard and M. S. Shaffer, Chem. Rev., 2018, 118, 7363–7408 CrossRef CAS
- N. Behabtu, J. R. Lomeda, M. J. Green, A. L. Higginbotham, A. Sinitskii, D. V. Kosynkin, D. Tsentalovich, A. N. G. Parra-Vasquez, J. Schmidt and E. Kesselman, Nat. Nanotechnol., 2010, 5, 406–411 CrossRef CAS
- J. Jia, E. R. White, A. J. Clancy, N. Rubio, T. Suter, T. S. Miller, K. McColl, P. F. McMillan, V. Brázdová and F. Corà, Angew. Chem., 2018, 130, 12838–12842 CrossRef
- R. Dovesi, A. Erba, R. Orlando, C. M. Zicovich-Wilson, B. Civalleri, L. Maschio, M. Rérat, S. Casassa, J. Baima and S. Salustro, Wiley Interdiscip. Rev.: Comput. Mol. Sci., 2018, 8, e1360 Search PubMed
- N. Xin, Y. Sun, M. He, C. J. Radke and J. M. Prausnitz, Fluid Phase Equilib., 2018, 461, 1–7 CrossRef CAS
- C. Merschjann, S. Tschierlei, T. Tyborski, K. Kailasam, S. Orthmann, D. Hollmann, T. Schedel-Niedrig, A. Thomas and S. Lochbrunner, Adv. Mater., 2015, 27, 7993–7999 CrossRef CAS
- D. Johnston, Phys. Rev. B: Condens. Matter Mater. Phys., 2006, 74, 184430 CrossRef
- T. J. Miao and J. Tang, J. Chem. Phys., 2020, 152, 194201 CrossRef CAS
- P. L. Cullen, K. M. Cox, M. K. B. Subhan, L. Picco, O. D. Payton, D. J. Buckley, T. S. Miller, S. A. Hodge, N. T. Skipper and V. Tileli, Nat. Chem., 2017, 9, 244–249 CrossRef CAS
- T. Morishita, A. J. Clancy and M. S. Shaffer, J. Mater. Chem. A, 2014, 2, 15022–15028 RSC
- D. Sun, Z.-K. Wu, C. Divin, X. Li, C. Berger, W. A. de Heer, P. N. First and T. B. Norris, Phys. Rev. Lett., 2008, 101, 157402 CrossRef
- S. Bhattacharya, A. Ghorai, S. Raval, M. Karmakar, A. Midya, S. K. Ray and P. K. Datta, Carbon, 2018, 134, 80–91 CrossRef CAS
- P. Kruus and B. E. Poppe, Can. J. Chem., 1979, 57, 538–551 CrossRef CAS
- D. H. Raussen and A. P. Mackenzie, Nature, 1968, 220, 1315–1317 CrossRef
Footnote |
| † Electronic supplementary information (ESI) available. See DOI: 10.1039/d0ta11070a |
| This journal is © The Royal Society of Chemistry 2021 |