 Open Access Article
Creative Commons Attribution 3.0 Unported Licence
Phase formation through synthetic control: polymorphism in the sodium-ion solid electrolyte Na4P2S6†
Tanja
Scholz‡
 a,
Christian
Schneider‡
 a,
Roland
Eger
a,
Viola
Duppel
a,
Igor
Moudrakovski
a,
Roland
Eger
a,
Viola
Duppel
a,
Igor
Moudrakovski
 a,
Armin
Schulz
a,
Jürgen
Nuss
a,
Armin
Schulz
a,
Jürgen
Nuss
 a and
Bettina V.
Lotsch
 *ab
*ab
aMax Planck Institute for Solid State Research, Heisenbergstraße 1, 70569 Stuttgart, Germany. E-mail: b.lotsch@fkf.mpg.de
bLMU Munich, Butenandstraße 5-13, 81377 Munich, Germany
First published on 10th March 2021
Abstract
The development of all-solid-state sodium batteries for scalable energy storage solutions requires fast sodium conducting solid electrolytes. To fast-track their discovery, candidate materials need to be identified that are synthesized from abundant resources via cheap and green synthesis routes. Their ion conducting mechanism has to be understood and adapted to meet the stringent requirements for long-term operation in all-solid-state batteries. Here, structure and properties of the sodium hexathiohypodiphosphate Na4P2S6 obtained by two different synthesis methods are compared: a solid-state reaction and a precipitation route from aqueous solution. Combined investigations using powder X-ray diffraction (PXRD), precession electron diffraction (PED), differential scanning calorimetry (DSC), solid-state nuclear magnetic resonance spectroscopy (ssNMR), and Raman spectroscopy reveal that the solid-state synthesized material is characterized by a Na+ and vacancy disorder-driven enantiotropic phase transition at 160 °C (α- to β-Na4P2S6), which is accompanied by a symmetry change of the P2S64− anion. Precipitated Na4P2S6 already crystallizes in a β-like polymorph at room temperature, likely assisted by inter- and intralayer defects. Bond-valence and nudged elastic band (NEB) calculations were employed to identify a low energy, 2D conduction network in β-Na4P2S6, suggesting facile 2D long-range Na+ diffusion. Electrochemical impedance spectroscopy reveals a higher ionic conductivity at room temperature in precipitated β-like Na4P2S6 (2 × 10⁻⁶ S cm−1) compared to the solid-state α polymorph (7 × 10⁻⁷ S cm−1). The activation energy is around 0.4 eV for both materials. The findings highlight that even subtle structural changes can significantly impact the sodium-ion diffusion in solid electrolytes and at the same time reveal an intricate interplay between phase formation and synthetic control.
Introduction
All-solid-state batteries based on solid electrolytes as core components have emerged as potential alternatives to state-of-the-art lithium ion batteries that have become indispensable in powering our modern-day society. Especially in the critical areas of electromobility and renewable energy storage where conventional concepts cannot keep up with the ever-growing energy requirements, solid-state batteries promise improved power and energy density as well as safety and versatile cell geometries. For some applications such as stationary, large-scale energy storage where the critical geo-political abundance and cost of lithium are the most pressing issues, rechargeable sodium-ion batteries promise to be a viable alternative. This has revitalized intense research on sodium-ion conducting materials for solid electrolytes.1–3 However, in order to increase the number of competitive Na+ solid electrolytes, candidate materials need to be identified that are synthesized from abundant resources (e.g. sulphur and phosphorus) via cheap and green synthesis routes, and their ion conduction mechanisms need to be understood and adapted to meet the stringent requirements for long-term operation in all-solid-state batteries.Historically, well-known Na+ solid electrolytes are Na–β-Al2O3 (ref. 4) and the NaSICON family5,6 that both typically use operating temperatures of about 300 °C to provide sufficiently high ion mobilities.3 In the last years, superionic polyborates of closo-borate anions BnHn2− such as Na2(B12H12)0.5(B10H10)0.5 have attracted much attention as they offer promising room temperature conductivities as high as 0.9 mS cm−1.7,8
A new direction in Na+ solid electrolyte research opened up in 2012 when Hayashi et al. described the stabilization of the cubic β-sodium ortho-thiophosphate Na3PS4 phase in a “glass-ceramic” state at ambient temperature with an ionic conductivity of 0.2 mS cm−1 to 0.46 mS cm−1.9–11 That is an improvement by two orders of magnitude compared to the thermodynamically stable tetragonal α-Na3PS4 phase.12 Only recently, this compound hit yet another milestone when a second high temperature polymorph (γ) was described as a plastic crystal.13 The potential of thiophosphates as a material class for solid electrolytes is reflected in numerous studies that were able to further improve the ionic conductivity by substitution of phosphorus or sulphur in tetrahedral PS43−.14–18 Structural expansion, changing the polarizability, and creating Na+ interstitials and vacancies through iso- or aliovalent doping are common concepts to enhance ion mobility. Na2.9P0.9W0.1S4 and Na2.9Sb0.9W0.1S4 are the fastest ion conductors derived from the parent compound Na3PS4 known today with conductivities of 13 mS cm−1 and 41 mS cm−1, respectively.19,20
As portrayed by these works, the sodium thiophosphate family is a powerful material class for fast ion conduction and, more importantly, already proved functional in all-solid state batteries.9,10 Recently, Fritsch et al. studied the ionic conductivity and local structure of the sodium hexathiometadiphosphate Na2P2S6 (ref. 21) with a conductivity of 10−8 S cm−1 in the amorphous material obtained by a ball milling synthesis compared to 10−11 S cm−1 in the crystalline compound.22 The enhanced conductivity in the amorphous materials arises from sodium disorder and single PS43− tetrahedra incorporated in addition to P2S62−. Another superionic sulfide-based electrolyte with thiophosphate and thiostannate anions is Na11Sn2PS12.23,24 Its high conductivity of 4 mS cm−1 originates from significant intrinsic Na+ vacancies and a large variety of alternative three-dimensional pathways with similar migration barriers along different directions.
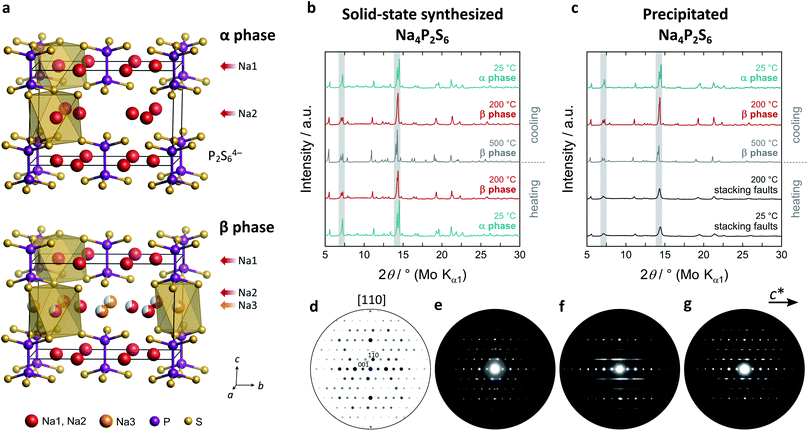
Sodium hexathiohypodiphosphate Na4P2S6, the compound discussed in this publication, was first mentioned in a study on precipitated Na4P2S6·6H2O as its dehydration product.25 The crystal structure was reported later by our group where Na4P2S6 was obtained via a solid-state synthesis.21 The main characteristic of the monoclinic structure is a layered arrangement of P2S64− anions in planes with an [ABC] stacking (cf.Fig. 1a and ESI†). In these planes and between them are two crystallographically different sodium ions, coordinated octahedrally by sulphur atoms. The molecular axes of the P2S64− anions are tilted by 4° from the layer normal while they are parallel in related compounds like FePS3. The P2S64− layer is reminiscent of a hexagonal pattern. This structure is unique among the alkali hexathiohypodiphosphates A4P2S6![[thin space (1/6-em)]](https://www.rsc.org/images/entities/char_2009.gif) :
:![[thin space (1/6-em)]](https://www.rsc.org/images/entities/char_2009.gif) Li4P2S6 is also a layered structure but with an [AA] stacking resulting in a different distribution of alkali ions between the layers, whereas K4P2S6 and Rb4P2S6 exhibit three-dimensional structures.21,26 Rush et al. modeled the Na+ ion dynamics of Na4P2S6 with DFT calculations and estimated a low activation energy of Ea ≈ 0.4 eV.27 A more recent comprehensive DFT study of the same group emphasizes the potential of Na4P2S6 as Na+ ionic conductor, stresses the low activation energy of the material, and reveals considerable Na+ ion motion in two dimensions in MD simulations.28 Indeed, for precipitated Na4P2S6 (via the hydrate) Hood showed a room temperature conductivity of 3.4 × 10⁻⁶ S cm−1 with Ea = 0.35 eV and pointed out that rehydration and subsequent dehydration does not impact the electrochemical performance, making this compound more compliant with battery applications.29 Based on our study, we assume that Na4P2S6 prepared by Hood is similar to our precipitated β-like samples.
Li4P2S6 is also a layered structure but with an [AA] stacking resulting in a different distribution of alkali ions between the layers, whereas K4P2S6 and Rb4P2S6 exhibit three-dimensional structures.21,26 Rush et al. modeled the Na+ ion dynamics of Na4P2S6 with DFT calculations and estimated a low activation energy of Ea ≈ 0.4 eV.27 A more recent comprehensive DFT study of the same group emphasizes the potential of Na4P2S6 as Na+ ionic conductor, stresses the low activation energy of the material, and reveals considerable Na+ ion motion in two dimensions in MD simulations.28 Indeed, for precipitated Na4P2S6 (via the hydrate) Hood showed a room temperature conductivity of 3.4 × 10⁻⁶ S cm−1 with Ea = 0.35 eV and pointed out that rehydration and subsequent dehydration does not impact the electrochemical performance, making this compound more compliant with battery applications.29 Based on our study, we assume that Na4P2S6 prepared by Hood is similar to our precipitated β-like samples.
In this paper, we compare the structure and properties of Na4P2S6 obtained by different synthesis routes and describe a new high-temperature polymorph (β) that has significant intrinsic Na+ vacancies and forms above 160 °C when synthesized via a solid-state route according to ref. 21. Combined investigations using powder X-ray diffraction (PXRD), differential scanning calorimetry (DSC), precession electron diffraction (PED), solid-state nuclear magnetic resonance spectroscopy (ssNMR), and Raman spectroscopy reveal that precipitated Na4P2S6via solution synthesis (cf. ref. 25), however, already crystallizes in a β-like polymorph at room temperature which is stabilized by subtle structural defects, e.g. stacking faults. A comprehensive mechanistic study based on bond valence energy landscape (BVEL) and nudged elastic band (NEB) calculations pinpoint how the ionic conductivity is influenced by structural changes upon the phase transition and the presence of Na+ vacancies. Electrochemical impedance spectroscopy measurements portray precipitated β-like Na4P2S6 as an ion conductor with a room-temperature conductivity of 2 × 10⁻⁶ S cm−1 and an activation energy of 0.4 eV while solid-state α-Na4P2S6 has a lower conductivity of 7 × 10⁻⁷ S cm−1 with a similar activation energy.
Results and discussion
Polymorphism in Na4P2S6
As a starting point to elucidate the phase formation and polymorphism of Na4P2S6, we synthesized Na4P2S6via two alternative synthesis routes – a solid-state route21 and by precipitation from aqueous solution.25 The high-temperature behavior of the as-obtained materials was investigated by PXRD (Fig. 1b and c). For the solid-state thiophosphate a phase transition appears at around 200 °C with a splitting of the reflection at 7° 2θ (Mo Kα1, indices (020) and (110)). The structure of this new high-temperature polymorph, dubbed β-Na4P2S6, is closely related to the low-temperature polymorph and crystallizes in the same space group C2/m (Fig. 1a). The phase transition is primarily characterized by the occupation of a new sodium position (Na3, Wyckoff position 2d) at the expense of Na2. The 2d position is an unoccupied, distorted S6 octahedral void in the α phase's van der Waals gap. Therefore, the phase transition generates an exceptionally high amount of intrinsic Na+ vacancies. Further, subtle structural changes such as in the distances and tilting of the P2S64− anions occur, which we discuss in detail below. Recently, Li et al. computationally predicted the 2d position to be the energetically most favorable interstitial site.28 Their MD simulations already suggest an involvement of this site in the Na+ migration path, and we present here experimental proof for the occupation of the Na3 position at elevated temperatures. Empty voids are also present in the structure of Li4P2S6, but they are capped by the P2S64− anion and their occupation is energetically much more unfavorable.26 β-Na4P2S6 is still observed at 500 °C and the α–β transition is reversible upon cooling.The precipitation route also gives a crystalline Na4P2S6 solid that is, however, characterized by broad reflections in the PXRD pattern that do not allow for the α–β differentiation. Upon heating no phase transition can be tracked by PXRD until about 500 °C where sharp reflections of the β phase occur. Cooling back to room temperature, however, the α phase develops into the annealed material. To unravel the differences of solid-state, precipitated, and annealed Na4P2S6, we recorded PED patterns that are presented in Fig. 1d–g. Note that the PED pattern of the solid-state Na4P2S6 was obtained from a sample that was additionally sublimed at 750 °C, since the recording of the desired direction was not feasible in the raw solid-state reaction product. This sample shows sharp reflections that are in agreement with those of a simulated pattern along the [110] zone axis. Contrary, diffuse scattering occurs as streaks in precipitated Na4P2S6. This indicates the presence of planar defects, which are located in the c direction, the stacking direction of the crystal structure. These defects modulate the layer distance and can stem from e.g. stacking faults, residual crystal water, and/or thiophosphate disorder. The remaining sharp reflections agree with the simulated pattern. The defects are largely healed in the annealed sample where the diffuse scattering is reduced in intensity and reflections become visible and are comparable to the solid-state product.
With the structural differences of the two synthesized samples roughly understood, DSC measurements, ssNMR experiments, and Raman spectroscopy were carried out to follow the α–β phase transition and elucidate the subtle structural differences.
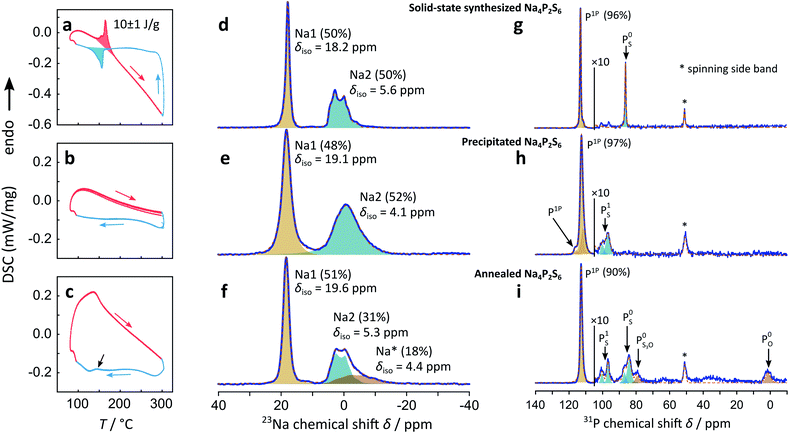
Precipitated Na4P2S6 shows a very different DSC thermogram, in fact, no sharp exothermic nor endothermic signal can be measured, suggesting that the phase transition is suppressed and that a β-like structure is stabilized already at room temperature. This observation holds for multiple cycles around the expected transition temperature.
In the above diffraction experiments annealed Na4P2S6 appears “healed” from stacking faults, however, its DSC signal shows no sharp peak around the temperature where we observe a signal for solid-state Na4P2S6, but rather a sharp kink of the DSC signal around 150 °C, compared to the precipitated sample shown in Fig. 2b. Cooling the sample, a smeared out thermal event appears at around 140 °C, indicated by a black arrow in Fig. 2c. Since this broad peak is absent in the precipitated sample, we assume it to originate from a sluggish phase transition with a low exchanged heat. This suggests a material with structural properties midway between those of the solid-state and precipitated samples.
Comparing the 23Na MAS spectrum of precipitated β-like with solid-state α-Na4P2S6 there is one notable difference: the resonance peaks for Na1 and Na2 are clearly broader for the precipitated sample, indicating a more disordered material on the local or long-range scale (e.g. differences in the local Na environment, stacking faults, etc.). This observation is in line with the TEM study that was performed on sublimed and crude precipitated Na4P2S6. The integral ratio of 48% Na1 to 52% Na2 is close to the expected half/half distribution of interlayer and intralayer sodium. The 31P spectrum of precipitated Na4P2S6 shows the resonance peak of P1P in addition to two smaller signals with a similar chemical shift. We conclude that the higher disorder produced by the precipitation route leads to slightly different chemical environments not only for the Na+, but also for the P2S64− anion, which is displayed in the three different P1P resonances. The precipitation route also leads to a small impurity, which is different from the one observed for the solid-state synthesis in the studied batch of material. The chemical shift of around δiso = 90–100 ppm portends a side phase containing PS1 SRO units like in Na4P2S7.
Annealing the precipitated Na4P2S6 at 500 °C introduces a new 23Na signal as a high-field shifted tail to Na2, in addition to low-field shifting the chemical shifts compared to the pristine sample. The integral ratio of 51% for the Na1 signal remains close to the expected 50% for this position, whereas the other resonance intensity is shared by Na2 (31%) and the new Na* (18%) signal. The latter signal broadens significantly and is high-field shifted compared to Na2, while the Na1 and Na2 signals show a smaller FWHM, comparable to the values found for the solid-state synthesized sample, indicating a gain in (long range) order upon annealing. The fact that for the annealed sample a third signal with a chemical shift close to the Na2 resonance is present, speaks yet again for a material in between the solid-state and precipitated Na4P2S6. Note that also additional resonances arise in the 31P MAS spectrum upon annealing the material. We assign these signals to a variety of thio-, thio/oxo- and oxo-phosphate impurities30 (about 10% compared to 3% side phase in the precipitated sample). The main 31P signal (δiso = 112.8 ppm) shows a smaller FWHM and no visible distribution of chemical shifts after annealing the sample.
To summarize, the solid-state synthesis yields the purest material, although a Na3PS4 side phase is present and difficult to avoid. Preparing Na4P2S6 from solution holds the advantage of an easier synthesis but comes at the cost of higher disorder in addition to a side phase. Assisted by these defects, the precipitated material crystallizes in a β-like polymorph below the α–β phase transition temperature. The subsequent annealing “heals” some degree of disorder, however, at the same time leads to the formation of additional side phases by presumably hydrolytic decomposition. Rapid cooling of the solid-state synthesized and annealed Na4P2S6 from a temperature well above the transition point yields solely the α phase.
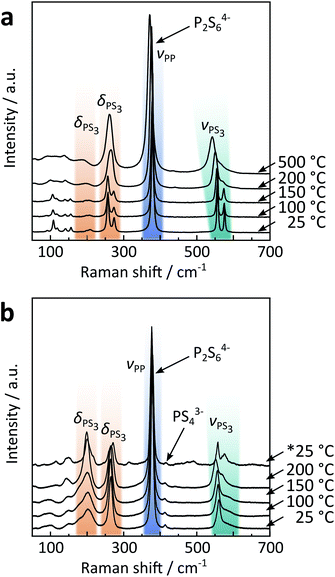 | ||
| Fig. 3 Temperature dependent Raman spectra of (a) solid-state α/β and (b) precipitated β-like Na4P2S6. The asterisk indicates that the spectrum was recorded after cooling down the sample from 200 °C. A full assignment of Raman modes for Na4P2S6 can be found in Table S9 in the ESI.† | ||
Contrary to the solid-state sample, precipitated Na4P2S6 reveals a P2S64− anion with D3d symmetry already at room temperature, further supporting the proposition it is a β-like polymorph. Here, the PS3 deformation mode is observed around 200 cm−1 with significant intensity that is less pronounced in the single crystal solid-state Na4P2S6. Additional Raman measurements on ground solid-state Na4P2S6 show, however, similar intensities compared to the precipitated product, suggesting the orientation of the single crystal to be the reason for the low intensity of the deformation mode. We only measured up to 200 °C, a temperature well above the α–β phase transition temperature in the solid-state material, but lower than the annealing temperature for precipitated Na4P2S6 (observed at approx. 500 °C according to XRD results, cf.Fig. 1c) to avoid the formation of side phases and to stay within the β-like polymorph. However, upon cooling the material already show a splitting of the modes as for the α polymorph, suggesting the beginning of annealing and “healing” from (stacking) faults of the precipitated sample already at temperatures below 500 °C.
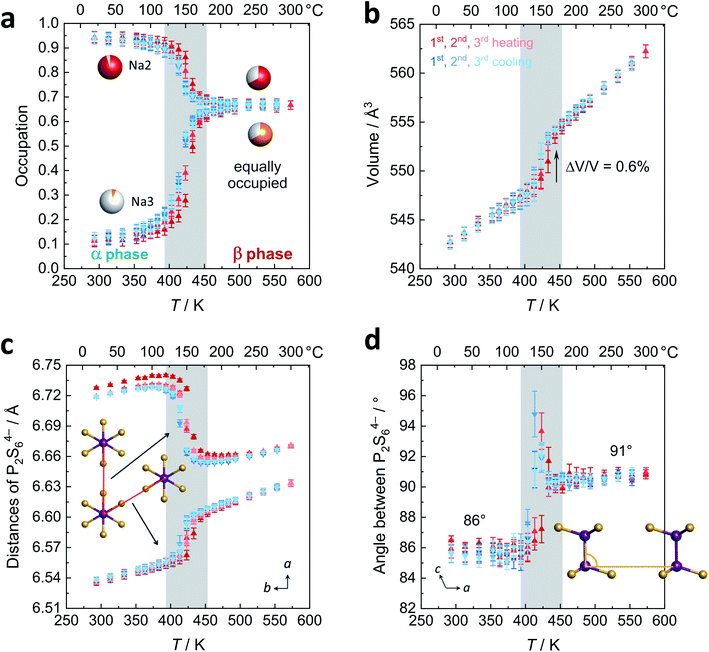
Fig. 4b displays the volume of the unit cell that changes discontinuously (+0.6%) as expected for a first order phase transition. Please refer to the ESI† for temperature dependency of a, b, c, and β. The thermal expansion of β-Na4P2S6 is higher than for the α polymorph with expansion coefficients of 6.2 × 10⁻⁶ K−1 and 4.5 × 10⁻⁶ K−1, respectively. Given these values, both belong in the group of intermediate expanding materials.31 Considering the structural changes during the phase transition, an interesting question is whether for β-Na4P2S6 the P2S64− layers now resemble a hexagonal pattern more closely. To this end, we evaluated the two relevant distances of the P2S64− units (defined as the middle of the P–P dumbbell) as shown in Fig. 4c. The distances indeed approach each other after the phase transition (6.61/6.66 Å at 200 °C) as compared to the α phase (6.54/6.72 Å at 20 °C). Nevertheless, they are still unequal in the β-Na4P2S6 polymorph and the symmetry thus is not hexagonal. Furthermore, we were interested in the unique tilting of P2S64− along the stacking direction, measured by the P–P–P angle of two neighboring anions in a direction. This angle changes from 86° in α to 91° in β-Na4P2S6 (Fig. 4d). At the phase transition it was even refined to more extreme values of up to 95°, presumably reflecting the Na+ rearrangement and changes in unit cell dimensions.
Sodium-ion conductivity
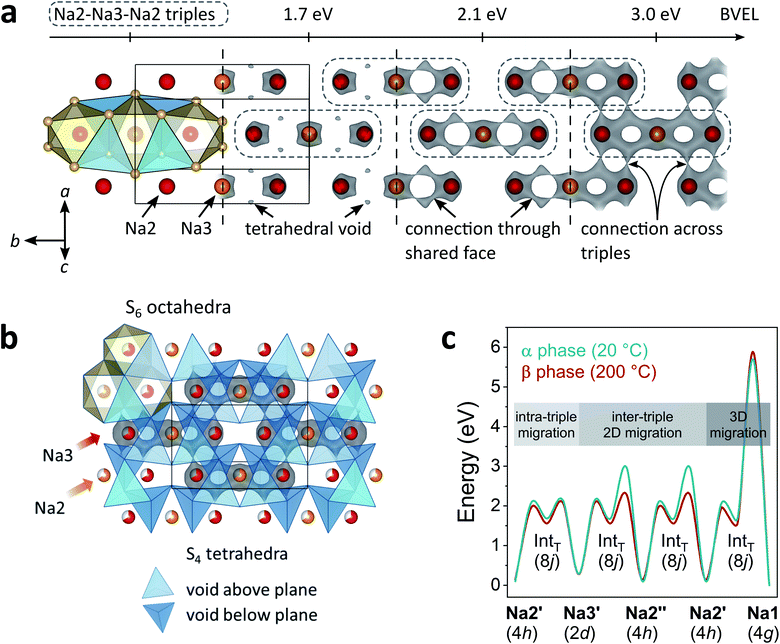
A more local approach, namely, nudged elastic band (NEB) calculations on the basis of DFT were carried out to obtain a complimentary view on the Na+ migration. In the calculations, we neither attempted a full treatment of disorder nor accounted for correlated ion motion. The reader is referred to the experimental section for simplifications we made and reasons for it. Therefore, the following considerations provide a qualitative rather than a quantitative understanding. Both α- and β-Na4P2S6 were studied for comparison. Further, we anticipated the importance of the local environment and re-used the classification for migration scenarios from the bond valence study: Na2′ ⇌ Na3′ intra-triple diffusion (′) and inter-triple diffusion (′′), whereby the latter was divided in Na2′ ⇌ Na3′′ and Na2′ ⇌ Na2′′ diffusion. For all three classes we picked exemplary sodium ion-vacancy orderings and migration scenarios along the established tetrahedral voids and tried to keep the ordering of Na+ ions that are not involved in the jump as comparable as possible for the different scenarios. Li et al.28 considered in their recent study only the Na2′ ⇌ Na2′′ diffusion in α-Na4P2S6 along the direct connection of the sites and not the tetrahedral interstitials. Fig. 6 displays the chosen scenarios and results of the NEB calculations.
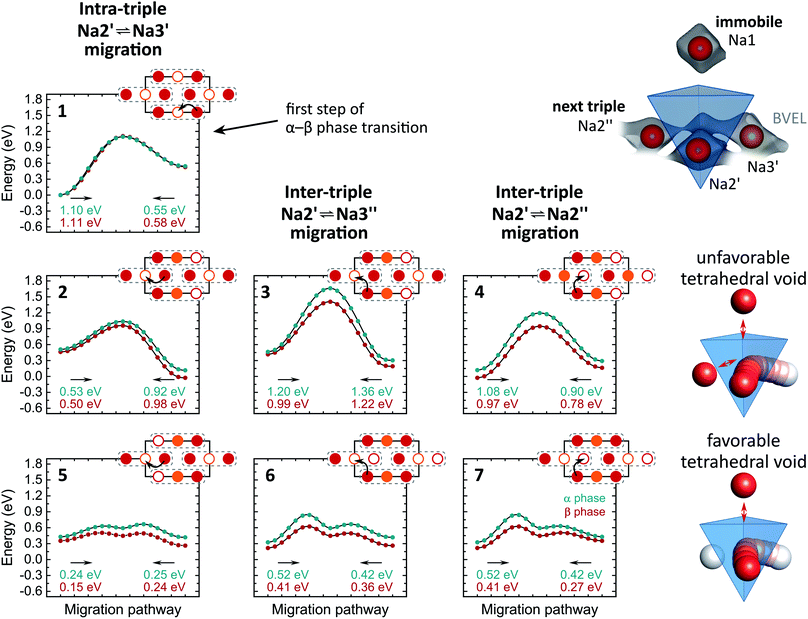 | ||
| Fig. 6 Energy curves for Na+ migration of scenarios 1–7 from NEB calculations. Corresponding migration energies are displayed under each curve. The Na+ pathways in the Na2/Na3 layer are sketched with Na2 in red, Na3 in orange and the triples indicated with dashed grey lines. Un-/occupied positions are displayed with empty/filled circles. Unfavorable and favorable tetrahedral voids are illustrated on the right side. The arrangement of tetrahedral voids within the unit cell can be found in Fig. 5b. | ||
Scenario 1 is the Na+ migration from a Na2 site to an unoccupied Na3 site within a triple (Na2′ → Na3′) along the BVEL pathway and, therefore, stands for the first step in the α to β phase transition. Contrary to the BVEL, the tetrahedral interstitial is a maximum in the energy curve with Emig = 1.1 eV for both α- and β-Na4P2S6. This barrier is overestimated as a consequence of our DFT simplifications; this assumption is consistent with the fact that the phase transition already happens at considerably low thermal energy (160 °C). After the migration, the energy of the system has significantly increased and this flattens the energy landscape for the ensuing ion motion. Scenario 2, which is a consecutive Na2′ → Na3′ migration but in a neighboring triple, exhibits only Emig = 0.5 eV. For long-range diffusion to the next triple higher energy barriers have to be overcome as shown in scenarios 3 and 4 (α: Emig > 0.9 eV, β: Emig > 0.8 eV). The structural changes from α- to β-Na4P2S6 reduce the energy barriers for the scenarios by about 0.1 eV but still differentiate between intra- and inter-triple migration. This said, the local method provides a different view than the BVEL calculations where the energy pathways almost align for intra- and inter-triple migration in the β polymorph.
All NEB scenarios so far have in common that the pathway is through a tetrahedral interstitial that experiences electrostatic repulsion from one (immobile) Na1 and one Na2 or Na3 ion that do not partake in the ion migration (cf.Fig. 6). This is a rather unfavorable tetrahedral void, and hence unfavorable diffusion pathway. Recalculating the scenarios 2–4 with favorable tetrahedral voids having a free site next to the pathway results in a local energy minimum for the tetrahedral site (scenarios 5–7). The barriers for ion motion are reduced by about 1/2 and can be expected to be even smaller in the real material because of the energy overestimation due to our DFT simplifications. The favorable scenarios 5–7 interconnect the entire Na2/Na3 layer and enable long-range Na+ migration in the ab plane.
In the crystal structure exists only one tetrahedral site (Wyckoff position 8j). In α-Na4P2S6 this site is unfavorable due to the Na+ ordering. However, in β-Na4P2S6 the local environment changes, and under the condition that Na2 and Na3 are equally occupied as refined from the PXRD pattern, there are, in purely statistical terms, 44% unfavorable and 22% favorable tetrahedral voids (besides 33% impossible voids with four or only one Na+, namely Na1, around). Every Na2 or Na3 site is surrounded by four of these tetrahedral voids (38% probability that at least one of them is favorable), and the high number of five or six target sites can be reached from a Na2 or Na3 position, respectively (cf.Fig. 5b). Thus, the probability for low-energy ion migration pathways is high. In essence, the vacant sites are the key difference for the ionic conductivity in α- and β-Na4P2S6.
Generally, vacancies are cumbersome to introduce by chemical substitutions to enhance the ionic conductivity. High amounts of sodium vacancies in thiophosphates are to our knowledge only known for Na11Sn2PS12, where they lead to superionic conductivity,24 but they have not been observed in more highly condensed thiophosphates yet.
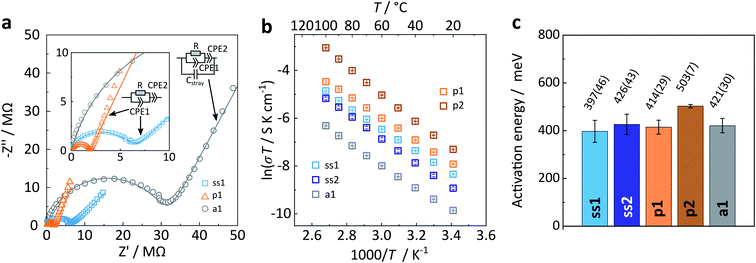
First, we present results on the Arrhenius behaviour of all samples well below the phase transition temperature (≤100 °C). Representative complex impedance spectra in the Nyquist-representation are shown in Fig. 7a for all three Na4P2S6 types. Please refer to the ESI† for a more detailed discussion of the impedance spectra interpretation and fitting. All spectra recorded at room temperature consist of only one (depressed) semicircle with an associated (averaged) capacitance of 7 × 10⁻¹¹ F cm−2 and 8 × 10⁻¹¹ F cm−2 for ss1 and ss2, 1 × 10⁻¹⁰ F cm−2 and 4 × 10⁻¹¹ F cm−2 for p1 and p2, and 6 × 10⁻¹¹ F cm−2 for a1. A capacitance on the order of 10 pF is usually expected for bulk processes, whereas a capacitance of nF is commonly attributed to grain boundaries.32,33 We checked all spectra for a possible second (grain boundary) semicircle that could overlap with the first high frequency arc by adding an additional (R) (CPE) circuit in series. The resulting fits were unsatisfactory, both visually and as seen from calculated errors of the individual circuit units. Therefore, we conclude that only one process at ambient temperature, based on the associated capacitances presumably a bulk process, is observable for this material, similar to the findings of Krauskopf et al. for Na3PS4.11
The room temperature ionic conductivity for solid-state Na4P2S6 is about 7 × 10⁻⁷ S cm−1, whereas the precipitated material has a higher mean conductivity of 2 × 10⁻⁶ S cm−1. The difference may be directly attributed to the different polymorphs of Na4P2S6 as we expect a higher conductivity for the β-like phase with Na+ and vacancy disorder as well as structural defects. Considering the batch-to-batch variations, a smaller spread in conductivities is observed for the solid-state than for the precipitated material. This speaks for a more homogeneous solid-state product, in line with the high crystallinity of the α polymorph. For precipitated Na4P2S6 the greater spread in conductivities is rationalized with the different sample histories due to slow or fast precipitation, re-crystallization, and dehydration, and also the varying amount of disorder in the material. With this in mind, we trace back the difference to the reported bulk conductivity for precipitated Na4P2S6 (σbulk = 3.4 × 10⁻⁶ S cm−1)29 to the higher dehydration temperature, namely 175 °C instead of 100 °C in this study. Hood29 found that at a dehydration temperature of 175 °C the ionic conductivity was highest, whereas at 100 °C Na4P2S6 has a conductivity of around 5 × 10⁻⁷ S cm−1. Annealed Na4P2S6 has a room temperature ionic conductivity of 2.3 × 10⁻⁷ S cm−1, which is considerably lower than for both solid-state and precipitated Na4P2S6. We attribute this decrease to the variety of low Na+ conducting thio-, thio/oxo- and oxo-phosphate impurities in this sample.
Next, activation energies of solid-state, precipitated, and annealed Na4P2S6 were deduced from individual Arrhenius plots ln(σT) as a function of inverse temperature (Fig. 7b and c). They are on the order of 0.40 eV to 0.50 eV, with on average higher barriers for precipitated Na4P2S6 compared to the solid-state material. The activation energy remains the same when annealing the precipitated p1 Na4P2S6 sample. Based on our theoretical considerations and calculations we expect a lower activation energy for the β polymorph. However, we observe that α and β-like Na4P2S6 have a comparable mean activation energy. Real structure effects (and side phases), especially present in the precipitated sample, could be accountable for this unexpected result.
As reported before, first principles investigation of the electrochemical properties of α-Na4P2S6 performed by Rush et al. and Li et al. yielded an activation energy of EA ≈ 0.4 eV (ref. 27 and 34) and 0.34 eV,28 respectively. MD simulations suggest an activation energy of 0.41 eV along with an experimentally confirmed activation energy of 0.39 eV.28 All activation energies published so far are in good agreement with the values presented in this study. Although this level of agreement is encouraging and reinforces the notion that Na4P2S6 has an activation energy of around 0.4 eV, one should be careful in comparing ionic conductivities and activation barriers reported by different groups, as reinforced by a recent benchmarking study.35 Not only sample history and preparation can have an impact on measured ionic conductivity, but also factors such as applied pressure and sample–electrode contacts. The study of Ohno et al.35 found that the spread of reported activation values can be as big as 0.13 eV, depending on the setup and cell preparation used for measuring impedance on a one-batch-material distributed within different research groups.
Finally, the electronic conductivity of α (ss2) and β-like (p1) Na4P2S6 was deduced from DC galvanostatic polarization measurements, establishing the material as a nearly pure sodium ion conductor with an electronic conductivity on the order of nS cm−1 (cf. ESI†). This is at least two orders of magnitude lower than the ionic conductivity, hence the transference number for sodium ions is calculated to be ≥0.99.
Overall, the measured transport data are in line with the other structure sensitive methods and confirm substantial differences between the Na4P2S6 samples due to changes at the structural level, induced by different sample histories.
Conclusion
The development of all-solid-state sodium-ion batteries for scalable energy storage solutions requires fast sodium conducting solid electrolytes. Abundant resources and a cheap and green synthesis are seen as highly beneficial for large-scale application. Here, we have prepared Na4P2S6 following two different routes, a solid-state and a precipitation method, and traced the resulting differences back to the following changes at the structural level.First, a Na+ and vacancy disorder-driven first order phase transition (α to β) is observed for the solid-state synthesized material at temperatures around 160 °C, which is associated with a symmetry change of the anion and changes in the population of the sodium sublattice. Second, the β-like polymorph is stabilized already at room temperature for precipitated Na4P2S6, presumably through the assistance of inter- and intralayer defects.
Electrochemical impedance measurements and theoretical calculations reveal that the sodium-ion conduction is substantially affected by these structural differences. The key findings are as follows: using bond-valence calculations, low-energy unoccupied sodium positions in both α- and β-Na4P2S6 and possible short- and long-range 2D Na+ migration pathways especially in the β polymorph were identified. Since the BVEL method does not capture local environments such as Na+ vacancies which are present in high amounts in Na4P2S6, NEB calculations were used as a more local approach to demonstrate that the Na+ disorder leads to many possible migration paths with a wide spread of Emig. Additional disorder, e.g. stacking faults, residual crystal water, or thiophosphate disorder in precipitated Na4P2S6, even multiplies these possibilities. Finally, the ion transport for both polymorphs with different types of disorder were studied by impedance spectroscopy. The measurements suggest that the Na+ conductivity in the precipitated sample is slightly higher than that of the solid-state sample (2 × 10⁻⁶ S cm−1vs. 7 × 10⁻⁷ S cm−1 with EA ≈ 0.4 eV for both materials at room temperature), which is consistent with the stabilization of the more conductive β phase at room temperature in the precipitated sample.
In summary, the results point out that synthetic and post-synthetic treatment of solid electrolytes can substantially impact a material's properties. In fact, differences in sample preparation cannot only change the speciation and, hence, product outcome, but also change more subtle structural properties such as phase formation and stability range. Without critical investigation, important changes such as phase transitions with small structural changes and low heat tinting can be easily overlooked. The findings thus point to a rich and potentially unexplored phase space in thiophosphate solid electrolytes, and at the same time motivate a somewhat underappreciated approach for the design of improved solid electrolytes: phase formation through synthetic control.
Conflicts of interest
There are no conflicts to declare.Acknowledgements
The authors acknowledge financial support by the Max Planck Society, the German Federal Ministry of Research and Education (BMBF), project 03XP0177B (FestBatt), the Center for Nanoscience (CeNS) and the Deutsche Forschungsgemeinschaft via the Cluster of Excellence e-conversion (EXC2089). We thank W. Hölle for single crystal measurements, the Computer Service group at MPI-FKF for providing computational facilities and N. M. Vargas-Barbosa for fruitful discussions. Open Access funding provided by the Max Planck Society.References
- Z. Zhang, Y. Shao, B. Lotsch, Y.-S. Hu, H. Li, J. Janek, L. F. Nazar, C.-W. Nan, J. Maier, M. Armand and L. Chen, Energy Environ. Sci., 2018, 11, 1945–1976 RSC.
- T. Famprikis, P. Canepa, J. A. Dawson, M. S. Islam and C. Masquelier, Nat. Mater., 2019, 18, 1278–1291 CrossRef CAS PubMed.
- K. B. Hueso, M. Armand and T. Rojo, Energy Environ. Sci., 2013, 6, 734–749 RSC.
- X. Lu, G. Xia, J. P. Lemmon and Z. Yang, J. Power Sources, 2010, 195, 2431–2442 CrossRef CAS.
- M. Guin and F. Tietz, J. Power Sources, 2015, 273, 1056–1064 CrossRef CAS.
- J. B. Goodenough, H. Y. P. Hong and J. A. Kafalas, Mater. Res. Bull., 1976, 11, 203–220 CrossRef CAS.
- T. J. Udovic, M. Matsuo, A. Unemoto, N. Verdal, V. Stavila, A. V. Skripov, J. J. Rush, H. Takamura and S.-i. Orimo, Chem. Commun., 2014, 50, 3750–3752 RSC.
- L. Duchêne, R. S. Kühnel, D. Rentsch, A. Remhof, H. Hagemann and C. Battaglia, Chem. Commun., 2017, 53, 4195–4198 RSC.
- A. Hayashi, K. Noi, A. Sakuda and M. Tatsumisago, Nat. Commun., 2012, 3, 856 CrossRef PubMed.
- A. Hayashi, K. Noi, N. Tanibata, M. Nagao and M. Tatsumisago, J. Power Sources, 2014, 258, 420–423 CrossRef CAS.
- T. Krauskopf, S. P. Culver and W. G. Zeier, Inorg. Chem., 2018, 57, 4739–4744 CrossRef CAS PubMed.
- M. Jansen and U. Henseler, J. Solid State Chem., 1992, 99, 110–119 CrossRef CAS.
- T. Famprikis, J. A. Dawson, F. Fauth, O. Clemens, E. Suard, B. Fleutot, M. Courty, J.-N. Chotard, M. S. Islam and C. Masquelier, ACS Mater. Lett., 2019, 1, 641–646 CrossRef CAS.
- L. Zhang, D. Zhang, K. Yang, X. Yan, L. Wang, J. Mi, B. Xu and Y. Li, Adv. Sci., 2016, 3, 1600089 CrossRef PubMed.
- S.-H. Bo, Y. Wang and G. Ceder, J. Mater. Chem. A, 2016, 4, 9044–9053 RSC.
- T. Krauskopf, C. Pompe, M. A. Kraft and W. G. Zeier, Chem. Mater., 2017, 29, 8859–8869 CrossRef CAS.
- I.-H. Chu, C. S. Kompella, H. Nguyen, Z. Zhu, S. Hy, Z. Deng, Y. S. Meng and S. P. Ong, Sci. Rep., 2016, 6, 33733 CrossRef CAS PubMed.
- N. J. J. de Klerk and M. Wagemaker, Chem. Mater., 2016, 28, 3122–3130 CrossRef CAS.
- A. Hayashi, N. Masuzawa, S. Yubuchi, F. Tsuji, C. Hotehama, A. Sakuda and M. Tatsumisago, Nat. Commun., 2019, 10, 5266 CrossRef CAS PubMed.
- T. Fuchs, S. P. Culver, P. Till and W. G. Zeier, ACS Energy Lett., 2020, 5, 146–151 CrossRef CAS.
- A. Kuhn, R. Eger, J. Nuss and B. V. Lotsch, Z. Anorg. Allg. Chem., 2014, 640, 689–692 CrossRef CAS.
- C. Fritsch, A.-L. Hansen, S. Indris, M. Knapp and H. Ehrenberg, Dalton Trans., 2020, 49, 1668–1673 RSC.
- Z. Zhang, E. Ramos, F. Lalère, A. Assoud, K. Kaup, P. Hartman and L. F. Nazar, Energy Environ. Sci., 2018, 11, 87–93 RSC.
- M. Duchardt, U. Ruschewitz, S. Adams, S. Dehnen and B. Roling, Angew. Chem., Int. Ed., 2018, 57, 1351–1355 CrossRef CAS PubMed.
- T. Fincher, G. LeBret and D. A. Cleary, J. Solid State Chem., 1998, 141, 274–281 CrossRef CAS.
- S. Neuberger, S. P. Culver, H. Eckert, W. G. Zeier and J. Schmedt auf der Günne, Dalton Trans., 2018, 47, 11691–11695 RSC.
- L. E. Rush and N. A. W. Holzwarth, Solid State Ionics, 2016, 286, 45–50 CrossRef CAS.
- Y. Li, Z. D. Hood and N. A. W. Holzwarth, Phys. Rev. Mater., 2020, 4, 045406 CrossRef CAS.
- Z. D. Hood, Lithium and sodium solid electrolytes for next-generation batteries: Bridging mechanistic understanding and their performance, PhD thesis, Georgia Institute of Technology, 2018.
- S. Kmiec, A. Joyce and S. W. Martin, J. Non-Cryst. Solids, 2018, 498, 177–189 CrossRef CAS.
- R. Roy, D. K. Agrawal and H. A. McKinstry, Annu. Rev. Mater. Sci., 1989, 19, 59–81 CrossRef CAS.
- A. Kuhn, O. Gerbig, C. Zhu, F. Falkenberg, J. Maier and B. V. Lotsch, Phys. Chem. Chem. Phys., 2014, 16, 14669–14674 RSC.
- J. Fleig and J. Maier, J. Am. Ceram. Soc., 1999, 82, 3485–3493 CrossRef CAS.
- L. E. Rush Jr, First-principles investigation of electronic properties in sodium-ion electrolytes for solid-state battery materials electrolytes for solid-state battery materials, MSc thesis, Wake Forest University, 2017.
- S. Ohno, et al. , ACS Energy Lett., 2020, 5, 910–915 CrossRef CAS.
Footnotes |
| † Electronic supplementary information (ESI) available. CSD 2031308. For ESI and crystallographic data in CIF or other electronic format see DOI: 10.1039/d0ta11008f |
| ‡ Contributed equally to this work. |
| This journal is © The Royal Society of Chemistry 2021 |

