
 Open Access Article
 This Open Access Article is licensed under a
 Creative Commons Attribution 3.0 Unported Licence
Au integrated AgPt nanorods for the oxygen reduction reaction in proton exchange membrane fuel cells†
Elok
Fidiani
ac,
Gnanavel
Thirunavukkarasu
b,
Yang
Li
a,
Yu-Lung
Chiu
b and
Shangfeng
Du
 *a
*a
aSchool of Chemical Engineering, University of Birmingham, Birmingham, B15 2TT, UK. E-mail: s.du@bham.ac.uk
bSchool of Metallurgy and Materials, University of Birmingham, Birmingham, B15 2TT, UK
cDepartment of Physics, Parahyangan Catholic University, Jl. Ciumbuleuit 94, Bandung 40141, Indonesia
First published on 18th January 2021
Abstract
The development of new electrode fabrication approaches from highly active electrocatalysts to replace the state-of-the-art Pt/C is most desirable for enhancing power performance and durability in proton exchange membrane fuel cells. However, the deployment of advanced, often shape-controlled Pt alloy electrocatalysts in actual electrodes remains challenging due to their small quantities in preparation and poor power performance in operating fuel cells. In this study, a new electrocatalyst approach is presented for Au integrated one-dimensional AgPt alloy nanorods. The atom arrangement is tuned through precisely controlling the metal ion reduction procedure to improve the catalyst activity. With 5 at% Au, nanorods with an average length of 20 nm and diameter of 3–4 nm are achieved. The test of Au–AgPt nanorods as cathode catalysts shows 1.2-fold higher fuel cell power density than that for commercial Pt/C catalysts, and a lower decline rate of 39.63% than 44.19% after an accelerated degradation test.
Introduction
Proton exchange membrane fuel cells (PEMFCs) are attractive power generators for transportation and stationary applications due to their low operating temperature, high power density and easy start-up and shutdown.1 The intense development during past years has moved this technology to successful commercialization.2 However, the requirement of a high loading of platinum (Pt) catalysts for promoting the oxygen reduction reaction (ORR) at the cathode demotes the economic benefit of this technology and makes it less competitive in the market.3 The ultimate strategies to reduce Pt loading while improving the catalytic performance have been reviewed via alloying Pt with less expensive metals such as Co or Ni.4–6 However, stability is another challenge with the alloyed metals under severe acidic operating conditions within PEMFCs.7–10 Furthermore, the zero-dimensional (0D) nanoparticle (NP) structure is also a contributing factor towards catalyst degradation during long-term use, which is triggered by susceptibility of the small NPs to dissolution and aggregation.11,12To date, single-crystal 1D catalyst nanostructures such as nanowires (NWs) and nanorods (NRs) attract huge attention for overcoming the deficiency of 0D NP catalysts for PEMFC applications.13–16 The defect-free structure and lower surface energy derived from the 1D contexture provide higher resistance against degradation for better durability.17 1D Pt-alloy catalysts with precious and non-precious metals such as Pd, Au, Ag, Cu and Ni have demonstrated enhanced catalytic activities and stability towards the ORR.13,18–21 However, a facile production of 1D Pt-alloy nanostructures is highly challenging due to the requirements of templates or capping agents, usually limiting their synthesis to the microgram order. Such a small amount is only available for half-cell rotating disk electrode (RDE) measurement in liquid electrolytes and very few research studies reported their applications in real catalyst electrodes for PEMFCs.22,23
With a facile formic acid reduction method, 1D AgPt nanostructures have been successfully synthesized and demonstrated for the ORR application.24 Compared with Pt, the cost of Ag is very low (<2% cf. Pt), which is an advantage for the commercial purpose. Ag also possesses a similar standard reduction potential (SRP) and lattice constant to Pt, making it easy to alloy with Pt by wet chemical reduction methods. A similar lattice constant is an advantage to induce the synergy between Ag and Pt interaction, promoting the catalytic activity and preventing segregation for better stability.25 Although the Pt@Ag core–shell NRs have been reported to exhibit good stability in the RDE electrochemical measurement,26 the testing in fuel cells showed that the dissolution of Ag from AgPt alloy electrocatalysts was unavoidable during PEMFC operation, resulting in a dramatic power performance decline.24
Besides Ag, among the commonly used alloy metals with Pt, Au has been known as an effective doping metal for enhancing the stability of alloy catalysts.27–30 The presence of Au clusters can provide a stabilization effect through the electronic structure modification of the Pt-based catalysts, preventing oxide formation on the Pt surface.31–33 Meanwhile, the charge transfer effect induced by introducing a small number of Au atoms can potentially reduce the formation of unstable high-energy Pt sites, improving stability under the ORR conditions.34 It also stabilizes the catalyst by weakening the binding of oxygen species on the catalyst surface, thus suppressing the segregation of alloyed metals such as Pd, Co and Ni.27,33,35 Therefore, the integration of Au with AgPt to develop 1D alloy catalysts can be a promising strategy to upgrade the catalytic activity and stability for practical application in PEMFCs.
In this work, we explore the self-growth formic acid reduction method to control the formation of 1D Au–AgPt alloy nanostructures, considering that the stabilization effect of Au is highly affected by the catalyst structure, composition and elemental distribution.30,34 The influence mechanisms of Au on the morphology, structure and catalytic performance are thoroughly investigated based on the physical characterization and PEMFC test results. The optimal Au content is determined, and the enhanced durability of the Au–AgPt catalyst electrodes is also demonstrated based on the accelerated degradation test (ADT) results in PEMFCs.
Experimental
Materials
All materials were used as received without additional treatment and purification, including carbon black Vulcan XC-72R (FuelCellStore, USA), H2PtCl6 (8 wt% in H2O), 0.1 M AgNO3, HAuCl4·3H2O and HCOOH (≥95%) (Sigma-Aldrich, UK), ethanol and 2-propanol (IPA) (Fisher Scientific, UK), and 10 wt% Nafion® polymer dispersion (D1021) (Ion Power Inc., USA). The water used was deionized (DI) to 18 MΩ cm using a Millipore water system, Milli-Q. And as a benchmark, a commercial Pt/C nanoparticle catalyst (46.2 wt% Pt, TEC10E50E, TKK, Japan) was used.Growing Au–AgPt alloy nanorods on carbon
Typically, for the synthesis of the 5 at% Au integrated AgPt NR/C A catalyst (Au–AgPt NR/C A), 1 mL of H2PtCl6 (8 wt% in H2O) in 50 mL water was added to 100 mL water containing 50 mg of carbon black. 10 mL of HCOOH was subsequently added dropwise under sonication for up to 10 minutes. 1 mL of 25 mM HAuCl4 was then added under stirring. The stirring was continued at room temperature for ca. 5 hours and then 1.7 mL of 0.1 M AgNO3 in 50 mL of water was added. The reaction was continued under stirring for up to 96 hours at room temperature. The final product was then washed with water and ethanol, followed by drying in an oven (60 °C, 2 h). The different Au contents were achieved by changing the concentration of Au and Ag precursors while keeping the Pt and total metal loading constant.Physical characterization
The structure and morphology of the catalysts were analyzed using a transmission electron microscope (JEOL 1400 TEM, 80 kV, Japan) and a high-resolution TEM (HR-TEM, Talos F200X, operated at 200 kV) equipped with a super-X EDS system with four silicon drift detectors (SDDs) (Bruker, USA). Thermogravimetric analysis (TGA, NETZSCH TG209F1, Germany) was conducted between 20 and 900 °C to determine the metal loading on carbon. The metal component was quantified with inductively coupled plasma mass spectrometry (ICP-MS, Perkin Elmer Nexion 300X, USA) (plasma strength of 1500 W). Powder X-ray diffraction (XRD) analysis was performed with a D8 Auto-sampler Bruker (USA) equipped with a Cu Kα X-ray source (λ = 0.15406 nm) to determine the crystal structure of the catalysts. X-ray photoelectron spectroscopy (XPS, Thermo Fisher Scientific NEXSA spectrometer) with a micro-focused monochromatic Al Kα source (72 W) was used to evaluate the surface composition and oxidation state of catalysts. The XPS data analysis was processed using CasaXPS software (version: 2.3.18PR1.0) and sample charging corrected using the C 1s peak at 284.8 eV as a reference.Half-cell rotating disk electrode (RDE) measurement
Half-cell electrochemical measurement was conducted using the RDE method on an Autolab PGSTAT302N Potentiostat (Metrohm Ltd, UK), with a glassy carbon electrode (GCE; 0.196 cm2) of Pine Research Instrumentation Inc., USA. For each measurement, 5 μL of catalyst ink was deposited on the GCE. The ink solution was made of about 5 mg of catalyst powder dispersed in 780 μL of H2O, 200 μL of IPA and 20 μL of 10 wt% Nafion® dispersion. To obtain a homogeneous catalyst ink, a sonication probe (A Sonics Vibra-CellTM VCX130, USA) was applied at a power amplitude of 20%. Cyclic voltammetry (CV) measurement was carried out in N2 saturated 0.1 M HClO4(aq) at 25 °C between 0.05 and 1.2 V vs. RHE. Cleaning was first performed with 50 CV cycles at a scan rate of 100 mV s−1, followed by 3 cycles at a slow scan rate of 20 mV s−1 to estimate the electrochemical surface area (ECSA) of the catalysts. The electrochemical impedance spectroscopy (EIS) analysis was performed in the frequency range of 0.1 Hz to 100 kHz with an amplitude of 10 mV. Linear sweep voltammetry (LSV) analysis was run from 0.05–1.2 V vs. RHE at a scan rate of 20 mV s−1 and a rotation speed of 1600 rpm in an O2 saturated electrolyte. Specific and mass activities were calculated by normalising the kinetics current obtained at 0.9 V with respect to the ECSA and Pt mass of the catalysts.MEA fabrication and fuel cell testing
The catalyst ink for the cathode was made of 0.5 mL IPA, 45.7 μL of 10 wt% Nafion™ dispersion and the catalyst powder with a Pt loading of 0.2 mgPt cm−2. The sonication probe was used at a power amplitude of 20% to obtain a fine dispersion of the catalyst ink. The ink was then painted onto a piece of 4 × 4 cm2 Sigracet 39 BC gas diffusion layer (GDL) and then left to dry for 2 hours at 35 °C. The membrane electrode assembly (MEA) was fabricated by assembling the as-prepared cathode, a commercial gas diffusion electrode (GDE, 0.2 mgPt cm−2, FuelCellStore USA) as the anode and a 6 × 6 cm2 Nafion 212 membrane hot-pressed under 1800 lb load for 2 minutes at 135 °C.A Biologic-PaxiTech FCT-50S PEM fuel cell test rig (France) was employed for the MEA test. Polytetrafluoroethylene (PTFE, 254 μm in thickness) gaskets were used at both the anode and cathode sides. The membrane hydration was carried out by holding at 0.6 V for at least 12 hours under fully humidified H2/air at 80 °C and a stoichiometric ratio of 1.3/1.5 with an absolute pressure of 1.5/1.5 bar at the anode and cathode, respectively. A cell break-in procedure was then conducted by following the harmonized EU protocols under fully humidified H2/air at 80 °C and a stoichiometric ratio of 1.3/1.5 with an absolute pressure of 2.5/2.3 bar at the anode and cathode, respectively.36 The standard deviation of three repeated tests was applied to determine the error bars for the peak power density. EIS analysis was then conducted at 30 mA cm−2, 0.65 V and 0.5 V, with an amplitude of 4.5 mA cm−2, 10 mV and 10 mV, respectively, in the frequency range of 10 kHz to 0.1 Hz. Potentio EIS (PEIS) at 0.65 V and 0.5 V rather than Galvano EIS (GEIS) at a large current density was selected here because for some poor catalysts/GDEs, a large current density (e.g. 1.0 A cm−2) could not be reached.
To monitor the ORR mass activity of the catalyst in the MEA, the cathode gas was switched to O2, and the stoichiometry ratio of the anode/cathode was changed to 2/9.5 at 1.5/1.5 barabs, respectively, following the U.S DoE standard conditions. The same method of cell break-in procedure and recording polarization curve as that in H2/air was applied. For correction, the internal resistance was determined using GEIS obtained from the low-current density at the high-frequency range, and the H2-crossover current was obtained by holding the potential at 0.5 V with the N2 saturated cathode for 30 minutes using an EZStat-Pro potentiostat (NuVant Systems Inc., USA). The measured current at 0.9 V from the corrected polarisation curve was then applied to calculate the mass and specific activities. CV curves were also recorded using the EZStat-Pro potentiostat between 0.05 and 1.2 V at a scan rate of 20 mV s−1. The standard deviation of three repeated CV plots was applied to estimate the error bars of the ECSA. An accelerated degradation test (ADT) of the cathode was conducted using a potential sweeping method between 0.6 and 1.2 V at a scan rate of 100 mV s−1 for 5000 cycles. The polarization curves and CVs were recorded after the ADT to evaluate the electrode durability.
Results and discussion
In this work, the integration of Au with the AgPt NR/C catalyst was conducted via the formic acid reduction method, for which the reduction potentials of the metal ions are carefully considered for controlling the reaction rate to obtain the expected 1D nanostructures. Based on our previous studies, the initial formation of Pt seeds is crucial to induce the growth of the alloyed metals in a specific direction to form 1D nanostructures.24 Pt and Ag ions have very similar standard reduction potentials ([PtCl42−/Pt0] = 0.74 V vs. SHE and [Ag+/Ag0] = 0.79 V vs. SHE). Hence, the Pt ions are required to be first reduced to form nanoseeds inducing the later crystal growth to form 1D nanostructures before introducing Ag ions into the reaction solution. As the stabilization material, the distribution of Au within the AgPt NRs is crucial, which also influences the catalytic activity of the catalyst. According to Zhang et al., the attachment of Au on the catalyst surface decreases its catalytic activity as Au atoms potentially block the active sites (e.g. ORR active sites on Pt).31 Meanwhile, the Au stabilizing effect is not severely prevented by displacing it beneath the top atom surface.35 Therefore, to achieve a highly active and stable catalyst, the deposition of Au is investigated through controlling the interval time of adding the Au precursor along with the growth of the 1D AgPt alloy NRs, which is schematically shown in Fig. 1. | ||
| Fig. 1 The synthesis scheme of Au–AgPt NR/C via the formic acid reduction method (the top parts of the NRs are cut to show the element distribution). | ||
The introduction of Au ions at the early reaction stage (Fig. 1, scheme A) leads to the formation of ultrathin harmonized alloy NRs with an average diameter of 3–4 nm and length of ∼20 nm on the carbon support, which is shown by TEM and STEM-EDX analysis results in Fig. 2a. The HRTEM image exhibits a single NR with an interplanar spacing of 0.23 nm (Fig. 2c), which is close to the lattice spacing of (111) planes of bulk Pt – JCPDS: 04-0802 (0.227 nm), Ag – JCPDS: 04-0783 (0.235 nm) and Au – JCPDS: 04-0784 (0.235 nm), indicating the growth along the 〈111〉 crystal direction. A uniform lattice orientation shown in the image is expected due to the similar lattice constants of Ag, Pt and Au, which also signify the harmonized alloy structure of the NRs. The STEM-EDX mapping results show the distribution of Pt, Ag and Au within the NRs (Fig. 2d–g). The overlay element map exhibits a homogeneous distribution of three elements without any boundary, representing good alloying behavior within the NRs. Meanwhile, by delaying the Au addition together with the introduction of the Ag precursor (Fig. 1, scheme B), more Au and Ag atoms deposit on the outer surface of the NRs, as shown in Fig. S1c.† This morphology potentially reduces the exposure of Pt active sites inducing a lower ECSA.31 These results thus confirm the importance of controlling the reduction process of various metal ions to derive 1D multi-metallic alloy nanostructures using the formic acid reduction method.
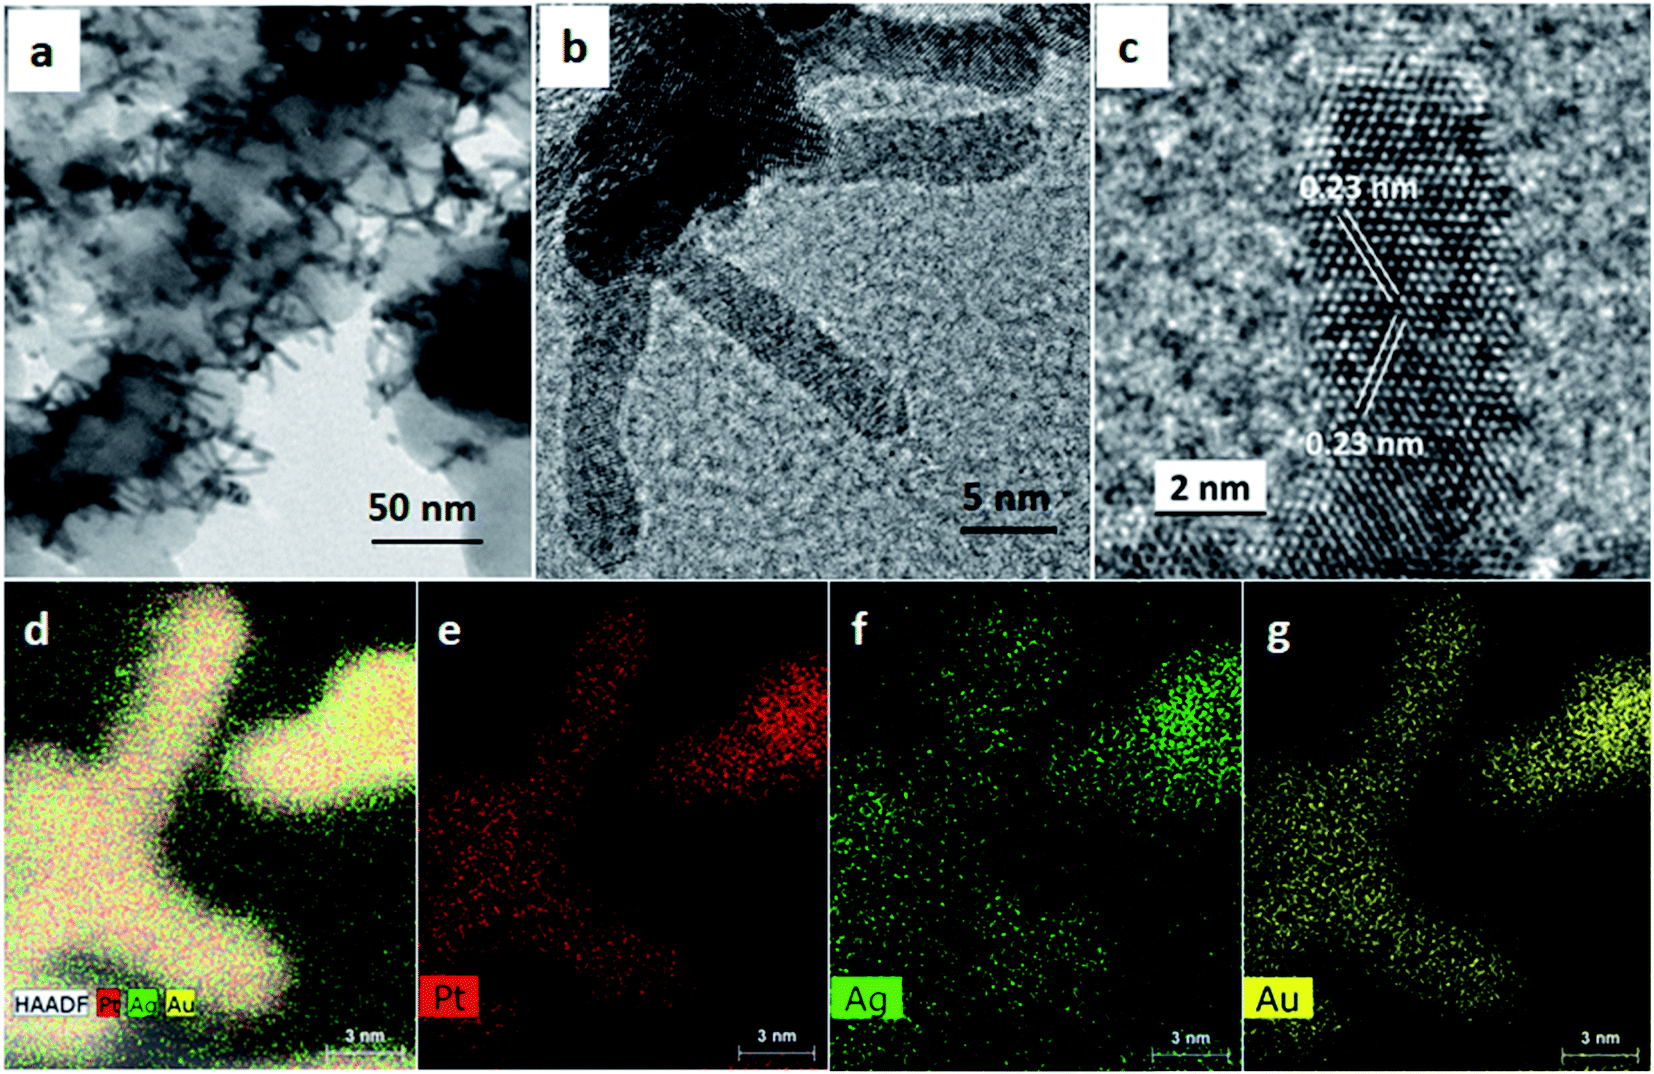 | ||
| Fig. 2 (a–c) TEM and HR-TEM images of the Au–AgPt NR/C A catalyst synthesized following reaction scheme A, and (d–g) show the element mapping by STEM-EDX analysis. | ||
With the formic acid reduction method, the growth of 1D Pt nanostructures is based on a slow reaction rate and selectively weaker adsorption of formate anion species (produced from the slow dehydration of formic acid) on the Pt (111) surface.37 As shown in Fig. S2,† the replacement of 50 at% Pt with Ag results in the domination of shorter NRs. This outcome is derived by the change of the reaction rate due to the different reduction potentials of Pt and Ag ions, which has been carefully studied in our previous work.24 Compared with Pt and Ag ions, the higher redox potential of Au ([AuCl4−/Au0] = 0.93 V vs. SHE) (cf. Pt and Ag ions) implies a much faster chemical reduction rate under the same environmental conditions. Thus, the introduction of the Au precursor with Pt ions causes dominant Au reduction in the early reaction period (Fig. 1, scheme A) further slowing down the Pt reduction process.38 This induces the growth of longer NRs (Fig. S2†) and more Pt deposition on the surface. On the other hand, if Pt ions are left to react for 5 hours at first (Fig. 1, scheme B), some of them are reduced and form Pt seeds.39 The introduction of Au ions at this point induces a slower Ag reduction and prevents the embedding of Ag in the inner side of the NRs. Consequently, most Au and Ag are attached at the outer atomic layers of the NRs, as shown in Fig. S1c.† Although the ratio of Au is much smaller than that of Pt and Ag, the reaction kinetics is slow enough in the reduction reaction system when using a weak reducing agent, such as formic acid here. Therefore, a small amount of Au (i.e. ca. 5 at%) plays a significant role in changing the chemical reaction rate for the formation of longer NRs (Table 1).
The peaks in the XRD patterns of the AgPt NR/C and 5 at% Au integrated AgPt NR/C catalysts are successfully indexed to (111), (200), (220) and (311) planes (Fig. 3a). These are the typical face-centered cubic (fcc) structures of Pt, Ag and Au based on the references of Pt (JCPDS: 04-0802), Ag (JCPDS: 04-0783) and Au (JCPDS: 04-0784), respectively. All the peaks for AgPt NR/C and Au–AgPt NR/C show a negative shift (ca. 0.1–0.2°) compared with those from Pt (JCPDS: 04-0802). This indicates a change of the lattice spacing due to the alloying with Ag and Au. The increased peak intensity and reduced full width at half maximum (FWHM) after the introduction of Au (cf. AgPt NR/C) can be ascribed to the improved crystallinity resulting from the longer NRs, which is in agreement with the TEM analysis results (Fig. S2†).
 | ||
| Fig. 3 (a) XRD and (b) XPS patterns of the AgPt NR/C and Au–AgPt NR/C catalysts. The corresponding high-resolution XPS spectra of (c) Pt 4f and (d) Ag 3d regions. | ||
The introduction of Au also leads to a weakened Ag (111) peak at 38.35°, indicating a reduced Ag metal phase. This peak decline is very weak for Au–AgPt NR/C B tuned by reducing together more Au with Ag and the remaining Pt ions during the second reduction step. The addition of Au and Ag together slows down the Ag ion reduction rate preventing the formation of the Ag metal phase (Fig. 1, scheme B).24 And this tuning effect from Au is also demonstrated for the catalysts synthesized with a higher Au content by following reaction scheme A, where the Ag metal peak decreases with increasing Au content (Fig. S3†). These findings agree with the mechanism discussed above, and indicate that the alloying degree of Au–AgPt NR/C can be adjusted by both controlling the interval time of introducing the Au ions and changing the atomic ratio of Au. The metal contents of the catalysts with various Au contents were also evaluated using ICP-MS along with TGA analysis and the results are presented in Table S1,† showing a good agreement with the theoretical value.
A comparison of the surface compositions (Table 1) deduced from the XPS analysis (Fig. 3b) confirms a higher ratio of Pt deposition caused by the introduction of Au. A very small amount of Au (0.26%) was detected on the surface of Au–AgPt NR/C A, whereas a higher Au composition of 4.34 at% is obtained for Au–AgPt NR/C B. Hence, significant Au 4f7/2 and 4f5/2 peaks are observed at 83.46 and 87.12 eV, respectively, close to the high-resolution Pt 4f region (Fig. 3c). This further confirms the higher Au content on the NR surface synthesized according to reaction scheme B, which agrees well with the TEM analysis results in Fig. 2. Nevertheless, the Au 4f signals become stronger with a higher Au content, e.g. strong signals are recorded for 12 at% Au even with the catalyst synthesized according to reaction scheme A (Fig. S4†). The fitting of the two Pt 4f peaks shows the domination of Pt0 with the characteristic Pt 4f7/2 and Pt 4f5/2 peaks (Table S2†), which are recorded at 70.60 and 73.88 eV for Au–AgPt NR/C A and 70.42 and 73.72 eV for Au–AgPt NR/C B, respectively (Fig. 3c). Similarly, the two Ag 3d peaks are completely fitted with the metallic state of Ag0 (Table S2†), and a positive shift is recorded for Au–AgPt NR/C A with Ag 3d5/2 at 367.58 eV compared to the 367.34 eV for Au–AgPt NR/C B (Fig. 3d). Generally, the binding energies of the main elements of both Au–AgPt NR/C catalysts shift negatively compared to those for the monometallic Pt, Ag and Au (Fig. S4 and S5†). However, the shifting degree is varied depending on the Au ratio and deposition, which is related to the charge transfer phenomenon due to the interaction of the multi-metallic structure.40 The electronic interaction such as electron transfer from the metal atoms results in the change of the binding energies, which further confirms the modified electronic properties of the AgPt alloy catalyst because of the Au integration.41
| Catalysts | Size/nm | ICP-MS/wt% | ICP-MS/at% | XPS/at% | |||||||
|---|---|---|---|---|---|---|---|---|---|---|---|
| d | l | Au | Ag | Pt | Au | Ag | Pt | Au | Ag | Pt | |
| AgPt NR/C | 4 ± 0.5 | 14 ± 2 | 0.00 | 32.23 | 67.77 | 0.00 | 46.23 | 53.77 | 0.00 | 49.75 | 50.25 |
| Au–AgPt NR/C A | 4 ± 0.5 | 20 ± 2 | 6.77 | 28.56 | 64.67 | 5.45 | 41.97 | 52.58 | 0.26 | 41.68 | 58.06 |
| Au–AgPt NR/C B | 4 ± 0.5 | 20 ± 2 | 6.12 | 27.55 | 66.33 | 4.96 | 40.77 | 54.27 | 4.34 | 43.17 | 52.49 |
An MEA test was conducted to evaluate the practical catalytic performance of the as-prepared catalysts toward the ORR in the PEMFC cathode. Fig. 4a shows the polarization and power density curves of the MEAs with the cathode catalyst made of AgPt NR/C, 5 at% Au–AgPt NR/C and commercial Pt/C NP, tested in H2/air with a catalyst loading of 0.2 mgPt cm−2. The output of power performance trend follows the order of Au–AgPt NR/C B < Pt/C < AgPt NR/C < Au–AgPt NR/C A with peak power densities of 0.41, 0.48, 0.52 and 0.58 W cm−2, respectively. The enhanced power performance for Au–AgPt NR/C A indicates a positive effect of the Au integration on the AgPt alloy NR catalyst toward the ORR. This enhancement also depends on the arrangement of Pt, Ag and Au atoms along the NRs. Au–AgPt NR/C B containing the same composition as Au–AgPt NR/C A exhibits the lowest power performance because of its higher percentage of Au and Ag on the NR surface (Table 1).
 | ||
| Fig. 4 Power performance comparison of the MEAs with the cathode catalysts of AgPt NR/C and 5 at% Au integrated AgPt NR/C and Pt/C: (a) polarization and power density curves recorded at 80 °C in fully humidified H2/air at an absolute pressure of 2.5/2.3 bar and stoichiometric ratio of 1.3/1.5, respectively; (b) corresponding EIS spectra at 30 mA cm−2 with an amplitude of 4.5 mA cm−2 in the frequency range of 10k–0.1 Hz; (c) cathode CVs recorded between 0.05 and 1.2 V at a scan rate of 20 mV s−1 under H2/N2, and (d) the original and corrected polarization curves obtained under H2/O2 testing at an absolute pressure of 1.5/1.5 bar and a stoichiometric ratio of 2/9.5. | ||
The EIS analysis result at a low current density of 30 mA cm−2 (Fig. 4b) supports the obtained polarization curves. The MEAs made of the AgPt NR/C and Au–AgPt NR/C A catalysts show very close semi-circles, confirming a similar charge transfer resistance, which is smaller than that of Pt/C. The largest impedance was recorded for Au–AgPt NR/C B, indicating its poorest kinetic activity. This output further reveals that the enhanced ORR performance in operating fuel cells is mainly derived from the superior intrinsic properties of the catalyst induced by the architecture of the single-crystal 1D nanostructure and alloy composition. The 1D morphology provides enhanced electron transport paths and the catalyst layer from 1D nanostructures possesses a high porosity ratio facilitating the oxygen mass transport.15 Therefore, improved power performance is expected at the large current density region from the MEA made of Au–AgPt NR/C A with longer NRs, which is confirmed by the EIS spectra at larger current densities (low potentials) recorded at 0.65 and 0.5 V (Fig. S6†).
The polarization and power density curves of the MEAs made of the Au–AgPt NR/C A catalysts with various Au contents are also shown in Fig. S7a and b.† Enhanced power performance is recorded with the integration of Au, reaching the highest power density at 5 at% Au. The power densities at an operational voltage of 0.6 V are 0.48 and 0.52 W cm−2 for the catalysts containing 2 and 5 at% Au, respectively. Further increase of the Au content results in a decreased power density, and it drops to 0.41 W cm−2 at 12 at% Au, which is even lower than that of Pt NR/C. The corresponding EIS spectra (Fig. S7d†) show very close charge transfer resistances, indicating a similar kinetics activity for all catalysts. Even though the alloying degree is influenced by the concentrations of Au and Ag (Fig. S3†), their effect on the catalytic performance of 1D Pt alloy catalysts is less apparent than that of the arrangement of the metal within the alloyed structure (i.e. between Au–AgPt NR/C A and B).
ECSA representing the effective number of active catalytic sites for the ORR on the catalyst surface was determined from the H2 desorption peak of the cathode CV (Fig. 4c), and the values are listed in Table 2. The CV plots recorded in the MEA test show a similar trend to that from the half-cell RDE measurement (Fig. S8a†). The commercial Pt/C nanoparticle catalyst exhibits a much larger value than the NR catalysts. The smaller ECSA of the NR catalysts can be ascribed to the anisotropic morphology of the 1D nanostructures, which is in agreement with our previous study.42 The slightly larger ECSA of Au–AgPt NR/C A is attributed to the higher Pt distribution on the NR surface than that for AgPt NR/C, which has been confirmed by the XPS analysis result (Table 1). Meanwhile, a lower ECSA for Au–AgPt NR/C B is related to the high distribution of Au on the NR surface blocking the active catalytic sites, which was also reported in another study.31 This phenomenon is also found in the Au–AgPt NR/C catalysts with a high Au content prepared by following reaction scheme A. The CV plots and ECSA values are compared for the Au–AgPt NR/C with various Au contents and shown in Fig. S9.† A higher Au content induces more Au deposition on the NR surface (Fig. S4†), resulting in less exposure of the active Pt sites. Hence, a lower ECSA is observed (down to 21.37 and 18.34 m2 gPt−1 at 8 and 12 at% Au, respectively). These results demonstrate that a large ECSA is also preferred for the NR catalysts to minimize the voltage losses to achieve enhanced power performance. This also implies the limitation of applying a high Au content to further improve the catalytic performance of the Au–AgPt alloy nanorod catalysts.
| Catalyst | ECSA/m2 gPt−1 | MA/A mgPt−1 | SA/μA cm−2 |
|---|---|---|---|
| Pt/C | 50.67 | 0.065 | 130.29 |
| AgPt NR/C | 24.17 | 0.095 | 378.57 |
| Au–AgPt NR/C A | 25.98 | 0.110 | 425.22 |
| Au–AgPt NR/C B | 21.73 | 0.050 | 204.76 |
Fig. 4d shows the polarization curves obtained under H2/O2, and they were corrected with the H2-crossover current density and ohmic resistance loss (Fig. S10†) based on the method described by Gasteiger et al.43 The measured activities of the catalysts are summarized in Table 2. The highest mass activity is 0.110 A mgPt−1 at 0.9 V for Au–AgPt NR/C A, which is 1.15 and 1.7-fold higher than that of AgPt NR/C and Pt/C, respectively. For comparison, ORR mass and specific activities of 0.305 A mgPt−1 and 1078.78 μA cm−2 are achieved for Au–AgPt NR/C A in the RDE measurement (Fig. S8d and e†). These values are 1.5 and 4.4-fold higher than the 0.198 A mgPt−1 and 254.11 μA cm−2 of the commercial Pt/C catalyst, respectively. A higher ORR activity obtained in the RDE measurement is commonly observed because of the harsher environment during the PEMFC operation.3,44 Nevertheless, the results from both techniques show a similar trend, confirming the identical catalytic response of the tested catalysts toward the ORR.
The complexity of the MEA test in single fuel cells includes the resistances corresponding to proton transport across the catalyst layers and membrane, mass transfer of gases and water throughout the catalyst layers, etc. Such conditions are less represented in the clean environment of RDE measurement in liquid electrolytes. So far, only a few advanced shape-controlled catalysts have been successfully made for the MEA test. Pan et al. reported the realization of shape-controlled Pt hybrid catalysts in the MEA test under H2/O2 and H2/air.23 When utilising an ultra-low Pt loading, most of the shape-controlled Pt hybrid catalysts exhibited a higher mass activity at 0.9 V than the commercial Pt/C catalyst. However, very few of them outperform the Pt/C catalyst at a fuel cell operational voltage of 0.6 V under H2/air feeds. Such an issue is successfully addressed in this work, which further signifies the effectiveness of the ultrafine 1D Pt-hybrid nanostructure catalysts to optimize the ORR activities and mass transport characteristics in PEMFCs.
The enhanced catalytic activity of Au–AgPt NR/C A is first ascribed to its increased ECSA after the integration of Au, which is induced by the high distribution of Pt on the NR surface. Second, the presence of Au provides a tensile strain to the Pt and Ag lattice, resulting in a modified electronic structure as shown by the XPS analysis results in Fig. 3c and d. It has also been a strategy to optimize the binding affinity of the O-containing species on Pt at a certain degree, to escalate the catalytic kinetics activity.45,46 This is reflected in the cathode CVs in Fig. 4c. Positive shifts of the Pt oxygen reduction peak are recorded for the NR catalysts compared to Pt/C (0.805 V vs. RHE), linked to the weakening bond between the O-containing species and Au–AgPt NRs for the enhanced ORR performance. To be more specific, the Pt–O reduction peaks of AgPt NR/C and Au–AgPt NR/C A are located at 0.894 V and 0.901 V vs. RHE, respectively, further indicating the positive effect of the Au integration towards the ORR. Apart from the enhancement provided by the Au integration, the structure of 1D morphology also contributes to the improved catalytic activity. It offers preferential exposure of fewer low-coordination sites thus facilitating a better ORR kinetics rate.39
The main enhancement of the Au–AgPt NR/C catalyst is more significant toward its stability in fuel cell operation. This was evaluated using an ADT in MEAs by potential sweeping between 0.6 and 1.2 V at a scan rate of 100 mV s−1 for 5000 cycles. Comparison between the polarization curves before and after the ADT are shown in Fig. 5a. The recorded peak power densities after the ADT are 0.28, 0.26 and 0.35 W cm−2 for the MEAs with the cathode catalysts Pt/C, AgPt NR/C and Au–AgPt NR/C A, respectively, further revealing the positive effect of the Au integration on the electrode durability. This is also demonstrated from the results for the MEAs with the cathode catalysts with various Au contents (Fig. S11†). The degradation ratio decreases with the increase of Au content, and the power density decline ratio is only 39.17% at 8 at% Au after the ADT compared to the initial value, which is even lower than the power density loss of monometallic Pt NR/C (41.41%). To further monitor the stability of the as-prepared catalysts, comparison of the cathode CV plots recorded before and after the ADT and the ECSA decline ratios are shown in Fig. 5b. The NR alloy catalysts show a lower ECSA decline ratio than Pt/C, intensifying the higher stability of the 1D nanostructures. The ECSA loss is improved to 51.20% at the 5 at% Au content from the 62.12% of AgPt NR/C, and this is further minimized to 47.59% at 8 at% Au (Fig. S12†). This finding explains the role of Au in preventing the surface area loss, which contributes to minimizing the power performance drop during the ADT in the MEA test.
 | ||
| Fig. 5 (a) Polarization curves recorded before and after the accelerated degradation test (ADT) for the MEAs with the cathode catalyst made of AgPt/C NR and Au–AgPt NR/C A in comparison to commercial Pt/C. (b) Comparison of cathode CV plots before and after the ADT with the corresponding ECSA decline ratio (inset). The ADT was performed using potential sweeping between 0.6 and 1.2 V at a scan rate of 100 mV s−1 for 5000 cycles with H2/N2. | ||
>The superior stability of 1D Pt nanostructured catalysts in PEMFCs has been widely reported in the literature.14,42,48,49 However, further approaches to enhance the catalytic activity of the 1D Pt nanostructures through alloying remain a challenge because of the stability issue of the alloyed metals.8 Our previous studies demonstrated a more pronounced degradation mechanism of the bimetallic 1D Pt nanostructures hybridized with Ag and Ni,24,50 induced by the atomic segregation and susceptibility of the transition metals to oxidation in electrochemical reaction under acidic conditions. Hence, the bimetallic 1D nanostructures showed an about 10% larger ECSA loss after the ADT than their monometallic counterpart. In this work, a comparable ECSA loss to that of Pt NR/C (52.04%) is observed for 5 at% Au–AgPt NR/C A (52.20%). This further signifies the effectiveness of the Au integration to minimise the segregation and deformation of the 1D Pt-hybrid nanostructures.
The introduction of Au into AgPt NR/C changes the chemical and electrical properties of the 1D catalyst as shown by the XPS analysis results (Fig. 3c and d), which contributes not only to the catalytic activities but also its stability. A positive shift of the Pt binding energy after combining with 5 at% Au can be an indication of the increased Pt interaction (i.e. Pt–Pt, Pt–Ag and Pt–O).47 Consequently, it decreases the unstable high-energy Pt and Ag sites, promoting immunity to the surface area loss during the ADT in the fuel cell environment. Therefore, the NR structure of Au–AgPt NRs is more retained than that of AgPt NRs after the ADT (Fig. 6). Meanwhile, the destruction of the 1D AgPt nanostructures and aggregation are highly distinguished in the absence of Au, leading to the larger surface area loss and power performance drop after the ADT, which further manifests the stability issue of the alloy catalysts. Even though catalyst degradation and power performance decline cannot be fully avoided in PEMFC operation, the Au integration has successfully shown the improvement in the ECSA loss and structure degradation, which has been a major contribution to addressing the durability issue. Furthermore, the effectiveness of combining Au with the AgPt alloy catalyst to upgrade its catalytic activity and stability highly depends on the atomic arrangement and quantity of the Au content, and a good strategy is necessary to balance the enhancement in both activity and stability.
 | ||
| Fig. 6 TEM images of AgPt NR/C and Au–AgPt NR/C A before and after the ADT. | ||
Conclusion
In conclusion, a strategy is demonstrated by developing 1D Au integrated AgPt alloy nanorod catalysts with enhanced catalytic activities and stability in PEMFCs. A precise control of the Au integration process is crucial for regulating the catalyst structure. Introducing Au ions at an early reaction state is preferred to optimize Pt deposition on the nanostructure surface. The presence of Au tunes the reduction process during the growth of the 1D AgPt alloy, leading to longer NRs and thus enhanced mass transport performance for higher fuel cell power performance. The Au–AgPt NR/C A catalyst with 5 at% Au shows 1.12- and 1.2-fold higher peak power density, and 1.15- and 1.7-fold higher mass activity than the AgPt NR/C and Pt/C catalysts in the MEA test, respectively. A significantly enhanced effect of the Au integration is observed for the catalyst stability during PEMFC operation. The Au–AgPt NR/C catalyst exhibits a power density and an ECSA decline ratio of 39.63% and 51.20% after the ADT, respectively, which are much less than the 49.71% and 62.12% of AgPt NR/C and 44.19% and 76.61% of Pt/C. The increasing Au content can effectively reduce the ECSA loss during the ADT, but a high content blocks the catalytically active sites on the NR surface, finally resulting in poor fuel cell power performance. It is anticipated that the understanding obtained from the Au integration for NR catalysts in this work can help the design and development of practical shape-controlled alloy catalysts for PEMFCs.Conflicts of interest
There are no conflicts to declare.Acknowledgements
This work is part of E. Fidiani PhD studentship sponsored by the Indonesian Endowment Fund for Education (LPDP) and the EPSRC Centre for Doctoral Training in Fuel Cells and their Fuels (EP/L015749/1).References
- Y. Wang, K. S. Chen, J. Mishler, S. C. Cho and X. C. Adroher, Appl. Energy, 2011, 88, 981–1007 CrossRef CAS.
- T. Yoshida and K. Kojima, Electrochem. Soc. Interface, 2015, 24, 45–49 CrossRef CAS.
- M. K. Debe, Nature, 2012, 486, 43–51 CrossRef CAS.
- Y. T. Pan, L. Yan, Y. T. Shao, J. M. Zuo and H. Yang, Nano Lett., 2016, 16, 7988–7992 CrossRef CAS.
- D. Banham and S. Ye, ACS Energy Lett., 2017, 2, 629–638 CrossRef CAS.
- K. Jayasayee, J. A. R. Van Veen, T. G. Manivasagam, S. Celebi, E. J. M. Hensen and F. A. de Bruijn, Appl. Catal., B, 2012, 111–112, 515–526 CrossRef CAS.
- F. Maillard, L. Dubau, J. Durst, M. Chatenet, J. André and E. Rossinot, Electrochem. Commun., 2010, 12, 1161–1164 CrossRef CAS.
- Y. Hoshi, T. Yoshida, A. Nishikata and T. Tsuru, Electrochim. Acta, 2011, 56, 5302–5309 CrossRef CAS.
- L. Dubau, M. Lopez-Haro, L. Castanheira, J. Durst, M. Chatenet, P. Bayle-Guillemaud, L. Guétaz, N. Caqué, E. Rossinot and F. Maillard, Appl. Catal., B, 2013, 142–143, 801–808 CrossRef CAS.
- S. Chen, H. A. Gasteiger, K. Hayakawa, T. Tada and Y. Shao-Horn, J. Electrochem. Soc., 2010, 157, A82 CrossRef CAS.
- J. C. Meier, C. Galeano, I. Katsounaros, A. A. Topalov, A. Kostka, F. Schüth and K. J. J. Mayrhofer, ACS Catal., 2012, 2, 832–843 CrossRef CAS.
- K. Yu, D. J. Groom, X. Wang, Z. Yang, M. Gummalla, S. C. Ball, D. J. Myers and P. J. Ferreira, Chem. Mater., 2014, 26, 5540–5548 CrossRef CAS.
- H. Lv, J. Wang, Z. Yan, B. Li, D. Yang and C. Zhang, Fuel Cells, 2017, 17, 635–642 CrossRef CAS.
- B. Li, D. C. Higgins, Q. Xiao, D. Yang, C. Zhng, M. Cai, Z. Chen and J. Ma, Appl. Catal., B, 2015, 162, 133–140 CrossRef CAS.
- Y. Lu, S. Du and R. Steinberger-Wilckens, Appl. Catal., B, 2016, 199, 292–314 CrossRef CAS.
- M. Li, Z. Zhao, T. Cheng, A. Fortunelli, C. Y. Chen, R. Yu, Q. Zhang, L. Gu, B. V. Merinov, Z. Lin, E. Zhu, T. Yu, Q. Jia, J. Guo, L. Zhang, W. A. Goddard, Y. Huang and X. Duan, Science, 2016, 354, 1414–1419 CrossRef CAS.
- J. N. Tiwari, R. N. Tiwari and K. S. Kim, Prog. Mater. Sci., 2012, 57, 724–803 CrossRef CAS.
- Y. Lu, Y. Jiang and W. Chen, Nano Energy, 2013, 2, 836–844 CrossRef CAS.
- Y. T. Liang, S. P. Lin, C. W. Liu, S. R. Chung, T. Y. Chen, J. H. Wang and K. W. Wang, Chem. Commun., 2015, 51, 6605–6608 RSC.
- Y. C. Tseng, H. S. Chen, C. W. Liu, T. H. Yeh and K. W. Wang, J. Mater. Chem. A, 2014, 2, 4270–4275 RSC.
- N. N. Kariuki, W. J. Khudhayer, T. Karabacak and D. J. Myers, ACS Catal., 2013, 3, 3123–3132 CrossRef CAS.
- A. Kongkanand and M. F. Mathias, J. Phys. Chem. Lett., 2016, 7, 1127–1137 CrossRef CAS.
- L. Pan, S. Ott, F. Dionigi and P. Strasser, Curr. Opin. Electrochem., 2019, 18, 61–71 CrossRef CAS.
- E. Fidiani, G. Thirunavukkarasu, Y. Li, Y.-L. Chiu and S. Du, J. Mater. Chem. A, 2020, 8, 11874–11883 RSC.
- Y. Ma and P. B. Balbuena, Surf. Sci., 2008, 602, 107–113 CrossRef CAS.
- Y. T. Liang, S. P. Lin, C. W. Liu, S. R. Chung, T. Y. Chen, J. H. Wang and K. W. Wang, Chem. Commun., 2015, 51, 6605–6608 RSC.
- J. Choi, J. Cho, C. W. Roh, B. S. Kim, M. S. Choi, H. Jeong, H. C. Ham and H. Lee, Appl. Catal., B, 2019, 247, 142–149 CrossRef CAS.
- A. Dorjgotov, Y. Jeon, J. Hwang, B. Ulziidelger, H. S. Kim, B. Han and Y. G. Shul, Electrochim. Acta, 2017, 228, 389–397 CrossRef CAS.
- M. Gatalo, P. Jovanovič, G. Polymeros, J.-P. Grote, A. Pavlišič, F. Ruiz-Zepeda, V. S. Šelih, M. Šala, S. Hočevar, M. Bele, K. J. J. Mayrhofer, N. Hodnik and M. Gaberšček, ACS Catal., 2016, 6, 1630–1634 CrossRef CAS.
- C. Wang, D. Van Der Vliet, K. L. More, N. J. Zaluzec, S. Peng, S. Sun, H. Daimon, G. Wang, J. Greeley, J. Pearson, A. P. Paulikas, G. Karapetrov, D. Strmcnik, N. M. Markovic and V. R. Stamenkovic, Nano Lett., 2011, 11, 919–926 CrossRef CAS.
- J. Zhang, K. Sasaki, E. Sutter and R. R. Adzic, Science, 2007, 315, 220–222 CrossRef CAS.
- C. E. Kim, D. H. Lim, J. H. Jang, H. J. Kim, S. P. Yoon, J. Han, S. W. Nam, S. A. Hong, A. Soon and H. C. Ham, J. Chem. Phys., 2015, 142, 034707 CrossRef.
- K. Sasaki, H. Naohara, Y. Choi, Y. Cai, W. F. Chen, P. Liu and R. R. Adzic, Nat. Commun., 2012, 3, 1115 CrossRef.
- L. L. Shen, G. R. Zhang, S. Miao, J. Liu and B. Q. Xu, ACS Catal., 2016, 6, 1680–1690 CrossRef CAS.
- Y. Kang, J. Snyder, M. Chi, D. Li, K. L. More, N. M. Markovic and V. R. Stamenkovic, Nano Lett., 2014, 14, 6361–6367 CrossRef CAS.
- G. Tsotridis, A. Pilenga, G. De Marco and T. Malkow, EU Harmonised Test Protocols for PEMFC MEA Testing in Single Cell Configuration for Automotive Applications, JRC Science for Policy Report, 2015 Search PubMed.
- C. Busó-Rogero, A. Ferre-Vilaplana, E. Herrero and J. M. Feliu, Electrochem. Commun., 2019, 98, 10–14 CrossRef.
- C. Tojo, D. Buceta and M. A. López-Quintela, J. Phys. Chem. C, 2018, 122, 20006–20018 CrossRef CAS.
- S. Sun, G. Zhang, D. Geng, Y. Chen, R. Li, M. Cai and X. Sun, Angew. Chem., Int. Ed., 2011, 50, 422–426 CrossRef CAS.
- X. Xie, G. Gao, S. Kang, T. Shibayama, Y. Lei, D. Gao and L. Cai, Adv. Mater., 2015, 27, 5573–5577 CrossRef CAS.
- C. Fang, J. Zhao, G. Zhao, L. Kuai and B. Geng, Nanoscale, 2016, 8, 14971–14978 RSC.
- Y. Lu, S. Du and R. Steinberger-Wilckens, Appl. Catal., B, 2015, 164, 389–395 CrossRef CAS.
- H. A. Gasteiger, S. S. Kocha, B. Sompalli and F. T. Wagner, Appl. Catal., B, 2005, 56, 9–35 CrossRef CAS.
- L. Chong, J. Wen, J. Kubal, F. G. Sen, J. Zou, J. Greeley, M. Chan, H. Barkholtz, W. Ding and D. J. Liu, Science, 2018, 362, 1276–1281 CrossRef CAS.
- V. Stamenkovic, B. S. Mun, K. J. J. Mayrhofer, P. N. Ross, N. M. Markovic, J. Rossmeisl, J. Greeley and J. K. Nørskov, Angew. Chem., Int. Ed. Engl., 2006, 45, 2897–2901 CrossRef CAS.
- M. P. Hyman and J. W. Medlin, J. Phys. Chem. C, 2007, 111, 17052–17060 CrossRef CAS.
- W. An and P. Liu, ACS Catal., 2015, 5, 6328–6336 CrossRef CAS.
- B. Li, Z. Yan, D. C. Higgins, D. Yang, Z. Chen and J. Ma, J. Power Sources, 2014, 262, 488–493 CrossRef CAS.
- P. Mardle, X. Ji, J. Wu, S. Guan, H. Dong and S. Du, Appl. Catal., B, 2020, 260, 118031 CrossRef CAS.
- P. Mardle, G. Thirunavukkarasu, S. Guan, Y. L. Chiu and S. Du, ACS Appl. Mater. Interfaces, 2020, 12, 42832–42841 CrossRef CAS.
Footnote |
| † Electronic supplementary information (ESI) available: HRTEM images and EDX analysis results of Au–AgPt NR/C B, TEM images of Au–AgPt NR/C synthesized following reaction scheme A with different Au contents and the corresponding TGA and ICP-MS analysis results. XRD patterns and high resolution XPS peaks of the Pt and Ag regions of Au–AgPt NR/C with different Au at% synthesized following reaction scheme A, including a table summarizing the compositions of the as-prepared catalysts. EIS spectra measured at 0.65 and 0.5 V of the as-prepared catalysts. MEA testing results of Au–AgPt NR/C A with varied Au at% benchmarked against Pt NR/C and AgPt NR/C, presented with the cathode CVs and corresponding ECSA comparison. The results of the RDE measurement and the plots to determine the internal ohmic resistance hydrogen crossover current density. The recorded polarization, power density curves and cathode CVs of Pt NRs, AgPt NR/C and Au–AgPt NR/C A with different Au at% after the ADT. See DOI: 10.1039/d0ta08551k |
| This journal is © The Royal Society of Chemistry 2021 |