DOI:
10.1039/D1SM01276B
(Paper)
Soft Matter, 2021,
17, 10447-10457
Turbulence-induced clustering in compressible active fluids†
Received
3rd September 2021
, Accepted 12th October 2021
First published on 11th November 2021
Abstract
We study a novel phase of active polar fluids, which is characterized by the continuous creation and destruction of dense clusters due to self-sustained turbulence. This state arises due to the interplay between self-advection of the aligned swimmers and their defect topology. The typical cluster size is determined by the characteristic vortex size. Our results are obtained by investigating a continuum model of compressible polar active fluids, which incorporates typical experimental observations in bacterial suspensions, in particular a non-monotone dependence of speed on density.
1 Introduction
Active matter has become a central topic of contemporary physics with applications ranging from collective motion of animals and cells1 to new forms of soft matter2 and the dynamics of cells and tissues.3 Among active systems, bacterial colonies provide an intriguing and experimentally well-controllable class of systems. Many aspects of their behavior can be understood by analogies to fundamental non-equilibrium statistical physics.4 Several bacterial species provide showcases for collective motion and ordered patterns, that can be described by simple models of self-propelled particles dominated by alignment5 or repulsive interactions and particle shape.6 Suspensions of swimming bacteria may be governed, in addition, by longer range hydrodynamic interactions, which can lead to a new dynamic state referred to as meso-scale turbulence. This dynamical state is characterized by the presence of self-sustained vortices and jets and is reminiscent of turbulence.7–12 In contrast to inertial turbulence there exists a characteristics vortex size,7,9,13,14 which can be explained by the competition between alignment and hydrodynamic interactions.14–17 However, models of meso-scale turbulence commonly assume incompressibility,14–17 and are therefore not able to describe clustering phenomena.
A common description of compressible active fluids is based on self-propulsion and purely repulsive interactions showing intriguing non-equilibrium phenomena like motility-induced phase separation (MIPS).18–20 For this phenomenon it is crucial that the self-propulsion speed of the particle slows down with increasing density.19 In this context, experiments of bacterial suspensions exhibit a puzzling situation: On the one hand, the speed of bacteria increases with density for low and intermediate densities21 and on the other hand, clusters or density variations are commonly present and often emerge from dilute initial conditions.22 This behavior has not been explained so far. While there exist approaches to model bacterial turbulence incorporating density variations,23,24 those models do not feature a characteristic length scale observed experimentally.7,9,13,14
Based on our previous investigations,25 where a continuum model was proposed that combines meso-scale turbulence with MIPS, we extend here this concept and incorporate typical experimental observations in bacterial suspensions by assuming a non-monotone dependence of speed on density, see Fig. 1(a). Our previous study25 considered the dynamics in a simplistic regime (monotone decrease of speed with density) and identified several interesting phases, including turbulence-induced clustering, which is characterized by the continued formation, reshaping and fracture of dense clusters. Here, we focus on this novel phase in a more realistic setup, analyze its properties, their dependence on different physical parameters and scope within parameter space. In particular, we show that the dynamic arises due to self-advection of the aligned swimmers and point out that the nucleation of clusters is organized by the defect topology in the polar order field of the swimmers. In general, topological defects often dominate the dynamics of active biological matter: they govern cell death and extrusion in epithelial tissues,26 control the dynamics in neural cell cultures27 and promote new layer formation in dense bacterial colonies.28 Moreover, we show that the average cluster size depends linearly on the characteristic vortex size. Overall, our results point out an alternative way how clusters can emerge in systems far from equilibrium.
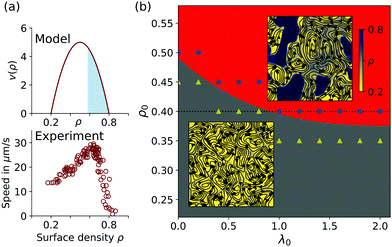 |
| | Fig. 1 (a) Density-dependent speed v(ρ) in our model (see eqn (2)) and obtained from experiments (reproduced from ref. 21). Linearly unstable region due to MIPS is colored in blue, see Section A.1. (b) Phase diagram for Γ2 = −Γ0 = 1 while varying ρ0 and λ0 exhibiting meso-scale turbulence with homogeneous density (MST, grey) and turbulence-induced clustering (TIC, red). Symbols represent simulation data, from which the phase boundary is estimated (yellow triangles = MST, blue circles = TIC). Insets: Typical snapshots of the respective states. Streamlines calculated from v, while the background color is obtained from ρ (see colorbar). For better visualization no streamlines are plotted for areas with ρ = ρmax, i.e. inside dense clusters. | |
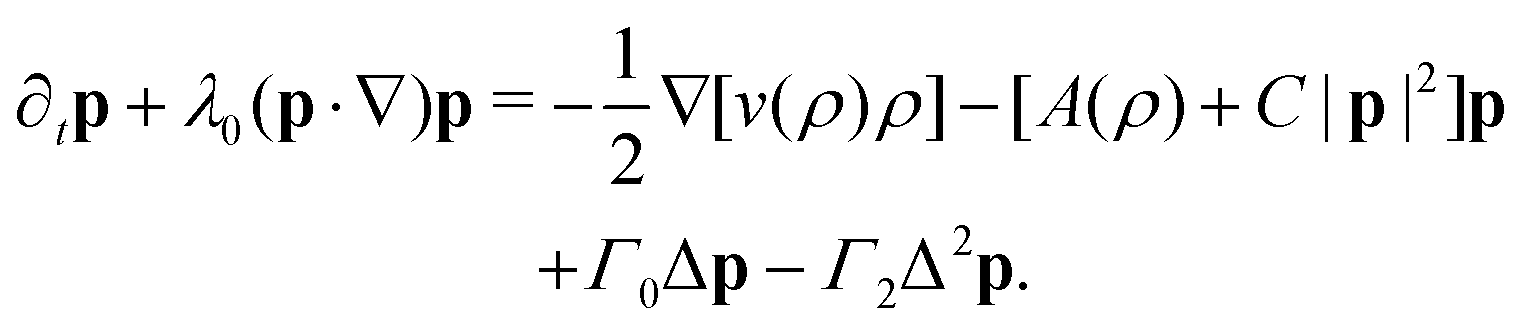
2 Model
The proposed model for compressible active fluids consists of coupled equations for the density ρ and the polarization density p, quantifying polar order, see25| | | ∂tρ = −∇·[v(ρ)p] + DΔρ, | (1a) |
| |  | (1b) |
The evolution of the density is governed by the continuity equation eqn (1a), where the current density consists of a diffusive part and a term stemming from the directed motion of the particles. Eqn (1b) is reminiscent of the equation to model meso-scale turbulence.16,17 The terms arise due to self-propulsion, alignment and hydrodynamic interactions. The term involving the gradient of ρ couples the polarization to the evolution of the density. The velocity field v(x, t) is obtained from v = v(ρ)p/ρ. Consequently, the polarization is parallel to the velocity. This is a restriction of our model, as experiments have shown that cells in bacterial suspensions are not fully aligned with the flow.4,29 A derivation of a continuum model of meso-scale turbulence that treats the polarization and solvent flow fields separately, but assumes a constant density, can be found in ref. 17. We model the density-dependent speed v(ρ) with the quadratic function| | | v(ρ) = −c[ρ − (ρmax + ρmin)/2]2 + v0, | (2) |
where c = 4v0/(ρmax− ρmin)2. This form is motivated by experimental studies of bacterial suspensions,21,30 see Fig. 1(a). We remark that the behaviour of bacterial suspensions at the onset of meso-scale turbulence, i.e. in the limit ρ → ρmin, is poorly understood. Hence, we do not expect to accurately capture the dynamics with our model in this limit.
Furthermore, density ρ and polarization p couple to each other via the polar alignment strength A(ρ) in eqn (1b). Inspired by Landau theory, one often assumes A(ρ) = A0(ρc − ρ) to model the polar-isotropic phase transition. For simplicity, we assume that the onset of collective motion coincides with the polar-isotropic phase transition, i.e. ρc = ρmin and hence A(ρ) < 0.
In our numerical simulations, we choose ρmin = 0.2 and ρmax = 0.8 in line with experimental results.21 Moreover, we fix A0 = 0.3, C = 0.5, D = 5 and v0 = 5. We vary the mean density ρ0, and use Γ0 and Γ2 to control the characteristic vortex size. Finally, the strength of self-advection of the polarization is tuned by λ0 (for details on the numerics see Section B.1).
3 Phase diagram
We initiate simulations with a homogeneous density profile and choose Γ0 = −1 and Γ2 = 1, such that the system is in a meso-scale turbulent state.25 This state is characterized by vortices with a characteristic length scale as well as the presence of dynamical jets.14,15,31 By varying the mean density ρ0 and the strength of self-advection λ0, we sketch a phase diagram, see Fig. 1(b). Note that the mean density ρ0 is varied outside the spinodal regime of MIPS, i.e. between ρmin and ρs ≈ 0.58, see Fig. 1(a) and Section A.5.
Meso-scale turbulence (MST) or vortex lattices accompanied by an almost constant density ρ ≈ ρ0 are observed for low values of ρ0 and λ0. For high values of ρ0 and λ0, we discover a novel phase, which we refer to as turbulence-induced clustering (TIC). In this phase dense clusters with ρ = ρmax, hence v = 0, emerge throughout the simulation domain, while dilute areas are still characterized by vortices. The dense clusters are not fixed in space but rather get reshaped and stretched. Furthermore, clusters commonly fracture and smaller parts of the fracture might vanish. We emphasize that the emergence, reshaping and fracture of clusters continues indefinitely. That is, while a cluster might fracture in one part of the simulation domain, a new cluster might emerge at another place, see the supplemental movie. Quantitatively, the two phases can be distinguished by determining the modality of the density distribution, see ref. 25 for details.
To quantify the dynamical evolution of dense clusters, we use Minkowski functionals. They provide a mathematical framework to completely characterize the morphology of patterns.32,33 In two dimensions, the Minkowski functionals coincide with the area A, perimeter U and Euler number χ. The Euler number can be calculated by counting the number of connected finite domains, in our case the dense clusters, and subtracting the number of holes. Hence, the Euler number is a topological quantity related to the number of clusters. For our purposes, Minkowski functionals can robustly quantify whether there is coarsening, and they allow to detect geometrical changes. These insights cannot be reliably gained from the more commonly studied quantities such as the number of clusters and the average cluster size. For example, if the dense phase is more abundant than the dilute phase, the dense phase forms a connected domain interspersed with holes, see Section A.5 for an illustration. If the system coarsens, these holes vanish over time, eventually leaving only one large hole. Such a coarsening process cannot be quantified by the number of clusters or the size of the cluster as both do not change over time (up to fluctuations of course). In contrast, Minkowski functionals can discriminate whether the systems coarsens or not. If there is coarsening, the Euler number would increase, eventually reaching a value of −1, while the perimeter would decrease.33 Moreover, Minkowski functionals can quantify geometrical changes. For example, a deformation of a spherical cluster leads to an increase of the perimeter while the area remains constant. Such observations are not possible from the number of clusters and cluster sizes. Besides, the computation of Minkowski functionals is straightforward and fast as one only must count pixels, see Section B.3. In contrast, the determination of cluster properties in a system with periodic boundary conditions is much more tedious and time consuming, see Section B.2. Therefore, Minkowski functionals allow for a computationally inexpensive and precise analysis of the geometrical and topological features of our system. For details on Minkowski functionals refer to Section B.3.
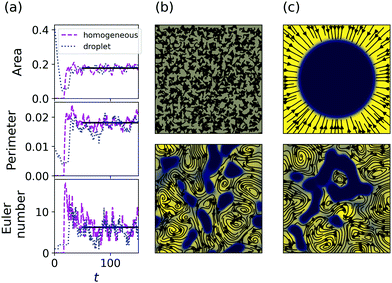
Analyzing the temporal evolution of the Minkowski functionals in the TIC phase reveals that A, U and χ fluctuate around a non-zero mean value, see Section A.5, due to continuous creation and destruction of clusters, which indicates a statistical steady state. We rule out finite-size effects by varying the linear size L of the system, see Section A.3. To further test the robustness of our results, we initiate simulations with a single dense circular domain and vary the self-advection strength λ0 along the dotted line in Fig. 1(b). For low values of λ0 (i.e. in the MST phase) the mean values of the Minkowski functionals are well separated (Fig. 2(a)): an initial circular cluster preserves its Euler number 1 and maintains positive area and perimeter, while the Minkowski functionals are zero for the homogeneous density profile. Hence, the time evolution in the MST phase depends heavily on the initial conditions, see Fig. 2(b) and (c). For high values of λ0 (i.e. in the TIC phase) differences in the time-averaged Minkowski functionals cannot be attributed to the initial conditions. After a transient, the dynamics and statistical properties of the system for different initial conditions are indistinguishable, see Fig. 2(a) and Section A.2. From this observation we can draw two conclusions about the TIC phase: (1) the novel statistical steady state is independent of the initial conditions and (2) the completely phase separated state is unstable. The second conclusion in turn shows that another process than MIPS must be responsible for the TIC phase, as MIPS predicts a complete phase separation on long time scales. Our results indicate that self-advection through the non-linear term λ0(p·∇)p of the polarization triggers the nucleation of clusters as well as the fracture of already existing domains.
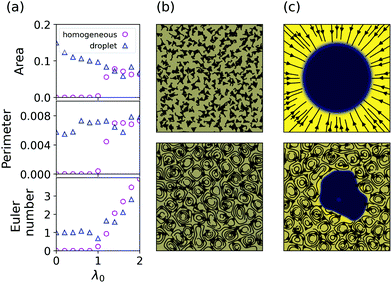 |
| | Fig. 2 (a) Time-averaged Minkowski functionals when varying λ0 along the dotted line in Fig. 1(b), i.e. for ρ0 = 0.4. Circles represent runs started from a homogeneous density profile, while triangles represent runs started from an initial dense droplet. Surface area and perimeter are rescaled by the domain size to yield fractions. (b and c) Snapshots of the initial condition (upper) and at t = 150 (end of the simulation, lower) for a homogeneous density profile (b) and an initial droplet (c) in the MST phase, i.e. for ρ0 = 0.4 and λ0 = 0. Respective snapshots of the TIC phase are provided in Section A.2. In all subfigures Γ2 = −Γ0 = 1. | |
4 Dynamical creation and destruction of clusters due to meso-scale turbulence
The nucleation of clusters due to meso-scale turbulence can be understood by the compressibility of the system and the local defect topology. We illustrate this by initiating the system with a vortex lattice at constant density ρ = ρ0. In this situation, the evolution of the density eqn (1a) reduces to ∂tρ = −v(ρ0)∇·p. Hence, density changes are only possible if sinks (∇·p < 0) or sources (∇·p > 0) of the polarization are present. We remark that this argument is only valid at the early stages, when density gradients are negligible. We detect sources and sinks of the polarization by computing the integral 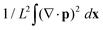 . Fig. 3(b) shows that the maximum of this integral increases with the strength of self-advection λ0, leading to density gradients within the system.
 |
| | Fig. 3 (a) Snapshots at t = 20 of runs started from a vortex lattice with ρ0 = 0.25, Γ0 = −2, Γ2 = 1 for λ0 = 0 and λ0 = 3. (b) Maximal absolute divergence, i.e. for the initial stage of the vortex lattice, i.e. for δt = 10, when varying λ0. Parameters as in (a). (c) Snapshots of a cluster growing from random initial conditions with ρ0 = 0.45, λ0 = 0.5. (d) Evolution of a flat interface between a dense cluster and a vortex array in the dilute region with ρ0 = 0.45 and λ0 = 3. In (a, c and d) arrows represent the p field, with arrow color indicating clockwise (red) and counterclockwise (green) rotating vortices. for the initial stage of the vortex lattice, i.e. for δt = 10, when varying λ0. Parameters as in (a). (c) Snapshots of a cluster growing from random initial conditions with ρ0 = 0.45, λ0 = 0.5. (d) Evolution of a flat interface between a dense cluster and a vortex array in the dilute region with ρ0 = 0.45 and λ0 = 3. In (a, c and d) arrows represent the p field, with arrow color indicating clockwise (red) and counterclockwise (green) rotating vortices. | |
Analyzing the snapshots in Fig. 3(a) shows that the density changes are organized by the defect topology of the polarization. In a vortex lattice, a topological defect with charge 1 is located at the vortex center and the point in between four adjacent vortices is a topological defect with charge −1. Moreover, the points in between four adjacent vortices are saddle-points of the polarization field. While for λ0 = 0 the vortex lattice is only perturbed marginally, high values of λ0 result in the appearance of sources of the polarization at the vortices. Clearly, combining a source with a vortex results in an outward spiral. This is in line with simulation results from.34 Therein, elongated pushers (like Bacillus subtilis) show a propensity to form outward spirals, when increasing self-advection. Density shifted away from the vortices accumulates in between four adjacent vortices (Fig. 3(a)) due to mass conservation. This is reminiscent of the results of,35 where swimmers forced by a velocity field in the form of a vortex lattice leave the vortices and accumulate in between them. Hence, there is a density shift from topological defects with charge 1 to those with topological charge −1, which represent possible nucleation sites for dense clusters. Indeed, in simulations started from random initial conditions, clusters preferentially nucleate in between four adjacent vortices, see Fig. 3(c). Furthermore, initiating the system with a flat interface between a dense cluster and a vortex array in the dilute region, shows that the surrounding vortices modulate and eventually break-up the interface, see Fig. 3(d).
5 Cluster size
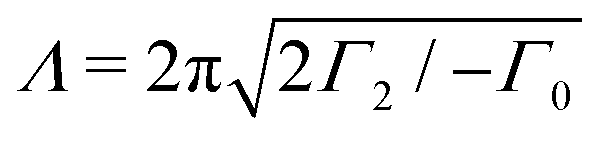
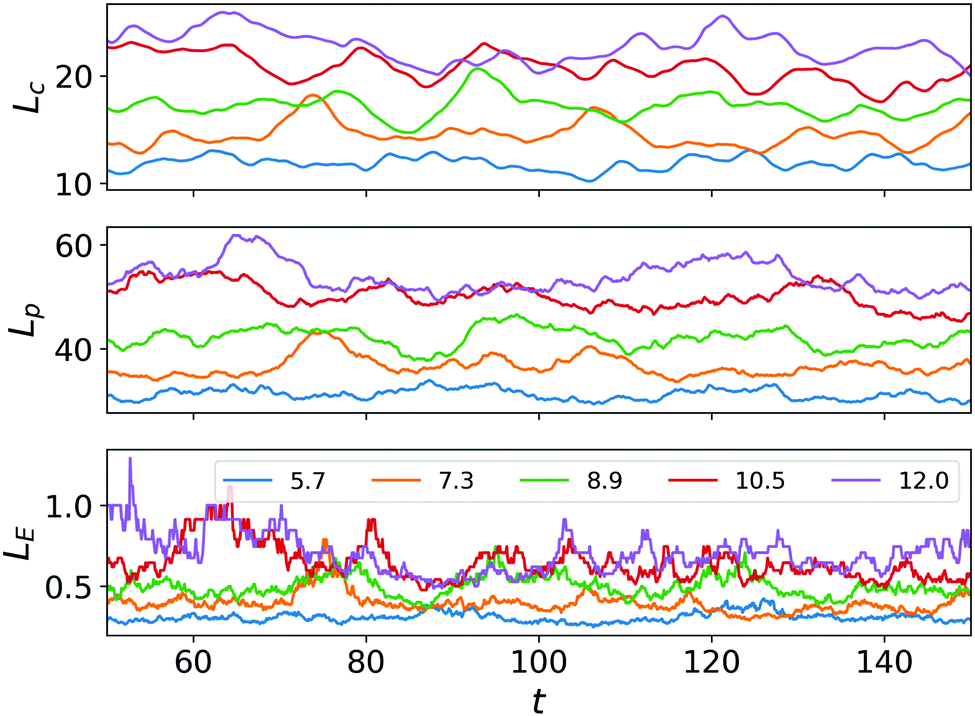
Finally, we address the mechanism which determines the average cluster size in the TIC phase. Trivially, the cluster size depends on the mean density ρ0, see Section A.5. More interestingly, for fixed ρ0, the cluster size changes with the characteristic vortex size. The characteristic vortex size can be estimated from the fastest growing mode kc obtained from the stability analysis as  , see Section A.1.
Increasing Λ results in a decrease in the number of clusters (Fig. 4(a)), but a higher probability to find larger clusters, which can be deduced from the cluster size distribution plotted in Fig. 4(b). Moreover, we compute a characteristic domain size L* either from the density correlation function (Lc), the perimeter (Lp) or the Euler number (LE), see Section A.6. All three quantities increase linearly with Λ, see Fig. 4(c). This shows that the mean value, around which the Minkowski functionals fluctuate, is determined by the characteristic vortex size. A possible explanation is provided by our previous observation that clusters preferentially nucleate in between adjacent vortices. Increasing the vortex size leaves more space in between vortices (implies larger distance between topological defects with charge +1), while the number of possible nucleation sites reduces, resulting in fewer but larger clusters. Hence, we conjecture that the novel TIC phase can be understood as fluctuations around a vortex lattice with dense cluster situated in between vortices.
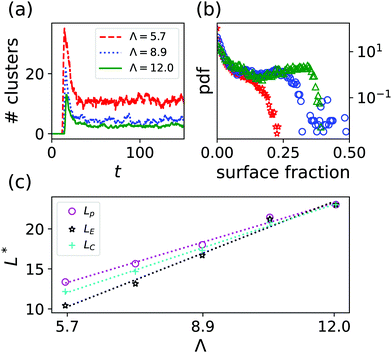 |
| | Fig. 4 (a) Number of clusters, (b) cluster size distribution and (c) characteristic domain size L* for different characteristic vortex sizes  . Details for the choice of Γ0,Γ2 can be found in Section A.6. Data is obtained for ρ0 = 0.5 by averaging over 100 time steps after a transient of δt = 50 for 10 runs ((a) and (b)) and 5 runs (c) with identical parameters but different random initial conditions. Colors in (b) correspond to those in (a). In (c) the characteristic domain size obtained from the perimeter (Lp, magenta circles), the Euler number (LE, black stars) and the correlation function (Lc, cyan crosses) is shown. As a visual guide linear fits for all three cases are provided as dashed lines. Lp and LE are rescaled with the maximum of Lc. . Details for the choice of Γ0,Γ2 can be found in Section A.6. Data is obtained for ρ0 = 0.5 by averaging over 100 time steps after a transient of δt = 50 for 10 runs ((a) and (b)) and 5 runs (c) with identical parameters but different random initial conditions. Colors in (b) correspond to those in (a). In (c) the characteristic domain size obtained from the perimeter (Lp, magenta circles), the Euler number (LE, black stars) and the correlation function (Lc, cyan crosses) is shown. As a visual guide linear fits for all three cases are provided as dashed lines. Lp and LE are rescaled with the maximum of Lc. | |
6 Conclusions
We presented an extension of a continuum model that combines MIPS with meso-scale turbulence by including a realistic self-propulsion speed dependence on density. By numerical investigations, we showed that meso-scale turbulence induces dynamical clustering if incompressibility is not enforced. Independent of the system size and initial conditions, a novel dynamical state emerges, which is characterized by the continuous nucleation, deformation and destruction of clusters. These antagonistic dynamics arise due a common cause: Hydrodynamic interactions lead to self-advection of the polarization governing the dynamics. This points to the importance of hydrodynamic interactions, which are usually excluded in the literature,36,37 when studying clustering phenomena of elongated self-propelled particles. Moreover, our prediction of a linear dependence of the cluster size on the characteristic vortex size can be easily examined experimentally, where these quantities are readily accessible. Hence, our model allows for a quantitative comparison with real systems exhibiting TIC.
Furthermore, the TIC phase extends to densities ρ0 > ρs, i.e. to the regime where spinodal decomposition through MIPS is expected: Clusters form initially through a process reminiscent of spinodal decomposition, while on long time scales we observe continued emergence, reshaping and fracture of clusters, see Section A.5. Hence, turbulence-induced clustering is a generic phenomenon for compressible polar active fluids. However, our results depend on the assumption that the polarization and velocity fields are parallel. In general, the topological defects of the polarization and velocity fields do not coincide if this assumption is violated. As the topological defects play a central role in the formation of clusters, we cannot claim that turbulence-induced clustering is expected, if a more general class of compressible active fluids is considered.
Our results bear some reminiscence to passive systems quenched into the spinodal regime in the presence of turbulence. Therein, thermodynamic forces drive coarsening, while existing domains are broken up due to the turbulent motion. The competition between these effects leads to a coarsening arrest at a certain length scale.38–41 However, there are two notable novel aspects of our observations: Firstly, nucleation of clusters due to inertial turbulence is not reported for passive systems,38–41 where clusters emerge spontaneously as the system is quenched into the spinodal regime. Our simulations are performed outside the spinodal regime. Consequently, clustering is initiated and governed by the turbulent fluid motion in the active system. Secondly, the average cluster size in the active system is controlled by the characteristic vortex size, rather than by opposing forces. Hence, turbulence-induced clustering illustrates a novel route to pattern formation which is unique to active systems. In the context of biological systems, it points to a possible functional benefit of meso-scale turbulence, e.g. as a driver for aggregation of bacteria at low and intermediate densities.
Conflicts of interest
There are no conflicts to declare.
A Appendix
A.1 Stability analysis
A linear stability analysis of the model eqn (1) can be performed as detailed in ref. 25. Since we set ρmin = ρc, the only attainable, trivial steady state is given by (ρ,p) ≡ (ρ0,p0) with  (global polar order). Introducing perturbations p → p0 + δp and ρ → ρ0 + δρ and linearizing eqn (1) close to the steady state (ρ,p) ≡ (ρ0,p0) yields the equations of motion for the perturbations
| |  | (3) |
Next, we expand the perturbations in Fourier modes as| | 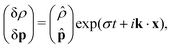 | (4) |
where k = (k1,k2). Inserting this expression into eqn (3) leads to| |  | (5) |
As the expression eqn (5) is not very handy, we solve the dispersion relation numerically. Fig. 5(a) shows the dispersion relation in the direction k⊥ perpendicular to p0 for the parameters used in Fig. 1. While σ1 and σ2 do not show any instabilities, σ3 exhibits a finite-wavelength instability. The critical wavenumber kc is given by 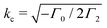 . Hence, this instability is the one expected from meso-scale turbulence. Fig. 5(b) shows the dispersion relation for ρ0 = 0.6. In addition, to the finite-wavelength instability, a long-wavelength instability in σ2 appears. This instability is reminiscent of MIPS, see also.25 The appearance of the long-wavelength instability marks the spinodal ρs of the system, i.e., the point when the homogeneous density profile looses stability. The numerically computed value of the spinodal is ρs ≈ 0.58. See also the discussion in Section A.5.
 |
| | Fig. 5 Dispersion relations for the polar state in the direction k⊥ perpendicular to p0. Parameters are chosen as described in the main text with Γ0 = −Γ2 = −1 and λ0 = 3. (a) ρ0 = 0.45 and (b) ρ0 = 0.6. The position of the critical wavenumber kc is shown by a black dashed line in (a). | |
For the data shown in Fig. 4, the parameters Γ0,Γ2 are chosen such that the amplitude σ(kc) is fixed when varying Λ. The amplitude σ(kc) can be seen as a measure for the distance to the instability. Hence, fixing σ(kc) guarantees a similar energy input of the finite-wavelength instability. This is important as it is known that close to the instability, σ(kc) ≈ 0 no meso-scale turbulence is observed, but a vortex lattice25,31 instead.
A.2 Independence of initial conditions
As mentioned in the main text, in the TIC phase the Minkowski functionals fluctuate around a non-zero mean value. This is depicted in Fig. 6(a). The mean value is independent of the initial conditions, which we illustrate by initializing the system with a dense droplet as well as a homogeneous density profile.
 |
| | Fig. 6 (a) Time evolution of the Minkowski functionals for Γ2 = −Γ0 = 1, ρ0 = 0.45 and λ0 = 3 for a system initiated with a homogeneous density profile (dashed purple line) and a dense droplet (dotted blue line). The solid black line shows the average after an initial transient. Surface area and perimeter are rescaled by the domain size to yield fractions. (b and c) Snapshots of the initial condition (upper) and at t = 150 (end of the simulation, lower) for a homogeneous density profile (b) and an initial droplet (c) with parameters as in (a). | |
We used the independence of initial conditions to distinguish between the MST and TIC phases when varying the strength of self-advection λ0, see Fig. 2 in the main text. However, the determination of a critical λc0 depends sensitively on the parameters and initial conditions of the system. For large values of λ0, clusters nucleate immediately at the onset of meso-scale turbulence, i.e. the time of emergence of the first cluster is independent of λ0. However, the nucleation time of the first cluster increases when reducing λ0 to λ0 ≈ 1. Hence, we cannot rule out the nucleation of clusters due to meso-scale turbulence for smaller values of λ0, as the nucleation time might lie outside our simulated time frame. Therefore, details about the sensitivity on initial conditions remain unclear.
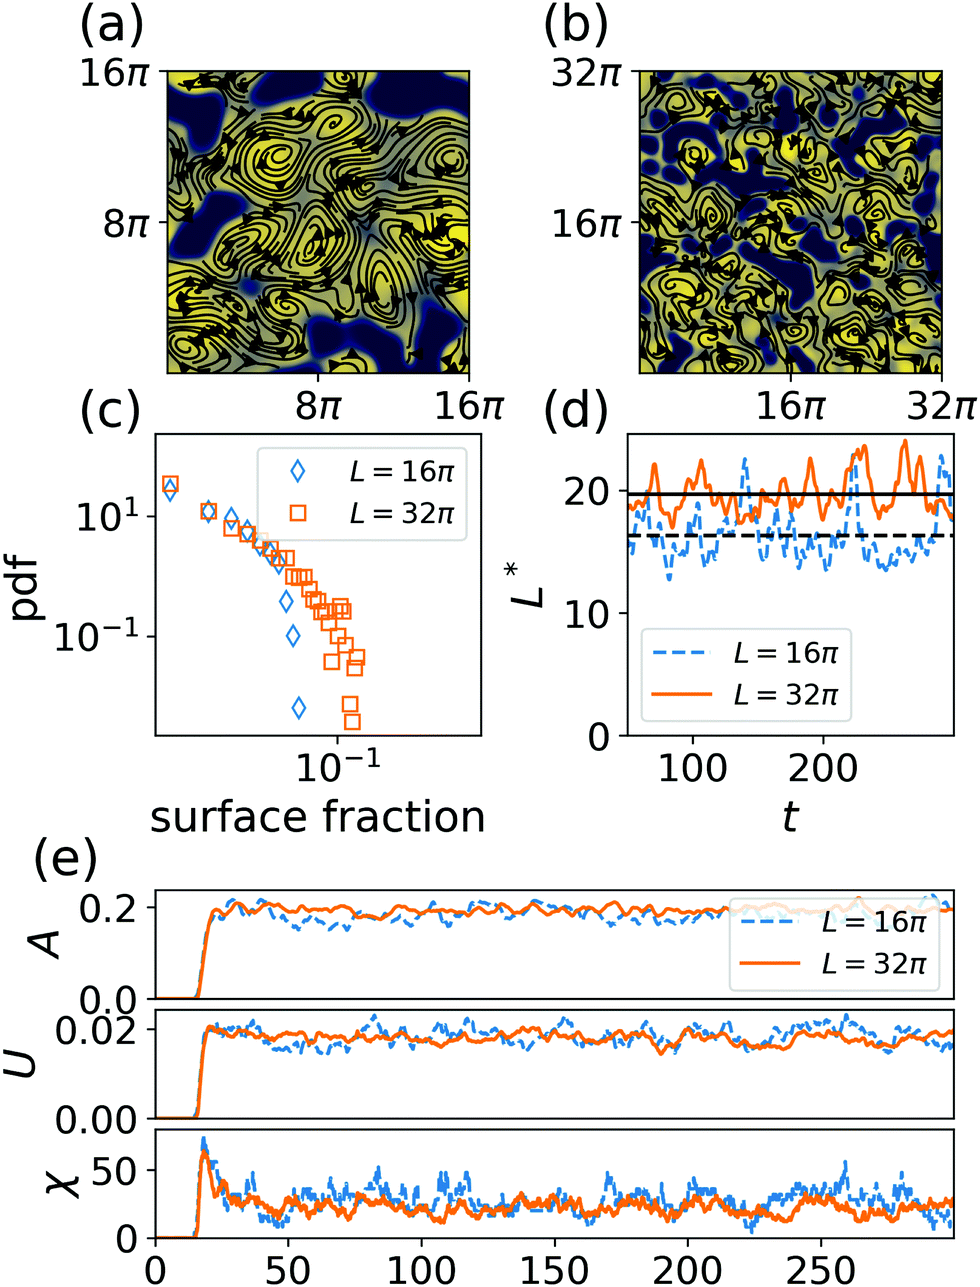
A.3 Finite size scaling
To check for finite size effects, we increase the size of the simulation domain. For the data provided in the main text, we use a simulation domain with linear size L = 16π and 256 × 256 grid points. We now additionally use a simulation domain with linear size L = 32π and 512 × 512 grid points. The results are shown in Fig. 7. The snapshots provided in Fig. 7(a) and (b) indicate that the dynamics do not differ qualitatively. This can be quantified by measuring the Minkowski functionals, which are plotted in Fig. 7(e). The average value of the rescaled area A and perimeter U agree for both simulation domain sizes as expected. Due to the additivity of Minkowski functionals, see Section B.3, one would expect the Euler number to quadruple when the linear size of the simulation domain is doubled. We measure an increase of the Euler number by a factor of 3.2, slightly below the expected value. Furthermore, the cluster size distribution (Fig. 7(c)) and characteristic domain size L* (Fig. 7(d)) show qualitatively similar behaviour for the different simulation domain sizes. The characteristic domain size is obtained from the density correlation function, see Section B.2 for details. We observe a slightly larger characteristic domain size for the larger simulation domain. This is also reflected in the cluster size distribution. Together with our observation about the Euler number, we conclude that for the larger simulation domain size there are slightly fewer but larger clusters. However, as the differences are small, we conjecture that they can be attributed to fluctuations rather than to systematic finite size effects.
 |
| | Fig. 7 (a) and (b) show simulation snapshots at t = 300 for simulation domain sizes of L = 16π (a) and L = 32π (b). For the two different simulation domain size the cluster size distribution (c), the evolution of the characteristic domain size obtained from the density correlation function L* (d) and the Minkowski functionals over time (e) are plotted. The Euler number χ for L = 16π is multiplied by a factor of 4, which represents the expected scaling due to additivity. Parameters as in Fig. 6. | |
A.4 Comparison between TIC and MIPS
As our model eqn (1) incorporates MIPS as a special case,25 one might expect that the emergence of dense clusters can be explained by MIPS. Similar to equilibrium phase separation, dense cluster emerge in MIPS either through spinodal decomposition, when increasing ρ0 past the spinodal ρs, or via nucleation in the metastable regime between the spi- and binodal (ρb < ρ0 < ρs), if sufficiently large perturbations are provided.42–44 The spinodal ρs marks the point, when the homogeneous density profile becomes linearly unstable against perturbations. Hence, the position of the spinodal can be computed by a linear stability analysis, which is done in Section A.1. Since we choose ρ0 < ρs in our simulations, spinodal decomposition can be ruled out. Nucleation through MIPS appears unlikely as the initial small-scale fluctuations vanish before clusters appear. This is represented by the time lag between the start of the simulation and the increase of the Euler number χ (Fig. 6(a)). Furthermore, if clusters are nucleated through MIPS, they grow and coarsen until a completely phase separated state is reached. Related to this is the presence of hysteresis:42–44 Depending on the initial conditions either a homogeneous density profile or a phase separated state is observed. As shown earlier, we do not observe hysteresis in the TIC phase and clusters fracture before reaching phase separation. Altogether, those differences indicate that another dynamical process other than MIPS is responsible for the dynamics in the TIC phase. Nevertheless, metastability of the homogeneous density profile might be a necessary condition for the emergence of dense clusters, as no clusters emerge below the estimated binodal ρb independent of λ0, as explained in the following Section A.5.
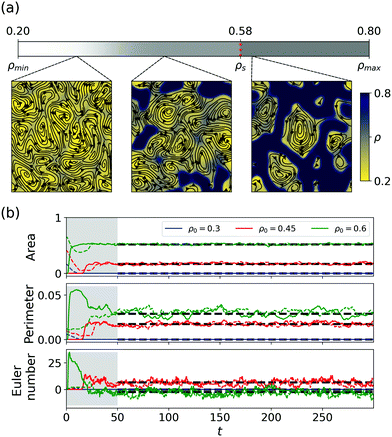
A.5 Extension of the TIC phase to the spinodal regime
So far, we focused on the regime ρ0 < ρs, i.e. on densities below the spinodal of MIPS. We now vary ρ0 between ρmin and ρmax while fixing λ0 = 3. The resulting phase diagram is pictured in Fig. 8(a).
 |
| | Fig. 8 Dynamics when varying ρ0 for Γ2 = −Γ0 = 1 and λ0 = 3. (a) Snapshots with mean densities ρ0 = 0.3, ρ0 = 0.45 and ρ0 = 0.6 at t = 300 (from left to right). (b) Evolution of the Minkowski functionals for the three cases shown in (a). Simulations are either started from a homogeneous density (full lines) or a dense droplet (dashed lines). Initial transient is marked in gray, while the average after the transient is provided by black dashed lines. | |
For low mean densities (see ρ0 = 0.3), we observe meso-scale turbulence without the presence of clusters, i.e. the MST phase. This can be quantified by the evolution of the Minkowski functionals plotted in Fig. 8(b). Again, we initiated the system either with a homogeneous density profile (solid lines) or with a dense droplet (dashed lines).
Increasing the mean density, we observe the nucleation of dense cluster due to meso-scale turbulence, i.e. the TIC phase (see ρ0 = 0.45 < ρs). We speculate that the transition between MST and TIC coincides with the binodal ρb. In equilibrium systems, the binodal can be obtained by a common tangent construction of the free energy functional.45 While such a common tangent construction was also applied to non-equilibrium systems via a mapping to an effective free energy,45 we are not aware of such a mapping in our system. Numerically, the position of the binodal can be estimated by the values of the coexisting densities. Estimating the lower coexisting density from the peak of the density distribution yields ρb ≈ 0.35. We note though that the distribution around this peak is fairly wide. Hence, it can be debated whether there exists a lower coexisting density at all in our systems. Nevertheless, the computed value ρb ≈ 0.35 agrees reasonably well with the observed onset of clustering. A more systematic study might be in order to support our hypothesis. Hence, we do not provide a transition point in Fig. 8(a) but a transition zone.
Interestingly, increasing the mean density above the spinodal (see ρ0 = 0.6 > ρs) leads to similar long-time dynamics as in the TIC phase. That is, we observe the constant formation, reshaping and fracture of dense clusters independent of the initial conditions. We note that the average Euler number is negative. This is to be expected as the proportion of dense domains is larger than the proportion of dilute domains, see ref. 33. However, notable differences for mean densities below and above the spinodal are present in the short time dynamics (marked in gray in Fig. 8(b)). For ρ0 < ρs, the nucleation of clusters follows the onset of meso-scale turbulence. As this dynamical state needs some time to evolve from the initial conditions there is a time lag until the nucleation of clusters. For ρ0 > ρs, dense clusters form through spinodal decomposition immediately. This is represented by the peak of the Euler number in Fig. 8(b). This is to be expected, as the spinodal marks the point when the homogeneous density profile looses linear stability. That is, small perturbations of the initial density profile are enough to trigger the formation of clusters. However, the linear stability analysis of the homogeneous density profile in general bears no significance once that particular state is destabilized. Hence, a linear stability analysis around a homogeneous density profile does not provide hints at the long-time dynamics.
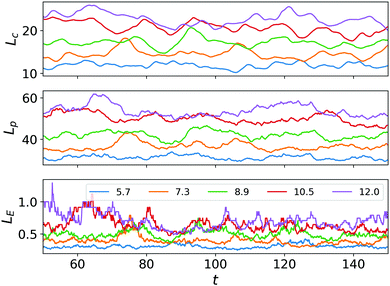
A.6 Dependence of the characteristic domain size on the vortex size
Fig. 4 of the main text shows the dependence of the characteristic domain size on the characteristic vortex size Λ, which is obtained from the stability analysis (Section A.1). Note though, that the characteristic vortex size measured by the velocity correlation function differs from Λ in the incompressible system due to energy transport between scales for λ0 ≠ 0.15,46 However, the velocity correlation function is computed by averaging over the entire simulation domain. Hence, information about the clusters are mixed with information about the dilute phases. Therefore, the velocity correlation function is not suited to provide information about the characteristic vortex size in the TIC phase.
Fig. 9 shows the temporal evolution of the characteristic domain size. Therein, the characteristic domain size is computed from the density correlation function (Lc), the perimeter (Lp) and the Euler number (LE). Details on the different approaches can be found in Sections B.2 and B.3. We remark that the density correlation function provides a characteristic domain size in simulation units. Characteristic domain sizes derived from the Minkowski functionals only show a proportionality, but might lack the correct units. This explains the different scales in Fig. 9 and the need to rescale the data in Fig. 4. The time evolution of Lc and Lp appears quite similar. For LE, fluctuations are more pronounced. This is expected as the Euler number is a topological measure that varies on an integer scale. Furthermore, we fixed Λ while varying Γ0 and Γ2, which does not influence the results significantly. Values of Γ0 and Γ2 are provided below (Table 1).
 |
| | Fig. 9 Characteristic length scale over time for different values of Λ (color coded). The characteristic length scale is either computed from the correlation function (upper panel), perimeter (middle) or Euler number (lower panel). | |
Table 1 Parameters used to study the dependence of the characteristic domain size on the vortex size
|
Λ
|
Γ
0
|
Γ
2
|
| 5.7 |
−0.42 |
0.17 |
| 7.3 |
−0.68 |
0.46 |
| 8.9 |
−1.0 |
1.0 |
| 10.5 |
−1.38 |
1.92 |
| 12.0 |
−1.83 |
3.36 |
B Methods
B.1 Numerical Implementation
We apply a pseudo-spectral method to numerically solve the evolution equations eqn (1). For the time integration an operator splitting approach is used,47 where nonlinearities are accounted for by a 2/3 dealias rule.48 To circumvent the well-known Gibbs phenomena when applying spectral methods to conservation laws,49,50 we use a large diffusion constant D to smooth phase boundaries. This allows as to study the dynamics on long timescales for large system sizes without the need for very fine grids.
The equations eqn (1) are solved on a quadratic domain of linear size L = 16π with periodic boundary conditions and 256 × 256 spatial grid points. To check for finite size effects we additionally use a domain size L = 32π with 512 × 512 grid points, see Section A.3. The time step is chosen as Δt = 10−3. Data is stored for every 100th time step. Simulations are run until T = 150, unless indicated otherwise. When taking statistics, an initial transient of Δt = 50 is neglected.
B.2 Cluster size analysis
Besides the Minkowski functionals, we also analyse our system with the more common tools of cluster analysis. To do so we identify dense clusters by thresholding, where we use a threshold value ρth = 0.65. To account for periodicity, each snapshot is copied four times and taped together periodically. From this enlarged snapshot, the largest cluster is determined and removed from the original snapshot. This procedure is repeated iteratively until no cluster is left. This ensures that each cluster is only accounted for once and identified correctly. From this data the number of clusters at each time and the cluster size distribution can be computed. These quantities are shown in Fig. 4 in the main text.
Moreover, we use the density ρ(x, t) to compute the spatial density correlation at each time step. From the spatial density correlation function a characteristic domain size can be computed by taking the first moment of its Fourier transform.
B.3 Minkowski functionals
Minkowski functionals represent a rigorous mathematical framework to study the morphology (i.e. the topological and geometric properties) of a structure. Minkowski functionals can be defined by requiring additivity, motion invariance and continuity for union of compact and convex sets. From these intuitive but abstract requirements one can characterize the Minkowski functionals in d dimensions. The following overview is based on.32
B.3.1 Mathematical definition.
A subset S ⊂ ![[Doublestruck R]](https://www.rsc.org/images/entities/char_e175.gif) d is in the class
d is in the class ![[scr R, script letter R]](https://www.rsc.org/images/entities/char_e531.gif) if and only if there exist compact and convex sets Ki such that
if and only if there exist compact and convex sets Ki such that  . We call a functional M: → a Minkowski functional if the following properties hold:
1. Additivity: for S,T∈
| | | M(S∪T) = M(S) + M(T) − M(S∩T). | (6) |
2. Motion invariance: for S∈ and a g∈ ![[capital G, script]](https://www.rsc.org/images/entities/char_e112.gif) , where is the group of translational and rotational motions,
, where is the group of translational and rotational motions,
3. Continuity: for convex sets S,Sn ∈ with Sn → S
One can proof that there are only d + 1 independent Minkowski functionals M0,…,Md in d spatial dimensions. That is, all other functionals fulfilling eqn (6)–(8) can be written as a linear combination of the d + 1 functionals M0,…,Md (Hadwiger theorem). Furthermore, in two dimensions we can give a direct characterization of the functionals by simple properties of a structure as its area A, perimeter U and Euler characteristic χ
| | | M0(S) = A, M1(S) = U, M2(S) = χ. | (9) |
B.3.2 Application of Minkowski functionals to numerical data.
To apply Minkowski functionals to numerical or experimental data we have to define what constitutes a structure. This is usually done by thresholding. For example, defining| | 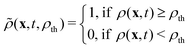 | (10) |
for the density ρ(x, t) given by eqn (1a) creates a binary picture. For our numerical data, we use a threshold value ρth = 0.65. Areas with ![[small rho, Greek, tilde]](https://www.rsc.org/images/entities/i_char_e0e4.gif) (x, t, ρth) = 1 (white) make up the structures to be measured, while (x, t, ρth) = 0 (black) is considered as background. This provides an additional characterization of the Euler characteristic in two dimensions as the difference of white and black connected finite domainsFrom this classification one can easily derive the Euler characteristic of a circle (1), a hole (−1) and a flat interface (0) in 2D (Fig. 10). These structures represent the final state of equilibrium systems quenched into the spinodal regime.33
(x, t, ρth) = 1 (white) make up the structures to be measured, while (x, t, ρth) = 0 (black) is considered as background. This provides an additional characterization of the Euler characteristic in two dimensions as the difference of white and black connected finite domainsFrom this classification one can easily derive the Euler characteristic of a circle (1), a hole (−1) and a flat interface (0) in 2D (Fig. 10). These structures represent the final state of equilibrium systems quenched into the spinodal regime.33
 |
| | Fig. 10 Examples for structures with Euler characteristic χ < 0 (a), χ = 0 (b) and χ > 0 (c). Exact values are χ = −400, 0, 25 respectively. | |
We apply a customized algorithm to compute the Minkowski functionals with periodic boundary conditions. Clearly, the (total) area A is not affected by the boundary and can be obtained straight forwardly. For the perimeter U, we first compute the interface as for non-periodic images.51 Then, pixels at the boundary of the computation box that are falsely identified as interface are subtracted. The computation of the Euler number is outlined in the following.
B.3.3 Computation of the Euler characteristic.
Our method to compute the Euler characteristic is based on the algorithm presented in ref. 52. This algorithm suffers from two drawbacks. Firstly, objects have to be individually separated from the background to obtain the right Euler characteristics. This is tedious, especially for periodic boundary conditions. Moreover, the algorithm only works for 4-connectivity. Both of these shortcomings can be overcome by a simple additional step. We quickly present the basic idea of the algorithm.
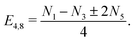
Assume a binary picture as shown in Fig. 11 (left side). Each corner is assigned a value based on the number of neighbouring white pixels. Let N0,…,N4 denote the number of corners with value 0,…,4. Then, assuming 4-connectivity and separating the object from possible additional objects in the image, the Euler characteristic is given by52
| |  | (12) |
However, assume a situation as depicted in
Fig. 11(b). If the two objects are not treated individually, then the computed Euler characteristic is wrong due to two white pixels touching each other diagonally. This can be rectified by an additional step in the algorithm: The corners that carry the value 2 and have identical diagonal neighbours are assigned a new number, for simplicity 5. Then, the Euler characteristic is obtained by either adding

to
eqn (12) for 4-connectivity or subtracting it for 8-connectivity. Hence,
eqn (12) needs to be modified to
| |  | (13) |
This can be understood from a simple topological argument. First, assuming 4-connectivity, a diagonal connection does not change the topology. Hence, a diagonal connection is the same as two corners with value 1. Hence, we have to add twice the amount of such corners. Next, assume 8-connectivity. If there is a diagonal connection, then the topology is not changed by adding an additional pixels. This increases the amount of
N3 by 1 and decreases the amount of
N1 by 1.
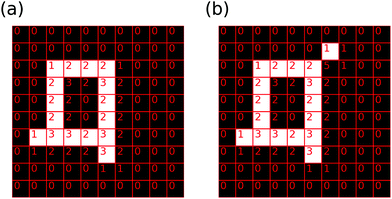 |
| | Fig. 11 Original binary picture with signed corners (a) and after adding a pixel while applying the new algorithm (b). | |
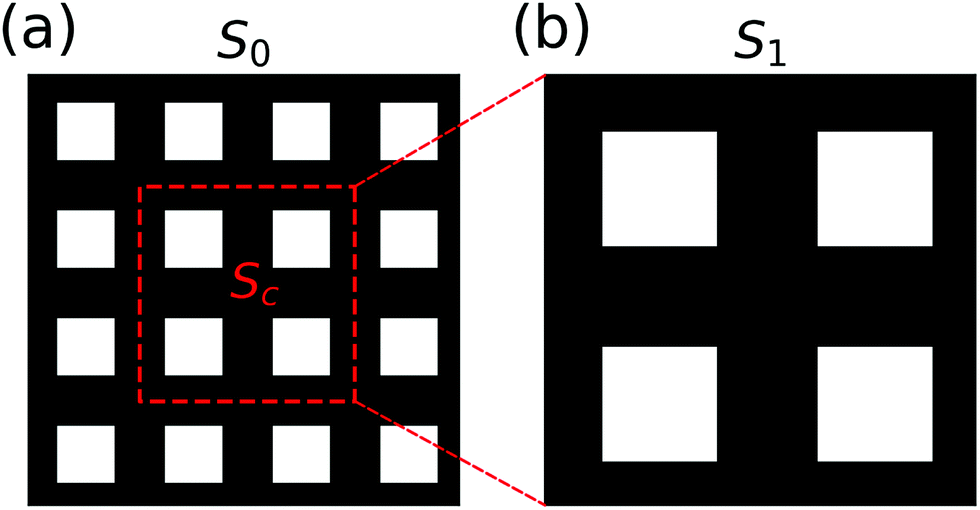
B.3.4 Scaling of the Minkowski functionals with the characteristic domain size.
We now want to connect the Minkowski functionals Mi to the characteristic domain size L* (see Section B.2). Due to the properties of the Minkowski functionals one usually assumes the relationshipfor systems exhibiting dynamic scaling.
To illustrate the idea behind this scaling hypothesis, we consider the example depicted in Fig. 12. Clearly, the pattern S1 is a scaled version of the pattern S0 with scaling factor κ = 2, while the morphology is unchanged. The pattern at S1 can be constructed from the pattern at S0 by cutting out the highlighted part in Fig. 12(a), which we will denote by Sc, and enlarging Sc to the domain size. This idea can be used to compute the values of the Minkowski functionals of S1 by only utilizing the scaling factor κ and the values of the Minkowski functionals for S0. To do so, we use the additivity of Minkowski functionals, see eqn (6), and their homogeneity, i.e.
Due to additivity, it holds
| | 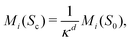 | (16) |
while clearly
Combining those two steps results in
| |  | (18) |
 |
| | Fig. 12 Patterns S0 (a) and S1 (b). Red dotted line illustrates that S1 can be generated by cutting out Sc and enlarging it to the domain size. | |
If the system exhibits dynamic scaling for t > t0, i.e. the pattern at any point t is a scaled version of the pattern at some point t0, it holds κ(t) = L*(t)/L*(t0), where L(t) and L(t0) are the characteristic domain sizes at t0 and t respectively. Hence, we deduce
| | | Mi(S[t]) ∼ (L*[t])−i, | (19) |
which provides the desired relationship between the Minkowski functionals and the characteristic domain size.
Acknowledgements
This work was supported by the Deutsche Forschungsgemeinschaft (DFG) through grants HE 5995/3-1 (SH, VMW and AB), BA 1222/7-1 (MB and GA) and SFB 910 (projects B4 (HS) and B5 (MB)). GA and AB are thankful for partial support from the Israel Science Foundation grant 373/16.
Notes and references
- T. Vicsek and A. Zafeiris, Phys. Rep., 2012, 517, 71–140 CrossRef.
- M. C. Marchetti, J. F. Joanny, S. Ramaswamy, T. B. Liverpool, J. Prost, M. Rao and R. A. Simha, Rev. Mod. Phys., 2013, 85, 1143–1189 CrossRef CAS.
- J. Prost, F. Jülicher and J.-F. Joanny, Nat. Phys., 2015, 11, 111–117 Search PubMed.
- A. Be’er and G. Ariel, Movement Ecol., 2019, 7, 1–17 Search PubMed.
- H. Chaté, Annu. Rev. Condens. Matter Phys., 2020, 11, 189–212 Search PubMed.
- M. Bär, R. Großmann, S. Heidenreich and F. Peruani, Annu. Rev. Condens. Matter Phys., 2020, 11, 441–466 Search PubMed.
- C. Dombrowski, L. Cisneros, S. Chatkaew, R. E. Goldstein and J. O. Kessler, Phys. Rev. Lett., 2004, 93, 2–5 CrossRef PubMed.
- L. H. Cisneros, R. Cortez, C. Dombrowski, R. E. Goldstein and J. O. Kessler, Exp. Fluids, 2007, 43, 737–753 CrossRef.
- T. Ishikawa, N. Yoshida, H. Ueno, M. Wiedeman, Y. Imai and T. Yamaguchi, Phys. Rev. Lett., 2011, 107, 1–4 CrossRef PubMed.
- K. A. Liu and I. L. Lin, Phys. Rev. E: Stat., Nonlinear, Soft Matter Phys., 2012, 86, 1–6 Search PubMed.
- E. B. Steager, C. B. Kim and M. J. Kim, Phys. Fluids, 2008, 20, 073601 CrossRef.
- R. Großmann, P. Romanczuk, M. Bär and L. Schimansky-Geier, Phys. Rev. Lett., 2014, 113, 1–5 CrossRef PubMed.
- H. P. Zhang, A. Be'er, R. S. Smith, E. L. Florin and H. L. Swinney, EPL, 2009, 87, 48011 CrossRef.
- H. H. Wensink, J. Dunkel, S. Heidenreich, K. Drescher, R. E. Goldstein, H. Löwen and J. M. Yeomans, Proc. Natl. Acad. Sci. U. S. A., 2012, 109, 14308–14313 CrossRef CAS PubMed.
- J. Dunkel, S. Heidenreich, M. Bär and R. E. Goldstein, New J. Phys., 2013, 15, 045016 CrossRef.
- S. Heidenreich, J. Dunkel, S. H. L. Klapp and M. Bär, Phys. Rev. E, 2016, 94, 29–31 CrossRef PubMed.
- H. Reinken, S. H. L. Klapp, M. Bär and S. Heidenreich, Phys. Rev. E, 2018, 97, 1–20 CrossRef PubMed.
- Y. Fily and M. C. Marchetti, Phys. Rev. Lett., 2012, 108, 1–5 CrossRef PubMed.
- J. Bialké, H. Löwen and T. Speck, EPL, 2013, 103, 1–6 Search PubMed.
- M. E. Cates and J. Tailleur, Annu. Rev. Condens. Matter Phys., 2015, 6, 219–244 CrossRef CAS.
- G. Ariel, M. Sidortsov, S. D. Ryan, S. Heidenreich, M. Bär and A. Be'er, Phys. Rev. E, 2018, 98, 1–10 CrossRef.
- A. Be’er, B. Ilkanaiv, R. Gross, D. B. Kearns, S. Heidenreich, M. Bär and G. Ariel, Commun. Phys., 2020, 3, 1–8 CrossRef.
- C. W. Wolgemuth, Biophys. J., 2008, 95, 1564–1574 CrossRef CAS PubMed.
- A. E. Hamby, D. K. Vig, S. Safonova and C. W. Wolgemuth, Sci. Adv., 2018, 4, eaau0125 CrossRef CAS PubMed.
- V. M. Worlitzer, G. Ariel, A. Be'er, H. Stark, M. Bär and S. Heidenreich, New J. Phys., 2021, 23, 033012 CrossRef CAS.
- T. B. Saw, A. Doostmohammadi, V. Nier, L. Kocgozlu, S. Thampi, Y. Toyama, P. Marcq, C. T. Lim, J. M. Yeomans and B. Ladoux, Nature, 2017, 544, 212–216 CrossRef CAS PubMed.
- K. Kawaguchi, R. Kageyama and M. Sano, Nature, 2017, 545, 327–331 CrossRef CAS PubMed.
- K. Copenhagen, R. Alert, N. S. Wingreen and J. W. Shaevitz, Nat. Phys., 2021, 17, 211–215 Search PubMed.
- S. D. Ryan, G. Ariel and A. Be'er, Biophys. J., 2016, 111, 247–255 CrossRef CAS PubMed.
- A. Sokolov, I. S. Aranson, J. O. Kessler and R. E. Goldstein, Phys. Rev. Lett., 2007, 98, 1–4 CrossRef PubMed.
- A. U. Oza, S. Heidenreich and J. Dunkel, Eur. Phys. J. E: Soft Matter Biol. Phys., 2016, 39, 4–11 CrossRef PubMed.
-
K. R. Mecke, Statistical Physics and Spatial Statistics, Berlin, Heidelberg, 2000, pp. 111–184 Search PubMed.
- V. Sofonea and K. R. Mecke, Eur. Phys. J. B, 1999, 8, 99–112 CrossRef CAS.
- J. Elgeti, M. E. Cates and D. Marenduzzo, Soft Matter, 2011, 7, 3177–3185 RSC.
- C. Torney and Z. Neufeld, Phys. Rev. Lett., 2007, 99, 078101 CrossRef PubMed.
- A. Jayaram, A. Fischer and T. Speck, Phys. Rev. E, 2020, 101, 022602 CrossRef CAS PubMed.
- R. Großmann, I. S. Aranson and F. Peruani, Nat. Commun., 2020, 11, 5365 CrossRef PubMed.
- A. M. Lacasta, J. M. Sancho and F. Sagués, Phys. Rev. Lett., 1995, 75, 1791–1794 CrossRef CAS PubMed.
- L. Berthier, J.-L. Barrat and J. Kurchan, Phys. Rev. Lett., 2001, 86, 2014–2017 CrossRef CAS PubMed.
- S. Berti, G. Boffetta, M. Cencini and A. Vulpiani, Phys. Rev. Lett., 2005, 95, 224501 CrossRef CAS PubMed.
- P. Perlekar, R. Benzi, H. J. H. Clercx, D. R. Nelson and F. Toschi, Phys. Rev. Lett., 2014, 112, 014502 CrossRef PubMed.
- T. Speck, J. Bialké, A. M. Menzel and H. Löwen, Phys. Rev. Lett., 2014, 112, 1–5 CrossRef.
- T. Speck, A. M. Menzel, J. Bialké and H. Löwen, J. Chem. Phys., 2015, 142, 224109 CrossRef PubMed.
- D. Levis, J. Codina and I. Pagonabarraga, Soft Matter, 2017, 13, 8113–8119 RSC.
- R. Wittkowski, A. Tiribocchi, J. Stenhammar, R. J. Allen, D. Marenduzzo and M. E. Cates, Nat. Commun., 2014, 5, 1–9 Search PubMed.
- V. Bratanov, F. Jenko and E. Frey, Proc. Natl. Acad. Sci. U. S. A., 2015, 112, 15048–15053 CrossRef CAS PubMed.
- R. Kozlov, J. Comput. Appl. Math., 2008, 222, 592–607 CrossRef.
-
C. Canuto, M. Y. Hussaini, A. Quarteroni and T. A. Zang, Spectral methods: fundamentals in single domains, Springer Science & Business Media, 2007 Search PubMed.
- S. Ghosh, M. Hossain and W. H. Matthaeus, Comput. Phys. Commun., 1993, 74, 18–40 CrossRef.
- D. Gottlieb and C.-W. Shu, SIAM Rev., 1997, 39, 644–668 CrossRef.
- S. van der Walt, J. L. Schönberger, J. Nunez-Iglesias, F. Boulogne, J. D. Warner, N. Yager, E. Gouillart and T. Yu, scikit-image contributors, PeerJ, 2014, 2, e453 CrossRef PubMed.
- J. Sossa-Azuela, R. Santiago-Montero, M. Pérez-Cisneros and E. Rubio-Espino, J. Appl. Res. Technol., 2013, 11, 360–370 CrossRef.
Footnote |
| † Electronic supplementary information (ESI) available: Movie showing the time evolution of the density and polarization density obtained by solving our model of a compressible active fluid. See DOI: 10.1039/d1sm01276b |
|
| This journal is © The Royal Society of Chemistry 2021 |
Click here to see how this site uses Cookies. View our privacy policy here. 
 Open Access Article
 This Open Access Article is licensed under a
  *a,
Gil
Ariel
b,
Avraham
Be'er
cd,
Holger
Stark
*a,
Gil
Ariel
b,
Avraham
Be'er
cd,
Holger
Stark


 . Fig. 3(b) shows that the maximum of this integral increases with the strength of self-advection λ0, leading to density gradients within the system.

 for the initial stage of the vortex lattice, i.e. for δt = 10, when varying λ0. Parameters as in (a). (c) Snapshots of a cluster growing from random initial conditions with ρ0 = 0.45, λ0 = 0.5. (d) Evolution of a flat interface between a dense cluster and a vortex array in the dilute region with ρ0 = 0.45 and λ0 = 3. In (a, c and d) arrows represent the p field, with arrow color indicating clockwise (red) and counterclockwise (green) rotating vortices.
 , see Section A.1.

 . Details for the choice of Γ0,Γ2 can be found in Section A.6. Data is obtained for ρ0 = 0.5 by averaging over 100 time steps after a transient of δt = 50 for 10 runs ((a) and (b)) and 5 runs (c) with identical parameters but different random initial conditions. Colors in (b) correspond to those in (a). In (c) the characteristic domain size obtained from the perimeter (Lp, magenta circles), the Euler number (LE, black stars) and the correlation function (Lc, cyan crosses) is shown. As a visual guide linear fits for all three cases are provided as dashed lines. Lp and LE are rescaled with the maximum of Lc.
 (global polar order). Introducing perturbations p → p0 + δp and ρ → ρ0 + δρ and linearizing eqn (1) close to the steady state (ρ,p) ≡ (ρ0,p0) yields the equations of motion for the perturbations


 . Hence, this instability is the one expected from meso-scale turbulence. Fig. 5(b) shows the dispersion relation for ρ0 = 0.6. In addition, to the finite-wavelength instability, a long-wavelength instability in σ2 appears. This instability is reminiscent of MIPS, see also.25 The appearance of the long-wavelength instability marks the spinodal ρs of the system, i.e., the point when the homogeneous density profile looses stability. The numerically computed value of the spinodal is ρs ≈ 0.58. See also the discussion in Section A.5.


 . We call a functional M:

 to eqn (12) for 4-connectivity or subtracting it for 8-connectivity. Hence, eqn (12) needs to be modified to