
 Open Access Article
 This Open Access Article is licensed under a Creative Commons Attribution-Non Commercial 3.0 Unported Licence
The energy landscapes of bidisperse particle assemblies on a sphere
Alexander F.
Ballard†
 ,
Jack R.
Panter†
and
David J.
Wales
*
,
Jack R.
Panter†
and
David J.
Wales
*
Yusuf Hamied Department of Chemistry, Lensfield Road, Cambridge, CB2 1EW, UK. E-mail: dw34@cam.ac.uk
First published on 15th September 2021
Abstract
The interplay between crystalline ordering, curvature, and size dispersity make the packing of bidisperse mixtures of particles on a sphere a varied and complex phenomenon. These structures have functional significance in a broad range of systems, such as cellular organisation in spherical epithelia, catalytic activity in binary colloidosomes, and chemical activity in heterofullerenes. In this contribution, we elucidate the potential energy landscapes for systems of repulsive, bidisperse particles confined to the surface of a sphere. It is commonly asserted that particle size dispersity destroys ordered arrangements, leading to glassy landscapes. Surprisingly, across a range of compositions, we find highly ordered global minima. Moreover, a minority of small particles is able to passivate defects, stabilising bidisperse global minima relative to monodisperse systems. However, our landscape analysis also reveals that bidispersity introduces numerous defective, low-lying states that are expected to cause broken ergodicity in corresponding experimental and computational systems. Probing the global minimum structures further, particle segregation is energetically preferred at intermediate compositions, contrasting with the approximate icosahedral global packing at either end of the composition range. Finally, changing the composition has a dramatic effect on the heat capacity: systems with low-symmetry global minima have melting temperatures an order of magnitude lower than monodisperse or high-symmetry systems. This observation may provide a further example of the principle of maximum symmetry: higher symmetry global minima exhibit a larger energy separation from the minima that define the high-entropy phase-like region of configuration space, raising the transition temperature.
Introduction
Attempting to wrap a 2D planar hexagonal lattice around the surface of a sphere necessitates the introduction of topological defects.1 In physical systems, such as arrangements of repulsive particles, the competition between regular packing, curvature, and strain energy minimisation2,3 has been found to produce a broad range of defect structures4–7 and frequent examples of metastability.8,9 Separately, introducing size dispersity into the packing of particles is known to introduce severe frustration, leading to irregularly structured, glassy landscapes.4,10–12 The combined interactions of regular packing, spherical curvature, and bidispersity have recently begun to be investigated, exhibiting extraordinarily diverse packing arrangements with multifunnel energy landscapes corresponding to alternative low-lying structures separated by high barriers.13–15Examples of size-disperse packings associated with spherical topology can be found in a wealth of natural and synthetic systems. Furthermore, putative functions have been attributed to the packing arrangements and defect motifs. A biological example of this phenomenon arises for non-proliferative spherical epithelial monolayers (SphEMs) that surround Ascidian eggs.16 The highly defective arrangements have been attributed to cell size dispersity, and it has been suggested that the cell patterning may regulate the induction of downstream biological processes, such as cell death.17 Another important biological example is the calcium carbonate plating of coccolithophores (see for example ref. 18), a key regulator of marine CO2.19
In colloid science, colloidal capsules show a remarkable range of functionalities.20 For example, capsules formed from two species of different size and chemical functionality have recently been shown to enable robust enzymatic catalysis in pickering emulsions,21 bifunctional magnetic/fluorescent nanoparticle assemblies for theranostics in medicine,22 and enhanced electrocatalysis.23 In the latter application, it was suggested that the highly defective packing of Au and Pd nanoparticles is responsible for improved catalytic performance.
Finally, in synthetic chemistry, the binary arrangements of atoms in heteroatom-doped fullerenes are important for stability and chemical reactivity. For example, boron-doped fullerenes have applications ranging from photonics to hydrogen storage,24–26 nitrogen-doped fullerenes have suggested applications in fuel cells,27 and silicon-doped fullerenes in catalysis.28
In the present work, we survey and analyse the potential energy landscapes for the bidisperse arrangement of repulsive particles on a sphere. To begin with, we analyse the structure and energy of the predicted global minima relative to the monodisperse case. We find that the complexity of the landscapes make it relatively challenging to locate the global minima. This problem is tackled using generalised basin-hopping global optimisation to define biminima, which are minima in both configurational and permutational space.29 Interestingly, we find that a minority of small particles are able to passivate the topological defects necessary for spherical packings. Rather than destroying the global ordering,14 we find that bidispersity is capable of stabilising high-symmetry structures relative to the monodisperse case. In contrast, a majority of small particles destabilises the global minima. Probing the global minima structures further, we find a general trade-off between high symmetry and particle size segregation, with segregation the energetically favoured strategy to lower the energy at intermediate proportions of small particles.
We then examine the potential energy landscapes to compare systems with widely different degrees of ordering in the global energy minimum. Despite the diversity in the ground state structures, all the landscapes exhibit very numerous defective states, many of which are deeper than the global minimum. The principal effect of bidispersity is therefore not necessarily to disrupt low-energy regular packings, but rather to create broken ergodicity in terms of low-lying minima separated by high barriers. This organisation explains the large range of highly defective structures observed in experimental and simulated systems, which may not be able to sample the lowest-energy structures on feasible time scales.13–15 Probing these landscapes further, we study how the icosahedral order parameter and particle segregation change through the energy range of local minima. Of particular interest is that, for the systems tested, the degree of segregation is not strongly correlated with the energy, and is instead controlled by the number of small particles. Finally, by studying the calculated heat capacities, we find that melting transitions in systems with low-symmetry global minima occur at temperatures an order of magnitude lower than for both monodisperse systems and binary systems with high-symmetry global minima.
Methods
The spherical systems we consider consist of N repulsive particles of two types, A and B, with populations NA and NB, respectively. Throughout, we fix N = 72 and vary NA for this initial survey. We choose N = 72 to allow a broad range of point groups to be investigated, ranging from low, C1 symmetry, to particularly high I-symmetry, as observed in monodisperse systems.30 72 is sufficiently small that we can robustly locate global minimum energy structures and explore the energy landscapes extensively for benchmarking. N = 72 also has physical relevance, for example being representative of small SphEMs.16 Hence we investigate this relatively small but non-trivial system in detail to lay the foundations for larger systems in the future.Varying NA and NB = N − NA allows us to investigate binary systems with a wide range of structural order. The spherical surface on which the particles are confined has fixed radius R = 5. The particles are modelled as repulsive Lennard-Jones centres, where the pair interaction energy Eij between particles i and j is defined as
 | (1) |
The total energy E of the system is the sum of Eij over all particle pairs. To scale the total energy for comparison of different systems, we normalise the interaction range Si + Sj by ![[small sigma, Greek, macron]](https://www.rsc.org/images/entities/i_char_e0d2.gif) , where is the average range: = 2(NASA + NBSB)/N. To highlight the relative stabilisation of a system of energy E, compared to the monodisperse global energy minimum of energy Eref, we normalise Eij by Eref. This treatment ensures that the reduced energy E′ of any global minimum of N = 72 identical particles is 1, regardless of the interaction range or sphere radius.
, where is the average range: = 2(NASA + NBSB)/N. To highlight the relative stabilisation of a system of energy E, compared to the monodisperse global energy minimum of energy Eref, we normalise Eij by Eref. This treatment ensures that the reduced energy E′ of any global minimum of N = 72 identical particles is 1, regardless of the interaction range or sphere radius.
To find the global potential energy minima, we initially employed a basic basin-hopping (BH) global optimization approach.31–33 Here, one iteration consists of a trial displacement to the particle positions followed by energy minimisation to yield a candidate minimum. This candidate is accepted or rejected as input into the next iteration based on the energy change from the previous iteration. However, except for extreme values of NA, candidate global minima were not located reliably from initial configurations within 106 BH iterations. From previous analysis of binary Lennard-Jones clusters, this problem is known to be caused by the combinatorially large number of arrangements of particles A and B within any specified configuration.34 We therefore employed a generalised basin-hopping approach, the Quench-Assisted Local Combinatorial Search algorithm (QALCS)29,34 to locate biminima, structures that are potential energy minima in both configurational and permutational space. Here, starting from an initial random quenched configuration, a series of optimal A–B swaps were made, each followed by configurational minimisation, until there remained no swaps that produced further reduction in the potential energy. This procedure was repeated from a range of random initial configurations. For all NA, approximately 100 such repeats proved sufficient to find a global minimum candidate that could not be improved further with 500 repeats.
The energy landscapes were constructed by harvesting databases of minima and the transition states that connect them, defined geometrically, as index one stationary points.35 Transition states were approximately located between pairs of minima using the Doubly-Nudged36,37 Elastic Band38,39 algorithm (DNEB), and refined using Hybrid Eigenvector-Following (HEF).38,40,41 BH, QALCS, DNEB, HEF, and stationary point database construction were carried out using the programs GMIN, OPTIM and PATHSAMPLE.42
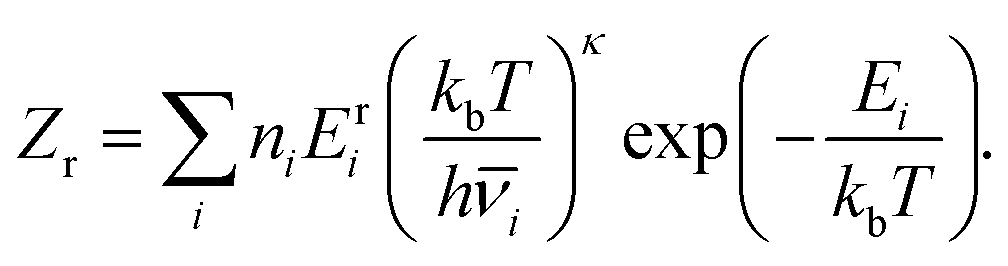
To calculate the heat capacities at constant volume, Cv, we used the harmonic superposition approximation to the vibrational density of states for each minimum.43,44 This formulation can be expressed as
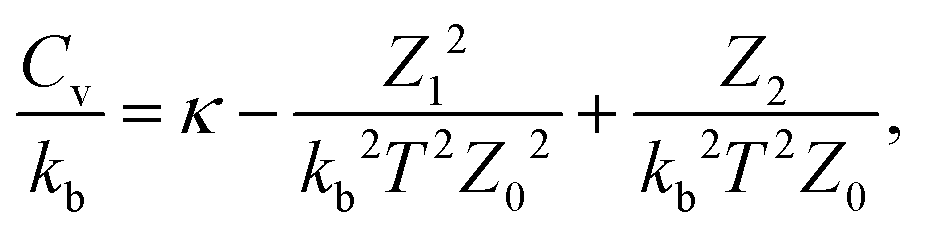 | (2) |
 | (3) |
![[small nu, Greek, macron]](https://www.rsc.org/images/entities/i_char_e0ce.gif) is the geometric mean vibrational frequency of the normal modes, and n is the combinatorial weighting factor: ni = 2NA!NB!/Oi, where Oi is the point group order for minimum i.
is the geometric mean vibrational frequency of the normal modes, and n is the combinatorial weighting factor: ni = 2NA!NB!/Oi, where Oi is the point group order for minimum i.
Two order parameters are used throughout to evaluate the particle arrangements. The first is the icosahedral order parameter Q6,45 which is calculated for the arrangement of all pentagonal sites. Q6 is a bond-orientational order parameter, where here the ‘bonds’ connect each pentagonal site to the centre of the sphere. Perfect icosahedral packing yields Q6 ≈ 0.66. The second index we call the clustering parameter, CAB, which measures the degree of segregation between the particle types. CA is defined as the average fraction of nearest neighbours to a type-A particle that are also of type A. CB is defined similarly for B-type particles. We define CAB as the product CAB = CACB. CAB is large if all A-type particles are clustered together and all B-type particles are clustered together, achieving species separation.
Throughout, we use Voronoi constructions to visualise the particle packing arrangements and highlight the local packing arrangements. In all images, pentagonal sites are coloured red, hexagonal sites are green, and heptagonal sites are blue. Sites occupied by type B particles are shaded darker.
Results and discussions
The monodisperse potential energy landscape
It is helpful to begin by analysing the potential energy landscape for packing 72 identical repulsive particles on a sphere, illustrated as a disconnectivity graph46,47 in Fig. 1. A disconnectivity graph is a one-dimensional representation of the landscape, where the vertical scale here represents the potential energy and minima are located at the ends of the branches. The points where two branches join indicate the minimum energy transition state that must be overcome to interconvert the corresponding minima. Here, the global minimum has icosahedral symmetry (point group I), with the fewest number of disclinations possible, identical to the packing of repulsive point charges.48 The energy of this state defines the reference, against which we normalise all subsequent reported energies, as detailed in the Methods. We also find two higher energy states: one featuring tetrapentagon defects, with point group O, and a higher energy state with point group D2. | ||
| Fig. 1 Disconnectivity graph for a system of 72 monodisperse repulsive particles arranged on a sphere. The global minimum energy state defines the E′ = 1 level. The three minima are illustrated using Voronoi constructions. | ||
This landscape possesses two key features that contrast significantly with the binary systems studied below. Firstly, the monodisperse minima are simply connected, with only two minimum energy pathways existing between the I and O, and I and D2 states. Secondly, the landscape is strongly funnelled:49 the minimum energy barriers from the two high energy states are significantly smaller than both the range of energies spanned by all minima, and the barrier out of the global minimum.
Bidisperse global minima
We now examine the properties of the binary global minima as NA varies, summarised in Fig. 2 and Table 1. In Fig. 2a, the reduced energy of each global minimum E′ is plotted against NA. By reducing the total energy with respect to the average interaction range, we effectively eliminate the average repulsion energy due simply to the average particle size changing, highlighting instead the energetic contributions arising from packing.
 | ||
| Fig. 2 (a) Variation in the scaled energy of the global minima as the number of A particles NA increases. Particularly stable states with respect to particle substitution are highlighted in red, and illustrated. Subscripts indicate NA. (b and c) The global minimum states at extreme values of NA preserve the approximate icosahedral arrangements of five-coordinate sites. (d) Variation of the icosahedral order parameter for five-coordinate sites Q6 and clustering parameter CAB with NA. The dashed blue line indicates ideal icosahedral packing. (e) Examples of states with: high Q6 and low CAB, low Q6 and high CAB, high Q6 and high CAB, and low Q6 and low CAB, from top to bottom, respectively. | ||
| N A | Point group | N A | Point group | N A | Point group |
|---|---|---|---|---|---|
| 0 | I | 24 | O | 48 | C 1 |
| 1 | C 5 | 25 | C 1 | 49 | C 1 |
| 2 | C 2 | 26 | C 1 | 50 | C 1 |
| 3 | C 3 | 27 | C 1 | 51 | C 1 |
| 4 | C 2 | 28 | C 1 | 52 | C 1 |
| 5 | C 1 | 29 | C 1 | 53 | C 1 |
| 6 | C 5 | 30 | C 3 | 54 | C 2 |
| 7 | C 1 | 31 | C 1 | 55 | C 1 |
| 8 | C 2 | 32 | C 1 | 56 | C 1 |
| 9 | C 3 | 33 | C 1 | 57 | C 3 |
| 10 | C 2 | 34 | C 1 | 58 | C 1 |
| 11 | C 5 | 35 | C 1 | 59 | C 1 |
| 12 | I | 36 | C 1 | 60 | C 1 |
| 13 | C 1 | 37 | C 1 | 61 | C 1 |
| 14 | C 1 | 38 | C 1 | 62 | C 1 |
| 15 | C 1 | 39 | C 1 | 63 | C 1 |
| 16 | C 1 | 40 | C 2 | 64 | C 4 |
| 17 | C 1 | 41 | C 1 | 65 | C 1 |
| 18 | C 1 | 42 | C 1 | 66 | C 1 |
| 19 | C 1 | 43 | C 1 | 67 | C 5 |
| 20 | C 2 | 44 | C 1 | 68 | C 1 |
| 21 | C 1 | 45 | C 1 | 69 | C 1 |
| 22 | C 2 | 46 | C 1 | 70 | C 1 |
| 23 | C 1 | 47 | C 1 | 71 | C 1 |
Starting from an initial monodisperse system, increasing NA results in a monotonic decrease in E′ up to NA = 12. In Fig. 2b, this trend is shown to be due to A-type particles successively occupying the pentagonal sites in the approximately icosahedral configuration. It is energetically favourable for the small particles to occupy these sites, as the pentagonal sites in the monodisperse global minimum occupy approximately 0.93 the area of the hexagonal sites. The NA = 12 system, point group I, represents the overall minimum E′ system with respect to substitution of A-type and B-type particles.
Increasing NA further, the global minima tend to depart from icosahedral or other high-symmetry packings, with E′ generally increasing up to NA = 49. A notable exception to both of these trends occurs at NA = 24, where we observe a state of point group O that closely corresponds to the 2nd-lowest energy state in the monodisperse system. The presence of 24 small particles occupying the 24 pentagonal sites is sufficiently stabilising that the O state becomes the global minimum. The tetrapentagon patches exhibited in these O states have been shown to arise in packings of repulsive monodisperse point charges,9 and interestingly, similar structures also occur in biological SphEMs16 and colloidosomes.50
For NA > 49, the global minima are destabilised relative to the monodisperse system. We can view these arrangements as monodisperse systems of small particles (A), doped with a minority of large particles (B). It is well established that lattice defects inducing a local area increase also induce negative curvature in otherwise 2D sheets (see for example ref. 51 and 52). Hence it is particularly unfavourable to confine negative-curvature-inducing defects to a positively curved surface. In this region, however, there also exist locally low-energy states with high symmetry. The most notable of these states is at NA = 64 with point group C4. From this result we conclude that a few small particles can effectively passivate the topological defects in the spherical packing, while a few large particles exacerbate these defects.
Finally, as NA approaches 72, the approximate icosahedral particle arrangement returns in the predicted global minima. As shown in Fig. 2c, the minority large particles pack successively around a pentagonal site. This trend arises because in the distorted lattice, the largest sites are always found around the same pentagonal defect.
How closely the global minima conform to icosahedral arrangements is quantified in Fig. 2d through the Q6 order parameter. As described above, conformations close to icosahedral symmetry are observed for NA ≤ 18 and NA ≥ 66, with mostly low values of Q6 for intermediate NA. Also in Fig. 2d we plot the order parameter CAB, describing the segregation of the A and B particles. CAB is particularly large at intermediate NA, suggesting that when the ratio of A and B particles is not commensurate with icosahedral packing, a successful strategy to reduce the energy is to separate the system into A-rich and B-rich regions. Examples of configurations that adhere to this trade-off between Q6 and CAB are illustrated in Fig. 2e. At NA = 12, Q6 is large, whereas CAB is small, as all A particles are separated. At NA = 43, Q6 is small, whereas CAB is large. However, there are exceptions to this general trade-off. NA = 55 exhibits a large Q6, as all pentagonal sites are occupied by A atoms, but also a large CAB as all hexagonal sites are separated into A-only and B-only regions. Conversely, for NA = 64, both Q6 and CAB are small, as the high-symmetry (non-icosahedral) structure distributes the large particles individually over the sphere.
Bidisperse potential energy landscapes
We now examine the potential energy landscapes for three systems: NA = 12, featuring the highest symmetry, lowest E′ global minimum; NA = 30, exhibiting an intermediate symmetry (C3) global minimum with E′ < 1; and NA = 60, exhibiting a low symmetry (C1) global minimum with E′ > 1. In Fig. 3, the three disconnectivity graphs are plotted on the same scale. The potential energy density of minima is too high to include them all in a disconnectivity graph, since an inexhaustive search produces in excess of 105 minima. Instead, random samples of 150 connected minima are shown for each example, which are representative of more comprehensive disconnectivity graphs. The first key difference between the monodisperse and binary landscapes is that the number of minima in the binary systems vastly exceed the three in the monodisperse case. This difference can be explained and quantified by taking a combinatorial approach. We treat the NA particles as a small perturbation to an otherwise monodisperse system. For example, by distinguishing NA particles in the monodisperse I-minimum this state splits into multiple distinguishable minima. We use the Redfield–Pólya enumeration theorem to count these unique combinations, which has successfully been applied before to count atomic arrangements in heterofullerenes.53 Here, for NA = 12 and 60, we expect approximately 3 × 10¹¹ states, whereas for NA = 30, we expect 3 × 10¹⁸. However, this analysis assumes that the A-type particles have no effect on the spatial arrangement or stability of the monodisperse state, and does not consider new stable states that differ in structure from the monodisperse cases. It remains an interesting open question to establish whether increasing the size ratio between A and B particles increases or reduces the total number of minima, compared to when A and B are treated as infinitesimal perturbations of the monodisperse system.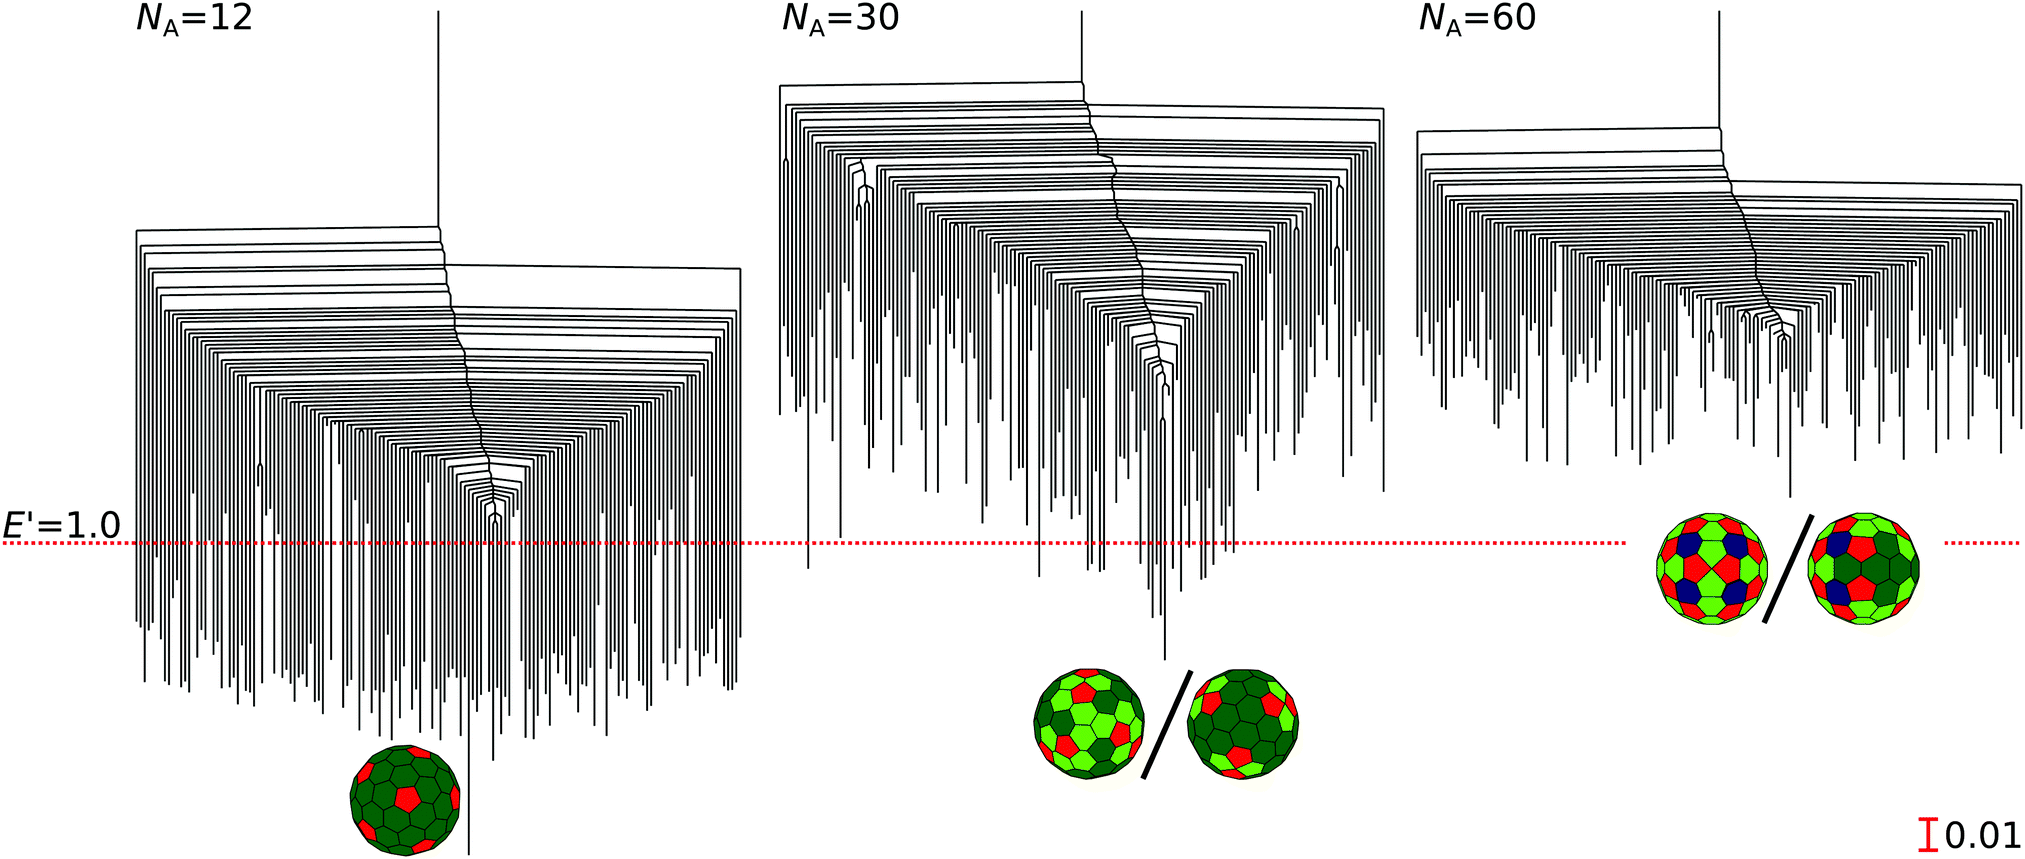 | ||
| Fig. 3 (a–c) Disconnectivity graphs for NA = 12, 30, and 60 respectively, shown plotted on the same scale with the E′ = 1 level indicated. For visual clarity, only a representative sample of 150 connected minima are shown. The global minimum energy structures are also indicated, with front and back views for NA = 30 and 60. | ||
The second key difference between the monodisperse and binary landscapes is that the binary landscapes are weakly funnelled with numerous deep minima, reminiscent of binary clusters.4 This structure explains the diversity of stable states observed in experiments when prepared from a high temperature quench,14 in simulations when relaxing to a local minimum from a random starting configuration,13 and perhaps also the diverse packing arrangements of polydisperse epithelial cells in SphEMs.16
From previous analysis of the landscapes for Lennard-Jones clusters,54 we might have expected particularly high-symmetry, low-energy global minima to be associated with strongly funnelled landscapes. Surprisingly, however, this trend is not reflected in Fig. 3, in which all three landscapes appear qualitatively similar. For NA = 12, the high-symmetry I-global minimum is distinguished as the lowest energy state by a modest margin, but is not the deepest minimum located. The NA = 12 and NA = 30 landscapes are both modestly funnelled, with the NA = 60 landscape marginally shallower.
We now examine the structural differences in the minima both within and between the landscapes, summarised in Fig. 4. Across the energy range of each landscape, we randomly sample 100 minima lying within E′ intervals of 0.01. For intervals containing fewer than 100 minima, all of them are included. From these samples, we compute the average and standard deviation of the order parameters Q6 and CAB.
 | ||
| Fig. 4 (a–c) Variation of the icosahedral order parameter for five-coordinate sites Q6 and clustering parameter CAB with E′ for NA = 12, 30, and 60, respectively. Error bars indicate the standard deviation in the samples. The grey histogram illustrates the population density in the libraries of local minima. Representative minima from the extreme ends of the stability ranges are illustrated beneath. | ||
For NA = 12, shown in Fig. 4a, we see that at low energies, the icosahedral symmetry is well-preserved. As with the example minimum shown, these systems are indeed defective variants of the global minimum. At higher energies, this ordering is lost, and we observe highly defective states. However, there is little change in the clustering across the energy range. At NA = 30, shown in Fig. 4b, the low energy states are again defective variants of the global minimum, with relatively high CAB and low Q6. CAB exhibits a modest decrease as E′ increases. Interestingly, the majority of defects in the hexagonal lattice occur within A-regions: it is relatively rare for the necessary pentagonal defects to be populated by the larger B particles, even in high-energy systems. At NA = 60, illustrated in Fig. 4c, we see a partial recovery of icosahedral packing for the pentagonal sites at low energy, as shown in the structure illustrated. However, this order disappears at high energy. CAB also changes relatively little, suggesting overall that the degree of segregation of the particles depends almost exclusively on NA and not E′. This critical dependence on NA is particularly pertinent to binary pattern formation on spheres, in which the degree of clustering plays a functional role.
Heat capacities
Finally, we examine the heat capacities at constant volume, Cv, for the binary and monodisperse systems considered, shown in Fig. 5. Throughout, we have scaled all reported potential energies by the normalisation factor Eref/12. We also employ this construction in Fig. 5 to scale the thermal energy, allowing for a direct comparison of Cv between the different systems.
 | ||
| Fig. 5 Constant volume heat capacities for the monodisperse system (NA = 0) and three binary systems (NA = 12, 30, 60) on a normalised thermal energy scale. | ||
Although the disconnectivity graphs appear qualitatively similar in Fig. 3, striking thermodynamic differences are revealed in the Cv profiles. As a reference, the monodisperse system exhibits a single, low-amplitude peak, consistent with a significant occupation probability change from the global minimum to the two higher energy states. For NA = 12, the peak in Cv is associated with the occupation probability increase in a substantial proportion of the database of minima, so we may view this feature as a melting transition.44 The substantial stabilisation of the global minimum relative to all excited states shifts the melting peak to higher temperatures than for the monodisperse system. The multiplicity of excited states increases the peak amplitude. For NA = 30, two peaks are observed. The lower temperature peak corresponds to a solid–solid transition, in which the population of a small number of minima, which are close in energy to the global minimum, becomes significant. The higher temperature peak corresponds to a melting transition. For NA = 60, the separation of energy scales within the low energy minima, and between the low and higher energy minima, is not so distinct, producing a shouldered peak rather than two distinct peaks. Compared to NA = 12, the reduced stability of the global minimum relative to the excited states for both the NA = 30 and NA = 60 systems, shifts the peaks to temperatures an order of magnitude lower.
It is interesting to note that the different heat capacity profiles provide further evidence for the principle of maximum symmetry.55 Stated briefly, the principle suggests that although the mean energy of high-symmetry and low-symmetry structures is not expected to differ substantially, high-symmetry systems exhibit a wider variance of energies, and hence are more likely to be found as global minima. Hence the NA = 12, I-global minimum has a larger energy separation from the numerous low-symmetry excited states than for the NA = 30 or NA = 60 systems. This result suggests that the NA = 12 system shows a higher melting temperature precisely because of the high symmetry of the global minimum.
The melting transitions of Lennard-Jones clusters are mostly driven by the landscape entropy, associated with the relatively large number of higher potential energy minima, as opposed to the well entropy, which corresponds to the vibrational entropy contributions of each individual minimum.44,56 The vibrational entropy usually increases for higher-lying minima. Employing harmonic vibrational densities of states then causes a systematic shift in the melting point to higher temperature, because the entropy underestimate is greater for the liquid-like phase. Within the harmonic approximation, we may evaluate the difference in Helmholtz free energy F between state j and the global potential energy minimum (denoted state ‘o’), as
Fj − Fo = −kBT(log![[thin space (1/6-em)]](https://www.rsc.org/images/entities/char_2009.gif) Oo − logOj + κlogo − κlogj) + Ej − Eo. Oo − logOj + κlogo − κlogj) + Ej − Eo. | (4) |
. For NA = 12, the relatively soft normal modes of the global potential energy minimum mean that the ground state is entropically stabilised, which is an unusual situation. In contrast, for NA = 30, the ground state is entropically destabilised relative to nearly all the other states. For NA = 60, a mixture of entropic stabilisation and destabilisation occurs for all states relative to the global potential energy minimum configuration.
An interesting extension to the present investigation would be to study the kinetics of bidisperse spherical systems to analyse how the underlying potential energy landscape encodes the glassy dynamics observed recently in experiment.14
Conclusions
We have analysed the structures and potential energy landscapes of bidisperse systems of repulsive particles confined to a spherical surface. By varying the number of small particles at fixed total particle number, we identified a range of high-symmetry binary packings. Moreover, small particles were able to passivate topological defects, so that, surprisingly, certain bidisperse systems were stabilised relative to the monodisperse case. Importantly, however, for all the landscapes we surveyed, an overwhelming number of defective, low-lying minima were located, which we expect to destroy ergodicity in many experimental and computational systems. A consequence of this effect is that, in order to find global minima, more specialised techniques were required to locate biminima, corresponding to minima in both configurational and permutational space.For the global minima, an interesting competition was identified between local ordering, favouring particle segregation, and global ordering, favouring high-symmetry structures. In the corresponding energy landscapes, low energy structures are largely defective global minima, while high energy structures tend to exhibit substantially reduced global ordering. Interestingly, the degree of segregation between the particle types only depends on the composition, not the energy, and this is a key conclusion for applications where function depends on particle clustering.
Finally, we found that the melting temperature for systems with low-symmetry ground states is an order of magnitude lower than for monodisperse, or high-symmetry binary systems. Although highly ordered global minima exist for many binary systems, broken ergodicity and low melting temperatures are responsible for the significant variety of structures observed in nature, experiments, and simulations.
Recent work is beginning to explore the rich array of structures and organisation arising from polydispersity (see for example ref. 15, 57 and 58). Going forward it will be interesting to investigate how curvature, the interaction potential, and polydispersity interact to affect the energy landscape, and how these parameters might be exploited in designing functionality.
Author contributions
AFB and JRP contributed equally to the preparation of this manuscript, including formal analysis, investigation, visualization, and writing the original draft. JRP also contributed to the methodology and software developed by DJW. DJW supervised the project, with JRP as co-supervisor. DJW led the project conceptualization, funding acquisition, project administration, and writing, reviewing and editing.Conflicts of interest
There are no conflicts to declare.Acknowledgements
The authors would like to acknowledge the encouragement and experimental work of Daria S. Roshal, Marianne Martin, Kirill Fedorenko, Virginie Molle, Stephen Baghdiguian, and Sergey B. Rochal, which promoted the development of this research. The authors also acknowledge Halim Kusumaatmaja for the original software development of the binary spherical systems used here. DJW gratefully acknowledges the EPSRC for financial support.References
- M. J. Bowick and L. Giomi, Adv. Phys., 2009, 58, 449–563 CrossRef CAS.
- M. Dodgson and M. Moore, Phys. Rev. B: Condens. Matter Mater. Phys., 1997, 55, 3816–3831 CrossRef CAS.
- C. R. Li, W. J. Dong, L. Gao and Z. X. Cao, Appl. Phys. Lett., 2008, 93, 34108 CrossRef.
- V. K. de Souza and D. J. Wales, J. Chem. Phys., 2009, 130, 194508 CrossRef PubMed.
- A. R. Bausch, M. J. Bowick, A. Cacciuto, A. D. Dinsmore, M. F. Hsu, D. R. Nelson, M. G. Nikolaides, A. Travesset and D. A. Weitz, Science, 2003, 299, 1716–1718 CrossRef CAS PubMed.
- M. Bowick, A. Cacciuto, D. R. Nelson and A. Travesset, Phys. Rev. Lett., 2002, 89, 185502 CrossRef CAS PubMed.
- A. Pérez-Garrido and M. A. Moore, Phys. Rev. B: Condens. Matter Mater. Phys., 1999, 60, 15628–15631 CrossRef.
- T. Erber and G. M. Hockney, J. Phys. A: Gen. Phys., 1991, 24, L1369–L1377 CrossRef.
- D. J. Wales and S. Ulker, Phys. Rev. B: Condens. Matter Mater. Phys., 2006, 74, 212101 CrossRef.
- T. S. Ingebrigtsen and H. Tanaka, J. Phys. Chem. B, 2015, 119, 11052–11062 CrossRef CAS PubMed.
- M. D. Ediger and P. Harrowell, J. Chem. Phys., 2012, 137, 080901 CrossRef CAS PubMed.
- T. Hamanaka and A. Onuki, Phys. Rev. E: Stat., Nonlinear, Soft Matter Phys., 2007, 75, 41503 CrossRef PubMed.
- A. M. Mascioli, C. J. Burke, M. Q. Giso and T. J. Atherton, Soft Matter, 2017, 13, 7090–7097 RSC.
- N. Singh, A. K. Sood and R. Ganapathy, Nat. Commun., 2020, 11, 4967 CrossRef CAS PubMed.
- S. Fortuna and D. L. Cheung, Colloids Interface Sci. Commun., 2017, 17, 10–13 CrossRef CAS.
- D. S. Roshal, K. Azzag, E. Le Goff, S. B. Rochal and S. Baghdiguian, Sci. Rep., 2020, 10, 7652 CrossRef CAS PubMed.
- C. Martinand-Mari, B. Maury, F. Rousset, A. Sahuquet, G. Mennessier, S. Rochal, V. Lorman, P. Mangeat and S. Baghdiguian, PLoS One, 2009, 4, e4202 CrossRef PubMed.
- K.-H. Baumann and B. Boeckel, J. Micropalaeontology, 2013, 32, 123–133 CrossRef.
- U. Riebesell, I. Zondervan, B. Rost, P. D. Tortell, R. E. Zeebe and F. M. Morel, Nature, 2000, 407, 364–366 CrossRef CAS PubMed.
- T. Bollhorst, K. Rezwan and M. Maas, Chem. Soc. Rev., 2017, 46, 2091–2126 RSC.
- H. Jiang, L. Liu, Y. Li, S. Yin and T. Ngai, ACS Appl. Mater. Interfaces, 2020, 12, 4989–4997 CrossRef CAS PubMed.
- T. Bollhorst, S. Shahabi, K. Wçrz, C. Petters, R. Dringen, M. Maas and K. Rezwan, Angew. Chem., Int. Ed., 2015, 54, 118–123 CrossRef CAS PubMed.
- L. Zhang, Q. Fan, X. Sha, P. Zhong, J. Zhang, Y. Yin and C. Gao, Chem. Sci., 2017, 8, 6103–6110 RSC.
- Z. Chen, X. Zhao and A. Tang, J. Phys. Chem. A, 1999, 103, 10961–10968 CrossRef CAS.
- R. H. Xie, L. Jensen, G. W. Bryant, J. Zhao and V. H. Smith, Chem. Phys. Lett., 2003, 375, 445–451 CrossRef CAS.
- I. Garg, H. Sharma, K. Dharamvir and V. K. Jindal, J. Comput. Theor. Nanosci., 2011, 8, 642–655 CrossRef CAS.
- S. H. Noh, C. Kwon, J. Hwang, T. Ohsaka, B. J. Kim, T. Y. Kim, Y. G. Yoon, Z. Chen, M. H. Seo and B. Han, Nanoscale, 2017, 9, 7373–7379 RSC.
- F. G. Bernal Texca, E. Chigo-Anota, L. Tepech Carrillo and M. Castro, Int. J. Comput. Mater. Sci. Eng., 2017, 1103, 1–10 CAS.
- D. Schebarchov and D. J. Wales, Phys. Rev. Lett., 2014, 113, 156102 CrossRef CAS PubMed.
- R. Zandi, D. Reguera, R. F. Bruinsma, W. M. Gelbart and J. Rudnick, Proc. Natl. Acad. Sci. U. S. A., 2004, 101, 15556–15560 CrossRef CAS PubMed.
- Z. Li and H. A. Scheraga, Proc. Natl. Acad. Sci. U. S. A., 1987, 84, 6611–6615 CrossRef CAS PubMed.
- D. J. Wales and J. P. K. Doye, J. Phys. Chem. A, 1997, 101, 5111–5116 CrossRef CAS.
- D. J. Wales and H. A. Scheraga, Science, 1999, 285, 1368–1372 CrossRef CAS PubMed.
- D. Schebarchov and D. J. Wales, J. Chem. Phys., 2013, 139, 221101 CrossRef CAS PubMed.
- J. N. Murrell and K. J. Laidler, Trans. Faraday Soc., 1968, 64, 371–377 RSC.
- S. A. Trygubenko and D. J. Wales, J. Chem. Phys., 2004, 120, 2082–2094 CrossRef CAS PubMed.
- S. A. Trygubenko and D. J. Wales, J. Chem. Phys., 2004, 121, 6689–6697 CrossRef CAS PubMed.
- G. Henkelman, B. P. Uberuaga and H. Jónsson, J. Chem. Phys., 2000, 113, 9901–9904 CrossRef CAS.
- G. Henkelman and H. Jónsson, J. Chem. Phys., 2000, 113, 9978–9985 CrossRef CAS.
- L. J. Munro and D. J. Wales, Phys. Rev. B: Condens. Matter Mater. Phys., 1999, 59, 3969–3980 CrossRef CAS.
- Y. Zeng, P. Xiao and G. Henkelman, J. Chem. Phys., 2014, 140, 044115 CrossRef PubMed.
- http://www-wales.ch.cam.ac.uk/software.html .
- D. J. Wales, Mol. Phys., 1993, 78, 151–171 CrossRef CAS.
- D. J. Wales, Phys. Rev. E, 2017, 95, 030105(R) CrossRef PubMed.
- P. J. Steinhardt, D. R. Nelson and M. Ronchetti, Phys. Rev. B: Condens. Matter Mater. Phys., 1983, 28, 784 CrossRef CAS.
- O. M. Becker and M. Karplus, J. Chem. Phys., 1997, 106, 1495–1517 CrossRef CAS.
- D. J. Wales, M. A. Miller and T. R. Walsh, Nature, 1998, 394, 758–760 CrossRef CAS.
- D. J. Wales, J. P. K. Doye, A. Dullweber, M. P. Hodges, F. Y. Naumkin, F. Calvo, J. Hernández-Rojas and T. F. Middleton, The Cambridge Cluster Database, 2001, http://www-wales.ch.cam.ac.uk/CCD.html.
- N. D. Socci, J. N. Onuchic and P. G. Wolynes, Proteins: Struct., Funct., Genet., 1998, 32, 136–158 CrossRef CAS.
- D. S. Roshal, Phys. Solid State, 2013, 55, 2128–2131 CrossRef CAS.
- N. A. García, A. D. Pezzutti, R. A. Register, D. A. Vega and L. R. Gómez, Soft Matter, 2015, 11, 898–907 RSC.
- H. S. Seung and D. R. Nelson, Phys. Rev. A: At., Mol., Opt. Phys., 1988, 38, 1005–1018 CrossRef PubMed.
- M. Ghorbani and M. Songhori, Fullerenes, Nanotubes, Carbon Nanostruct., 2013, 21, 460–471 CrossRef CAS.
- J. P. K. Doye, M. A. Miller and D. J. Wales, J. Chem. Phys., 1999, 111, 8417–8428 CrossRef CAS.
- D. J. Wales, Chem. Phys. Lett., 1998, 285, 330–336 CrossRef CAS.
- D. J. Wales, Energy Landscapes: Frequently Asked Questions, https://www.ch.cam.ac.uk/group/wales.
- I. Azizi and Y. Rabin, Entropy, 2020, 22, 570 CrossRef PubMed.
- T. S. Ingebrigtsen and H. Tanaka, J. Phys. Chem. B, 2016, 120, 7704–7713 CrossRef CAS PubMed.
Footnote |
| † These authors contributed equally to this work. |
| This journal is © The Royal Society of Chemistry 2021 |