DOI:
10.1039/D1SM01052B
(Paper)
Soft Matter, 2021,
17, 8810-8831
Non-hyperuniform metastable states around a disordered hyperuniform state of densely packed spheres: stochastic density functional theory at strong coupling
Received
16th July 2021
, Accepted 5th September 2021
First published on 23rd September 2021
Abstract
The disordered and hyperuniform structures of densely packed spheres near and at jamming are characterized by vanishing of long-wavelength density fluctuations, or equivalently by long-range power-law decay of the direct correlation function (DCF). We focus on previous simulation results that exhibit the degradation of hyperuniformity in jammed structures while maintaining the long-range nature of the DCF to a certain length scale. Here we demonstrate that the field-theoretic formulation of stochastic density functional theory is relevant to explore the degradation mechanism. The strong-coupling expansion method of stochastic density functional theory is developed to obtain the metastable chemical potential considering the intermittent fluctuations in dense packings. The metastable chemical potential yields the analytical form of the metastable DCF that has a short-range cutoff inside the sphere while retaining the long-range power-law behavior. It is confirmed that the metastable DCF provides the zero-wavevector limit of the structure factor in quantitative agreement with the previous simulation results of degraded hyperuniformity. We can also predict the emergence of soft modes localized at the particle scale by plugging this metastable DCF into the linearized Dean–Kawasaki equation, a stochastic density functional equation.
I. Introduction
Hyperuniformity is characterized by density fluctuations that decrease to zero at the longest scales.1–17 We have observed the hyperuniform states in a variety of complex soft matter systems, including foams, polymer blends, colloidal suspensions and biological tissues (see ref. 1 and 2 for reviews). It has also been found that non-crystalline materials with hyperuniformity have unique physical properties such as high-density transparency and isotropic filtration of elastic or electromagnetic waves.1–4 Consequently, considerable attention has been given to disordered hyperuniform materials fabricated at the micro- and nano-scales, because of their potential importance for applications in photonics, electronics, and structural components with novel properties.3,4
Here we focus on computer glasses among the disordered hyperuniform systems. Recent methodological developments allow us to create computer glasses in an experimentally relevant regime,1–43 and yet the disordered hyperuniformity at jamming has not always been realized.1,2,38–43 The emergence of hyperuniformity depends on the preparation protocols, partly because of the significantly long computational time that is required to determine the configurations near and at jamming.1,2,5–14
On the one hand, some simulation studies have demonstrated the hyperuniformity in densely packed spheres: the structure factor S(k) in a hyperuniform state exhibits a non-trivial linear dependence on the wavevector magnitude k in the low-wavevector range near and at jamming (i.e., S(k) ∼ k (k ≥ 0)), and the zero-wavevector limit of the structure factor S(0) eventually vanishes at jamming.1,2,5–14 These results indicate not only the existence of long-range order, but also the complete suppression of density fluctuations over the system scale.
Meanwhile, other simulation studies near and at jamming38–43 provide the non-vanishing structure factor at the zero wavevector. The degradation of hyperuniformity is that either saturation or an upturn is observed for S(k) at the lowest values of k, despite the linear relation above the crossover wavevector kc:38–43
| |  | (1) |
It has also been demonstrated that
S(0) is weakly dependent on the density variation.
38–43
The quantitative difference between the non-hyperuniform and hyperuniform states can be seen from the inverse of the zero-wavevector structure factors. While the non-vanishing values of S(0) due to the incomplete linear-dependence of S(k) are in the range of38–43
| |  | (2) |
the hyperuniform computer glasses have been characterized by inequality,
| |  | (3) |
irrespective of system details.
1,2,5–14
In terms of density–density correlation functions in real space, hyperuniformity is a kind of inverted critical phenomenon. It is among the critical phenomena in normal fluids that total correlation functions are long-ranged at critical points, accompanied by the diverging behaviors of density fluctuations and isothermal compressibility, while keeping the direct correlation function (DCF) short-ranged. In contrast, the inverted critical phenomenon is that the hyperuniform DCF is long-ranged in correspondence with the vanishing isothermal compressibility, despite the absence of long-range behavior for the total correlation function.1,2,5–14,17
More concretely, the long-range behavior of the hyperuniform DCF c(r) is described by the power-law as follows:1,2,5–7,13,17
| |  | (4) |
where |
r| =
r and
σ denotes the sphere diameter. The long-range decay of
c(
r) reads
c(
k) ∼
k−1 in the Fourier space, which is equivalent to the linear behavior
S(
k) ∼
k due to the following relation between
S(
k) and
c(
k):
| |  | (5) |
with
n being the spatially averaged density of spheres. Furthermore, in disordered packings of hard spheres, the hyperuniform DCF for
r ≤
σ satisfies another power-law,
13| |  | (6) |
which is divergent at small
r.
It follows from eqn (1) and (5) that the non-hyperuniform DCF c(r) at jamming satisfies the scaling relation (4) over a finite range. In other words, the violation of hyperuniformity occurs while maintaining the long-range behavior to a length scale Lc: eqn (4) holds in the range of σ < r ≤ Lc38–43 where
| |  | (7) |
It is to be noted that the simulation results of hyperuniform systems are also likely to provide the finiteness represented by
eqn (7),
1,2,5–14 for we have computational difficulty obtaining the scaling behavior (
c(
r) ∼
r−2) over
Lc from the structure factor, irrespective of whether the computer glass is in a hyperuniform or non-hyperuniform state.
This common feature of the long-range behavior (eqn (4)) in the hyperuniform and non-hyperuniform DCFs raises the question of what causes the difference between eqn (2) and (3). Accordingly, it is the purpose of this study to reveal the underlying mechanism behind the difference between the emergence and degradation of hyperuniformity. To this end, we formulate an analytical form of the non-vanishing zero-wavevector structure factor that satisfies eqn (2) under the condition of eqn (7). A key ingredient of our formulation is the strong-coupling approximation of stochastic density functional theory (DFT)44–56 which can consider intermittent fluctuations while fixing the density field at a given distribution of dense packings near and at jamming.
The remainder of this paper consists of two parts. In the former part of Sections II–IV, the problem to be addressed is defined. Section II provides the theoretical background as to why stochastic DFT should be brought into the problem of fluctuation-induced non-hyperuniformity. In Section III, the basic formulation of stochastic DFT is presented, focusing on the definition of metastable states. Then, we find that stochastic DFT allows us to relate the metastable zero-wavevector structure factor S*(0) to the potential energy λ* per particle, which will be referred to as the metastable chemical potential. In Section IV, the non-hyperuniform state on the target is specified using Table 1, which shows the classification list of hyperuniform and non-hyperuniform systems.
Table 1 Four types of hyperuniform and non-hyperuniform systems. We investigate the type N1 of non-hyperuniform systems (see Sec. IV for the details)
| System |
Characterization of the DCF |
Type |
| Power-law decay |
Magnitude at zero separation |
| Hyperuniform |
Complete |
— |
H1 |
| Incomplete |
Divergent |
H2 |
| Non-hyperuniform |
Incomplete |
Finite |
N1 |
| Absent |
Finite |
N2 |
We see from the system specification that the non-hyperuniformity of our concern requires the short-range cutoff of the metastable DCF c*(r), as well as a drop in the long-ranged DCF for r > Lc. Our primary goal is to derive the short-range cutoff of the DCF by developing the strong-coupling approximation for stochastic DFT.
The latter part of this paper presents the results and discussion regarding the metastable DCF c*(r). Before entering the main results, Section V compares the stochastic DFT with the equilibrium DFT57–74 in terms of S*(0). It is demonstrated as a preliminary result that the resulting forms of S*(0) in the equilibrium and stochastic DFTs coincide with each other as far as the Gaussian approximation of stochastic DFT is adopted. Section VI provides the metastable DCF expressed by the Mayer-type function form, hence verifying the cutoff for the metastable DCF c*(r) inside the sphere. As a consequence, we confirm that S*(0) satisfies relation (2), instead of eqn (3). In Section VII, the coupling constant γ to represent the strength of interactions is introduced using the hyperuniform DCF c(r), and it is shown that the 1/γ expansion method becomes equivalent to the virial-type one at the strong coupling of γ ≫ 1. Correspondingly, the interaction term in the metastable chemical potential λ* is expressed by the above metastable DCF c*(r). In Section VIII, the stochastic density functional equation clarifies that the short-range cutoff of the metastable DCF c*(r) leads to the emergence of dynamic softening at the particle scale: the interaction-induced restoring force against density fluctuations around a metastable state vanishes within the scale of spherical diameter σ. The microscopic mechanism behind the soft modes is also discussed in connection with previous simulation results. Furthermore, both Fig. 3 and Table 2 summarize the static and dynamic results for comparing equilibrium DFT, stochastic DFT in the Gaussian approximation, and stochastic DFT in the strong-coupling approximation. The final remarks are given in Section IX.
Table 2 Comparison between the theoretical approaches and results (see also Sec. VIIIC). We follow the notation of the type names given in Table 1
II. A theoretical background of stochastic DFT
This section is intended to provide a brief overview of theoretical approaches to jammed structures for explaining the relevance of stochastic DFT44–56 to the degradation of hyperuniformity.
A. Marginal stability and the free energy landscape
There have been two conceptual approaches to address various issues on computer glasses, including the structure factors that vary depending on the protocols used.1,2,5–14,16 One is the ensemble approach to investigate physically relevant packings based on the packing protocol selected. The other method is the geometric-structure approach for the quantitative characterization of single-packing configurations to enumerate and classify the jammed structures.
On the one hand, the ensemble approach has involved the problem that the protocol-dependency of the occurrence frequency of jammed configurations leads to the ambiguity of weighing jammed states.1,2,5–17 Recently, however, the protocol-dependency problem is theoretically tackled: the canonical ensemble method is developed for a large number of allowed configurations to resolve the configuration realizability issue.16
The geometric-structure study, on the other hand, has distinguished three types of jamming for densely packed spheres:1,2,11 local, collective and strict jammings. These types of jamming are hierarchical in that local and collective jammings are prerequisites for collective and strict ones, respectively, as follows: (i) in locally jammed states, a particle cannot translate when the positions of all other spheres in the packing are fixed; (ii) in collectively jammed states, particles prevented from translating are further stable to uniform compression; (iii) strictly jammed packings are stable against both uniform and shear deformations.
The geometric-structure studies on various computer glasses have verified that the hyperuniformity emerges in either strictly or collectively jammed systems having isostaticity.1,2,8 Here the isostatic configuration provides a mean contact number 2d per particle with d being the spatial dimension, thereby enhancing the mechanical stability. To be noted, however, the mechanical rigidity of jammed packings is a necessary but not sufficient condition for hyperuniformity.
It has been conjectured that any strictly jammed saturated infinite packing of identical spheres is hyperuniform; the conjecture excludes the existence of rattlers or particles that are free to move in a confining cage, by definition of strictly jammed packings.1,2,5,12,17 Conversely, it depends on simulation methods and conditions whether dense packings other than the strictly jammed ones, including the isostatic and collectively jammed systems, are hyperuniform or not. The isostatic systems can be destabilized by cutting one particle contact unless disordered packings are strictly jammed. In other words, isostaticity is a critical factor in mechanical marginal stability.1,2,12,18–37,75–83
Recent simulation results have demonstrated that thermal fluctuations in the marginal states are accompanied by the intermittent rearrangements of particles.18–37 As a consequence, the marginal systems become responsive to have low-frequency soft modes that are nonphononic and anharmonic. For instance, quasi-localized modes coupled to an elastic matrix create soft spots composed of tens to hundreds of particles undergoing displacements.18–37 The low-frequency soft modes exhibit similar behaviors, and the common features of marginal states have been related to the emergence of many local minima in the free-energy landscape.26,84–87
The similarity in anharmonic vibrations suggests that the ensemble of configurations visited by the slow dynamics could reveal the characteristics of marginal stability associated with the free-energy landscape, even though possible configurations depend on a protocol adopted.1,2,5–14,16
B. The free-energy density functional: comparison between stochastic and equilibrium DFTs
For assessing the applicability of density functional approaches to the free-energy landscape in glassy systems, let us compare stochastic DFT44–56 and equilibrium DFT, or classical DFT conventionally used.57–74
Equilibrium DFT,57–74 one of the ensemble approaches, has been found relevant to investigate the free-energy landscape.84–91 It has been demonstrated that metastable minima determined by equilibrium DFT are not only correlated with the appearance of two-step relaxation and divergence of relaxation time, but are also directly connected with dynamical heterogeneity.62–74 In equilibrium DFT, the metastable density profile ρ*(r) has been approximated by the superposition of narrow Gaussian density profiles centered around a set of points forming an aperiodic lattice. Equilibrium DFT has properly identified the metastable state of a liquid having an inhomogeneous and aperiodic density as a local minimum of the equilibrium free-energy functional with respect to the variation in the width parameter for the above-mentioned Gaussian distribution.62–74
However, the violation of perfect hyperuniformity has been beyond the scope of equilibrium DFT. Recently, the following three scenarios of imperfections have been proposed for demonstrating the degradation of hyperuniformity both theoretically and numerically:15 (i) uncorrelated point defects, (ii) stochastic particle displacements that are spatially correlated, and (iii) thermal excitations. In this study, we focus on the second scenario (ii) that is related to intermittent particle rearrangements in a contact network, a set of bonds connecting particles which are in contact with each other (see ref. 18–22, 75 and 76 for reviews). The elastic nature of the contact network could be responsible for the above-mentioned second scenario of non-hyperuniformity, or the spatially correlated displacements occurring stochastically; this will be discussed in Sections VIII and IX, based on the results obtained herein.
From stochastic DFT,44–56 on the other hand, it is expected that the above-mentioned second scenario (i.e., (ii) stochastic and spatially correlated displacements) could be described in terms of stochastic density dynamics. To see this, a brief review of stochastic DFT is given below.
Stochastic DFT has been used as one of the most powerful tools for describing slowly fluctuating and/or intermittent phenomena, such as glassy dynamics, nucleation or pattern formation of colloidal particles, dielectric relaxation of Brownian dipoles, and even tumor growth (see ref. 44 for a thorough review). The stochastic density functional equation, which has often been referred to as the Dean–Kawasaki equation,44,45 forms the basis of stochastic DFT. It has been shown in various systems that the Dean–Kawasaki equation successfully describes the stochastic evolution of the instantaneous microscopic density field of overdamped Brownian particles. Of great practical use is the Dean–Kawasaki equation linearized with respect to density fluctuations around various reference density distributions.44,50–52,54–56
As seen below, stochastic DFT is formulated on the hybrid framework that combines equilibrium DFT and statistical field theory.54,55,92 The hybrid framework allows us to investigate the metastable states considering fluctuations as clarified below. In Section VIII, stochastic DFT will also shed light on the dynamical properties of non-hyperuniformity.
III. Basic formulation: stochastic DFT
This section shows that stochastic DFT44–56 is available to investigate the zero-wavevector limit of the structure factor S*(0) in a metastable state. It is not merely a review of the previous formulations,54 but rather a revisit for making it clear that stochastic DFT serves as a systematic evaluation of S*(0): as demonstrated in Sections VI and VII, we can evaluate the extent to which S*(0) is altered to the stochastic fluctuations around a hyperuniform state in a systematic manner.
First, the constrained free-energy functional  is represented by the hybrid form using the functional and configurational integrals (Section IIIA). Next, we introduce the non-equilibrium excess chemical potential appearing in the stochastic DFT equation (Section IIIB). Third, the metastable state is defined based on stochastic DFT (Section IIIC). Last, the metastable DCF c*(r) is generated from the metastable chemical potential λ*, thereby yielding S*(0) expressed by c*(r) (Section IIID).
A. Constrained free-energy functional  in connection with the Fokker–Planck equation
Let  be the instantaneous microscopic density of an N-particle system where the position ri(t) at time t represents an instantaneous location of the i-th particle. The corresponding distribution functional P[ρ, t] of the density field ρ(r, t) is defined by
| |  | (8) |
where  signifies the noise-averaging operation for
  in the overdamped dynamics.
As detailed in Appendix A, P[ρ, t] satisfies the Fokker–Planck equation given by eqn (A1). It follows from the stationary condition ∂Pst[ρ]/∂t = 0 on the Fokker–Planck equation that the distribution functional in a steady state, Pst[ρ], is determined by the free-energy functional  of a given density field ρ(r, t):
| |  | (9) |
We can evaluate the constrained free-energy functional

by introducing a fluctuating potential field
ϕ as follows (see Appendix A for the derivation of
eqn (10)–(13)):
| |  | (10) |
where Δ[
ρ] denotes the constraint due to the canonical ensemble:
| |  | (11) |
The functional
F[
ρ,
ϕ] in the exponent of
eqn (10) is defined using the grand potential as follows:
| | 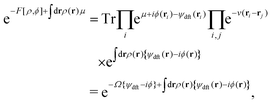 | (12) |
where

,
μ denotes the equilibrium chemical potential,
v(
r) is the original interaction potential including the hard sphere potential and Lennard-Jones potential, and
Ω[
ψ] is the grand potential in the presence of an external field
ψ(
r). Here it is noted that all the energetic quantities used in this study (
e.g.,
μ,
v(
r) and
Ω[
ψ]) are given in
kBT-unit.
As clearly seen from Appendix A, the fluctuating potential field ϕ(r) in eqn (12) traces back to the auxiliary field for the Fourier transform of the Dirac delta functional  .54,55,92 Also, the functional F[ρ, ϕ ≡ 0] in the absence of the ϕ-field corresponds to the intrinsic Helmholtz free energy in the presence of the external field ψdft(r). Therefore, the following relation holds:
| |  | (13) |
according to equilibrium DFT.
58–61
B. Non-equilibrium excess chemical potential λex[ρ]
The Fokker–Planck equation for P[ρ, t] is equivalent to the stochastic DFT equation, or the Dean–Kawasaki equation,44 which is given by| |  | (14) |
| |  | (15) |
where  can be expressed as
  using the bare diffusion constant
  and the vectorial white noise field
  defined by the correlation 〈ηl(r, t)ηm(r′, t′)〉 = δlmδ(r − r′)δ(t − t′), and λex[ρ] will be referred to as the non-equilibrium excess chemical potential.
Combining eqn (10) and (15), we have
| |  | (16) |
which further reads
| |  | (17) |
| |  | (18) |
where Δ
Fdft[
ρ,
ϕ] signifies the free-energy difference between
F[
ρ,
ϕ] and
F[
ρ, 0], and the Lagrange multiplier
λN enforces the number constraint

and is reduced to the chemical potential
μ when considering equilibrium DFT (see Section IIIC).
In the Gaussian approximation of the ϕ-field, we have
| |  | (19) |
| |  | (20) |
using the density–density correlation function
w−1(
r −
r′) (see Appendix A6 for details). For the concrete representation of the above propagator
w(
r), we define the DCF
c(
r) and the total correlation function
h(
r) based on equilibrium DFT. The propagator
w(
r) is expressed as
| |  | (21) |
| | | w−1(r − r′) = ρ(r){δ(r − r′) + h(r − r′)ρ(r′)}. | (22) |
Eqn (21) and (22) manifest that equilibrium DFT is incorporated into stochastic DFT.
It follows from eqn (16)–(18) that
| |  | (23) |
giving
| |  | (24) |
because |∇
λN| = 0. In Section V, we will evaluate the second term on the right-hand side (rhs) of
eqn (23),

, following the above-mentioned Gaussian approximation, whereas the strong-coupling approximation developed for the evaluation of
F[
ρ,
ϕ] will be presented in Section VII.
C. Comparison with the deterministic DFT equation
It has been proved in various ways that the stochastic DFT equation (eqn (14)) is converted into the deterministic DFT equation44 when neglecting the additional free-energy functional ΔFdft[ρ, ϕ]; hence, eqn (24) reduces to| |  | (25) |
when the last noise term on the rhs of eqn (14) disappears.
Going back to eqn (20) and (21), we find that the Ramakrishnan–Yussouff functional57 of the intrinsic Helmholtz free energy F[ρ, 0] is of the following form:
| |  | (26) |
where Δ
ρ ≡
ρ −
n, Δ
Fid[
ρ] ≡
Fid[
ρ] −
Fid[
n], and
n =
N/
V denotes the uniform mean density with
V being the system volume. Combining
eqn (13) and (26) provides
| |  | (27) |
which reads
| |  | (28) |
stating that the conventional relation of equilibrium DFT for a prescribed density
ρ(
r) is satisfied by adjusting the external potential
ψdft(
r) (see also
eqn (A7)).
We obtain from plugging eqn (26) into eqn (25) the deterministic DFT equation using the Ramakrishnan–Yussouff functional:
| |  | (29) |
Comparison between
eqn (14) and (29), or between
eqn (24) and (25), indicates the difference between the stochastic and deterministic DFT equations.
D. Defining metastable states based on stochastic DFT
Before considering the metastability condition for the stochastic DFT equation (eqn (14)), we connect the metastable distribution  determined by equilibrium DFT with the deterministic DFT equation (eqn (29)). In the absence of the external field (i.e., ψdft ≡ 0), eqn (13) reduces to the metastability condition for equilibrium DFT:
| |  | (30) |
where  becomes equal to the intrinsic Helmholtz free energy defined in equilibrium. Correspondingly, eqn (27) leads to
| |  | (31) |
The non-equilibrium excess chemical potential λex[ρ] should disappear at  :
:| |  | (32) |
implying that the Lagrange multiplier λN is correctly identified with the equilibrium chemical potential μ at  , as mentioned above.
The difference between the equilibrium and stochastic DFTs can be clearly seen from plugging eqn (30) into eqn (14) and (29). On the one hand, the deterministic DFT equation (eqn (29)) ensures that eqn (30) is a steady-state condition: we have  because the rhs of eqn (29) vanishes due to
  . On the other hand, the stochastic DFT equation (eqn (14)) for
  becomes
| |  | (33) |
revealing that, in general,

is not a steady-state distribution in terms of stochastic DFT.
Meanwhile, the metastability condition for the stochastic DFT equation (eqn (14)) is that the metastable excess chemical potential λex[ρ*] given by eqn (23) does not necessarily vanish but has a spatially constant value  :
:
| |  | (34) |
The first term on the rhs of
eqn (14) disappears when
eqn (34) is satisfied, yielding
| |  | (35) |
on noise-averaging. A previous study based on stochastic thermodynamics has shown that the heat dissipated into the reservoir is negligible on average when satisfying
eqn (34) or
eqn (35).
54
In this study, we thus adopt the metastability condition (34) based on stochastic DFT, instead of eqn (30).
E. The zero-wavevector structure factor S*(0) in a metastable state defined by eqn (34)
It has been demonstrated near and at jamming that the structure factor S*(k) in a metastable state can be written as| |  | (36) |
because the structure factor in a frozen state mainly arises from the configurational part which is associated with the averaged positions of arrested particles.42Eqn (32), (34) and (36) imply that S*(0) is obtained from the metastable chemical potential,| |  | (37) |
in a similar manner to equilibrium DFT as follows:| | 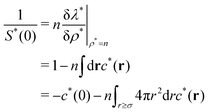 | (38) |
| |  | (39) |
where the metastable DCF c*(r) is defined by eqn (38) using the metastable chemical potential λ* and the approximate expression given in the last line of eqn (39) is obtained from the Ornstein–Zernike equation regarding c*(r) at zero separation r = 0 (see Appendix B1 for detailed derivation).
Equilibrium DFT, on the other hand, provides the metastable density distribution  determined by eqn (30). It follows that the metastable structure factor S*(k) reads
| |  | (40) |
with 〈
ρ*(
k)〉 in
eqn (36) being replaced by

. Then, we obtain from
eqn (26) and (30)| |  | (41) |
confirming that the DCF
c(
r) determines the zero-wavevector structure factor.
IV. Our aim: non-hyperuniform states on the target
Table 1 classifies the hyperuniform and non-hyperuniform systems into four types for clarifying the non-hyperuniform state to be addressed hereafter. The type H1 in Table 1 signifies the hyperuniform state without requirement for c*(0) because eqn (4) is completely satisfied (i.e., Lc → ∞).
Despite the finiteness of the long-range nature, eqn (39) still predicts that the hyperuniformity of type H2 is necessarily observed near and at jamming unless the zero-separation divergence of c*(0) is avoided. This is because 1/S*(0) diverges due to either the long-range nature or the divergent behavior at zero separation, as found from combining eqn (4) and (39).
To summarize, there are two requirements on the non-hyperuniform DCF c*(r) of type N1 as follows:
(i) Finiteness of the long-range nature – the non-hyperuniformity requires a drop in the long-ranged DCF for r > Lc. Namely, the first requirement is that c*(r) must decay rapidly to zero for r > Lc;39–43 otherwise, the second term on the rhs of eqn (39) is divergent.
(ii) Short-range cutoff – as seen from the first term on the rhs of eqn (39), the metastable DCF at zero separation (i.e., c*(0)) must have a finite value even as the densely packed systems approach jamming, which is the second requirement.
Eqn (39) reveals that the zero-wavevector structure factor never vanishes without meeting both of the above requirements. Nevertheless, exclusive attention in previous studies39–43 has been paid to the former requirement, and the short-range cutoff of the metastable DCF (the second requirement (ii)) remains to be investigated.
In reality, the zero-separation DCF tends to have an extremely large value near freezing in repulsive sphere systems; for instance, the Percus–Yevick approximation of hard sphere fluids provides93
| |  | (42) |
suggesting the divergent behavior of −
c*(0) in a frozen state.
Thus, we focus on the emergence of type N1 when investigating the degradation of hyperuniformity. To be more specific, we show theoretically that the non-hyperuniformity of type N1 satisfies
| |  | (43) |
though the hyperuniformity of type H2 is incorporated into equilibrium DFT as input:
| |  | (44) |
where
c(
r) is different from the completely hyperuniform DCF in that
Lc is supposed to have a finite value. Following equilibrium DFT,
eqn (41) and (44) lead to
S*(0) ∼ −
c(0) > 10
4 despite the finiteness of the long-range power-law decay, which is the hyperuniformity of type H2.
We are now ready to address the issues on the non-hyperuniformity of type N1. In what follows, we present a preliminary result obtained in the Gaussian approximation for comparing stochastic and equilibrium DFTs, and subsequently prove in the strong-coupling approximation of stochastic DFT that eqn (44) transforms to eqn (43) as a result of the ensemble average over the fluctuating ϕ-field (see also eqn (17)).
V. Gaussian approximation of stochastic DFT
In the first place, we investigate the free-energy functional difference between the stochastic and equilibrium DFTs when performing the Gaussian approximation given by eqn (19). In the Gaussian approximation, eqn (23) reduces to| |  | (45) |
As seen from Appendix A7 for details, we have| | 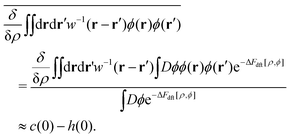 | (46) |
Combining eqn (26), (37) and (46), eqn (45) reads| |  | (47) |
in a metastable state. We find from eqn (38) and (47)| |  | (48) |
while neglecting δc(0)/δρ, or the triplet DCF. Comparison between eqn (41) and (48) confirms that no degradation of hyperuniformity is induced by Gaussian potential fluctuations.
To see the correspondence with previous results, it is convenient to transform eqn (47) to
| |  | (49) |
Eqn (49) is, on the one hand, of the same form as the previous results obtained from the Gaussian approximation in various ways when
λ* =
μ.
94,95 On the other hand, comparison between
eqn (28) with
ψdft ≡ 0 and
eqn (49) indicates that
eqn (49) is identical to the self-consistent equation of
ρ*(
r) conventionally used in equilibrium DFT when
| |  | (50) |
when
λN =
μ and
λex = {
c(0) −
h(0)}/2.
Eqn (50) reveals that stochastic fluctuations create an additional contribution, the second term on the rhs of
eqn (50), to the equilibrium chemical potential
μ.
VI. Main results and comparison with simulation results
To go beyond the Gaussian approximation, we need to explore an expansion method adequate for strongly correlated sphere systems near and at jamming. One candidate is the virial-type expansion that has proven to be applicable to inhomogeneous ionic fluids at strong coupling.96 In the next section, we will verify that the virial-type expansion can apply also to the evaluation of λex[ρ] given by eqn (17), hence yielding the metastable DCF c*(r) other than c(r).
In this section, the obtained form of the metastable DCF c*(r), which satisfies the relation (43), is presented in advance (Section VIA). Subsequently, the calculated value of S*(0) is compared with the simulation results (i.e., eqn (2)) on the non-hyperuniform structure factor at jamming (Section VIB).
A. Typical behaviors of the metastable DCF c*(r)
As proved in the next section, the development of the strong-coupling expansion method, or the 1/γ expansion method, allows us to find the following form of the metastable chemical potential λ*:| |  | (51) |
| | | −c*(r − r′) = 1 − e−v(r−r′)−w(r−r′). | (52) |
Since the relation w(0) ≫ 1 holds at jamming, eqn (52) leads toregardless of the repulsive potential form of v(r). Eqn (53) reveals that, in general, the metastable DCF c*(r) given by (52) satisfies the second requirement (or eqn (43)) for the non-hyperuniformity (see requirement (ii) in Section IV). Particularly for hard spheres, the resulting form (52) reads| |  | (54) |
where ![[r with combining tilde]](https://www.rsc.org/images/entities/i_char_0072_0303.gif) ≡ r/σ. Eqn (54) meets the above-mentioned non-hyperuniformity requirements given by eqn (43) with
≡ r/σ. Eqn (54) meets the above-mentioned non-hyperuniformity requirements given by eqn (43) with  .
.
While the short-range cutoff is seen in the third term on the rhs of eqn (51), the second term on the rhs of eqn (51) corresponds to the effective self-energy which is divergent due to the power-law behavior expressed by eqn (44). This implies that the effective self-energy term (= w(0)/2) offsets the decrease in the interaction contribution due to the short-range cutoff.
Thus, we have obtained various forms of the chemical potential given by eqn (31), (47) and (51) from the equilibrium DFT, the stochastic DFT in the Gaussian approximation, and the stochastic DFT in the strong-coupling approximation, respectively. The above discussions also suggest that the different results of the hyperuniform and non-hyperuniform chemical potentials (i.e., eqn (31) and (51)) are compatible with each other in terms of absolute values.
In Fig. 1, comparison is made between the ![[r with combining tilde]](https://www.rsc.org/images/entities/i_char_0072_0303.gif) -dependencies of −c(r) and −c*(r) for the repulsive harmonic potential given by
-dependencies of −c(r) and −c*(r) for the repulsive harmonic potential given by
| | v(r) = ε(1 − ![[r with combining tilde]](https://www.rsc.org/images/entities/i_char_0072_0303.gif) )2Θ(1 − )2Θ(1 − ![[r with combining tilde]](https://www.rsc.org/images/entities/i_char_0072_0303.gif) ), ), | (55) |
where
ε controls the interaction strength and
Θ(
x) is the Heaviside step function. It is supposed in
Fig. 1 that −
c(
r) is of the following form:
| | 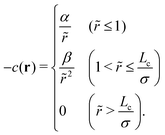 | (56) |
To be noted,
eqn (56) does not include the delta function

due to the isostaticity, a significant negative contribution to −
c(
r) at
![[r with combining tilde]](https://www.rsc.org/images/entities/i_char_0072_0303.gif)
= 1.
13
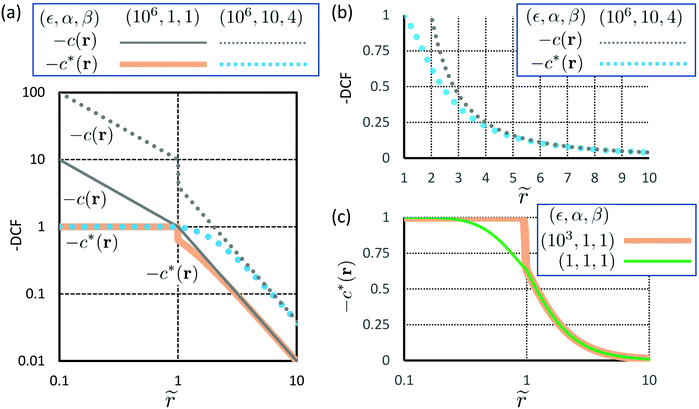 |
| | Fig. 1 Comparison between the metastable DCF c*(r) given by eqn (52) and the hyperuniform DCF c(r) expressed by eqn (56) for the parameter sets of (ε, α, β) as follows: while we need to fix two parameters, α and β, for representing the expression (56) of c(r), it is necessary to set not only α and β, but also the parameter ε of the original interaction potential v(r) given by eqn (55) for showing the obtained form (52) of c*(r). (a) A log–log plot of c(r) and c*(r) which are depicted using the parameter sets as follows: (ε, α, β) = (106, 10, 4) and (106, 1, 1). (b) A linear plot for comparing c(r) and c*(r) with the parameter set of (ε, α) = (106, 10, 4) in more detail. (c) A semi-log plot of c*(r) when ε is decreased from 106 to either 103 or 1. The metastable DCF c*(r) is softened with the decrease of ε in eqn (55). | |
Previous simulation studies38–43 have indicated the parameter ranges of ε ≥ 104, α ∼ 101 and 0.1 ≤ β ≤ 101 close to jamming. Correspondingly, we consider four sets of parameters in Fig. 1: (ε, α, β) = (106, 10, 4), (106, 1, 1), (103, 1, 1) and (1, 1, 1). In Fig. 1(a), the hyperuniform and metastable DCFs, −c(r) and −c*(r), are depicted for two sets of parameters, (ε, α, β) = (106, 10, 4) and (106, 1, 1), on a log–log plot. We can see from Fig. 1(a) that the potential value of the metastable DCF saturates to unity irrespective of the short-range behavior of −c(r), and that the short-range deviation of −c*(r) from −c(r) is larger with the increase of α and β. A magnified view for r ≥ σ is shown in Fig. 1(b), allowing us to make a comparison between −c(r) and −c*(r) for (ε, α, β) = (106, 10, 4) in more detail. Fig. 1(b) shows that −c*(r) converges to −c(r) for r ≫ σ even when there is an obvious difference in the DCFs at r = 2σ between −c(r = 2σ) = β/4 and −c*(r = σ) = 1 − e−β/4 for β = 4. Fig. 1(c) compares the profiles of −c*(r) for ε = 103 and 1 with α and β being the same value (α = β = 1) on a semi-log plot. This indicates that the metastable DCF inside the sphere (i.e., −c*(r) for r ≤ σ) is not changed until the interaction strength represented by the parameter ε is reduced considerably (for instance, ε = 1 in Fig. 1(c)) far from the jamming values of ε ≥ 104.
B. Comparison with simulation results given by eqn (2) and (7)
It follows from eqn (39), (52), (55) and (56) that the approximate form of the zero-wavevector structure factor S*(0) is determined by both the volume fraction fv of packed spheres and the cutoff length Lc:| |  | (57) |
for Lc/σ ≫ 1; see Appendix B2 for detailed derivation. The first choice to investigate the type-N1 non-hyperuniformity at jamming is to set Lc/σ = 10 and fv = 0.65, according to the previous simulation results38–43 of non-hyperuniform harmonic-core sphere systems. Eqn (57) then becomes 1/S*(0) = 156β, implying that relation (2) applies to the metastable structure factor:| |  | (58) |
with  being in a reasonable range of 0 ≤ b < 1.
For validation of the above evaluation, Fig. 2 provides the dependences of 1/S*(0) on Lc/σ in the range of eqn (7) for β = 1, 4 and 10 with fv = 0.65 being used as before. As seen from Fig. 2, a comparison between the precise result (see eqn (B9) in Appendix B2) and the approximate expression (57) shows that eqn (57) is an acceptable approximation. The precise results depicted by solid lines in Fig. 2 further verify the relation (58) for 1 ≤ β ≤ 10 in the range of eqn (7) for Lc/σ. Thus, we find that the metastable DCF c*(r) given by eqn (52), one of the main results in this study, quantitatively explains the previous simulation results on the non-hyperuniformity of type N1.
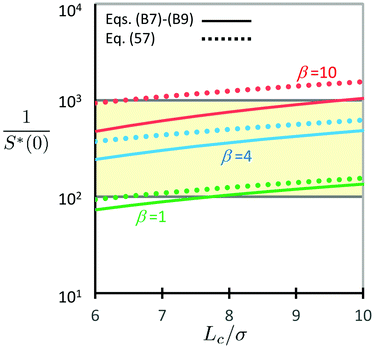 |
| | Fig. 2 The last expression in eqn (39) can be calculated analytically when using eqn (52) and (56). The three solid lines depict the analytical result (B9) with eqn (B7) and (B8), or the precise results of the zero-wavevector structure factor S*(0), for β = 1, 4 and 10 at fv = 0.65. For comparison, the dotted lines representing the approximate form (57) are also drawn for the same parameter sets: β = 1, 4 and 10 at fv = 0.65. The yellow area corresponds to the non-hyperuniform range of 1/S*(0) which is given by either eqn (2) or eqn (58). | |
It is also suggested by Fig. 2 that β ∼ 10−1 leads to 1/S*(0) < 102 as long as the cutoff of −c*(0) = 1 holds. This result appears to contradict previous simulation results13 in hyperuniform hard sphere systems where not only the small value of β ∼ 10−1 but also the existence of Lc in the range of eqn (7) have been found. At the same time, however, the divergent relation −c(r) ≈ 10/![[r with combining tilde]](https://www.rsc.org/images/entities/i_char_0072_0303.gif)
![[thin space (1/6-em)]](https://www.rsc.org/images/entities/char_2009.gif) (
(![[r with combining tilde]](https://www.rsc.org/images/entities/i_char_0072_0303.gif) < 1) has been verified for the present hyperuniform hard sphere systems.13 Accordingly, the divergent behavior of the hyperuniform DCF −c(0) at zero-separation ensures the hyperuniform relation (3): the relation, 1/S(0) ≈ −c(0) > 104, holds even when β ∼ 10−1 and Lc/σ ∼ 101, which is exactly the hyperuniform state of the type-H2 in Table 1.
< 1) has been verified for the present hyperuniform hard sphere systems.13 Accordingly, the divergent behavior of the hyperuniform DCF −c(0) at zero-separation ensures the hyperuniform relation (3): the relation, 1/S(0) ≈ −c(0) > 104, holds even when β ∼ 10−1 and Lc/σ ∼ 101, which is exactly the hyperuniform state of the type-H2 in Table 1.
VII. Verification of the main result given by eqn (51) and (52) in the strong-coupling approximation
There are three steps to verify both the metastable chemical potential λ* and the DCF c*(r) given by eqn (51) and (52), respectively. First, we define the coupling constant γ and present the free-energy functionals rescaled by γ, suggesting the validity of the strong-coupling expansion method, or the density-expansion method at high density (Section VIIA). Second, the non-equilibrium chemical potential λ[ρ] defined by eqn (16)–(18) is calculated for non-interacting spheres at strong coupling (Section VIIB). Third, we connect the 1/γ expansion, which is equivalent to the density expansion (or the fugacity expansion96), with the virial-type term expressed by the Mayer function, thereby proving eqn (51) and (52) (Section VIIC).
A. Rescaled free-energy functionals
We introduce the rescaled propagator ![[w with combining tilde]](https://www.rsc.org/images/entities/i_char_0077_0303.gif) (r) using a coupling constant γ:
(r) using a coupling constant γ:| |  | (59) |
Since we consider the type-H2 hyperuniform systems as mentioned before, it is found from eqn (21) and (44) that the coupling constant γ is approximated by γ ≈ e−c(0)/2 and becomes extremely large near and at jamming.
We aim to develop the 1/γ expansion method at strong coupling (γ ≫ 1), provided that γ is extremely large but is finite. In the next subsection, we will show that the virial-type expansion method, the density-expansion method, can be regarded as the 1/γ expansion method. Before proceeding, we see the γ-dependencies of functionals based on the following criteria:
Criterion 1: ΔFdft[![[small rho, Greek, tilde]](https://www.rsc.org/images/entities/i_char_e0e4.gif) ,
, ![[small phi, Greek, tilde]](https://www.rsc.org/images/entities/i_char_e0e2.gif) ] ∼ γ0,
] ∼ γ0,
Criterion 2:  .
.
Criterion 1 allows us to discern the perturbative terms at strong coupling, in comparison with the rescaled functional ΔFdft[![[small rho, Greek, tilde]](https://www.rsc.org/images/entities/i_char_e0e4.gif) ,
, ![[small phi, Greek, tilde]](https://www.rsc.org/images/entities/i_char_e0e2.gif) ] ∼ γ0, whereas criterion 2 is equivalent to the Ornstein–Zernike equation58–61 for rescaled correlation functions,
] ∼ γ0, whereas criterion 2 is equivalent to the Ornstein–Zernike equation58–61 for rescaled correlation functions, ![[c with combining tilde]](https://www.rsc.org/images/entities/i_char_0063_0303.gif) (r) and
(r) and ![[h with combining tilde]](https://www.rsc.org/images/entities/i_char_0068_0303.gif) (r), that should be defined to satisfy
(r), that should be defined to satisfy
| |  | (60) |
| | ![[w with combining tilde]](https://www.rsc.org/images/entities/i_char_0077_0303.gif) −1(r − r′) = −1(r − r′) = ![[small rho, Greek, tilde]](https://www.rsc.org/images/entities/i_char_e0e4.gif) (r){δ(r − r′) + (r){δ(r − r′) + ![[h with combining tilde]](https://www.rsc.org/images/entities/i_char_0068_0303.gif) (r − r′) (r − r′)![[small rho, Greek, tilde]](https://www.rsc.org/images/entities/i_char_e0e4.gif) (r′)}, (r′)}, | (61) |
consistently with the original definitions given by
eqn (21) and (22).
It is found from eqn (19) and (59) that criterion 1 imposes potential rescaling as follows:
| | ϕ(r) = γ![[small phi, Greek, tilde]](https://www.rsc.org/images/entities/i_char_e0e2.gif) (r). (r). | (62) |
On the other hand, it follows from criterion 2, or
eqn (59) to
(61), that the correlation functions and the density field are necessarily rescaled as
| |  | (63) |
to satisfy criterion 2.
Combining eqn (59) and (62) transforms eqn (19) to
| |  | (64) |
meeting criterion 1. Meanwhile, the rescaled form
F[
![[small rho, Greek, tilde]](https://www.rsc.org/images/entities/i_char_e0e4.gif)
, 0] of the Ramakrishnan–Yussouff free energy functional
(26) is
| |  | (65) |
where

and

. Comparison between the rescaled functionals,
eqn (64) and (65), suggests that the
![[small rho, Greek, tilde]](https://www.rsc.org/images/entities/char_e0e4.gif)
-dependent terms can be treated perturbatively at strong coupling (
γ ≫ 1).
B. The non-equilibrium chemical potential of non-interacting spheres at strong coupling
Going back to eqn (12), we develop the 1/γ expansion method. It is found from eqn (28) that| |  | (66) |
Also, we shift the fluctuating-potential field from ϕ to φ such that| |  | (67) |
whose rescaled form is| |  | (68) |
due to the relations (62) and (63). Substituting eqn (68) into eqn (66), we have the rescaled form,| |  | (69) |
considering that  . Moreover, eqn (28), (67) and (69) are arranged to give
| | 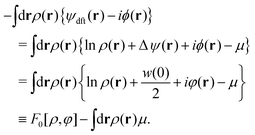 | (70) |
Combining eqn (66)–(70), eqn (12) reads| |  | (71) |
which is the functional to be evaluated using the 1/γ expansion method at strong coupling, γ ≫ 1.
Let us see the non-equilibrium chemical potential λ[ρ] in a reference system of non-interacting spheres, prior to formulating the strong-coupling approximation of eqn (71). In the absence of the interaction potential v(ri − rj), eqn (71) is exactly reduced to the ideal free-energy functional for the non-interacting system:
| | 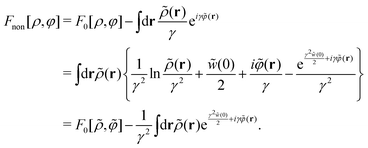 | (72) |
It follows that
| | 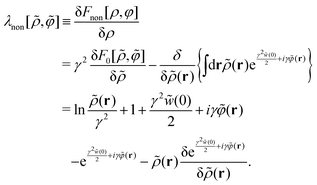 | (73) |
We need to perform the average of
λnon[
![[small rho, Greek, tilde]](https://www.rsc.org/images/entities/char_e0e4.gif)
,
![[small variant phi, Greek, tilde]](https://www.rsc.org/images/entities/i_char_e12c.gif)
] over the
ϕ-field based on the original definition in addition to relation
(68). In the strong-coupling approximation, we obtain from
eqn (73)| |  | (74) |
which corresponds to the non-equilibrium chemical potential
λnon[
ρ] of non-interacting spheres; see Appendix C2 for the detailed derivation of
eqn (74).
Eqn (74) implies that
| |  | (75) |
C. Connecting the 1/γ expansion with the virial-type expansion: derivation scheme of eqn (51) and (52)
In the strong-coupling approximation, the long-range correlations of the shifted fluctuating potential φ(r) are maintained:| |  | (76) |
as well as relation (20) for the fluctuating ϕ-potential (see the derivation of eqn (C15) in Appendix C1). Eqn (76) implies that| |  | (77) |
Hence, the 1/γ expansion becomes equivalent to the following density expansion (or the fugacity expnasion96):| | 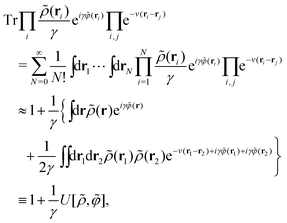 | (78) |
where| |  | (79) |
In eqn (79), we have introduced instantaneous one- and two-particle densities, ![[small rho, Greek, circumflex]](https://www.rsc.org/images/entities/i_char_e0b7.gif) 1(s) = δ(s − r) and
1(s) = δ(s − r) and  , for making a distinction between the first and the second terms on the rhs of eqn (79).
Combining eqn (71), (72) and (78) provides
| |  | (80) |
and we define the non-equilibrium chemical potential difference Δ
λ[
ρ] due to the addition of the interaction potential
v(
r) as follows:
| |  | (81) |
It follows from
eqn (72), (74), (76), (79) and (80) that the strong-coupling approximation of
eqn (81) leads to
| | 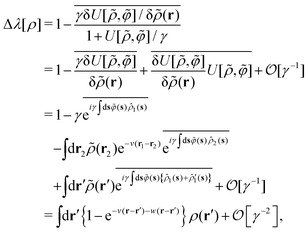 | (82) |
where it is noted that the instantaneous one-particle densities,
![[small rho, Greek, circumflex]](https://www.rsc.org/images/entities/i_char_e0b7.gif) 1
1(
s) =
δ(
s −
r) and

, are unable to coexist at the same time by definition; see Appendix C for detailed and more precise discussions regarding the derivation of
eqn (82). We obtain from
eqn (74) and (82)| |  | (83) |
The main result given by
eqn (51) and (52) is thus verified.
VIII. Discussions
In this section, we aim to gain insight into the short-range cutoff of the metastable DCF c*(r) from dynamic aspects. We consider a fluctuating displacement field u(r, t) which is related to the density difference, ν(r, t) = ρ(r, t) − ρ*(r). Since the fluctuating density field ν(r, t) obeys the linearized Dean–Kawasaki equation of stochastic DFT,44,50–52,54–56 the short-range dynamics of u(r, t) can be inferred from the ν-field dynamics. First, we will see that the short-range cutoff of the metastable DCF implies the disappearance of the interaction-induced restoring force against the fluctuating density field ν(r, t) (Section VIIIA). Next, the connection of the short-range softening with anharmonic soft modes will be discussed in terms of u-field dynamics (Section VIIIB). Last, we summarize the results presented so far using Table 2 (Section VIIIC).
A. Dynamic implication for the short-range cutoff of the metastable DCF c*(r)
Expanding the non-equilibrium excess chemical potential λex[ρ] around ρ*(r), the Dean–Kawasaki eqn (14) becomes| | 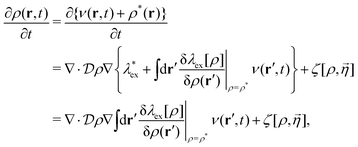 | (84) |
| |  | (85) |
where  has been used in eqn (84). Combining Eqn (84) with eqn (85) leads to the linearized Dean–Kawasaki equation as follows:
| |  | (86) |
due to the manipulation of the noise term.54Eqn (86) represents the overdamped dynamics of the fluctuating density field ν(r, t) around the metastable non-hyperuniform state.
Eqn (86) indicates that the interaction-induced restoring force against the density deviation ν(r, t) is given by the sum of −∇c*(r − r′)ν(r′, t). Focusing on the short-range contribution to this force, we find that microscopic environments in the hyperuniform and non-hyperuniform states are quite different from each other. While the scaling behavior (6) in a hyperuniform state predicts the divergence of |∇c(r − r′)| → ∞ in the limit of |r − r′| → 0, the short-range cutoff of the non-hyperuniform DCF c*(r) creates the opposite situation on the particle scale:
| | | |∇c*(r − r′)| ≈ 0 (|r − r′| < σ), | (87) |
as seen from
Fig. 1. The above relation implies that there is no interaction-induced restoring force against the
ν-field in the non-hyperuniform states at the particle-scale while preserving the long-range contribution, −∇
c*(
r −
r′)
ν(
r′,
t) = ∇(
β/|
r −
r′|
2)
ν(
r′,
t), for |
r −
r′| ≫
σ.
B. Microscopic mechanism behind the appearance of eqn (87)
Eqn (86) for the overdamped Brownian dynamics is insufficient for the descriptor of vibrational modes due to the absence of the inertia term, and yet eqn (87) suggests the emergence of dynamic softening in non-hyperuniform systems. We can learn the microscopic mechanism of soft modes from previous studies on quasicontacts of a contact network, a skeleton of jammed matter.18–22,75,76 The previous findings could provide an intuitive understanding of the virial-type expansion at high density as will be seen below.
For isostatic and hyperuniform systems, the packing geometry uniquely defines the contact forces as well as the spatial network structures including void distributions.1,2,8–12 Previous studies have shown that the isostatic and hyperuniform states disappear upon relaxing the strict constraints on the size- and spatial-distributions of voids slightly away from jamming.1,2,9,10,12 The relative abundance of non-isostatic contacts provides quasicontacts that carry weak forces, thereby creating local excitations with little restoring forces.12,19–22,76
The possible particles forming the quasicontacts include rattlers and/or bucklers.12,19–22,76–83 It has been found, for instance, that the bucklers in the d-dimensional space, having d + 1 contacts as part of the contact network, are likely to be buckled to generate quasi-localized soft modes observed in the lowest-frequency regime.19–22,76–83 The anomalous vibrational modes have been shown to exhibit strong anharmonicities that are accompanied by intermittent rearrangements of particles as follows: opening a weak contact of a buckler (i.e., buckling) yields a disordered core of a few particle scale with a power-law decay of displacements which are coupled to the elastic background of the contact network.19–37,76–83
It is not the center of our concern whether or not the rattlers and/or bucklers significantly contribute to the quasicontacts to degrade the hyperuniformity. It is, however, illuminating to interpret eqn (86) and (87) in terms of quasi-localized soft modes.
Then, let u(r, t) be the fluctuating displacement field induced by the fluctuating density field ν(r, t). In the first approximation, we have97
| | | ν(r, t) = −∇·{ρ*(r)u(r, t)}. | (88) |
Combining
eqn (54), (56) and (86)–(88), we can verify that the displacement field
u(
r,
t) shares common features with that of the quasi-localized soft modes as follows:
• The interaction-induced restoring force of u(r, t) is long-ranged in correspondence with recent simulations98–101 because of the power-law decay of the metastable DCF c*(r) represented by eqn (54) and (56).
• Eqn (86)–(88) imply the short-range anharmonicity of u(r, t) at the particle scale.
This connection of our theoretical results (particularly, eqn (87)) with the quasi-localized soft modes suggests that the virial-type expansion in a glassy state represents the particle–particle interactions occurring due to the intermittent particle rearrangements.
C. Summarizing the results in comparison with other treatments
The differences in the free-energy density functionals between the equilibrium and stochastic DFTs are summarized as follows:
(i) The density functional  appearing in the metastability eqn (34) represents the free-energy functional of the given density distribution ρ(r), instead of the equilibrium free-energy functional F[ρ, 0]. It is a clear advantage over equilibrium DFT that stochastic DFT can make use of the field-theoretic formulation in obtaining
  .
.
(ii) The metastability eqn (34) states that the functional derivative  should yield a spatially constant
  , which has been referred to as the metastable excess chemical potential. The sum of
  and the Lagrange multiplier λN corresponds to the metastable chemical potential and is reduced to the equilibrium chemical potential (i.e.,
  ) when
  and λN = μ in equilibrium; see also the discussion after eqn (32).
(iii) As found from eqn (30), (41) and (56), the input of the hyperuniform DCF allows equilibrium DFT to predict the hyperuniformity of a metastable state, without the knowledge on the reference density distribution in an amorphous state.
These characteristics of stochastic DFT enable us to evaluate the extent to which fluctuations around the metastable density ρ* affect the metastable chemical potential λ*. Actually, we have demonstrated that stochastic DFT is relevant to determine metastable states around a hyperuniform state. Stochastic DFT provides the analytical form of the metastable DCF that has a short-range cutoff inside the sphere while retaining the long-range power-law behavior. We should keep in mind that the long-range hyperuniform behavior is preserved because the Gaussian weight, e−ΔFdft, for the virial-type expansion premises that non-hyperuniform states considered are located near a hyperuniform state. As confirmed in Section VI, the obtained DCF yields the zero-wavevector structure factor in quantitative agreement with previous simulation results1,2,38–43 of degraded hyperuniformity.
Moreover, both Fig. 3 and Table 2 summarize the results by comparing the following theoretical approaches discussed so far: the equilibrium DFT using the Ramakrishnan–Yussouff free-energy functional,57 the stochastic DFT in the Gaussian approximation (see Section V), and the stochastic DFT in the strong-coupling approximation (see Section VII).
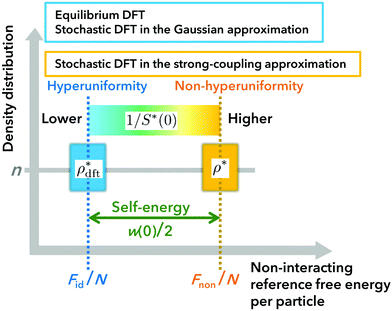 |
| | Fig. 3 A schematic comparison of theoretical approaches presented in this study. The spatially uniform density is identically n as shown on the vertical axis, and the hyperuniformity is incorporated into equilibrium DFT by inputting the hyperuniform DCF c(r) given by eqn (56); nevertheless, we have hyperuniform and non-hyperuniform treatments shown in blue and orange, respectively. The different results are due to the distinct values of non-interacting reference free-energy functionals (i.e., Fid[ρ] given by eqn (26) and Fnon[ρ] given by eqn (75)), which is represented by the horizontal axis. | |
The vertical axis in Fig. 3 shows that the density distribution considered has the same density n on average. The difference is attributed to the inhomogeneous distributions around n: the hyperuniform density distribution  , shown in blue, satisfies eqn (3) for the inverse of the zero-wavevector structure factor 1/S*(0), whereas the non-hyperuniform range of density distribution ρ*(r), shown in orange, satisfies eqn (2). As summarized in Fig. 3, the equilibrium DFT and stochastic DFT in the Gaussian approximation provide hyperunifomity, whereas the stochastic DFT in the strong-coupling approximation provides non-hyperuniformity.
Meanwhile, the transverse axis of Fig. 3 shows that the above two types of theoretical approaches take distinct reference free-energy functionals, as found by comparing Fid and Fnon given by eqn (26) and (75), respectively. In the hyperuniform theories, on the one hand, the ideal free-energy functional Fid/N per particle is the reference functional for the evaluation of interaction energy (see eqn (26)), following the conventional treatment of equilibrium DFT,57–61 where N denotes the total number of spheres as before. On the other hand, as a reference functional of stochastic DFT in the strong-coupling approximation, we used the free-energy functional Fnon/N of a non-interacting system per particle that is larger than the ideal one Fnon/N by the self-energy w(0)/2. It can be stated that a perturbation field theory method becomes more relevant to the evaluation of intermittent fluctuations due to the increase in the reference free energy.
Table 2 presents the more detailed classification of the hyperuniform and non-hyperuniform theories. There are two types of classifications for the above three treatments. One classification is based on the DFT type of whether the dynamical DFT relies on the deterministic equation (eqn (29)) or the stochastic equation (eqn (14)). The former approach represented by eqn (29) is equivalent to equilibrium DFT as clarified at the beginning of Section IIID, whereas the latter eqn (14) forms the basis of the last two stochastic approaches where the additional contribution ΔF[ρ, ϕ] to the intrinsic Helmholtz free energy F[ρ, 0] is to be considered. The other aspects of theoretical classification concern the predictability of non-hyperuniformity especially when the hyperuniformity is incorporated into the DCF (i.e., eqn (44) or (56)) of equilibrium DFT as input. The type specification column in Table 2 indicates that the stochastic DFT in the Gaussian approximation falls into the same category (type H2 defined in Table 1) of the equilibrium DFT in this light.
As confirmed from Table 2, the use of the density-expansion method at strong coupling is indispensable to convert the hyperuniform structure factor at the zero wavevector into the non-hyperuniform one satisfying the simulation results given by eqn (2). The outstanding feature of the non-hyperuniform DCF c*(r) is the short-range cutoff, thereby predicting the absence of the interaction-induced restoring force for the short-range dynamics (i.e., eqn (87)).
IX. Concluding remarks
For comparison purposes, let us go back to the previous study15 where the degradation of perfect hyperuniformity in crystals, quasicrystals, and disordered packings has been demonstrated both theoretically and numerically, using the three scenarios of imperfections (see Section II for the list of scenarios). The second scenario (ii), which has been our concern, attributes the violation of hyperuniformity to the stochastic occurrence of spatially correlated displacements.
Combining eqn (76) and the dynamical discussion in Section VIII suggests that the above-mentioned second scenario for the degradation of hyperuniformity is similar to the underlying physics described by the averaged virial-type interaction term, the third term on the rhs of eqn (51), under the long-range-correlated φ-field; for it seems plausible that the long-range-correlated potential field arises from the elastic nature of the contact network. From the discussion, we infer that the virial-type degradation of hyperuniformity reflects the intermittent rearrangements of particles and is more likely to be found in the collectively jammed packings allowing for the shear deformations as mentioned before, rather than in the strictly jammed ones.1,2,8 In other words, type H2 defined in Table 1 corresponds to the collectively jammed packings, whereas type H1 corresponds to the strictly jammed packings.
It remains to be seen whether the present formulation can be extended to address the non-hyperuniform behaviors of other measures than the density–density structure factor, which are obtained from various physical quantities including the local number variance for a window17 and the contact number fluctuations.102,103 We also envision that advancing stochastic DFT44–56 at strong coupling will pave the way for the realistic description of quasi-localized soft modes induced by the intermittent rearrangements of particles such as bucklers.19–22,76–83
Conflicts of interest
There are no conflicts to declare.
Appendix A: details on the constrained free-energy functional 
1. Verification of eqn (9)
The distribution functional P[ρ, t] defined by eqn (8) satisfies the Fokker–Planck equation as follows:44,104| |  | (A1) |
from which we find that eqn (9) satisfies the stationary condition ∂Pst[ρ]/∂t = 0. It has also been shown that eqn (A1) is equivalent to the Dean–Kawasaki eqn (14).44,104
2. Definition of 
In eqn (A1) as well as in eqn (14), the canonical ensemble is naturally required for the free-energy functional  of a given density ρ because we consider the overdamped dynamics of the densely packed sphere system with the total number N of spheres being fixed. Hence,
  is defined using the configurational integral for the canonical ensemble as follows:
| |  | (A2) |
Yet, equilibrium DFT, a key ingredient in this study, needs to be formulated in the grand canonical system. We therefore write  with the help of the contour integral over a complex variable z = eμ:54,104
| |  | (A3) |
so that the canonical ensemble may be recovered after performing the grand canonical ensemble represented by  .
.
3. Derivation of eqn (13)
We evaluate the underlined term in eqn (A3) with the help of the Fourier transform of the delta functional as follows:| | 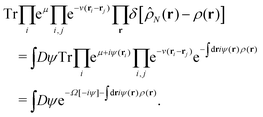 | (A4) |
The ψ-field is separated into the fluctuating potential field ϕ(r) and the saddle-point field iψdft(r):| | | ψ(r) = ϕ(r) + iψdft(r), | (A5) |
where ψdft(r) is determined by the saddle-point equation,| |  | (A6) |
The functional differentiation on the left-hand side of eqn (A6) provides the density in equilibrium of the system under the external field ψdft. Denoting the equilibrium density by 〈![[small rho, Greek, circumflex]](https://www.rsc.org/images/entities/i_char_e0b7.gif) N(r)〉eq, the saddle-point eqn (A6) implies that
N(r)〉eq, the saddle-point eqn (A6) implies that| | 〈![[small rho, Greek, circumflex]](https://www.rsc.org/images/entities/i_char_e0b7.gif) N(r)〉eq = ρ(r). N(r)〉eq = ρ(r). | (A7) |
The above relation states that a prescribed density ρ(r) is equated with the equilibrium density due to the potential ψdft along the saddle-point field.
For later convenience, we also introduce the intrinsic Helmholtz free energy F[ρ, 0], the central functional of equilibrium DFT:58–61
| |  | (A8) |
showing that the intrinsic Helmholtz free energy
F[
ρ, 0] is defined by the first Legendre transform of the grand potential
Ω[
ψdft] with the saddle-point field
ψdft(
r) being applied. Therefore, the identity
(13) is satisfied as well as that in equilibrium DFT.
4. Derivation of eqn (12)
Combining eqn (A4) and (A5), we have| | 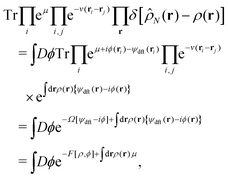 | (A9) |
when defining| |  | (A10) |
as an extension of eqn (A8). Eqn (A9) and (A10) validate eqn (12).
It follows from eqn (A3) and (A9) that| | 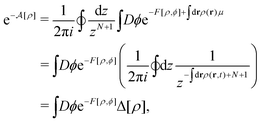 | (A11) |
where| | 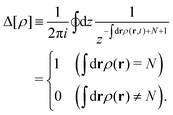 | (A12) |
Eqn (A11) and (A12) verify eqn (10) and (11), respectively.
6. Derivation of eqn (19)
The difference ΔFdft[ρ, ϕ] = F[ρ, ϕ] − F[ρ, 0] between eqn (A8) and (A10) reads| |  | (A13) |
The quadratic expansion of Ω[ψdft − iϕ] around the imaginary saddle-point field iψdft yields| |  | (A14) |
| |  | (A15) |
where the basic relationship has been used in equilibrium DFT as follows:| |  | (A16) |
as well as the definition (20) of w(r−r').
7. Derivation of eqn (46)
It is found from eqn (22) that eqn (46) reads| | 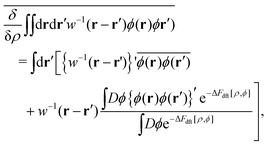 | (A17) |
where| |  | (A18) |
neglecting the density dependence of the total correlation function h(r − r′), and eqn (A17) and (A18) give a precise definition of {ϕ(r)ϕ(r′)}′ appearing in eqn (A17).
In eqn (A17), we use the following approximation:
| | 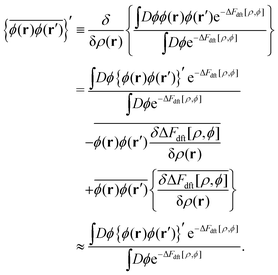 | (A19) |
Accordingly,
eqn (A17) reduces to
| | 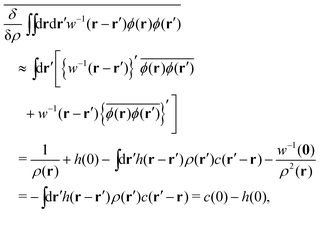 | (A20) |
where
| | 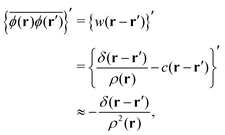 | (A21) |
neglecting the density dependence of the DCF, and the Ornstein–Zernike equation has been used in the last equality of
eqn (A20).
Appendix B: the zero-wavevector structure factor S(0) represented by the metastable DCF c*(r)
1. Derivation of eqn (39)
We consider the Ornstein–Zernike equation for the metastable correlation functions, c*(r) and h*(r), in a uniform state. The Ornstein–Zernike equation at zero separation is expressed as| |  | (B1) |
where the relationship h*(r) = −1 (0 ≤ r ≤ σ) has been used in the above second line. Adding the term  on both sides of eqn (B1), we have
| |  | (B2) |
which reads| |  | (B3) |
2. Derivation of eqn (57)
It is noted that c*(r)h*(r) decays far more rapidly than c*(r) even when the effective correlation functions converge to the hyperuniform ones, c(r) and h(r), for r > σ. Therefore, eqn (39) becomes| | 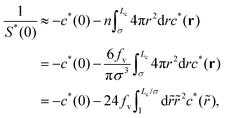 | (B4) |
where the relationship fv = πnσ3/6 between the volume fraction fv and the spatially averaged density n has been used in the second line of the above equation. For ![[r with combining tilde]](https://www.rsc.org/images/entities/i_char_0072_0303.gif) = r/σ > 1, combining eqn (52) and (56) provides
= r/σ > 1, combining eqn (52) and (56) provides| |  | (B5) |
which will be used in calculating the last term in the last line of eqn (B4). Integration by parts yields| | 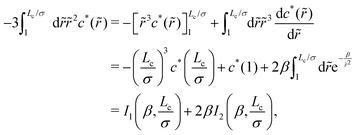 | (B6) |
where| |  | (B7) |
and the change of variable from ![[r with combining tilde]](https://www.rsc.org/images/entities/i_char_0072_0303.gif) to x = 1/
to x = 1/![[r with combining tilde]](https://www.rsc.org/images/entities/i_char_0072_0303.gif) gives
gives| | 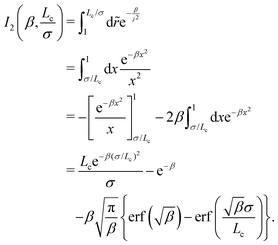 | (B8) |
Combining eqn (B2)–(B8), we have| |  | (B9) |
The approximate form of eqn (B9) for Lc/σ ≫ 1 leads to eqn (57):| |  | (B10) |
where we have used the approximations, −c*(Lc/σ) ≈ β(σ/Lc)2 and Lce−β(σ/Lc)2/σ ≈ Lc/σ, in the above second line. Fig. 2 shows the Lc/σ-dependencies of 1/S*(0) in order to compare eqn (B9) and (B10).
Appendix C: details on the averaging operation over the φ-field in the strong-coupling approximation
1. Shifting the fluctuating-potential field from ϕ to φ in eqn (17): a general formulation and validation of eqn (76)
We first see extra terms when ΔFdft[ρ, ϕ] is represented by the φ-field. Eqn (67) is rearranged to give| |  | (C1) |
which further reads| |  | (C2) |
due to the rescaling given by eqn (63) and its associated form,| | 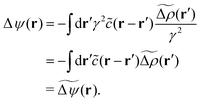 | (C3) |
Plugging eqn (C2) into eqn (19), we have| |  | (C4) |
because of  for the hyperuniform correlation function h(r):
| |  | (C5) |
where  for the hyperuniform structure factor S(0) at zero wavevector, and it is supposed that w(0) is the position-independent function because of the neglect of the triplet DCF (see also the statement after eqn (48)).
Before proceeding to the ϕ-field averaging operation defined by eqn (17), we clarify the corresponding terms where the strong-coupling approximation needs to be developed. To this end, let ζ[![[small variant phi, Greek, tilde]](https://www.rsc.org/images/entities/i_char_e12c.gif) ] be the general functional given by the sum of the
] be the general functional given by the sum of the ![[small variant phi, Greek, tilde]](https://www.rsc.org/images/entities/i_char_e12c.gif) -independent part ζc and the remaining
-independent part ζc and the remaining ![[small variant phi, Greek, tilde]](https://www.rsc.org/images/entities/i_char_e12c.gif) -dependent contribution ζr[
-dependent contribution ζr[![[small variant phi, Greek, tilde]](https://www.rsc.org/images/entities/i_char_e12c.gif) ]:
]:
| | ζ[![[small variant phi, Greek, tilde]](https://www.rsc.org/images/entities/i_char_e12c.gif) ] = ζc + ζr[ ] = ζc + ζr[![[small variant phi, Greek, tilde]](https://www.rsc.org/images/entities/i_char_e12c.gif) ]. ]. | (C6) |
It is noted that we can validate the following expansion at strong coupling (
i.e.,
γ ≫ 1):
| | 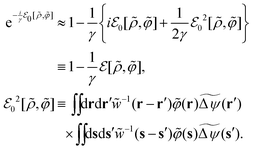 | (C7) |
Combining
eqn (C4) and (C7) provides the approximate functional

that is averaged over the
ϕ-field, instead of the
![[small variant phi, Greek, tilde]](https://www.rsc.org/images/entities/i_char_e12c.gif)
-field, based on the definition of
eqn (17) as follows:
| | 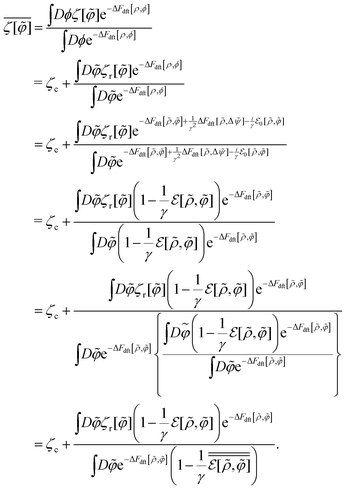 | (C8) |
Here, another averaging operation

appearing in the last line of
eqn (C8) has been introduced for representing
| |  | (C9) |
which becomes equivalent to
eqn (17) when replacing the
ϕ-field with the
φ-field; however, the notation of the above average has been altered for revealing that there is a difference between

and

as shown by the general form
(C8). We obtain from
eqn (C7) and (C9)| | 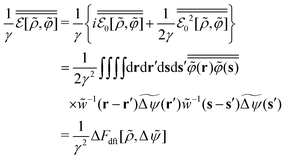 | (C10) |
because of
| |  | (C11) |
The strong-coupling approximation of the last equality in
eqn (C8) further validates that
| | 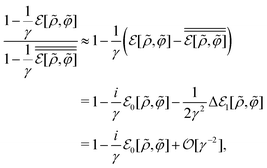 | (C12) |
where
| |  | (C13) |
Eqn (C12) implies that the above contribution

is ignored. Combining
eqn (C8) and (C12), we have
| |  | (C14) |
according to the 1/
γ expansion method. Incidentally, it follows from
eqn (C14) that
| |  | (C15) |
thereby justifying
eqn (76).
In the remaining subsections, we will evaluate eqn (74) and (82) based on the above strong-coupling approximation represented by eqn (C14).
Following the general form (C6), we classify λnon[![[small rho, Greek, tilde]](https://www.rsc.org/images/entities/i_char_e0e4.gif) ,
, ![[small variant phi, Greek, tilde]](https://www.rsc.org/images/entities/i_char_e12c.gif) ] given by eqn (73) into the
] given by eqn (73) into the ![[small variant phi, Greek, tilde]](https://www.rsc.org/images/entities/i_char_e12c.gif) -independent part ζc and the
-independent part ζc and the ![[small variant phi, Greek, tilde]](https://www.rsc.org/images/entities/i_char_e12c.gif) -dependent contribution γζ1[
-dependent contribution γζ1[![[small variant phi, Greek, tilde]](https://www.rsc.org/images/entities/i_char_e12c.gif) ]:
]:| | 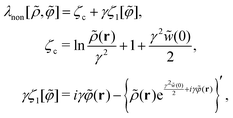 | (C16) |
where the definition of {⋯}′ is the same as that of eqn (A17). For later convenience, we also introduce an extended form of  :
:| |  | (C17) |
where a test density field m(s) is added to one-particle density ![[small rho, Greek, circumflex]](https://www.rsc.org/images/entities/i_char_e0b7.gif) 1(s) = δ(s − r) that represents a single sphere located at r. The functional differentiation of uexp[
1(s) = δ(s − r) that represents a single sphere located at r. The functional differentiation of uexp[![[small variant phi, Greek, tilde]](https://www.rsc.org/images/entities/i_char_e12c.gif) ] with respect to m(r) offers the benefit of the expression (C17):
] with respect to m(r) offers the benefit of the expression (C17):| |  | (C18) |
which is available to calculate the third term on the rhs of eqn (C14).
First, the Gaussian integration over the φ-field yields
| | 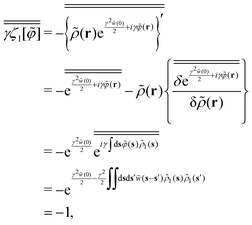 | (C19) |
because of
γ = e
γ2![[w with combining tilde]](https://www.rsc.org/images/entities/i_char_0077_0303.gif) (0)/2
(0)/2,

,

, and the similar approximation to
eqn (A19).
Next, we investigate the third term on the rhs of eqn (C14), or  . The expression (C4) of
  implies the necessity of evaluating the following contribution:
| |  | (C20) |
It follows from
eqn (C11) and (C18) that
eqn (C20) reads
| |  | (C21) |
Since we have
| |  | (C22) |
in the presence of the test field
m(
r), the relation
(C18) reads
| | 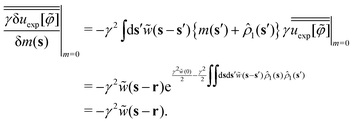 | (C23) |
This ensures that the first term on the rhs of
eqn (C21) is canceled by the second term:
| |  | (C24) |
thereby implying that
| |  | (C25) |
Thus, we find from
eqn (C14), (C16), (C19) and (C25)| | 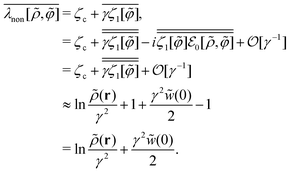 | (C26) |
The above last form is equivalent to the target expression
(74).
3. Derivation of eqn (82)
Eqn (81) reads| |  | (C27) |
where ζ1[![[small variant phi, Greek, tilde]](https://www.rsc.org/images/entities/i_char_e12c.gif) ] has been given in eqn (C16) and
] has been given in eqn (C16) and| |  | (C28) |
where the definition of {⋯}′ is the same as that of eqn (A17). The non-equilibrium chemical potential difference Δλ[ρ] is obtained from averaging  over the
 ![[small variant phi, Greek, tilde]](https://www.rsc.org/images/entities/i_char_e12c.gif) -field in a similar manner to the strong-coupling approximation adopted in eqn (C26):
-field in a similar manner to the strong-coupling approximation adopted in eqn (C26):| | 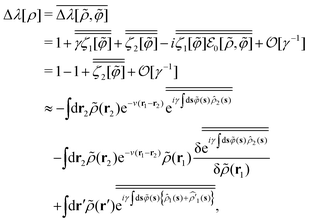 | (C29) |
where we have used the results,  and
and  , given by eqn (C19) and (C25), respectively, and
  due to the neglect of the density dependence of e−w(0) = 1/γ2 as before. It follows from the Gaussian integration when performing the averages in the last equality of eqn (C29) that
| | 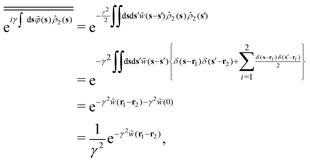 | (C30) |
| |  | (C31) |
and| | 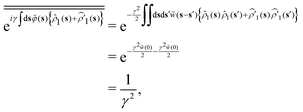 | (C32) |
respectively. In eqn (C32), it is noted that the cross terms vanish:  because the one-particle densities,
 ![[small rho, Greek, circumflex]](https://www.rsc.org/images/entities/i_char_e0b7.gif) 1(s) = δ(s−r) and
1(s) = δ(s−r) and  , represent the instantaneous densities of the target particle located at different positions of r and r′ and a single sphere is unable to simultaneously exist at different locations.
Substituting eqn (C30)–(C32) into eqn (C29), we obtain
| | 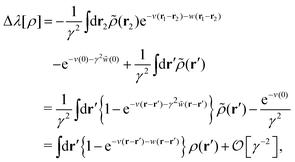 | (C33) |
hence verifying
eqn (82).
Acknowledgements
The author thanks the anonymous referees for their valuable comments and suggestions.
References
- S. Torquato, J. Chem. Phys., 2018, 149, 020901 CrossRef CAS PubMed.
- S. Torquato, Phys. Rep., 2018, 745, 1 CrossRef CAS.
- J. Kim and S. Torquato, Proc. Natl. Acad. Sci. U. S. A., 2020, 117, 8764–8774 CrossRef CAS PubMed.
- G. J. Aubry, L. S. Froufe-Pérez, U. Kuhl, O. Legrand, F. Scheffold and F. Mortessagne, Phys. Rev. Lett., 2020, 125, 127402 CrossRef CAS PubMed.
- S. Torquato and F. H. Stillinger, Phys. Rev. E: Stat., Nonlinear, Soft Matter Phys., 2003, 68, 041113 CrossRef PubMed.
- A. Donev, F. H. Stillinger and S. Torquato, Phys. Rev. Lett., 2005, 95, 090604 CrossRef PubMed.
- A. Donev, S. Torquato and F. H. Stillinger, Phys. Rev. E: Stat., Nonlinear, Soft Matter Phys., 2005, 71, 011105 CrossRef PubMed.
- S. Atkinson, F. H. Stillinger and S. Torquato, Proc. Natl. Acad. Sci. U. S. A., 2014, 52, 18436–18441 CrossRef PubMed.
- C. E. Zachary, Y. Jiao and S. Torquato, Phys. Rev. Lett., 2011, 106, 178001 CrossRef PubMed.
- C. E. Zachary, Y. Jiao and S. Torquato, Phys. Rev. E: Stat., Nonlinear, Soft Matter Phys., 2011, 83, 051308 CrossRef PubMed.
- S. Atkinson, F. H. Stillinger and S. Torquato, Phys. Rev. E: Stat., Nonlinear, Soft Matter Phys., 2013, 88, 062208 CrossRef PubMed.
- Y. Kallus and S. Torquato, Phys. Rev. E: Stat., Nonlinear, Soft Matter Phys., 2014, 90, 022114 CrossRef PubMed.
- S. Atkinson, F. H. Stillinger and S. Torquato, Phys. Rev. E, 2016, 94, 032902 CrossRef PubMed.
- S. Atkinson, G. Zhang, A. B. Hopkins and S. Torquato, Phys. Rev. E, 2016, 94, 012902 CrossRef PubMed.
- J. Kim and S. Torquato, Phys. Rev. B, 2018, 97, 054105 CrossRef CAS.
- G. Zhang and S. Torquato, Phys. Rev. E, 2020, 101, 032124 CrossRef CAS PubMed.
- S. Torquato, Phys. Rev. E, 2021, 103, 052126 CrossRef CAS PubMed.
- M. van Hecke, J. Phys.: Condens. Matter, 2009, 22, 033101 CrossRef PubMed.
- A. J. Liu and S. R. Nagel, Annu. Rev. Condens. Matter Phys., 2010, 1, 347–369 CrossRef.
- M. Müller and M. Wyart, Annu. Rev. Condens. Matter Phys., 2015, 6, 177–200 CrossRef.
- V. Lubchenko and P. G. Wolynes, J. Phys. Chem. B, 2017, 122, 3280–3295 CrossRef PubMed.
- V. Lubchenko, Adv. Phys. X, 2018, 3, 1510296 CAS.
- H. Mizuno, H. Shiba and A. Ikeda, Proc. Natl. Acad. Sci. U. S. A., 2017, 114, E9767–E9774 CrossRef CAS PubMed.
- M. Shimada, H. Mizuno, M. Wyart and A. Ikeda, Phys. Rev. E, 2018, 98, 060901 CrossRef CAS.
- H. Mizuno, M. Shimada and A. Ikeda, Phys. Rev. Res., 2020, 2, 013215 CrossRef CAS.
- H. Mizuno, H. Tong, A. Ikeda and S. Mossa, J. Chem. Phys., 2020, 153, 154501 CrossRef PubMed.
- M. Shimada, H. Mizuno and A. Ikeda, Soft Matter, 2020, 16, 7279–7288 RSC.
- E. Lerner, G. Düring and M. Wyart, Soft Matter, 2013, 9, 8252–8263 RSC.
- E. Lerner, G. Düring and E. Bouchbinder, Phys. Rev. Lett., 2016, 117, 035501 CrossRef PubMed.
- D. Richard, K. González-López, G. Kapteijns, R. Pater, T. Vaknin, E. Bouchbinder and E. Lerner, Phys. Rev. Lett., 2020, 125, 085502 CrossRef CAS PubMed.
- A. Moriel, Y. Lubomirsky, E. Lerner and E. Bouchbinder, Phys. Rev. E, 2020, 102, 033008 CrossRef CAS PubMed.
- C. Rainone, E. Bouchbinder and E. Lerner, Proc. Natl. Acad. Sci. U. S. A., 2020, 117, 5228–5234 CrossRef CAS PubMed.
- C. Rainone, P. Urbani, F. Zamponi, E. Lerner and E. Bouchbinder, SciPost Phys., 2021, 4, 008 CrossRef.
- L. Berthier, P. Charbonneau, Y. Jin, G. Parisi, B. Seoane and F. Zamponi, Proc. Natl. Acad. Sci. U. S. A., 2016, 113, 8397–8401 CrossRef CAS PubMed.
- L. Wang, A. Ninarello, P. Guan, L. Berthier, G. Szamel and E. Flenner, Nat. Commun., 2019, 10, 1–7 CrossRef PubMed.
- L. Berthier, G. Biroli, P. Charbonneau, E. I. Corwin, S. Franz and F. Zamponi, J. Chem. Phys., 2019, 151, 010901 CrossRef PubMed.
- X. Tan, Y. Guo, D. Huang and L. Zhang, Soft Matter, 2021, 17, 1330–1336 RSC.
- M. Ozawa, L. Berthier and D. Coslovich, SciPost Phys., 2017, 3, 027 CrossRef.
- A. T. Chieco, M. Zu, A. J. Liu, N. Xu and D. J. Durian, Phys. Rev. E, 2018, 98, 042606 CrossRef CAS.
- L. E. Silbert and M. Silbert, Phys. Rev. E: Stat., Nonlinear, Soft Matter Phys., 2009, 80, 041304 CrossRef PubMed.
- Y. Wu, P. Olsson and S. Teitel, Phys. Rev. E: Stat., Nonlinear, Soft Matter Phys., 2015, 92, 052206 CrossRef PubMed.
- A. Ikeda and L. Berthier, Phys. Rev. E: Stat., Nonlinear, Soft Matter Phys., 2015, 92, 012309 CrossRef PubMed.
- A. Ikeda, L. Berthier and G. Parisi, Phys. Rev. E, 2017, 95, 052125 CrossRef PubMed.
- M. te Vrugt, H. Löwen and R. Wittkowski, Adv. Phys., 2020, 69, 121–247 CrossRef.
- D. S. Dean, J. Phys. A: Math. Gen., 1996, 29, L613 CrossRef CAS.
- T. Leonard, B. Lander, U. Seifert and T. Speck, J. Chem. Phys., 2013, 139, 204109 CrossRef CAS PubMed.
- B. Kim, K. Kawasaki, H. Jacquin and F. van Wijland, Phys. Rev. E: Stat., Nonlinear, Soft Matter Phys., 2014, 89, 012150 CrossRef PubMed.
- H. Jacquin, B. Kim, K. Kawasaki and F. van Wijland, Phys. Rev. E: Stat., Nonlinear, Soft Matter Phys., 2015, 91, 022130 CrossRef PubMed.
- N. Bidhoodi and S. P. Das, Phys. Rev. E: Stat., Nonlinear, Soft Matter Phys., 2015, 92, 012325 CrossRef PubMed.
- D. S. Dean, B. S. Lu, A. C. Maggs and R. Podgornik, Phys. Rev. Lett., 2016, 116, 240602 CrossRef PubMed.
- V. Démery and D. S. Dean, J. Stat. Mech.: Theo. Exp., 2016, 023106 CrossRef.
- M. Krüger and D. S. Dean, J. Chem. Phys., 2017, 146, 134507 CrossRef PubMed.
- J. F. Lutsko, Sci. Adv., 2019, 5, eaav7399 CrossRef CAS PubMed.
- H. Frusawa, J. Phys. A: Math. Theo., 2019, 52, 065003 CrossRef CAS.
- H. Frusawa, Entropy, 2020, 22, 34 CrossRef PubMed.
- S. Mahdisoltani and R. Golestanian, Phys. Rev. Lett., 2021, 126, 158002 CrossRef CAS PubMed.
- T. V. Ramakrishnan and M. Yussouff, Phys. Rev. B: Condens. Matter Mater. Phys., 1979, 19, 2775 CrossRef CAS.
- R. Evans, Adv. Phys., 1979, 28, 143–200 CrossRef CAS.
- Y. Singh, Phys. Rep., 1991, 207, 351–444 CrossRef CAS.
- C. N. Likos, Phys. Rep., 2001, 348, 267–439 CrossRef CAS.
- J. F. Lutsko, Adv. Chem. Phys., 2010, 144, 1 CAS.
- Y. Singh, J. P. Stoessel and P. G. Wolynes, Phys. Rev. Lett., 1985, 54, 1059 CrossRef CAS PubMed.
- M. Baus and J. L. Colot, J. Phys. C: Solid State Phys., 1986, 19, L135 CrossRef.
- R. W. Hall and P. G. Wolynes, J. Chem. Phys., 1987, 86, 2943–2948 CrossRef CAS.
- C. Dasgupta, Europhys. Lett., 1992, 20, 131 CrossRef CAS.
- R. K. Murarka and B. Bagchi, J. Chem. Phys., 2001, 115, 5513–5520 CrossRef CAS.
- C. Kaur and S. P. Das, Phys. Rev. Lett., 2001, 86, 2062 CrossRef CAS PubMed.
- K. Kim and T. Munakata, Phys. Rev. E: Stat., Nonlinear, Soft Matter Phys., 2003, 68, 021502 CrossRef PubMed.
- P. Chaudhuri, S. Karmakar, C. Dasgupta, H. R. Krishnamurthy and A. K. Sood, Phys. Rev. Lett., 2005, 95, 248301 CrossRef PubMed.
- P. Chaudhuri, S. Karmakar and C. Dasgupta, Phys. Rev. Lett., 2005, 100, 125701 CrossRef.
- B. S. Gupta, L. Premkumar and S. P. Das, Phys. Rev. E: Stat., Nonlinear, Soft Matter Phys., 2012, 85, 051501 CrossRef PubMed.
- L. Premkumar, N. Bidhoodi and S. P. Das, J. Chem. Phys., 2001, 144, 124511 CrossRef.
- T. Odagaki, J. Phys. Soc. Jpn., 2017, 86, 082001 CrossRef.
- A. Mondal and S. P. Das, Prog. Theor. Exp. Phys., 2020, 073I02 CrossRef CAS.
- R. P. Behringer and B. Chakraborty, Rep. Prog. Phys., 2018, 82, 012601 CrossRef PubMed.
- A. Baule, F. Morone, H. J. Herrmann and H. A. Makse, Rev. Mod. Phys., 2018, 90, 015006 CrossRef CAS.
- P. Charbonneau, E. I. Corwin, G. Parisi and F. Zamponi, Phys. Rev. Lett., 2015, 114, 125504 CrossRef PubMed.
- S. Franz, G. Parisi, P. Urbani and F. Zamponi, Proc. Natl. Acad. Sci. U. S. A., 2015, 112, 14539–14544 CrossRef CAS PubMed.
- P. Charbonneau, E. I. Corwin, G. Parisi, A. Poncet and F. Zamponi, Phys. Rev. Lett., 2016, 117, 045503 CrossRef PubMed.
- D. Hexner, A. J. Liu and S. R. Nagel, Phys. Rev. E, 2018, 97, 063001 CrossRef PubMed.
- S. Franz, A. Sclocchi and P. Urbani, SciPost Phys., 2020, 9, 012 CrossRef.
- P. Charbonneau, E. I. Corwin, R. C. Dennis, R. D. H. Rojas, H. Ikeda, G. Parisi and F. Ricci-Tersenghi, Phys. Rev. E, 2021, 104, 014102 CrossRef CAS PubMed.
-
S. A. Ridout, J. W. Rocks and A. J. Liu, 2020, arXiv preprint, arXiv:2011.13049.
- P. Charbonneau, E. I. Corwin, G. Parisi and F. Zamponi, Phys. Rev. Lett., 2012, 109, 205501 CrossRef PubMed.
- P. Charbonneau, J. Kurchan, G. Parisi, P. Urbani and F. Zamponi, Nat. Commun., 2014, 5, 1–6 Search PubMed.
- Q. Liao and L. Berthier, Phys. Rev. X, 2019, 9, 011049 CAS.
- C. Artiaco, P. Baldan and G. Parisi, Phys. Rev. E, 2020, 101, 052605 CrossRef CAS PubMed.
- F. H. Stillinger, P. G. Debenedetti and S. Sastry, J. Chem. Phys., 1998, 109, 3983–3988 CrossRef CAS.
- P. G. Debenedetti and F. H. Stillinger, Nature, 2001, 410, 259–267 CrossRef CAS PubMed.
- A. Heuer, J. Phys.: Condens. Matter, 2008, 20, 373101 CrossRef PubMed.
- M. D. Ediger and P. Harrowell, J. Chem. Phys., 2012, 137, 080901 CrossRef CAS PubMed.
-
H. Frusawa, J. Stat. Mech.: Theo. Exp., 2021, 013213 Search PubMed.
- D. Henderson, Condens. Matter Phys., 2009, 12, 127 CrossRef CAS.
- D. Frydel and M. Ma, Phys. Rev. E, 2016, 93, 062112 CrossRef PubMed.
- H. Frusawa, Phys. Rev. E, 2020, 101, 012121 CrossRef CAS PubMed.
- R. R. Netz, Eur. Phys. J. E: Soft Matter Biol. Phys., 2001, 5, 557 CrossRef CAS.
- A. Gabrielli, Phys. Rev. E: Stat., Nonlinear, Soft Matter Phys., 2004, 70, 066131 CrossRef PubMed.
- J. N. Nampoothiri, Y. Wang, K. Ramola, J. Zhang, S. Bhattacharjee and B Chakraborty, Phys. Rev. Lett., 2020, 125, 118002 CrossRef CAS PubMed.
- H. Tong, S. Sengupta and H. Tanaka, Nat. Commun., 2020, 11, 1–10 Search PubMed.
- E. Lerner, J. Chem. Phys., 2020, 153, 216101 CrossRef CAS PubMed.
-
M. Shimada and E. De Giuli, 2020, arXiv preprint, arXiv:2008.11896.
- D. Hexner, A. J. Liu and S. R. Nagel, Phys. Rev. Lett., 2018, 121, 115501 CrossRef CAS PubMed.
- P. Rissone, E. I. Corwin and G Parisi, Phys. Rev. Lett., 2021, 127, 038001 CrossRef CAS PubMed.
- H. Frusawa and R. Hayakawa, J. Phys. A: Math. Gen., 2000, 33, L155 CrossRef.
|
| This journal is © The Royal Society of Chemistry 2021 |
Click here to see how this site uses Cookies. View our privacy policy here.  Open Access Article


 is represented by the hybrid form using the functional and configurational integrals (Section IIIA). Next, we introduce the non-equilibrium excess chemical potential appearing in the stochastic DFT equation (Section IIIB). Third, the metastable state is defined based on stochastic DFT (Section IIIC). Last, the metastable DCF c*(r) is generated from the metastable chemical potential λ*, thereby yielding S*(0) expressed by c*(r) (Section IIID).
 in connection with the Fokker–Planck equation
 be the instantaneous microscopic density of an N-particle system where the position ri(t) at time t represents an instantaneous location of the i-th particle. The corresponding distribution functional P[ρ, t] of the density field ρ(r, t) is defined by
 signifies the noise-averaging operation for
  in the overdamped dynamics.
 of a given density field ρ(r, t):
 by introducing a fluctuating potential field ϕ as follows (see Appendix A for the derivation of eqn (10)–(13)):


 , μ denotes the equilibrium chemical potential, v(r) is the original interaction potential including the hard sphere potential and Lennard-Jones potential, and Ω[ψ] is the grand potential in the presence of an external field ψ(r). Here it is noted that all the energetic quantities used in this study (e.g., μ, v(r) and Ω[ψ]) are given in kBT-unit.
 .54,55,92 Also, the functional F[ρ, ϕ ≡ 0] in the absence of the ϕ-field corresponds to the intrinsic Helmholtz free energy in the presence of the external field ψdft(r). Therefore, the following relation holds:


 can be expressed as
  using the bare diffusion constant
  and the vectorial white noise field
  defined by the correlation 〈ηl(r, t)ηm(r′, t′)〉 = δlmδ(r − r′)δ(t − t′), and λex[ρ] will be referred to as the non-equilibrium excess chemical potential.


 and is reduced to the chemical potential μ when considering equilibrium DFT (see Section IIIC).


 , following the above-mentioned Gaussian approximation, whereas the strong-coupling approximation developed for the evaluation of F[ρ, ϕ] will be presented in Section VII.


 determined by equilibrium DFT with the deterministic DFT equation (eqn (29)). In the absence of the external field (i.e., ψdft ≡ 0), eqn (13) reduces to the metastability condition for equilibrium DFT:
 becomes equal to the intrinsic Helmholtz free energy defined in equilibrium. Correspondingly, eqn (27) leads to
 :
:
 , as mentioned above.
 because the rhs of eqn (29) vanishes due to
  . On the other hand, the stochastic DFT equation (eqn (14)) for
  becomes
 is not a steady-state distribution in terms of stochastic DFT.
 :
:


 determined by eqn (30). It follows that the metastable structure factor S*(k) reads
 . Then, we obtain from eqn (26) and (30)


![[r with combining tilde]](https://www.rsc.org/images/entities/i_char_0072_0303.gif) ≡ r/σ. Eqn (54) meets the above-mentioned non-hyperuniformity requirements given by eqn (43) with
≡ r/σ. Eqn (54) meets the above-mentioned non-hyperuniformity requirements given by eqn (43) with  .
.
![[r with combining tilde]](https://www.rsc.org/images/entities/i_char_0072_0303.gif) -dependencies of −c(r) and −c*(r) for the repulsive harmonic potential given by
-dependencies of −c(r) and −c*(r) for the repulsive harmonic potential given by![[r with combining tilde]](https://www.rsc.org/images/entities/i_char_0072_0303.gif) )2Θ(1 −
)2Θ(1 − ![[r with combining tilde]](https://www.rsc.org/images/entities/i_char_0072_0303.gif) ),
),
 due to the isostaticity, a significant negative contribution to −c(r) at
 ![[r with combining tilde]](https://www.rsc.org/images/entities/i_char_0072_0303.gif) = 1.13
= 1.13


 being in a reasonable range of 0 ≤ b < 1.

![[r with combining tilde]](https://www.rsc.org/images/entities/i_char_0072_0303.gif)
![[thin space (1/6-em)]](https://www.rsc.org/images/entities/char_2009.gif) (
(![[r with combining tilde]](https://www.rsc.org/images/entities/i_char_0072_0303.gif) < 1) has been verified for the present hyperuniform hard sphere systems.13 Accordingly, the divergent behavior of the hyperuniform DCF −c(0) at zero-separation ensures the hyperuniform relation (3): the relation, 1/S(0) ≈ −c(0) > 104, holds even when β ∼ 10−1 and Lc/σ ∼ 101, which is exactly the hyperuniform state of the type-H2 in Table 1.
< 1) has been verified for the present hyperuniform hard sphere systems.13 Accordingly, the divergent behavior of the hyperuniform DCF −c(0) at zero-separation ensures the hyperuniform relation (3): the relation, 1/S(0) ≈ −c(0) > 104, holds even when β ∼ 10−1 and Lc/σ ∼ 101, which is exactly the hyperuniform state of the type-H2 in Table 1.![[w with combining tilde]](https://www.rsc.org/images/entities/i_char_0077_0303.gif) (r) using a coupling constant γ:
(r) using a coupling constant γ:
![[small rho, Greek, tilde]](https://www.rsc.org/images/entities/i_char_e0e4.gif) ,
, ![[small phi, Greek, tilde]](https://www.rsc.org/images/entities/i_char_e0e2.gif) ] ∼ γ0,
] ∼ γ0,![[small rho, Greek, tilde]](https://www.rsc.org/images/entities/i_char_e0e4.gif) ,
, ![[small phi, Greek, tilde]](https://www.rsc.org/images/entities/i_char_e0e2.gif) ] ∼ γ0, whereas criterion 2 is equivalent to the Ornstein–Zernike equation58–61 for rescaled correlation functions,
] ∼ γ0, whereas criterion 2 is equivalent to the Ornstein–Zernike equation58–61 for rescaled correlation functions, ![[c with combining tilde]](https://www.rsc.org/images/entities/i_char_0063_0303.gif) (r) and
(r) and ![[h with combining tilde]](https://www.rsc.org/images/entities/i_char_0068_0303.gif) (r), that should be defined to satisfy
(r), that should be defined to satisfy
![[w with combining tilde]](https://www.rsc.org/images/entities/i_char_0077_0303.gif) −1(r − r′) =
−1(r − r′) = ![[small rho, Greek, tilde]](https://www.rsc.org/images/entities/i_char_e0e4.gif) (r){δ(r − r′) +
(r){δ(r − r′) + ![[h with combining tilde]](https://www.rsc.org/images/entities/i_char_0068_0303.gif) (r − r′)
(r − r′)![[small rho, Greek, tilde]](https://www.rsc.org/images/entities/i_char_e0e4.gif) (r′)},
(r′)},![[small phi, Greek, tilde]](https://www.rsc.org/images/entities/i_char_e0e2.gif) (r).
(r).

![[small rho, Greek, tilde]](https://www.rsc.org/images/entities/i_char_e0e4.gif) , 0] of the Ramakrishnan–Yussouff free energy functional (26) is
, 0] of the Ramakrishnan–Yussouff free energy functional (26) is
 and
and  . Comparison between the rescaled functionals, eqn (64) and (65), suggests that the
 ![[small rho, Greek, tilde]](https://www.rsc.org/images/entities/char_e0e4.gif) -dependent terms can be treated perturbatively at strong coupling (γ ≫ 1).
-dependent terms can be treated perturbatively at strong coupling (γ ≫ 1).


 . Moreover, eqn (28), (67) and (69) are arranged to give


![[small rho, Greek, tilde]](https://www.rsc.org/images/entities/char_e0e4.gif) ,
, ![[small variant phi, Greek, tilde]](https://www.rsc.org/images/entities/i_char_e12c.gif) ] over the ϕ-field based on the original definition in addition to relation (68). In the strong-coupling approximation, we obtain from eqn (73)
] over the ϕ-field based on the original definition in addition to relation (68). In the strong-coupling approximation, we obtain from eqn (73)


![[small rho, Greek, circumflex]](https://www.rsc.org/images/entities/i_char_e0b7.gif) 1(s) = δ(s − r) and
1(s) = δ(s − r) and  , for making a distinction between the first and the second terms on the rhs of eqn (79).


![[small rho, Greek, circumflex]](https://www.rsc.org/images/entities/i_char_e0b7.gif) 1(s) = δ(s − r) and
1(s) = δ(s − r) and  , are unable to coexist at the same time by definition; see Appendix C for detailed and more precise discussions regarding the derivation of eqn (82). We obtain from eqn (74) and (82)


 has been used in eqn (84). Combining Eqn (84) with eqn (85) leads to the linearized Dean–Kawasaki equation as follows:
 appearing in the metastability eqn (34) represents the free-energy functional of the given density distribution ρ(r), instead of the equilibrium free-energy functional F[ρ, 0]. It is a clear advantage over equilibrium DFT that stochastic DFT can make use of the field-theoretic formulation in obtaining
  .
. should yield a spatially constant
  , which has been referred to as the metastable excess chemical potential. The sum of
  and the Lagrange multiplier λN corresponds to the metastable chemical potential and is reduced to the equilibrium chemical potential (i.e.,
  ) when
  and λN = μ in equilibrium; see also the discussion after eqn (32).
 , shown in blue, satisfies eqn (3) for the inverse of the zero-wavevector structure factor 1/S*(0), whereas the non-hyperuniform range of density distribution ρ*(r), shown in orange, satisfies eqn (2). As summarized in Fig. 3, the equilibrium DFT and stochastic DFT in the Gaussian approximation provide hyperunifomity, whereas the stochastic DFT in the strong-coupling approximation provides non-hyperuniformity.


 of a given density ρ because we consider the overdamped dynamics of the densely packed sphere system with the total number N of spheres being fixed. Hence,
  is defined using the configurational integral for the canonical ensemble as follows:
 with the help of the contour integral over a complex variable z = eμ:54,104
 .
.


![[small rho, Greek, circumflex]](https://www.rsc.org/images/entities/i_char_e0b7.gif) N(r)〉eq, the saddle-point eqn (A6) implies that
N(r)〉eq, the saddle-point eqn (A6) implies that![[small rho, Greek, circumflex]](https://www.rsc.org/images/entities/i_char_e0b7.gif) N(r)〉eq = ρ(r).
N(r)〉eq = ρ(r).


 on both sides of eqn (B1), we have


![[r with combining tilde]](https://www.rsc.org/images/entities/i_char_0072_0303.gif) = r/σ > 1, combining eqn (52) and (56) provides
= r/σ > 1, combining eqn (52) and (56) provides


![[r with combining tilde]](https://www.rsc.org/images/entities/i_char_0072_0303.gif) to x = 1/
to x = 1/![[r with combining tilde]](https://www.rsc.org/images/entities/i_char_0072_0303.gif) gives
gives


 for the hyperuniform correlation function h(r):
 for the hyperuniform structure factor S(0) at zero wavevector, and it is supposed that w(0) is the position-independent function because of the neglect of the triplet DCF (see also the statement after eqn (48)).
![[small variant phi, Greek, tilde]](https://www.rsc.org/images/entities/i_char_e12c.gif) ] be the general functional given by the sum of the
] be the general functional given by the sum of the ![[small variant phi, Greek, tilde]](https://www.rsc.org/images/entities/i_char_e12c.gif) -independent part ζc and the remaining
-independent part ζc and the remaining ![[small variant phi, Greek, tilde]](https://www.rsc.org/images/entities/i_char_e12c.gif) -dependent contribution ζr[
-dependent contribution ζr[![[small variant phi, Greek, tilde]](https://www.rsc.org/images/entities/i_char_e12c.gif) ]:
]:![[small variant phi, Greek, tilde]](https://www.rsc.org/images/entities/i_char_e12c.gif) ] = ζc + ζr[
] = ζc + ζr[![[small variant phi, Greek, tilde]](https://www.rsc.org/images/entities/i_char_e12c.gif) ].
].
 that is averaged over the ϕ-field, instead of the
 ![[small variant phi, Greek, tilde]](https://www.rsc.org/images/entities/i_char_e12c.gif) -field, based on the definition of eqn (17) as follows:
-field, based on the definition of eqn (17) as follows:
 appearing in the last line of eqn (C8) has been introduced for representing
 and
and  as shown by the general form (C8). We obtain from eqn (C7) and (C9)


 is ignored. Combining eqn (C8) and (C12), we have

![[small rho, Greek, tilde]](https://www.rsc.org/images/entities/i_char_e0e4.gif) ,
, ![[small variant phi, Greek, tilde]](https://www.rsc.org/images/entities/i_char_e12c.gif) ] given by eqn (73) into the
] given by eqn (73) into the ![[small variant phi, Greek, tilde]](https://www.rsc.org/images/entities/i_char_e12c.gif) -independent part ζc and the
-independent part ζc and the ![[small variant phi, Greek, tilde]](https://www.rsc.org/images/entities/i_char_e12c.gif) -dependent contribution γζ1[
-dependent contribution γζ1[![[small variant phi, Greek, tilde]](https://www.rsc.org/images/entities/i_char_e12c.gif) ]:
]:
 :
:
![[small rho, Greek, circumflex]](https://www.rsc.org/images/entities/i_char_e0b7.gif) 1(s) = δ(s − r) that represents a single sphere located at r. The functional differentiation of uexp[
1(s) = δ(s − r) that represents a single sphere located at r. The functional differentiation of uexp[![[small variant phi, Greek, tilde]](https://www.rsc.org/images/entities/i_char_e12c.gif) ] with respect to m(r) offers the benefit of the expression (C17):
] with respect to m(r) offers the benefit of the expression (C17):

![[w with combining tilde]](https://www.rsc.org/images/entities/i_char_0077_0303.gif) (0)/2,
(0)/2,  ,
,  , and the similar approximation to eqn (A19).
 . The expression (C4) of
  implies the necessity of evaluating the following contribution:


![[small variant phi, Greek, tilde]](https://www.rsc.org/images/entities/i_char_e12c.gif) ] has been given in eqn (C16) and
] has been given in eqn (C16) and
 over the
 ![[small variant phi, Greek, tilde]](https://www.rsc.org/images/entities/i_char_e12c.gif) -field in a similar manner to the strong-coupling approximation adopted in eqn (C26):
-field in a similar manner to the strong-coupling approximation adopted in eqn (C26):
 and
and  , given by eqn (C19) and (C25), respectively, and
  due to the neglect of the density dependence of e−w(0) = 1/γ2 as before. It follows from the Gaussian integration when performing the averages in the last equality of eqn (C29) that


 because the one-particle densities,
 ![[small rho, Greek, circumflex]](https://www.rsc.org/images/entities/i_char_e0b7.gif) 1(s) = δ(s−r) and
1(s) = δ(s−r) and  , represent the instantaneous densities of the target particle located at different positions of r and r′ and a single sphere is unable to simultaneously exist at different locations.


